Article

Landscape Microzones within Thermokarst Depressions of Central Yakutia under Present Climatic Conditions

1
Institute for Biological Problems of Cryolithozone, Siberian Branch, Russian Academy of Science, Yakutsk 677980, Russia
2
Melnikov Permafrost Institute, Siberian branch, Russian Academy of Science, Yakutsk 677010, Russia
3
Faculty of Bioresource Sciences, Akita prefectural university, 241-438 AzaKaidobata-Nishi, Shimoshinjo Nakano, Akita 010-0195, Japan
*
Author to whom correspondence should be addressed.
Geosciences 2018, 8(12), 439; https://doi.org/10.3390/geosciences8120439
Submission received: 31 October 2018 / Revised: 22 November 2018 / Accepted: 23 November 2018 / Published: 27 November 2018
(This article belongs to the Special Issue Permafrost Landscapes: Classification and Mapping)

Abstract

:
Thermokarst (alas) of Central Yakutia is an intrazonal dynamic landscape in the form of rounded depressions with peculiar soils and meadow vegetation, microclimate, and fauna that are very different from the surrounding typical taiga landscapes. During the formation of alas depression, complete processing of thawed ground with the formation of new soils occurs and entirely changes the biogeochemical cycle. Because this system is closed, all water-soluble substances, such as N/C and soluble salts, etc., accumulate inside the depression. Using standard methods and instruments, we measured the main properties of alas soils. Depending on the hydrothermal and physicochemical regimes, thawing depth, and greenhouse gas (GHG) flux, three main belts of soils and vegetation were distinguished within the alas: (1) steppe meadow, located on most elevated places, not sufficiently moistened, with alas steppe soils and steppe vegetation; (2) middle meadow, located lower than stepped meadow in elevation, normally moist, with alas sod-meadow soils and highest productivity vegetation; and (3) wet meadow, located around the lake, excessively moistened, with alas marshy sod-meadow soils and marsh vegetation. Therefore, the soils of wet and real meadows, due to the abundance of organic matter, are significant sources of CO2 and CH4, especially in humid years. Under the climate warming observed over recent decades in this territory, the alas ecosystem has undergone considerable change. Thus, the classification and mapping of belts within the alas can have both applied and fundamental importance.

1. Introduction

The cryolithozone occupies about 25% of the terrestrial area on the Northern Hemisphere, and about 60% of it is in Russia [1,2]. Changes in permafrost have important implications for natural ecosystems. Permafrost degradation due to thermokarst processes may lead to a drastic disturbance of terrain and transformation of the existing landforms. Fluctuation of climatic conditions during the early Holocene led to thermokarst degradation of the ice complex in Central Yakutia, which changed the Taiga boreal forest typical of this region to negative forms of relief [3]. This thermokarst degradation process had four stages with the appearance of melting ice water, forming a stable dried thermokarst depression called alas. During alas formation, primary changes occur with soil cover, expressed in the mixing of existing and formation of new horizons. After the formation of depression, it undergoes a continuous process of soil formation with the participation of fluctuating lake and grassy vegetation cover.
Alas soil formation has two stages: hydromorphous and xeromorphous. During the hydromorphous stage, residues of plankton and benthos accumulate on the bottom of thermokarst lakes, and organic and organic-mineral deposits, i.e., sapropels, are generated. At the time of gradual drying of the alas lake, on the lowest places of thermokarst depression there is gleying of soil accompanied by accumulation of large amounts of organic matter in the form of lake deposits and turf [4,5,6].
The second (xeromorphous) stage of formation is characterized by an accumulation of phytogenic organic matter in the soil structure [4,5,7,8,9]. At this stage, due to meadow vegetation on the place of dried alas lake areas, sod and humus accumulate in the soil. Fast dynamics of thermokarst depression relief promote redeposition of grounds and occurrence of buried humus, peat, and sapropelic horizons in the soil structure [6,10,11]. As a result, stocks of C in alas soils considerably exceed the content of C in surrounding boreal Taiga forest soils [7,12]. Carbon stocks in alas soils are 7–10 times larger than those in Taiga forest soils [13].
One important feedback from sustained warming in high-latitude ecosystems is the thawing of permafrost soils and the release of soil C to the atmosphere by microbial organic matter decomposition as carbon dioxide (CO2) and methane (CH4) [14,15,16,17], or by leaching out as dissolved organic C [18,19]. The soil organic matter is among the largest global reservoirs, exchanging C with the atmosphere at time scales ranging from a few years to several hundred years [20]. This pool of soil C, protected by cold and waterlogged conditions, is thought to be highly susceptible to changes in temperature and permafrost thawing. Therefore, a huge C stock in the thermokarst depression in Central Yakutia may become a latent risk of large C emission to the atmosphere in the future global warming scenario [21].
The Central Yakutia region is a well-known example of thermokarst terrain [22]. Around 16,000 alases are in the Central Yakutia lowland, with a total area of 440,000 ha, which is 17% of the total land area of Central Yakutia [3]. Thus, a detailed study of all processes that go on inside alas depressions seems to be important for understanding this environment.
Alas depression surface is characterized by a belt structure, which is created by changing of all properties according to the distance from the lake to the periphery of the alas. Depending on topography and the degree of soil hydrothermal and chemical regimes, it has a structure of concentric belts of various shapes located within each other. The first division of alas surface into belts was made by Soviet geobotanists in the 1950s and 1960s [23,24,25]. Elovskaya in 1958, based on the works of geobotanists, found that Puccinellia tenuiflora is the main indicator of soil salinization in an alas ecosystem [26]. In 1970, Egorov proved that this species is an indicator of chloride and sodium carbonate salinization [27]. Thus, the main purpose of this work is to show the distribution of soil properties, vegetation cover, and greenhouse gas (GHG) emission inside the thermokarst depression of Central Yakutia in belt microzones.

2. Materials and Methods
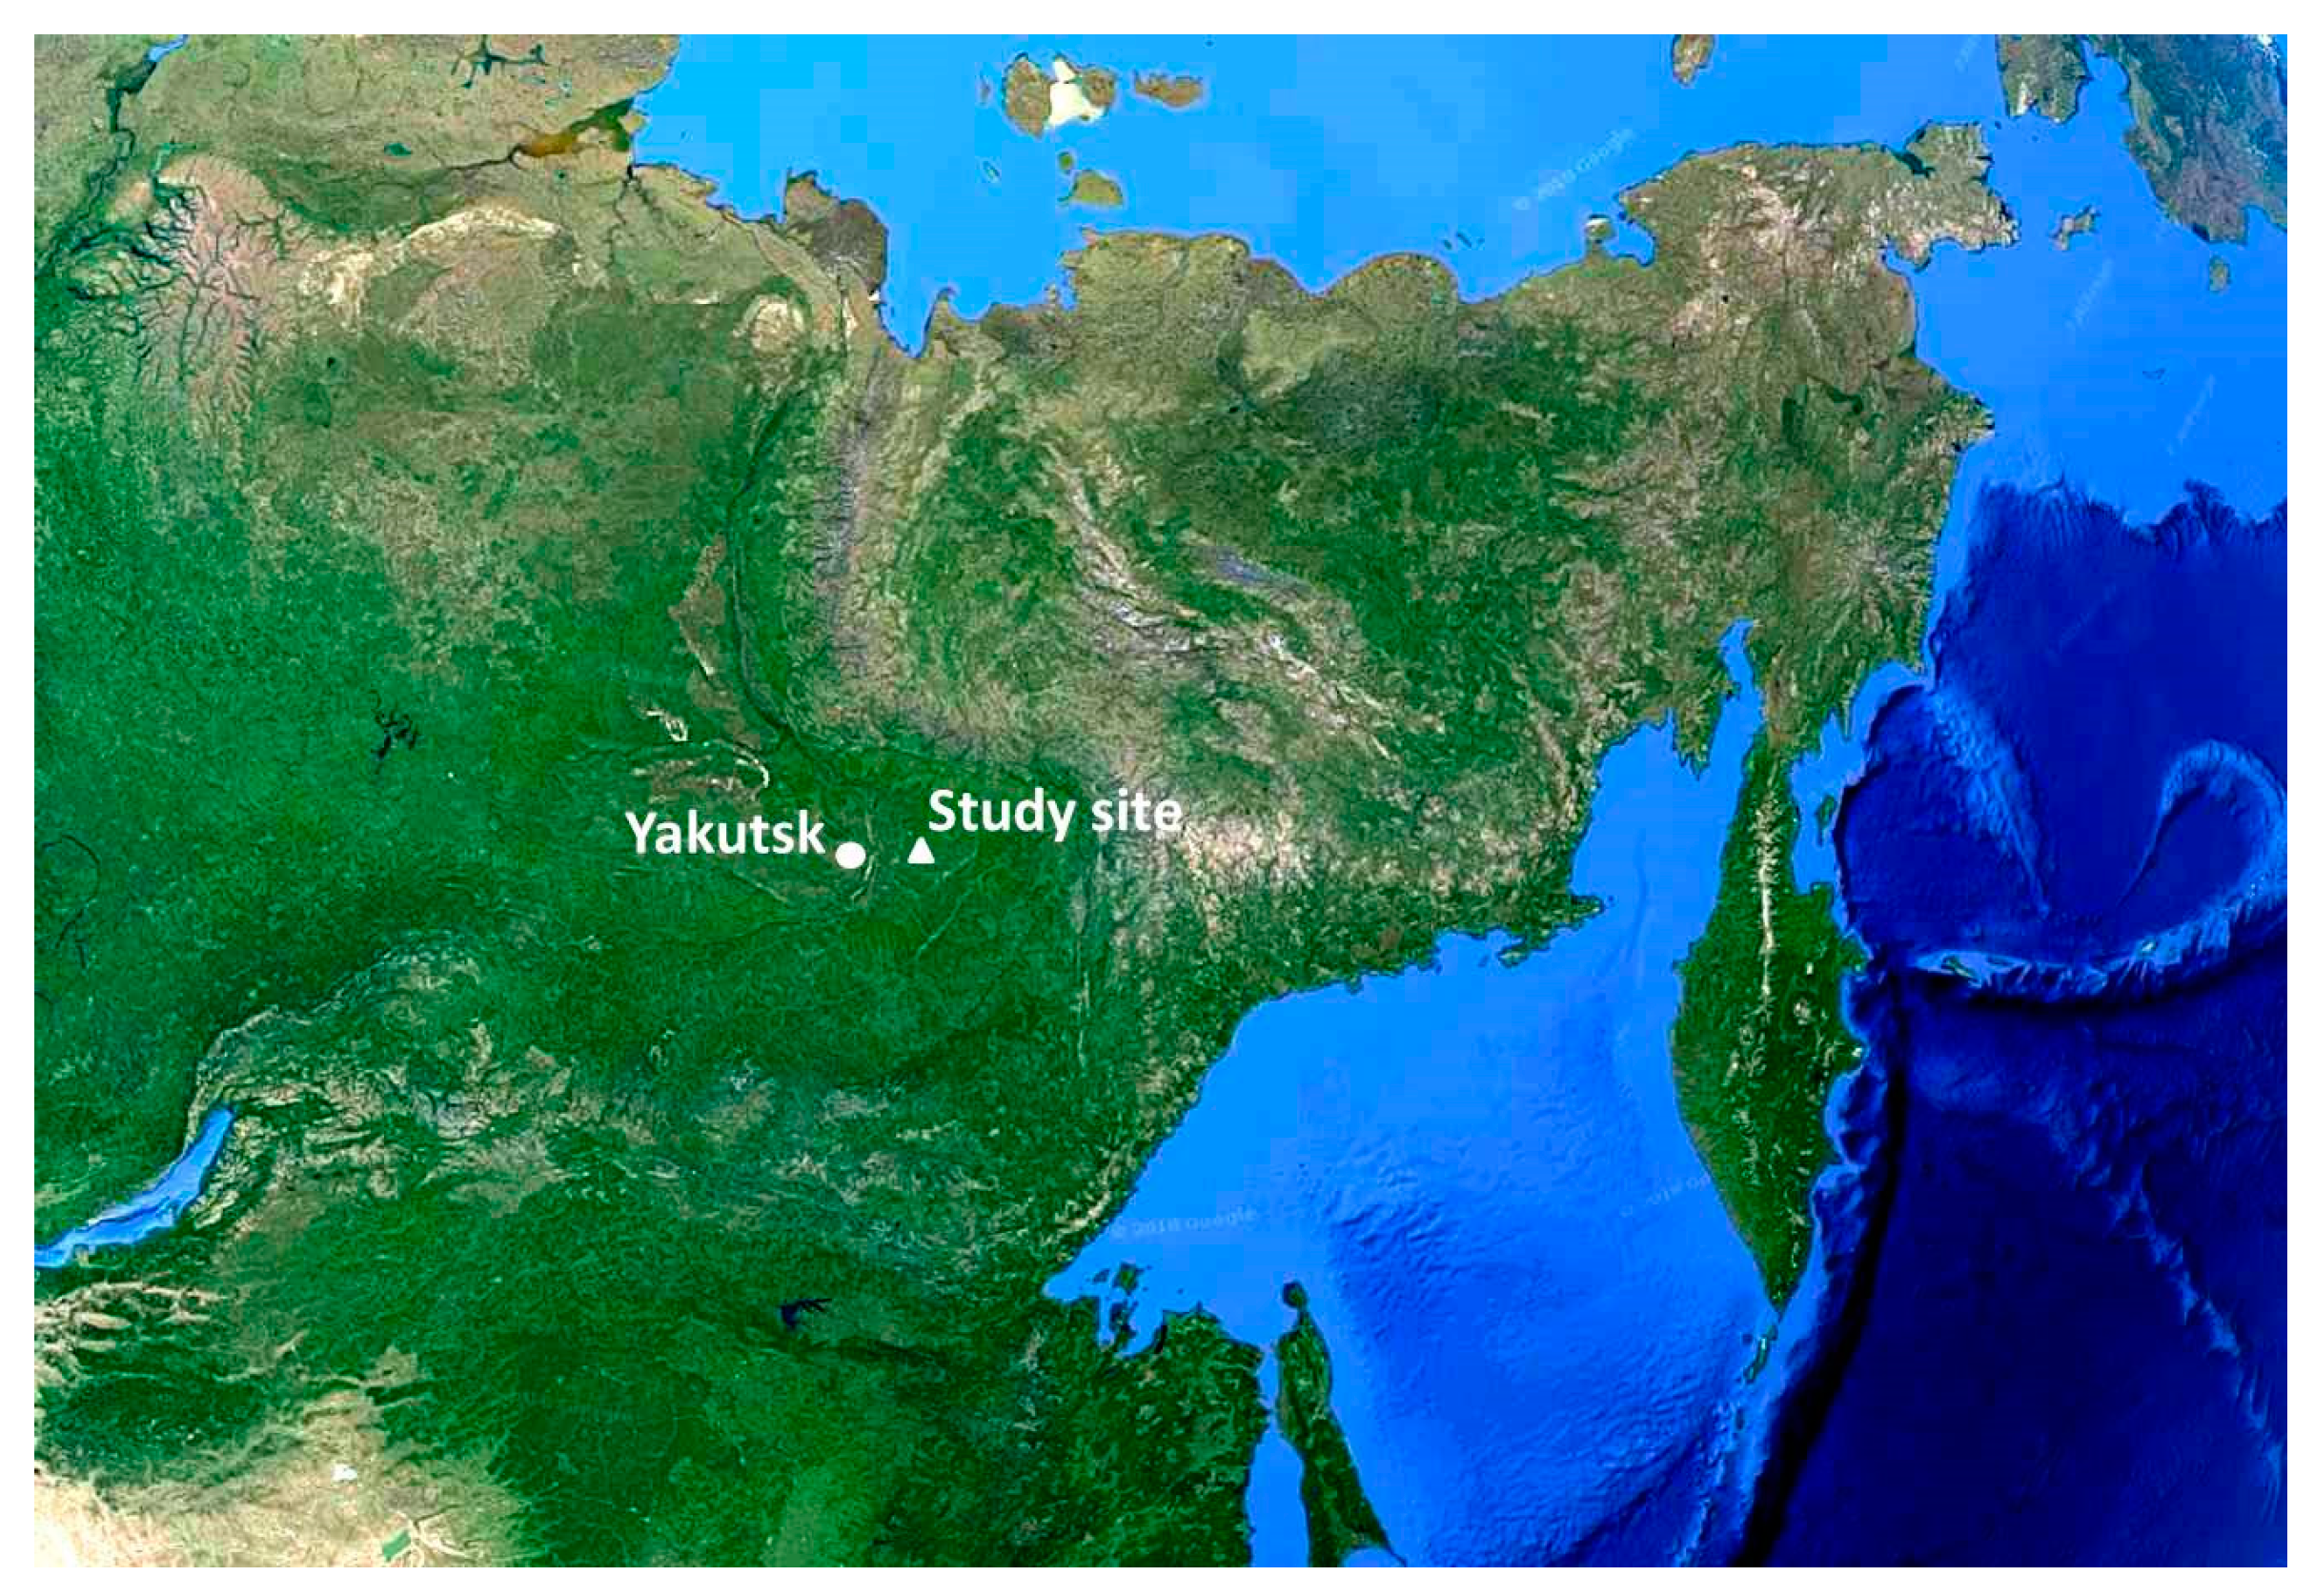
2.1. Study Site

The study area is in Central Yakutia between the Lena and Amga Rivers, 50 km east of Yakutsk city (Figure 1). One typical mature alas was chosen for a detailed long-term study (1990–2016) of ecosystem properties. Three belts with different conditions (soil, thawing depth, moisture, chemistry, vegetation, and GHG emission) were observed. The location of the dry belt is higher by 1 m from the wet belt on the alas bottom topography, but this value is not constant and depends on lake fluctuation. Dividing dry, middle, and wet belts was done by the method of indicative vegetation (accuracy ±1 m).
The climate of Central Yakutia is extra continental, characterized by severe, dry winters and hot summers [28]. Average annual temperature has been −9.65 °C over the last 100 years, and annual precipitation has been 235 mm over last 50 years (National Oceanic and Atmospheric Administration (NOAA) data). The territory has very high annual temperature changes, with recorded minimum and maximum of temperatures of −63 °C in January and 38.3 °C in July. The warm period lasts from May to September, reaching the highest temperatures in July (long-term average, 19 °C). The coldest month is January, with a long-term average of −39.6 °C. About 70% of precipitation falls during the warm period. The maximum monthly average of precipitation is in July and August, at 39 mm for both months. The minimum is in February and March, at 8 and 6 mm, respectively (NOAA data).

2.2. Sampling and Analysis

Monthly drilling and sampling on each plot for measurement of moisture, bulk density, and chemistry during the warm period (May–September) was done at the three belts (dry, middle, wet). At the same time, by drilling was measured thawing depth of the active layer. Soil moisture and bulk density within the soil profile were measured by a gravimetric method till permafrost. All the measurements were made in three replications.
In the soil aqueous extract, main anions and cations were measured. HCO3, Cl, and SO4−2 were measured using the titration method. Exchangeable potassium (K+), sodium (Na+), calcium (Ca2+), and magnesium (Mg2+) were extracted with 1 M ammonium acetate (pH 7). K+ and Na+ concentrations were measured using atomic absorption spectrophotometry (PerkinElmer AAnalyst 400, Waltham, MA, USA), and Ca2+ and Mg2+ concentrations were measured using the titration method [29]. pH was measured by using an inoLab pH Level 1 instrument (WTW, Oberbayern, Germany). Soil C contents were measured by the dry combustion method using a Sumigraph NC-1000 (Sumika Chemical Analysis Service, Osaka, Japan).
During vegetation cover studies, was used the method of sample areas. On each belt, 2 control plots with an area of 5 m2 were chosen. To evaluate the projective vegetation cover, the Braun Blanquet scale was used. Aboveground phytomass production was estimated by the cutting method on squares with a size of 1 m2 in 4 replications and measured in the air-dry state.
GHG was measured using the closed chamber method. CO2 concentrations in air samples taken in Tedlar bags were analyzed by an infrared gas analyzer (ZFP9, Fuji Electric Co. Ltd., Tokyo, Japan). CO2 fluxes were calculated according to the change in gas concentration in the chamber against the closure time:
F = ρ × h × (Δc/Δt) × [273/(273 + T)]
where F is the CO2 flux (mg C m−2 h−1), ρ is the gas density (CO2–C = 0.538 × 10⁶ mg m–3), h is the height of the chamber from the soil surface (m), Δc/Δt is the change in gas concentration inside the chamber during the sampling period (m3 m−3 h−1), and T is the air temperature inside the chamber (°C).
The CH4 concentration was analyzed using a gas chromatograph (GC-8A; Shimadzu, Kyoto, Japan) equipped with a flame ionization detector. The CH4 flux was calculated by a linear regression of three samples as follows:
F = ρ × V/A × ∆c/∆t × 273/(273 + T) × α,
where F is the flux (µg C m−2 h−1), ρ is the gas density of CH4 (0.717 × 10⁹ µg m−3), V is the volume of the chamber (m3), A is the cross-sectional area of the chamber (m2), ∆c/∆t is the change in gas concentration inside the chamber during the sampling period (m3 m−3 hour−1), T is the air temperature inside the chamber (°C), and α is the conversion factor to transform CH4 into C (12/16).
Cumulative emission of CO2 and CH4 was measured using the follow equation:
i = 1 n 1 F i × D i  
where Fi is the mean gas flux (kg C ha−1 d−1) between two sampling times (i.e., for time interval i), Di is the number of days in the sampling interval, and n is the number of sampling times [12,30,31,32].

3. Results

Russian scientists defined three types of soil inside alas depressions [5,6]. According to the World Reference Base for Soil Resources definition, dry belt stepped soil is Endogleyic Stagnosol Albic Arenic Turbic, middle belt sod-meadow soil is Gleyic Thapto-Histic Limnic Fluvisol, and wet belt marshy sod-meadow soil is Cryic Limnic Histosol. These soils have buried lake deposit horizons and gleying processes on the bottom (Figure 2). The maximum thawing depth of these soils is 280 cm for dry, 220 cm for middle, and 100 cm for wet belts. Minimal thawing depth is 200, 140, and 60 cm for dry, middle, and wet belts, respectively. Figure 2 and Table 1 show examples of soils and their physical parameters.
The long-term average volumetric soil moisture of the three microzones is shown in Figure 3. The lowest soil moisture is in the dry belt, and the average long-term data ranges from 14.0 to 32.0 m3 m−3. The middle belt has higher moisture, ranging between 22.9 and 37.0 m3 m−3. The wet organic rich belt of alas, located around the lake, has the highest moisture with the greatest range, from 18.7 to 90.4 m3 m−3.
The chemical composition of these soils is also different (Figure 4). The highest content of anion and cation is observed in the soils of the middle belt, especially on the top of the profile. The wet belt has a lower but still high concentration of salts. The lowest anion–cation content is observed in the soils of the dry belt.
Depending on the soil chemical properties, the vegetation cover of different belts of alas is also significantly different. The dry belt is characterized by the highest species diversity, but low productivity. Dominant species in the dry belt are Poa pratensis L., Agrostis trinii Turcz., Poa botryoides (Trin. ex Griseb.) Kom., Elytrigia repens (L.) Nevski (up to 50% coverage), Carex reptabunda (Trautv.) V. Krecz, Carex duriuscula C.A. Mey (up to 15–40% coverage), Artemisia commutate Bess., Lychnis sibirica L., Thalictrum simplex L., and Galiumverum L.
The middle belt has fewer species but is characterized by higher productivity of biomass due to Puccinellia tenuiflora (Griseb.) Scrib. et Merr. (up to 75% coverage). There is only a small percentage of other species, such as Glaux maritima L., Knorrigia Sibirika (Laxm.), Carex reptabunda (Trautv.) V. Krecz, Carex duriuscula C.A. Mey., and Hordeum brevis ubulatum (Trin.) Link.
The wet belt of the alas has only a few species, which are also highly biomass productive. The dominant species are Alopecurus arundinaceus Poir. (up to 70% coverage), Beckmannia syzigachne (Steud.) and Poa palustris L. (up to 10% coverage), and Eleocharis palustris (L.) Roem. et Schult.
GHG emission in the alas has various patterns. Average cumulative soil respiration (CO2) (mean ± standard deviation (SD)) in dry and middle belts was 2.62 ± 0.517 and 3.01 ± 0.196 Mg C ha−1, respectively. The wet belt of the alas is a source of CO2, with an average value of 3.66 ± 0.25 Mg C ha1 [12]. The most important aspect of the alas ecosystem is CH4 emission. This strongly depends on climatic conditions and the area of the alas lake. The lake within the alas depression changes annually because the depression is a closed system and has no runoff, so all water entering the depression is spent by evaporation only. In the dry belt, both negative and positive cumulative CH4 flux was observed, but values were insignificant. In 2008 and 2009, net CH4 emission was 0.26 ± 0.3 and 0.15 ± 0.1 kg C ha−1. Maximum CH4 uptake was recorded in 2007 (−0.11 ± 0.1 kg C ha−1), whereas in 2006, with the highest precipitation, uptake was −0.07 ± 0.1 kg C ha−1 [21].
In the wet belt, cumulative CH4 flux in all years was positive, indicating net CH4 emission. The lowest emission was observed in 2006–2007, when this belt started continuously flooding (1.72 ± 1.3 and 2.99 ± 0.6 kg C ha−1, respectively). Cumulative CH4 flux in 2008 (the second year of flood) abruptly increased to 397 ± 240 kg C ha−1, but in 2009 decreased to 4.89 ± 0.8 kg C ha−1 [21].
On the lake location, cumulative CH4 emission was stably high among measured locations during four studied years. However, the maximum value was lower than in wet grassland (in 2008), but in other years, CH4 emission was considerably higher than in wet grassland. Over four years, the lowest cumulative CH4 flux was observed in 2007 (56.8 ± 44.9 kg C ha−1). After the lake expanded and occupied wet grassland territory, high CH4 emission was observed in the second and third years of flood, 2008–2009 (284 ± 169 and 250 ± 195 kg C ha−1, respectively).

4. Discussion

Alas depressions are complex ecological systems that differ sharply from the inter-alas occupied by permafrost podzolized soils. Depending on the yearly climatic conditions, a lake is formed inside of the alas, can periodically dry out or expand. Hydromorphic marshy sod soils extend around the lake. Next, the higher topography of the alas bottom is where the belt of semihydromorphic solonchakous soils and solonchaks is located. Xeromorphic stepped soils and solonetz are located on the highest parts of the alas depression bottom [33]. Multiple alternations of lake drying and expanding in the alas leads to the formation of polycyclic layered parent materials. Their heterogeneous layering disturbs the classical horizonation (A–B–C) of the soil profile. The profiles of alas soils usually have surface and buried organic horizons of limnic and marsh genesis (Figure 2). Such horizons are designated as lacustrine deposit (LD) horizons [4,6,34]. Thus, alas deposits are specific parent materials that greatly affect the morphology of alas soils. Syngenetic differentiation of the profile is a distinctive feature of alas soils.
The water balance of the alas depression is highly dependent on the lake area. As mentioned above, the wet belt of alas has the highest water content, but climatic or anthropogenic factors disturbing the surrounding forest result in deepening of the inter-alas forest active layer and water inflow to the alas depression. As a result, the wet belt floods for several years, leading to changes in soil salinity, vegetation cover, and GHG emission.
The dry belt of the alas is characterized by stepped vegetation cover, called stepped meadow. The granulometric composition of Endogleyic Stagnosol Albic Arenic Turbic soil is heterogeneous, since it is formed on stratified dissimilar deposits. pH is strongly alkaline, except of the upper horizon. The presence of a significant amount of sodium ions indicates the solonetz features of the dry belt, but the soil is not saline [6,33]. Such low salinization can be explained by the higher location on the topography promoting lateral runoff of water-soluble salts to the lower middle belt (Figure 4). The area and shape of the belt of stepped meadow changes annually depending on climatic conditions. Depending on climatic conditions and lake size, the area of dry belt ranged from 1.59 to 7.07 ha. In the year of dry belt expansion, there was a decrease in productivity, and vice versa; in the year of area reduction, productivity was higher (Figure 5). In general, the stepped meadow belt productivity ranged from 0.28 to 2.24 T/ha of air-dried biomass [35]. Because of low biomass productivity and the location on the alas bottom, soil C content in this grassland is lowest [6,7,12,36]. That is why emission of CO2 and CH4 from this belt is irregular. Consequently, CH4 consumption exceeded CH4 production under aerobic conditions on this dry belt. Total GHG emission in arid years is decreasing and during years with enough precipitation is increasing [12].
The middle belt soil has a polygenetic morphological composition. Within its profile it has sod–humus and humus horizons of lake origin. The mineral part has heavier granulometric composition dominated by silt. This soil has also a strongly alkaline pH resulting from the presence of a high concentration of sodium bicarbonate (Figure 4). Thus, Gleyic Thapto-Histic Limnic Fluvisol has high salinity and refers to solonchaks soils [6]. The presence of Puccinellia tenuiflora (Griseb.) Scrib. Et Merr., Glaux maritime L., and Knorrigia Sibirika (Laxm.) indicates significant salinity of this soil. The area of this belt varies from 2.03 ha during flood times to 6.98 ha during the shrunken lake period (Figure 5). The productivity of biomass ranges from 0.13 to 3.95 T/ha [37]. On average, the soil of the middle belt in the thermokarst depression stores 1.8 times more soil C than the dry belt [6,7]. With increased soil moisture of this belt, CH4 emission tends to increase in August. This is related to increased temperature and activation of microbial production of CH4 in conditions of high soil C content [21,32].
The wet belt consists of peat deposits formed under limnic conditions. Lacustrine sediments predetermine their carbonate saturation. The diagnostic feature of former formation in lakes is a lot of shells in the peat horizons. This soil has an alkaline reaction and hydrocarbonate sulfate salinization (Figure 4). The degree of salinity is lower than in the middle belt, due to high soil moisture and salt transport to the lake water [6]. Years of expanded lake promotes accumulation of various organic and mineral substances in lake water, leading to the maximum development of plankton in water and the accumulation of sapropel. The aquatic environment enriched with nutrients in turn contributes to the rapid development of hygrophytes on the coastal parts of the lakes, which, after dying out, accumulate in the form of peat. After the lake shrinks, the peat starts weathering and a new soil formation process begins [34]. The area of this belt changed from 0.68 to 3.36 ha during the observation period (Figure 5). Biomass productivity of the wet belt varied from 0.43 to 5.02 T/ha [38]. Thus, severe climatic conditions of Yakutia do not allow high productivity and high soil organic carbon (SOC) input, but the low decomposition rate of organic matter during the short summer promotes accumulation of high C stock in soils of the wet belt. Soil C content of wet grassland is the highest, two times that of the middle belt [6,7]. CH4 emission here is the highest and dependent on yearly climatic changes in the high range [21,30,32]. Flooding of lake water in thermokarst depressions is an important factor for CH4 production, some years causing an abrupt increase of CH4 emission [21,30].
Therefore, the measured parameters of the alas belts above show that thermokarst depression is not a whole ecosystem. It is divided into at least three belts with their own biogeochemical cycles and physical, chemical, and ecological features.

5. Conclusions

Climate warming scenarios forecast increasing air temperature and precipitation. According to these scenarios, thermokarst depressions in Central Yakutia may be continuously flooded. Under present climatic conditions, the expansion of alas lakes over the last decade was observed. This fluctuation of lakes significantly changes and intensifies all processes inside the alas depressions; for example, higher temperature may result in increased productivity of grassland vegetation. This will increase the supply of fresh organic C to the soils and lake, in turn supporting CO2 and CH4 emissions under the warming scenario. From this, Central Yakutia is a potentially risky region due to future climate warming by positive feedback. Therefore, dividing alas depressions into microzone belts is important to understand the reactions of this ecosystem to climate change.

Author Contributions

F.T.–soil and GHG analysis. M.N.–geobotanic survey. A.D.–soil analysis, GHG, chemistry and mapping analysis.

Funding

The work was done under project No. 0376-2014-0004, subject 54.1.2, “Mechanisms of transformation and rules of cryolithozone soil functioning in the context of global change: factors, current state and forecast,” direction 54, “Soils as a component of the biosphere (the formation, evolution, ecological functions)” of the program of fundamental scientific research of the state academies of sciences for 2013–2020.

Conflicts of Interest

The authors declare no conflicts of interest.

References

  1. Kudrjavtsev, V.A.; Kondratjeva, K.A.; Romanovskii, N.N. The zonal and regional laws of formation of cryolithozone in the USSR. In Works of Ш International Conference on Permafrost Studies; CINII: Osaka, Japan, 1978; pp. 419–426. [Google Scholar]
  2. Brown, J.; Garve, N.A. The Disturbance of Surface and Its Protection at Development of the North; Nauka: Novosibirsk, Russia, 1981; p. 88. (In Russian) [Google Scholar]
  3. Bosikov, N.P. Alas Evolution in Central Yakutia; Permafrost Institute, Siberian Division, Russian Academy of Science: Yakutsk, Russia, 1991; p. 128. (In Russian) [Google Scholar]
  4. Desyatkin, R.V. Content and composition of humus in Lena-Amga interfluve’s Alas soils. In Vesti. Leningrad Univ; No. 6; LSU Press: Leningrad, Russia, 1981; pp. 75–82. (In Russian) [Google Scholar]
  5. Desyatkin, R.V. Soils of Lena-Amga Interfluve Alases; YF SD SAS Press: Yakutsk, Russia, 1984; p. 168. (In Russian) [Google Scholar]
  6. Desyatkin, R.V. Soil Formation in Thermokarst Depression—Alases of Cryolithozone; Nauka: Novosibirsk, Russia, 2008; p. 324. (In Russian) [Google Scholar]
  7. Matsuura, Y.; Ohta, S.; Sanada, M.; Desyatkin, R.V. Carbon and nitrogen storage in soil developed on two different toposequences of the Lena River terrain. In Proceedings of the Second Symposium on the Joint Siberian Permafrost Studies between Japan and Russia in 1993, Tsukuba, Japan, 13–14 January 1994; pp. 177–182. [Google Scholar]
  8. Iwasaki, S.; Desyatkin, A.R.; Filippov, N.V.; Desyatkin, R.V.; Hatano, R. Carbon stock estimation and changes associated with thermokarst activity, forest disturbance, and land use changes in Eastern Siberia. Geoderma Reg. 2018, 14, e00171. [Google Scholar] [CrossRef]
  9. Desyatkin, A.R.; Iwasaki, S.; Desyatkin, R.V.; Hatano, R. Changes of soil c stock under establishment and abandonment of arable lands in permafrost area, Central Yakutia. Atmosphere 2018, 9, 308. [Google Scholar] [CrossRef]
  10. Gavriliev, K.A.; Dmitriev, A.I.; Ivanov, K.P. Sapropel resources of Central Yakutia lakes. In Question of Rational Use and Protection of Natural Resources of Cryolithozone Lakes (on Example of Central Yakutia); Publishing house of Yakutsk University: Yakutsk, Russia, 1983; pp. 47–58. (In Russian) [Google Scholar]
  11. Bakulina, N.T.; Spektor, V.B.; Novikov, N.I.; Kurchatova, A.N.; Spektor, V.V. The cut of ground deposits of Small Chabydalake. In The Materials of International Conference «Lakes of Cold Regions », Part 4; The Yakutsk State University: Yakutsk, Russia, 2000; pp. 29–41. (In Russian) [Google Scholar]
  12. Desyatkin, A.R.; Takakai, F.; Fedorov, P.P.; Desyatkin, R.V.; Hatano, R. Effect of human activity on carbon balance in meadows in a thermokarst depression in Siberia. Eur. J. For. Res. 2007, 10, 89–96. [Google Scholar]
  13. Desyatkin, R.V.; Desyatkin, A.R. Thermokarst transformation of soil cover on cryolithozone flat territories. In Symptom of Environmental Change in Siberian Permafrost Region; Hokkaido University Press: Sapporo, Japan, 2006; pp. 213–223. [Google Scholar]
  14. Oechel, W.; Hastings, S.; Vourlitis, G.; Jenkins, M.; Riechers, G.; Grulke, N. Recent change of arctic tundra ecosystem from a carbon sink to a source. Nature 1993, 361, 520–523. [Google Scholar] [CrossRef]
  15. Zimov, S.; Zimova, G.; Davidova, S.; Voropaev, Y.; Voropaeva, Z.; Prosiannikova, O.; Semiletova, I.; Prosiannikova, I. Winter biotic activity and production of CO2 in Siberian soils; a factor in the greenhouse effect. J. Geophys. Res. 1993, 98, 5017–5023. [Google Scholar] [CrossRef]
  16. Goulden, M.L.; Crill, P.M. Automated measurements of CO2 exchange at the moss surface of a black spruce forest. Tree Physiol. 1997, 17, 537–542. [Google Scholar] [CrossRef] [PubMed]
  17. Melillo, J.M.; Steudler, P.A.; Aber, J.D.; Newkirk, K.; Lux, H.; Bowles, F.P.; Catricala, C.; Magill, A.; Ahrens, T.; Morrisseau, S. Soil warming and carbon-cycle feedbacks to the climate system. Science 2002, 298, 2173–2176. [Google Scholar] [CrossRef] [PubMed]
  18. Freeman, C.; Fenner, N.; Ostle, N.J.; Kang, H.; Dowrick, D.J.; Reynolds, B.; Lock, M.A.; Sleep, D.; Hughes, S.; Hudson, J. Export of dissolved organic carbon from peatlands under elevated carbon dioxide levels. Nature 2004, 430, 195–198. [Google Scholar] [CrossRef] [PubMed]
  19. Frey, K.E.; Smith, L.C. Amplified carbon release from vast West Siberian peatlands by 2100. Geophys. Res. Lett. 2005, 32, L09401. [Google Scholar] [CrossRef]
  20. Trumbore, S.; Chadwick, O.; Amundson, R. Rapid exchange between soil carbon and atmospheric CO2 driven by temperature changes. Science 1996, 272, 393–396. [Google Scholar] [CrossRef]
  21. Desyatkin, A.R.; Takakai, F.; Hatano, R. Flood effect on CH4 emission from the alas in Central Yakutia, East Siberia. Soil Sci. Plant Nutr. 2014, 60, 242–253. [Google Scholar] [CrossRef]
  22. Soloviev, P.A. Cryolithozone of Lena-Amga Interfluve Northern Part; Academy of Science of the USSR: Moscow, Russia, 1959; p. 144. (In Russian) [Google Scholar]
  23. Sheludiakova, V.A.; Karavaev, M.N.; Petrov, A.M. Meadows and pastures of Central Yakutia. In Materials about Nature and Agriculture of Central Yakutia; Academy of Science of the USSR: Moscow, Russia, 1954; pp. 234–274. (In Russian) [Google Scholar]
  24. Usanova, V.M. To the question of the classification of alas of the Central Yakut Plain. In Materials of the Vegetation of Yakutia; Academy of Science of the USSR: Leningrad, Russia, 1961; pp. 7–20. (In Russian) [Google Scholar]
  25. Permyakova, A.A. Vegetation of Yakutia Alases. Ph.D. Thesis, Sverdlovsk State University, Sverdlovsk, Russia, 1961. (In Russian). [Google Scholar]
  26. Elovskaya, L.G. Influence of soil conditions on the chemistry and nutritional value of fodder plants of Yakutia. In Materials of Soil and Agrochemical Researches of Yakutia; Nauka: Moscow, Russia, 1958; pp. 45–115. (In Russian) [Google Scholar]
  27. Egorov, A.D.; Grigoriev, D.V.; Kurilyk, T.T.; Sazonov, N.N. Trace Elements in Soils and Grassland Plants of Frozen Landscapes of Yakutia; Academy of Science of the USSR: Yakutsk, Russia, 1970; p. 287. (In Russian) [Google Scholar]
  28. Gavrilova, M.K. Climate in Central Yakutia; Yakutsk Book Press: Yakutsk, Russia, 1973; p. 119. (In Russian) [Google Scholar]
  29. Arinushkina, E.V. Soil Chemical Analysis Manual; MSU: Moscow, Russia, 1970; p. 487. (In Russian) [Google Scholar]
  30. Takakai, F.; Desyatkin, A.R.; Lopez, C.M.L.; Fedorov, A.N.; Desyatkin, R.V.; Hatano, R. CH4 and N2O emissions from a forest-alas ecosystem in the permafrost taiga forest region, eastern Siberia, Russia. J. Geophys. Res. Biogeosci. 2008, 113, G02002. [Google Scholar] [CrossRef]
  31. Takakai, F.; Desyatkin, A.R.; Lopez, C.M.L.; Fedorov, A.N.; Desyatkin, R.V.; Hatano, R. Influence of forest disturbance on CO2, CH4 and N2O fluxes from larch forest soil in the permafrost taiga region of eastern Siberia. Soil Sci. Plant Nutr. 2008, 54, 938–949. [Google Scholar] [CrossRef]
  32. Desyatkin, A.R.; Takakai, F.; Fedorov, P.P.; Nikolaeva, M.C.; Desyatkin, R.V.; Hatano, R. CH4 emission from different stages of thermokarst formation in Central Yakutia, East Siberia. Soil Sci. Plant Nutr. 2009, 55, 558–570. [Google Scholar] [CrossRef]
  33. Desyatkin, R.V. Syngenetic soil salinization during thermokarst Alas formation. Eur. Soil Sci. 1993, 25, 38–46. [Google Scholar]
  34. Desyatkin, R.V. Soil formation in alases. Soviet Soil Sci. 1991, 23, 9–19. [Google Scholar]
  35. Nikolaeva, M.C.; Desyatkin, R.V. Dynamics of diversity and productivity of alas dry meadows in Central Yakutia. Restitelnye Resurs. 2016, 52, 20–27. (In Russian) [Google Scholar]
  36. Morishita, T.; Hatano, R.; Desyatkin, R.V. CH4 flux in an Alas ecosystem formed by forest disturbance near Yakutsk, eastern Siberia, Russia. Soil Sci. Plant Nutr. 2003, 49, 369–377. [Google Scholar] [CrossRef]
  37. Nikolaeva, M.C.; Desyatkin, R.V. Dynamics of diversity and productivity of alas real meadows in Central Yakutia. Restitelnye Resurs. 2016, 51, 328–335. (In Russian) [Google Scholar]
  38. Nikolaeva, M.C.; Desyatkin, R.V. Dynamics of diversity and productivity of alas wet meadows in Central Yakutia. Restitelnye Resurs. 2016, 51, 70–80. (In Russian) [Google Scholar]
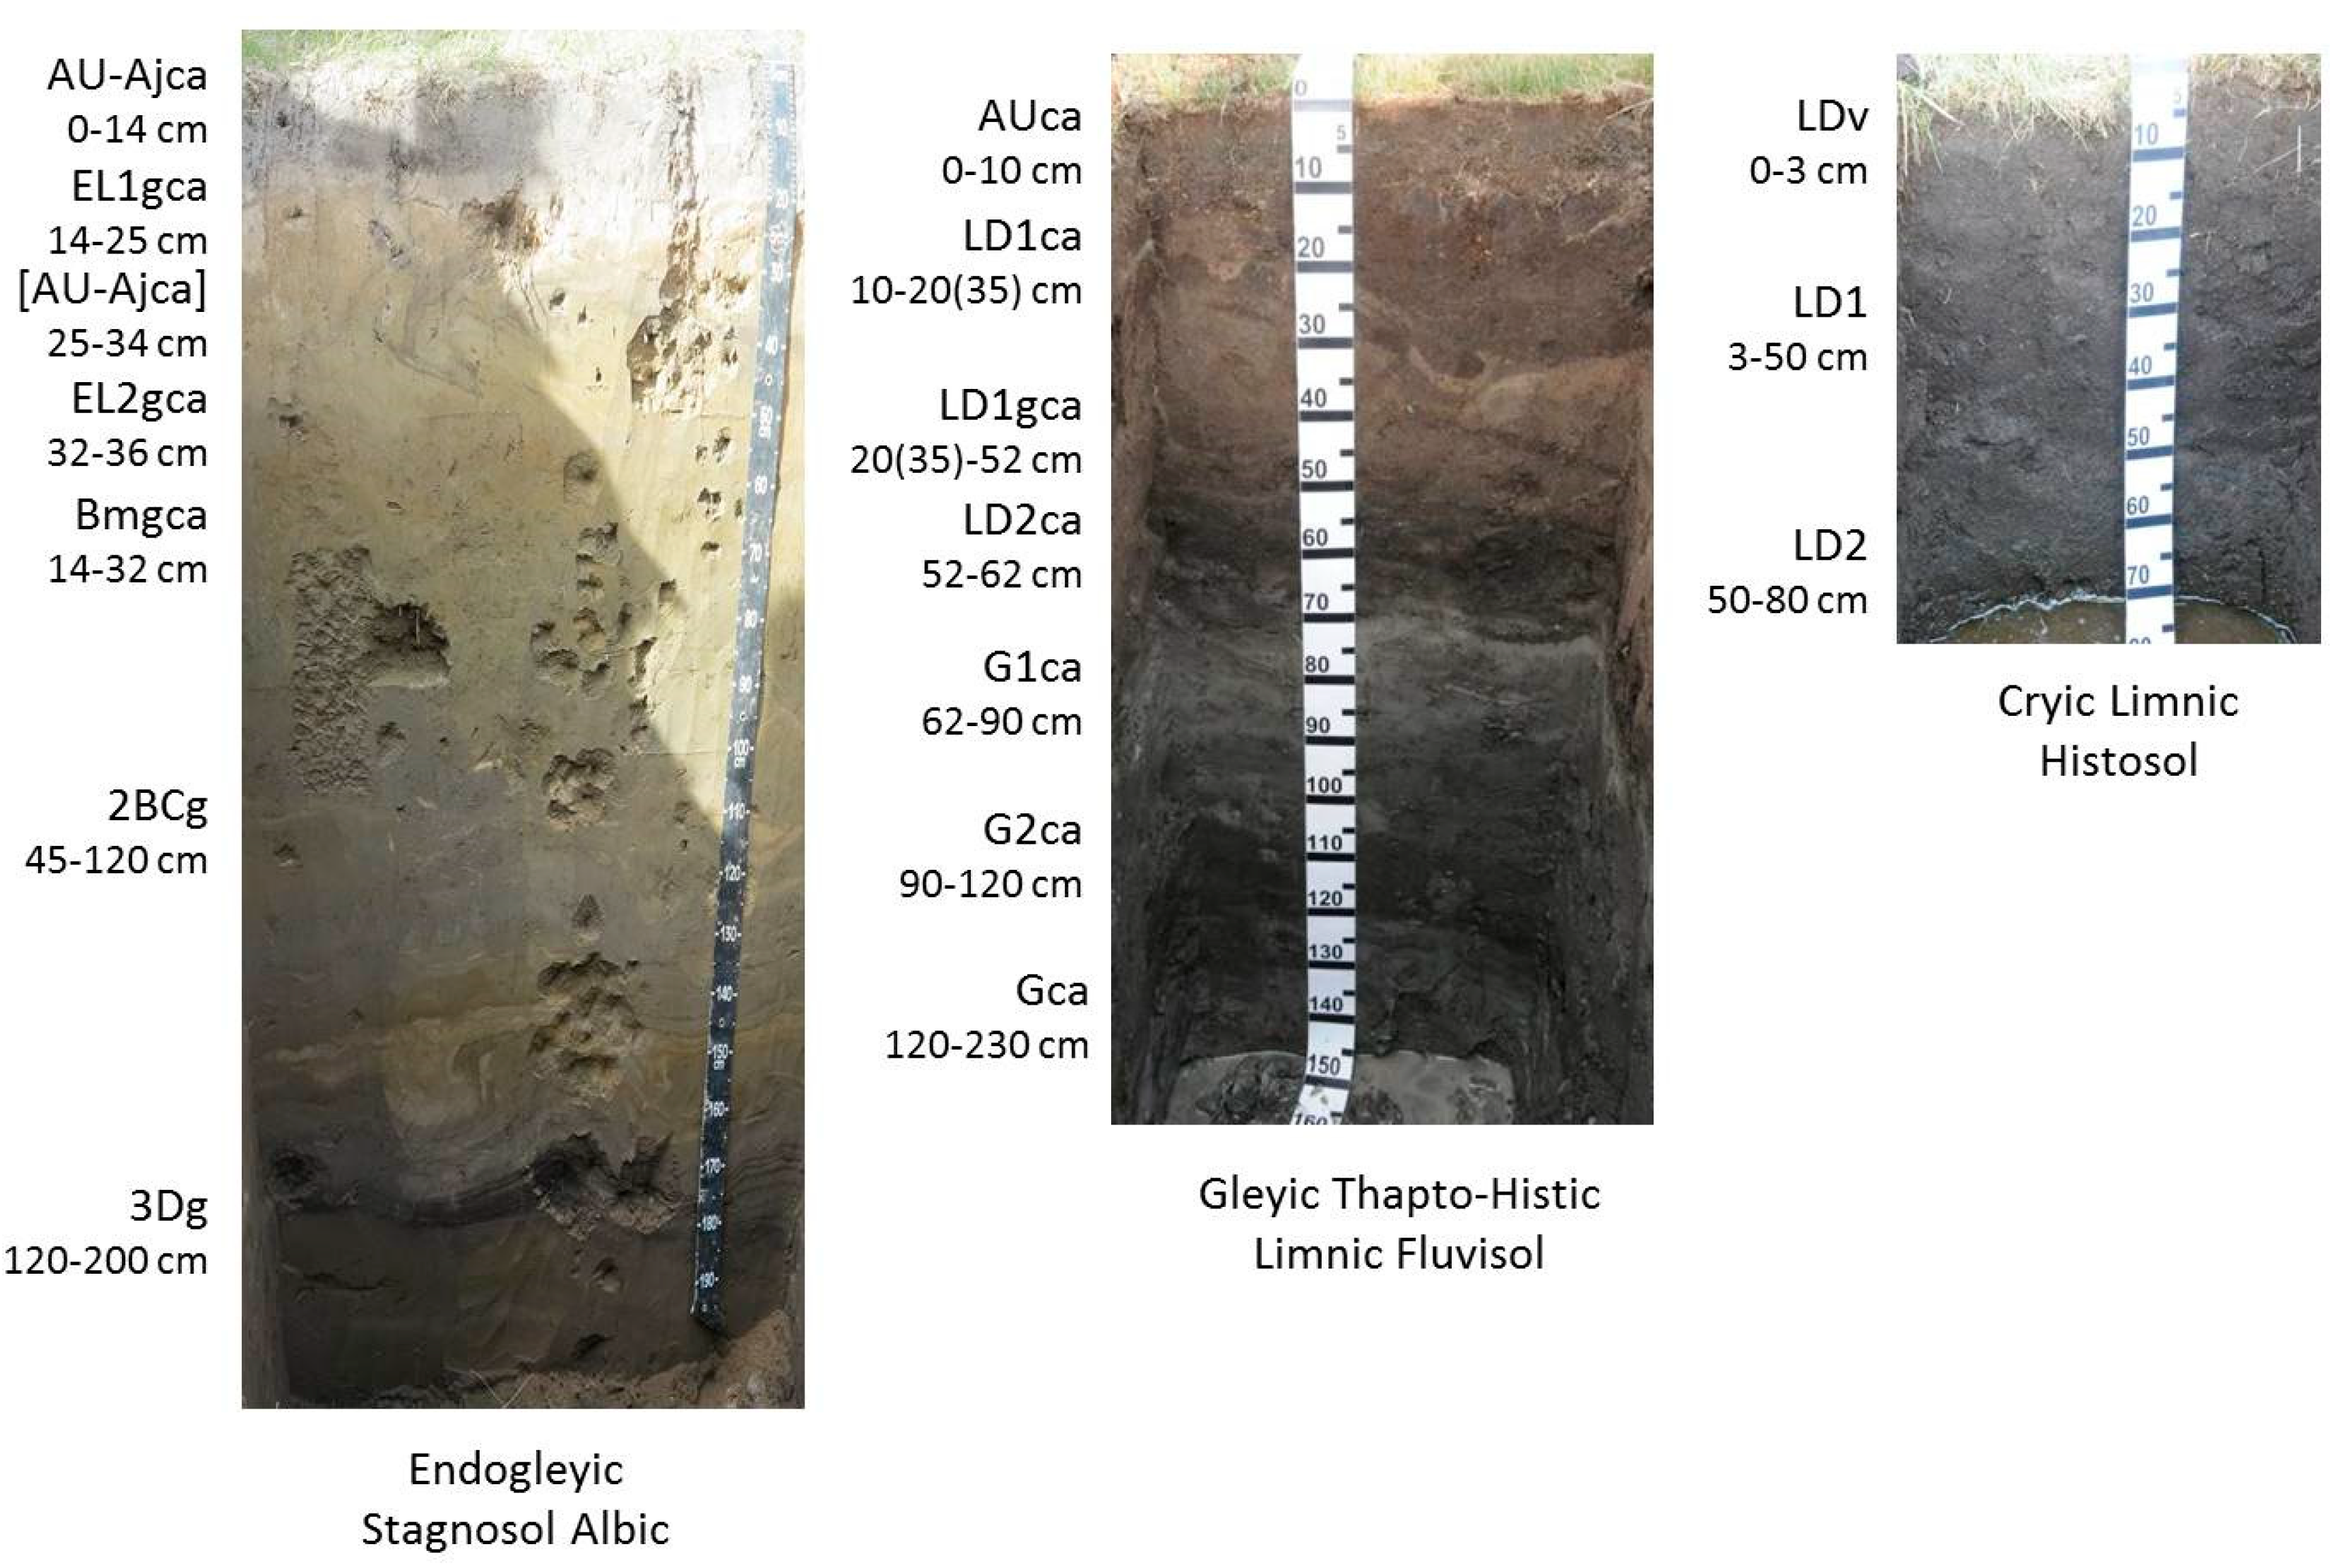
Figure 1. Study area between Lena and Aldan Rivers (N 62°.09; E 130° 38).
Geosciences 08 00439 g001
Figure 2. Soils of alas depression.
Geosciences 08 00439 g002
Figure 3. Soil moisture of the three belts (error bar = standard deviation (SD)).
Geosciences 08 00439 g003
Figure 4. Average anion and cation profiles of the three belts.
Geosciences 08 00439 g004
Figure 5. (a) Example of alas belts scheme and (b) area in hectares during observation period.
Geosciences 08 00439 g005
Table 1. Physical parameters of studied soils.
HorizonDepth (cm)pHBulk Density (g/cm3)Sand (%)Silt (%)Clay (%)C Content (%)
Dry belt
AU-Ajca0–148.451.1874.3122.613.082.19
EL1gca14–259.601.5589.867.802.340.70
(AU-Ajca)25–349.851.5477.5212.909.581.39
EL2gca32–369.8563.4629.007.541.22
Bmgca14–329.701.5586.7010.043.260.75
2BCg45–1209.2534.2051.8014.001.01
3Dg120–2008.5529.6957.1913.121.06
Middle belt
AUca0–109.950.8143.547.848.6614.24
LD1ca10–20(35)9.250.6839.64
LD1gca20(35)–529.151.049.73
LD2ca52–629.000.917.61
G1ca62–909.251.5937.7352.0510.221.23
G2ca90–1209.101.4311.4872.7815.742.38
Gca120–2309.2565.3928.576.041.56
Wet belt
LDv0–335.69
LD13–508.850.3168.26
LD250–809.350.3641.63

