Article

The Morphometry of the Deep-Water Sinuous Mendocino Channel and the Immediate Environs, Northeastern Pacific Ocean

Center for Coastal & Ocean Mapping, University of New Hampshire, Durham, NH 03824, USA
Geosciences 2017, 7(4), 124; https://doi.org/10.3390/geosciences7040124
Submission received: 7 September 2017 / Revised: 6 November 2017 / Accepted: 6 November 2017 / Published: 29 November 2017
(This article belongs to the Special Issue Marine Geomorphometry)

Abstract

:
Mendocino Channel, a deep-water sinuous channel located along the base of Gorda Escarpment, was for the first time completely mapped with a multibeam echosounder. This study uses newly acquired multibeam bathymetry and backscatter, together with supporting multichannel seismic and sediment core data to quantitatively describe the morphometry of the entire Mendocino Channel and to explore the age and possible causes that may have contributed to the formation and maintenance of the channel. The first 42 km of the channel is a linear reach followed for the next 83.8 km by a sinuous reach. The sinuous reach has a sinuosity index of 1.66 before it changes back to a linear reach for the next 22.2 km. A second sinuous reach is 40.2 km long and the two reaches are separated by a crevasse splay and a large landslide that deflected the channel northwest towards Gorda Basin. Both sinuous reaches have oxbow bends, cut-off meanders, interior and exterior terraces and extensive levee systems. The lower sinuous reach becomes more linear for the next 22.2 km before the channel relief falls below the resolution of the data. Levees suddenly decrease in height above the channel floor mid-way along the lower linear reach close to where the channel makes a 90° turn to the southwest. The entire channel floor is smooth at the resolution of the data and only two large mounds and one large sediment pile were found on the channel floor. The bathymetry and acoustic backscatter, together with previously collected seismic data and box and piston cores provide details to suggest Mendocino Channel may be no older than early Quaternary. A combination of significant and numerous earthquakes and wave-loading resuspension by storms are the most likely processes that generated turbidity currents that have formed and modified Mendocino Channel.

1. Introduction

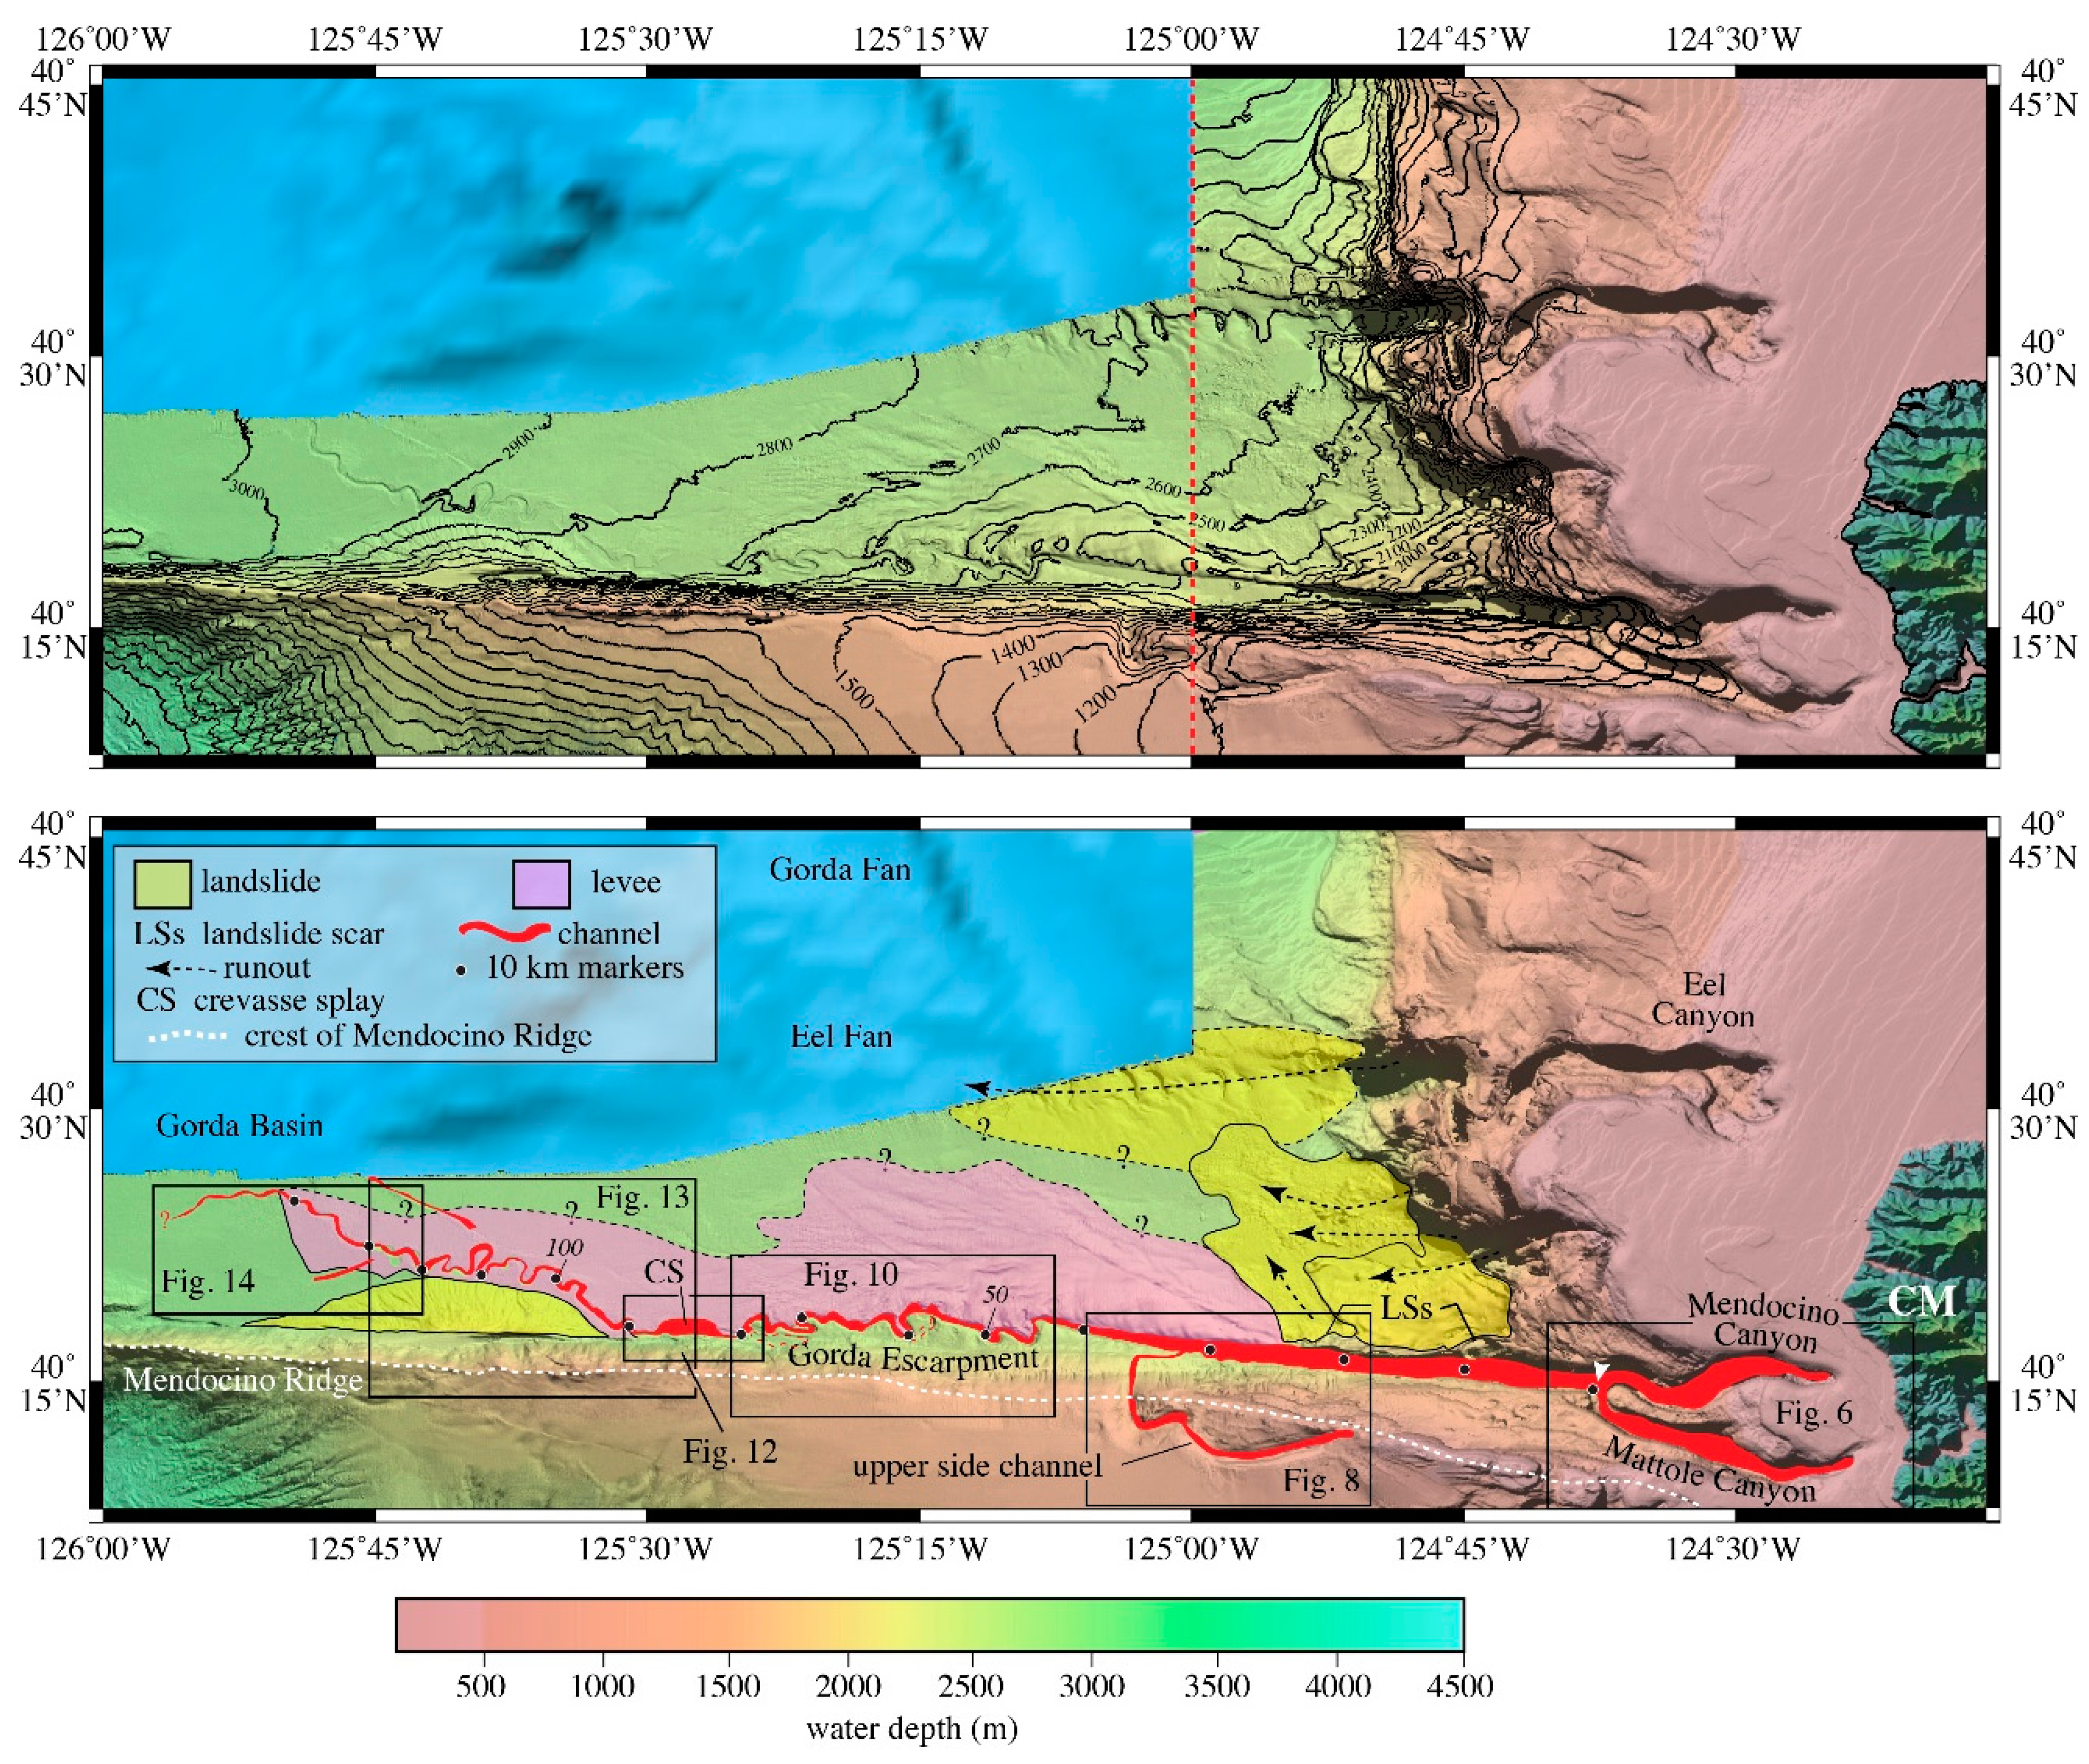
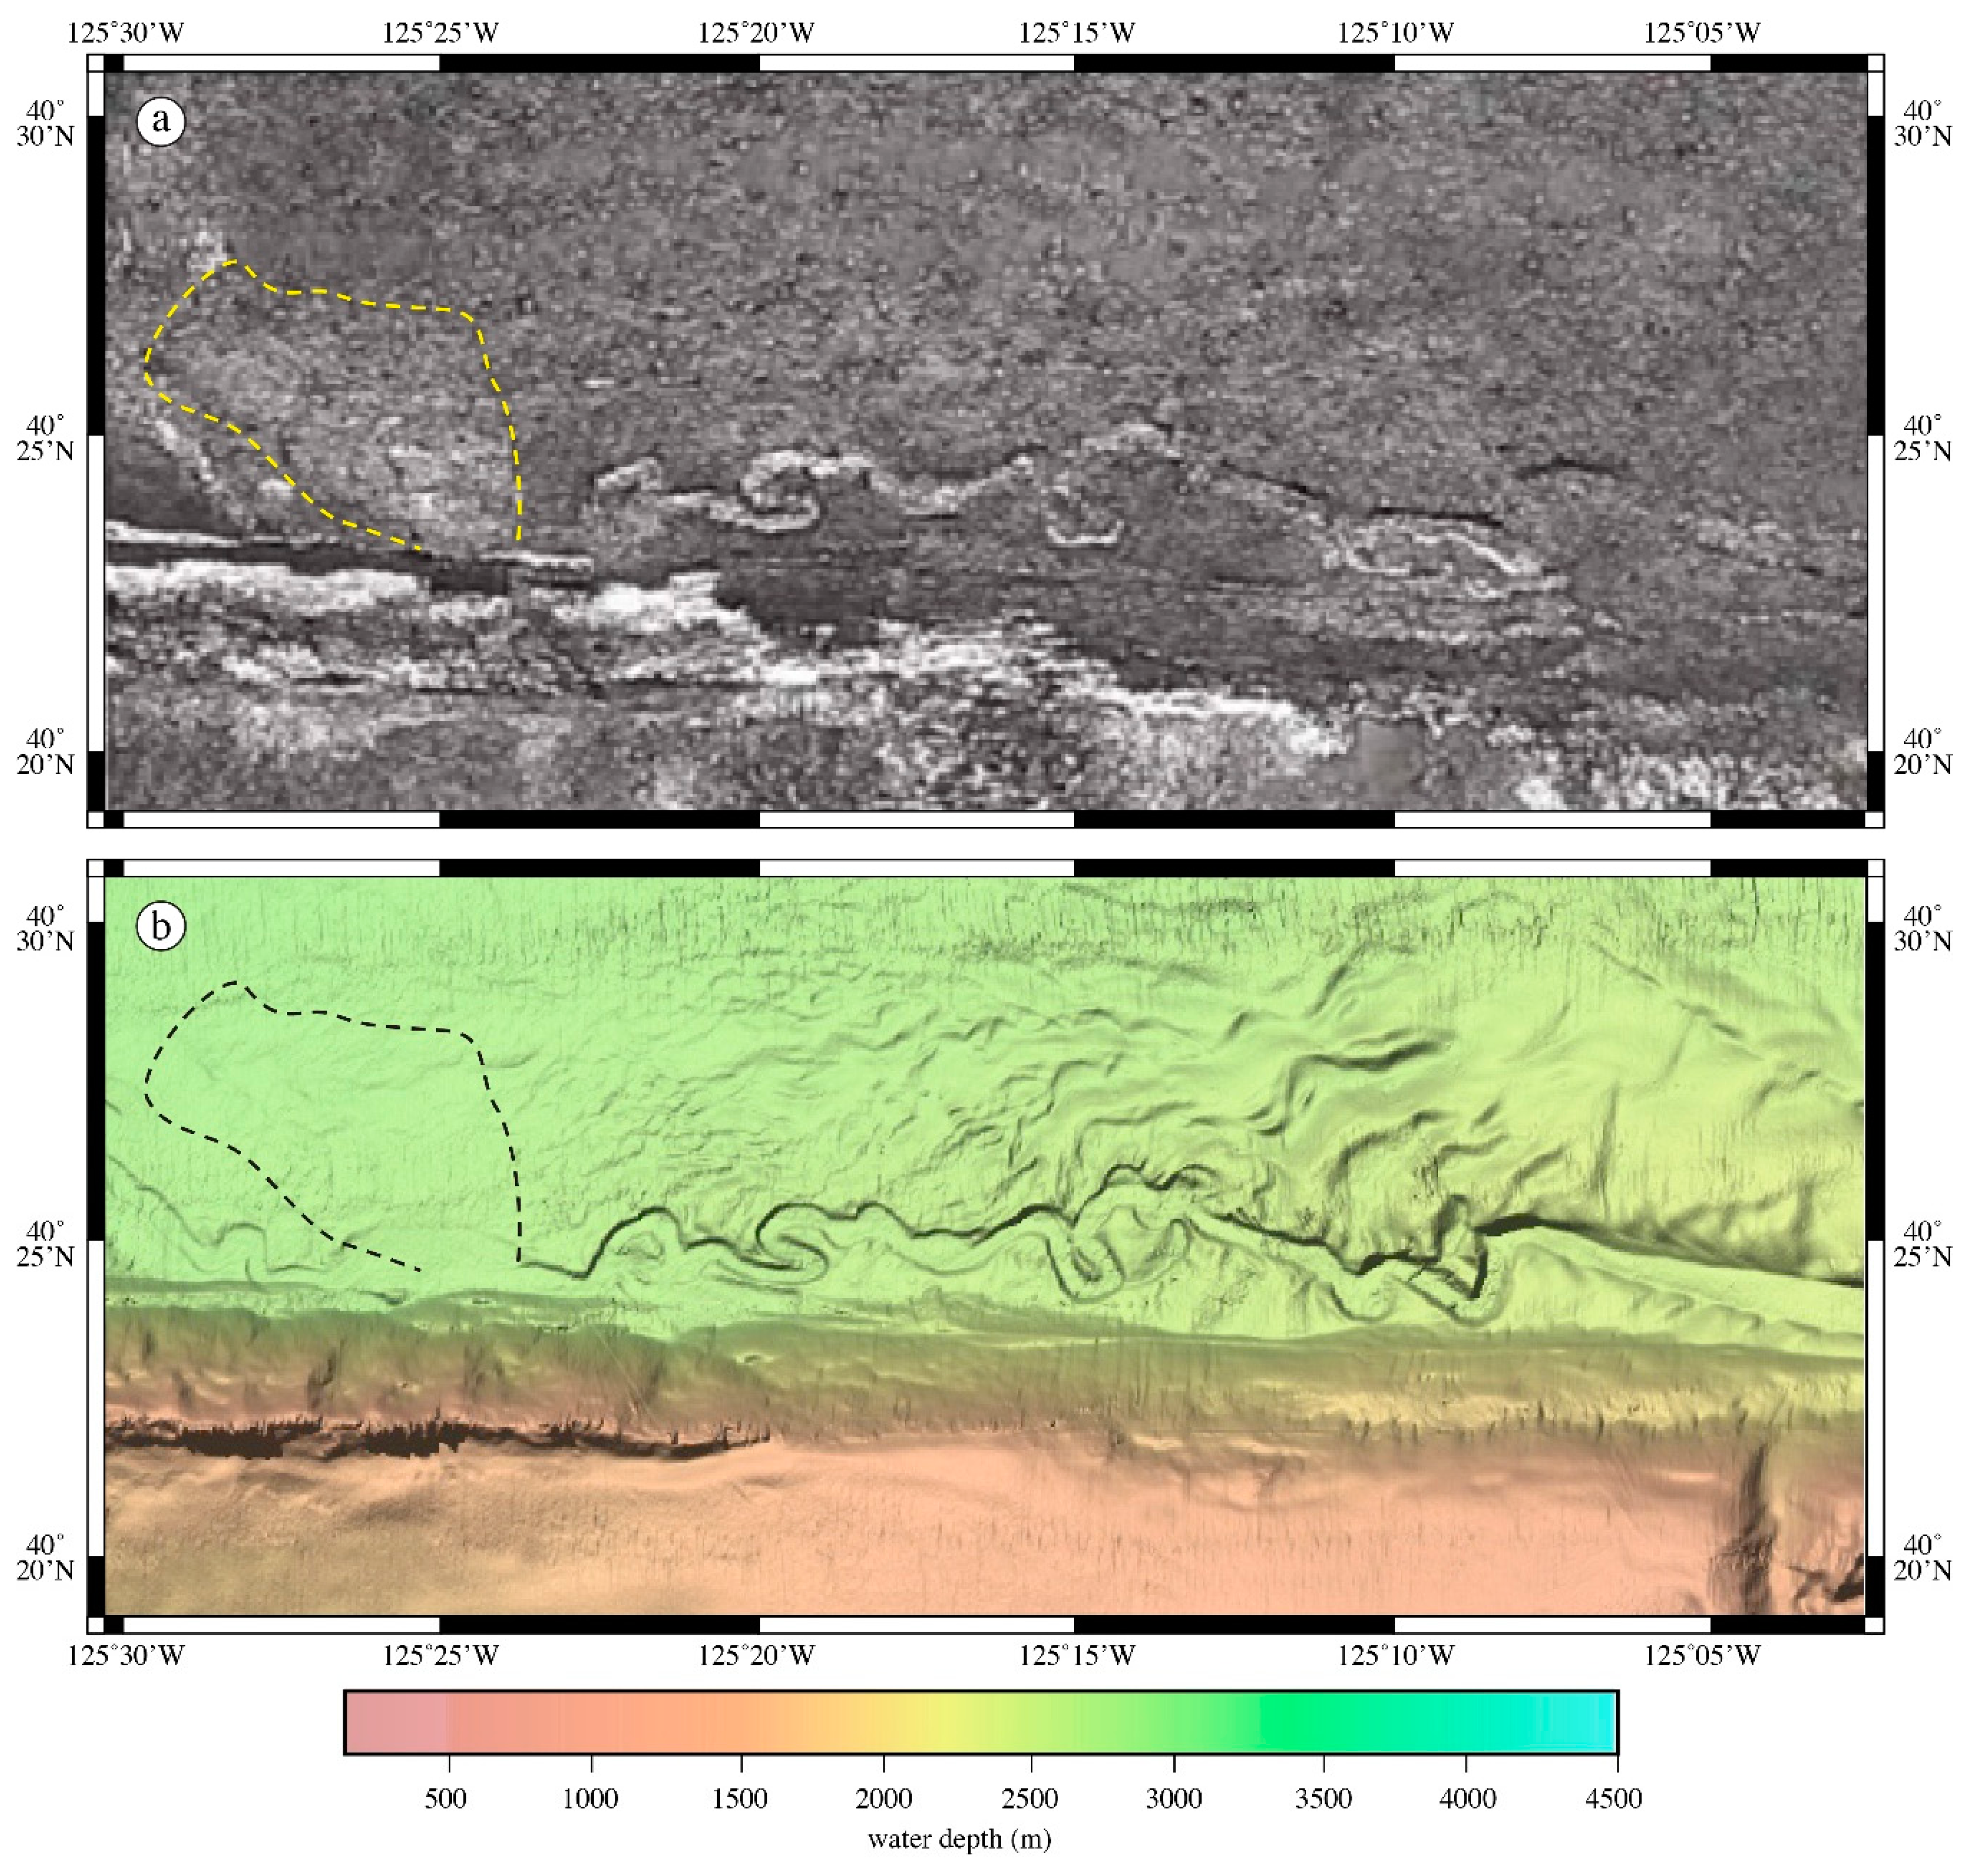
Deep-water sinuous channels are conduits that transport sediments across continental margins and onto abyssal basins, often transporting sands, silts and clays hundreds of kilometers away from the margin. Almost all examples of modern deep-water sinuous channels are found on passive margins and are associated with submarine fans (e.g., [1,2,3,4], among many others). Mendocino Channel, off the U.S. northern California active continental margin (Figure 1 and Figure 2), is one of the few examples (e.g., Reynisdjup Channel off Iceland and Hikurangi Channels off eastern New Zealand) of a modern deep-water sinuous channel that is not associated with a passive margin or a submarine fan although it also has been a conduit of coarse clastic sediments to a deep-sea basin [5]. During the 1984 mapping of the U.S. Exclusive Economic Zone off the western U.S. continental margin [6,7], a 42 km section of the channel was discovered on the abyssal seafloor at the base of the north side of the Gorda Escarpment segment of Mendocino Ridge, a ridge formed by the transform fault that strikes east from Gorda Ridge and beneath the North American continent. The short section of Mendocino Channel was mapped using GLORIA, a long-range sidescan sonar (Figure 3a) and was investigated on a subsequent cruise that collected widely spaced single-channel seismic-reflection profiles and several box cores within the channel and adjacent levee [5]. The GLORIA sidescan only provides images of 6.5-kHz backscatter but the images show the high-backscatter acoustic response of the channel floor. Unfortunately, the GLORIA system provided no measurements of bathymetry. The channel, called “Mendocino Channel” by Cacchione et al. [5], was traced on the GLORIA images from water depths of ~2450 m to ~2750 m. They suggested, based on NOAA bathymetric charts, that the channel is related to Mendocino and Mattole Canyons. Mendocino Channel is not in a submarine fan setting with associated sinuous distributary channels, such as are found on many submarine fans [1,2,8,9,10,11,12,13,14,15,16,17,18,19,20] to cite just a few. Rather, Mendocino Channel is a single channel that trends across a debris apron at the base of the lower continental margin and continues across hemipelagic sediments deposited in a basin setting. The most similar channels to Mendocino Channel and its setting are Reynisdjup Channel off Iceland [21] and Hikurangi Channels off eastern New Zealand [22].
The entire eastern 850 km of Mendocino Ridge was mapped in 2009 with a multibeam echosounder (MBES) [23] and the new bathymetry includes the entire length of Mendocino Channel at a resolution of 40 m/pixel. The channel has many features that resemble those found on fan-related modern deep-water sinuous channels. In addition to resolving these common features, several enigmatic characteristics occur, such as; (1) the channel trends parallel to Gorda Escarpment but is perched several hundred meters above basin depths and descends to basin depths along its length; (2) an initial 48 km-long linear upper reach that makes an abrupt 90° bend towards the Gorda Escarpment but is immediately followed by (3) a 30 km-long section of sinuous channel that parallels the trend of the escarpment and not down slope to the NNW. This section is followed by (4) a 10.5 km reach with a broad flat region that (5) is abruptly diverted 20° and traverses 58.5 km away from the escarpment and out onto the basin. The term “reach” is used here senso lato and does not connote the strict subaerial hydraulic or geomorphic definition of the term. The purpose of this study is to use newly acquired multibeam bathymetry and backscatter, together with available supporting data to quantitatively describe the morphometry of the entire Mendocino Channel and to explore the age and possible causes that may have contributed to the formation and maintenance of the channel.
At the outset, it should be mentioned that Peakall et al. [24] challenged the analogy often made between subaerial and deep-water sinuous channels based on qualitative planform morphologies. They suggested differences in the fluid mechanics that acted within the two environments would have produced recognizable features. In particular, they stressed the importance of large-scale overbank flows that can produce recognizable morphologic features on submarine channel levees. Consequently, care has been taken to not over-interpret the processes that may have formed and modified Mendocino Channel using subaerial analogies.

2. General Setting

Mendocino Channel occurs at the base of Gorda Escarpment, the north-facing slope of the eastern-most section of Mendocino Ridge. The eastern end of the escarpment is the Mendocino Triple Junction, the point where the Gorda and Pacific Plates meet at the Mendocino Transform Fault. Gorda Escarpment is the eastern section of the transform fault that extends from Gorda Ridge to the west to North America on the east. Mendocino Channel extends westward from the continental margin for more than 148 km and out onto the southernmost Gorda Basin (Figure 2). Mendocino Triple Junction and Transform Fault are the locus of numerous earthquakes with magnitudes greater than Mw5 over the past 100 years whose affects have been felt over the entire region.
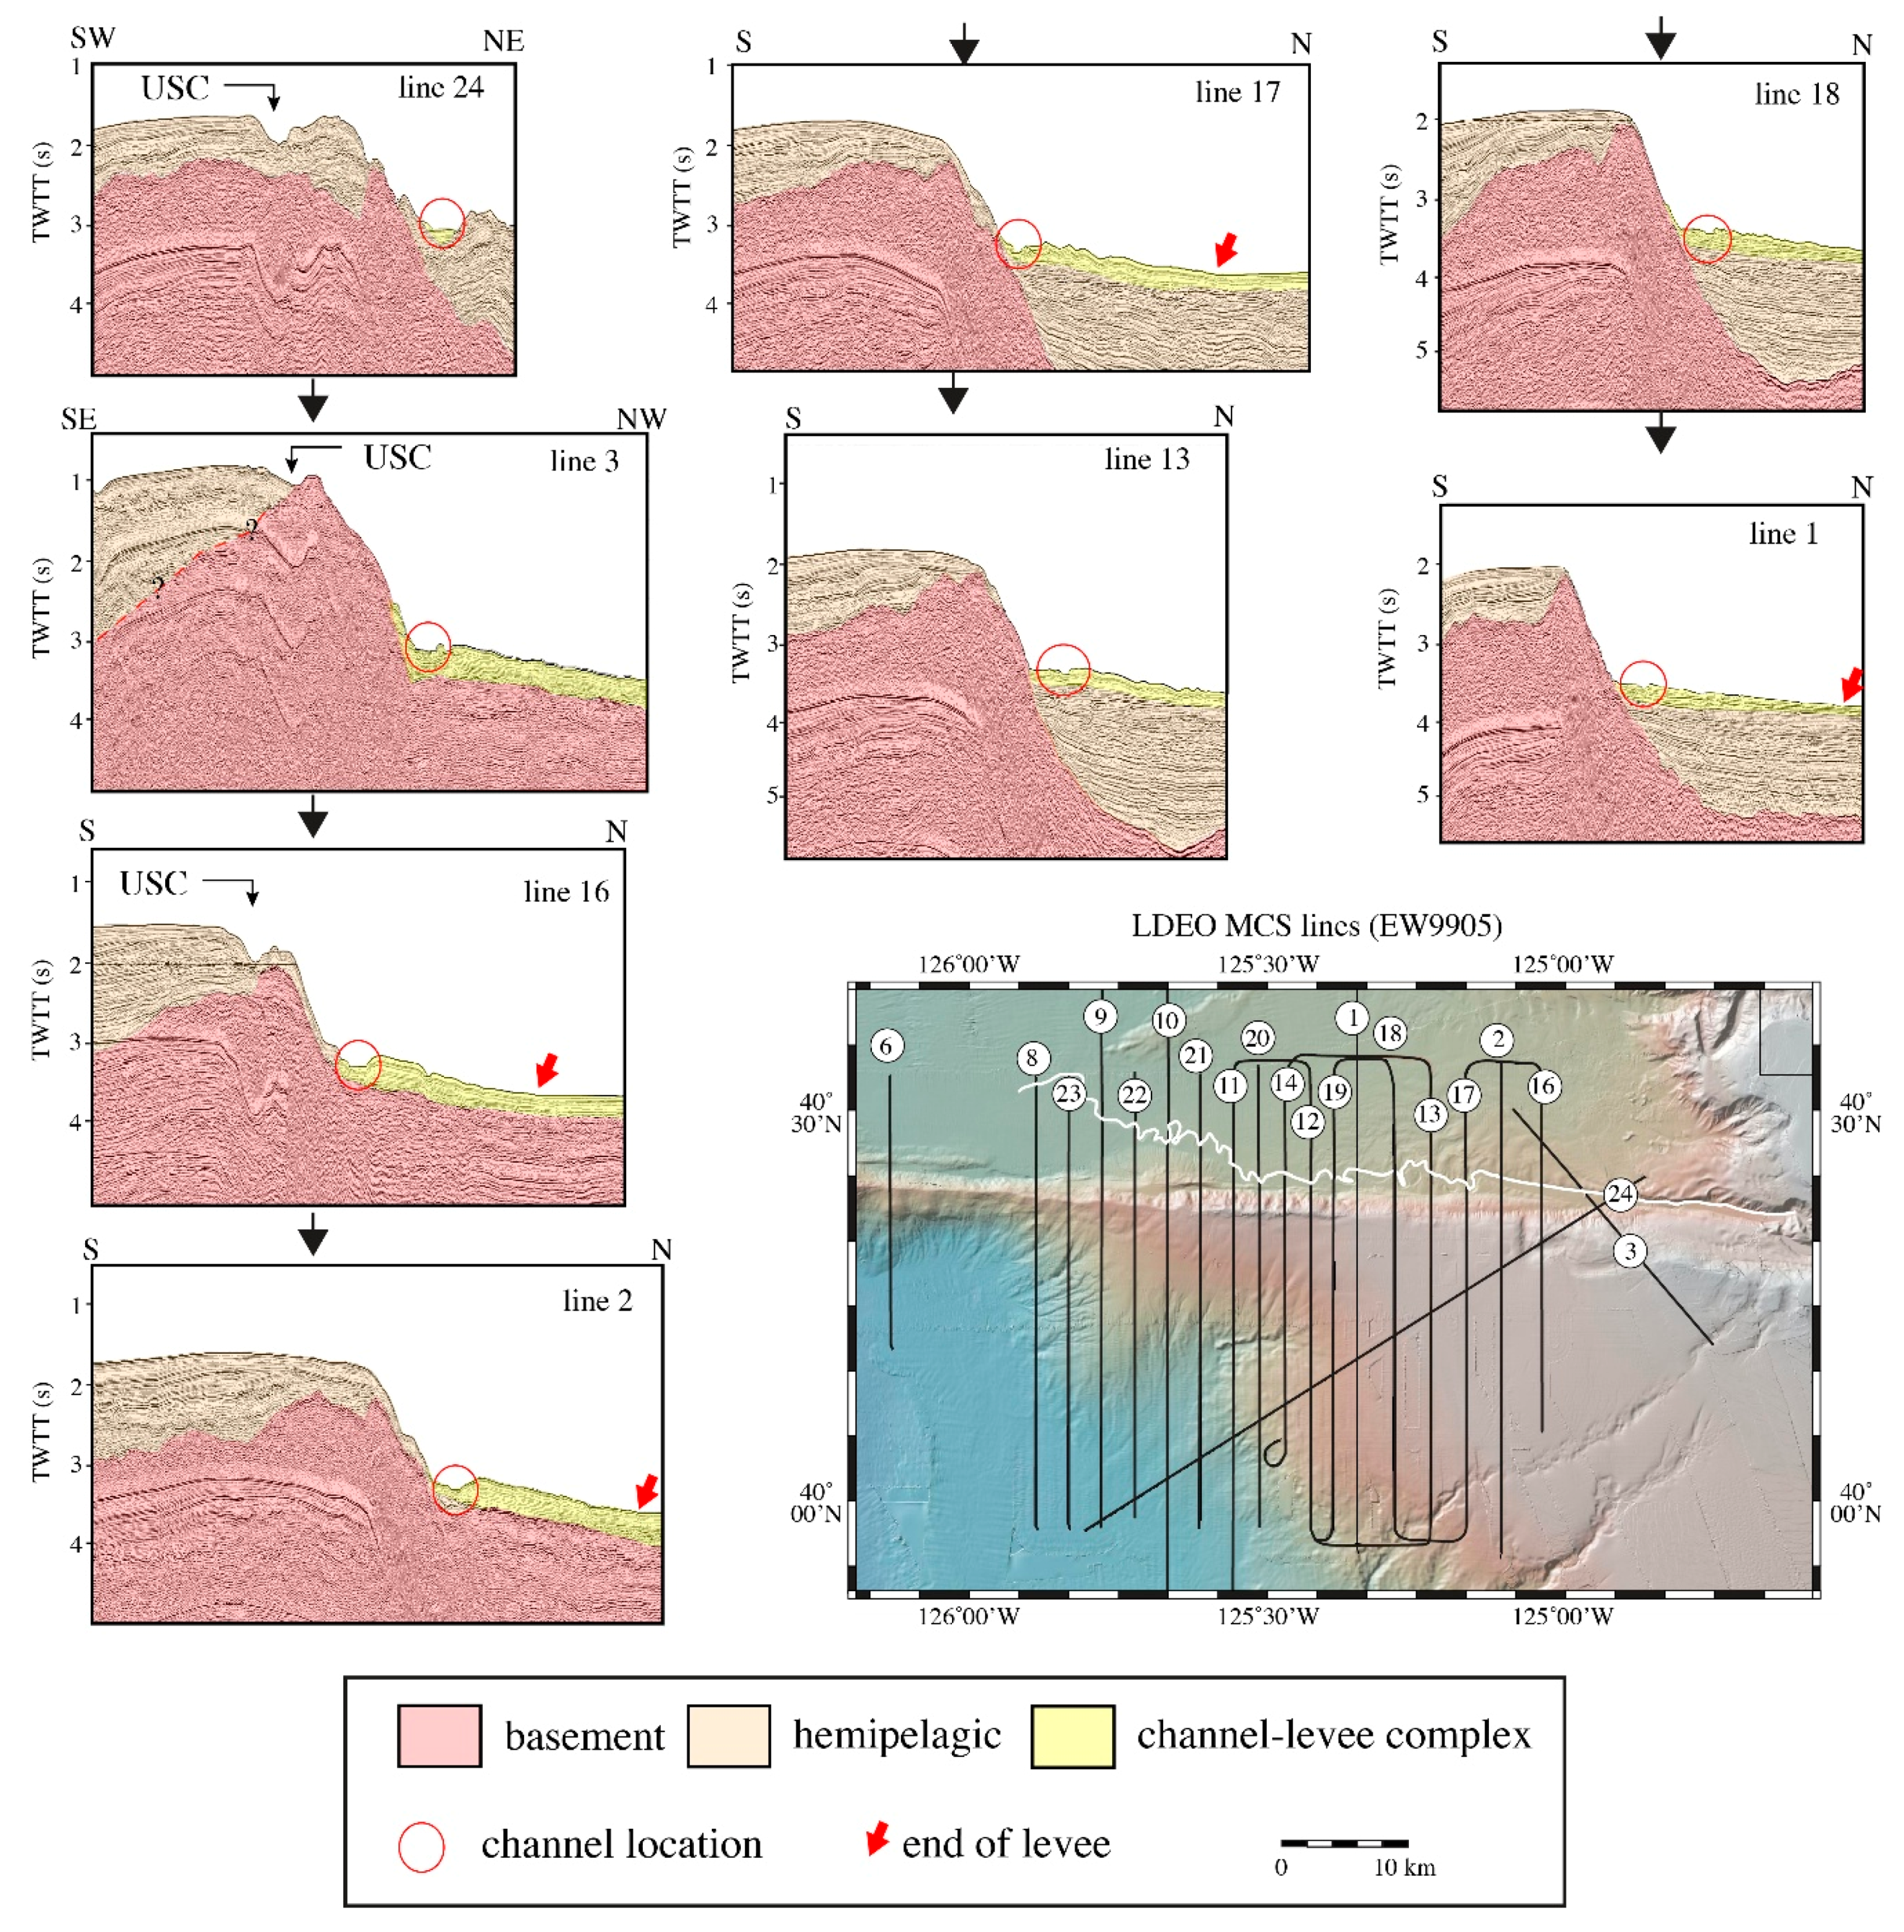
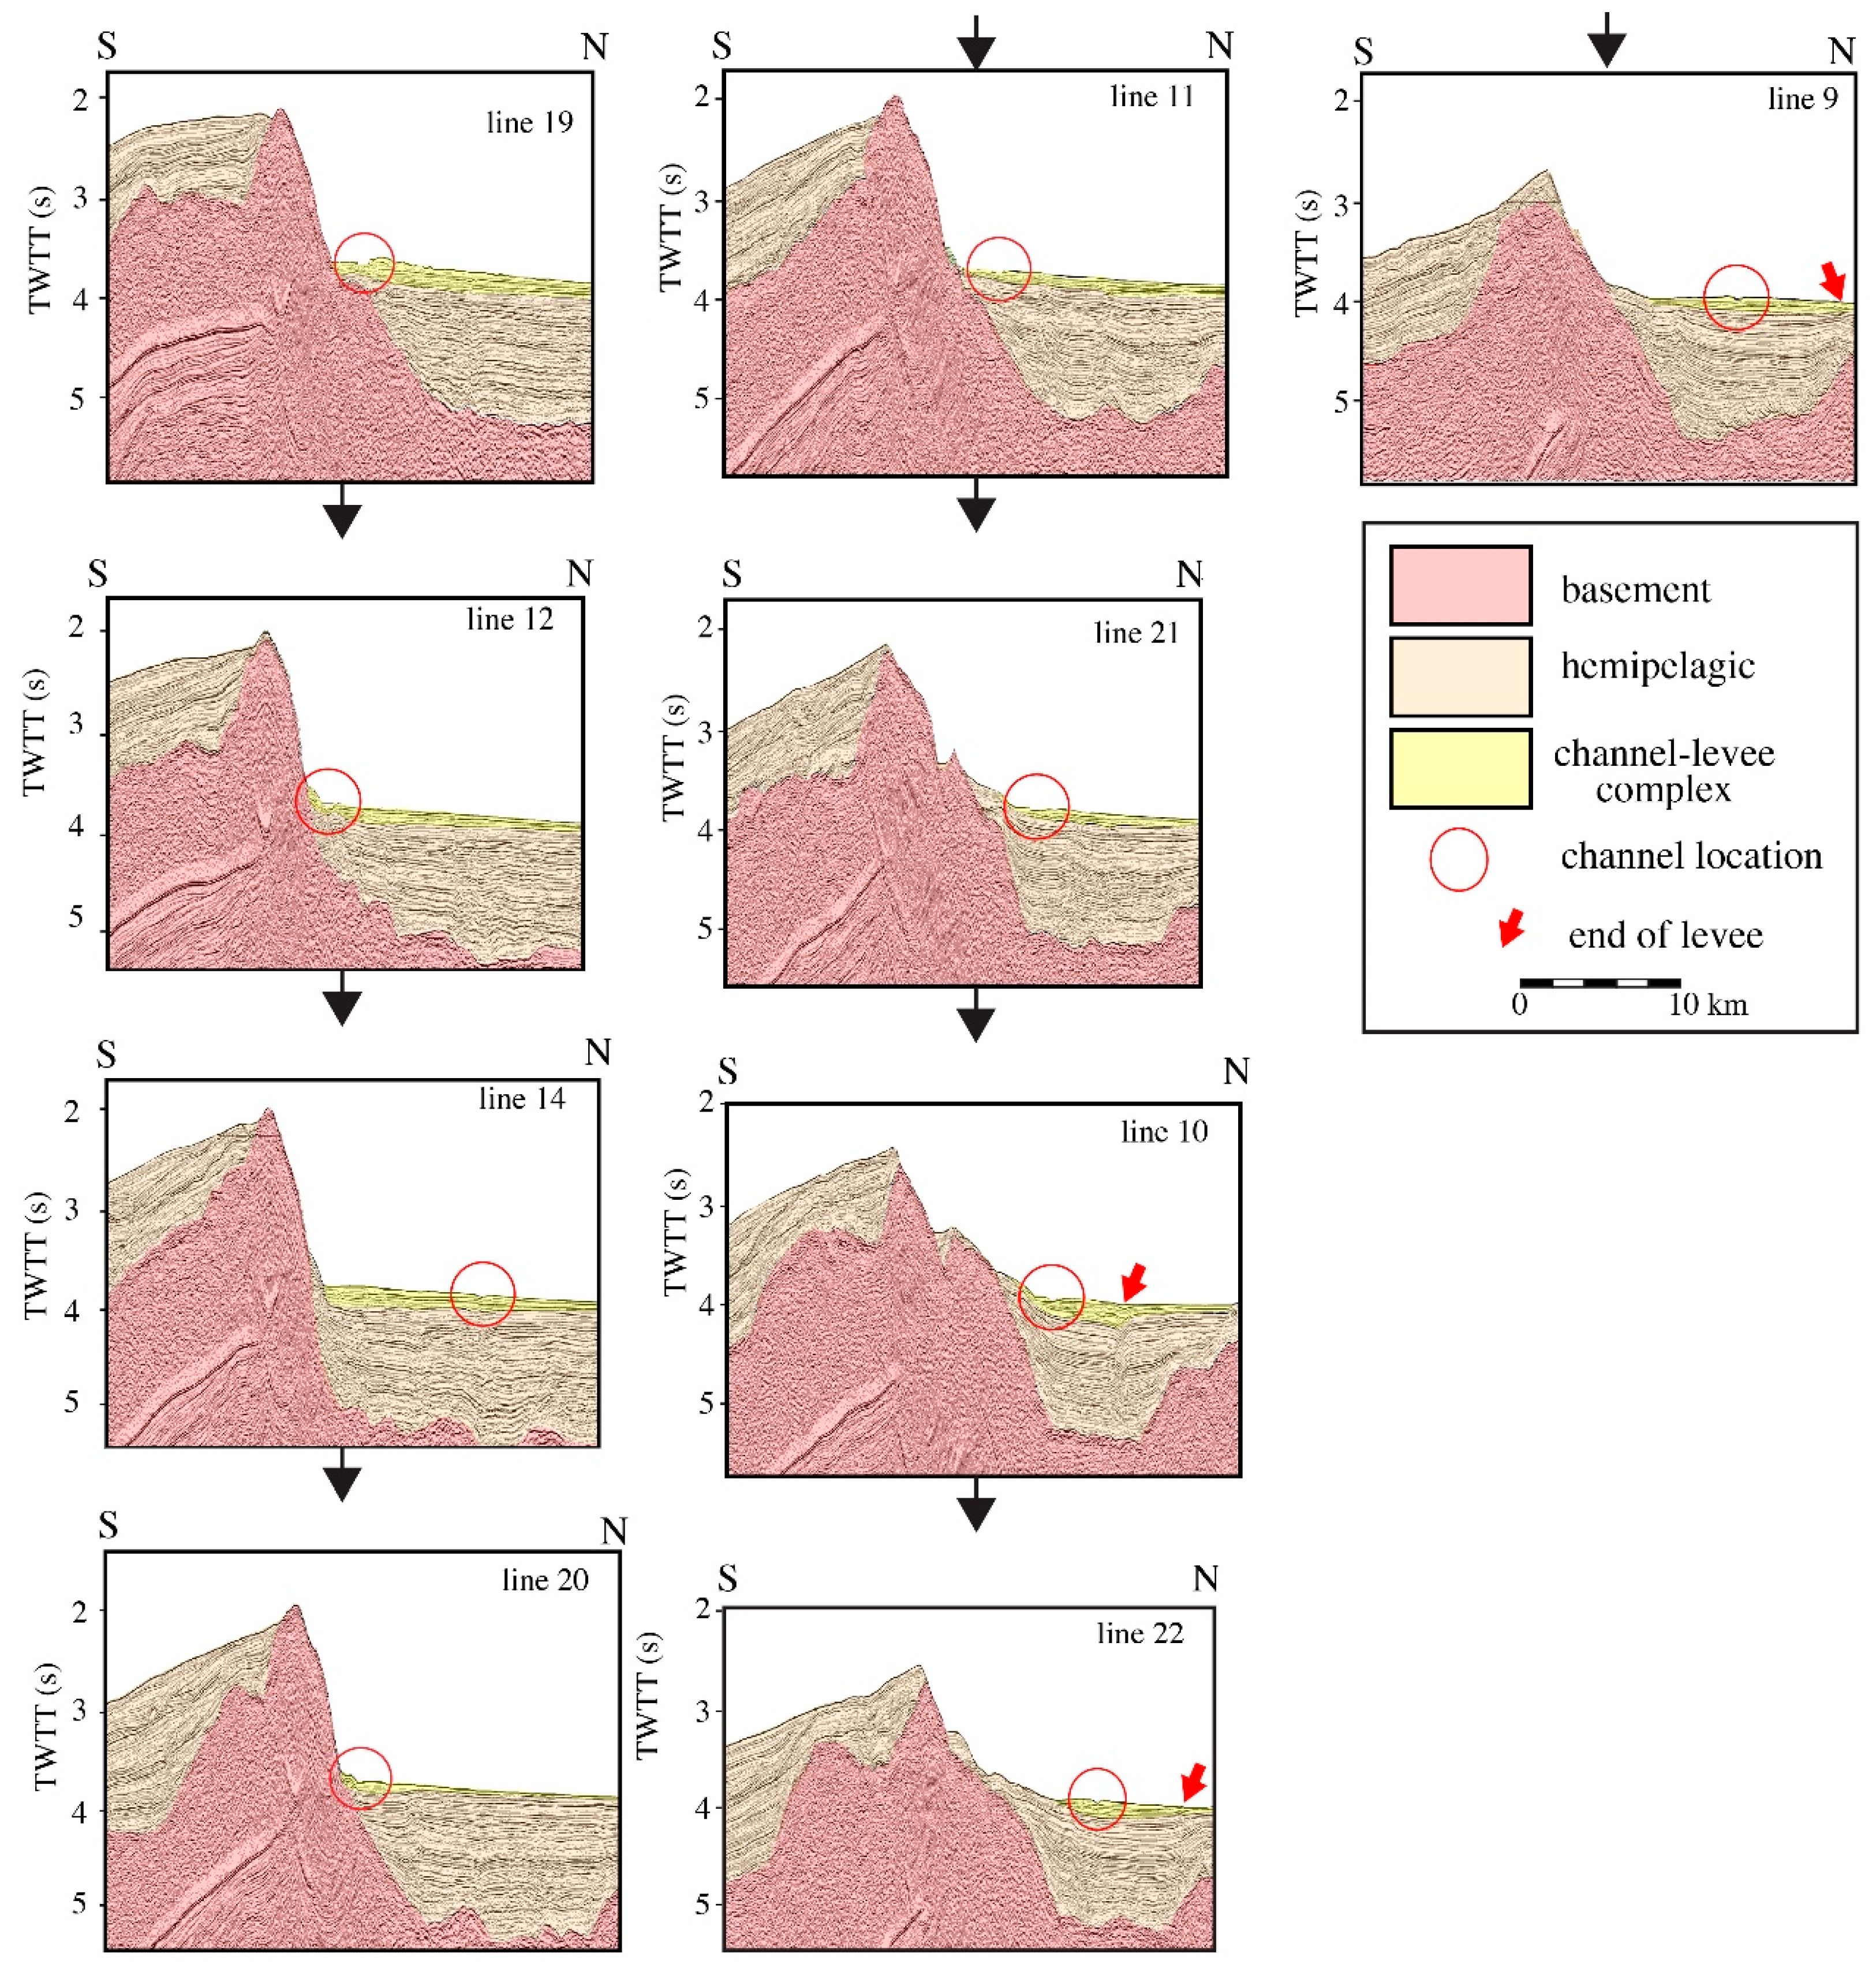
The regional bathymetry suggests the southern boundary of Eel Fan is just to the north of the new MBES bathymetry. Tréhu et al. [25] reported on a series of N-S multichannel seismic profiles that cross a section of Gorda Escarpment that includes Mendocino Channel. The profiles (Figure 4) show that Mendocino Channel is perched against the north wall of Gorda Escarpment and has constructed a levee to the north, overlapped in places by landslide deposits and buried in other places by distal sediments of Eel Fan. The channel-levee complex is more than 250 m thick in places and was deposited above a thick deformed hemipelagic sequence that probably represent sediments of Eel Fan as well as landslide deposits.
Mendocino Channel evolves from two canyon heads, Mendocino and Mattole Canyons, that incise the northern California margin [5] (Figure 2). Mattole Canyon channel has been captured by Mendocino Canyon channel 22 km down-canyon and then evolves as a single channel that stretches for at least 148 km to the west-northwest. The channel trends parallel to Gorda Escarpment for 90.5 km before it has been diverted to the NW around a large landslide deposit that originated on the north flank of Gorda Escarpment. At this point, the channel trends NW away from Gorda Escarpment for at least another 48.5 km before the channel turns back on a more westerly trend for an additional 9.4 km. The MBES bathymetry no longer resolves the channel at 148 km down-channel, which is ~114 km east of Gorda Ridge (Figure 1). The average slope of the channel is 0.48° (8.4 m/km) from the capture point to the distal western-most point that is resolved by the multibeam bathymetry.
Water depths of the floor of Mendocino Channel range from 1764 m at the capture point to 3025 m at the western-most extent. Landslides are prominent features on the continental margin adjacent to the eastern 25 km of Mendocino Channel as well as along the north wall of Gorda Escarpment. The California margin immediately north of the eastern reaches of the channel has one area of landslides that originated just north of Eel Canyon, another area of landslides just south of Eel Canyon, a landslide scar on the north levee of Mendocino Channel and a large landslide off the north wall of Gorda Escarpment (Figure 2). The landslide just south of Eel Canyon scattered debris at least 18 km away onto the basin floor. The landslide events are undoubtedly related to the high seismicity of the Mendocino Triple Junction and Transform Fault.

3. Multibeam Echosounder Data

The multibeam bathymetry and acoustic backscatter were collected with the NOAA Ship Okeanos Explorer equipped with a hull-mounted Kongsberg Maritime EM302 MBES system. This MBES system transmits a 0.5° wide fore-aft swath and forms up to 864 athwart-ship 1° receive apertures over a maximum swath of 150°. Individual soundings along track are spaced approximately every 20 m, regardless of survey speed.
An Applanix POS/MV 320 version 4 motion reference units (MRU) was used to correct for changes in instantaneous ship heave, pitch, roll and heading. The EM302 system can incorporate transmit beam steering up to ±10° from vertical, and yaw and roll compensation up to ±10°. The MRU was interfaced with a C&C Technologies C-Nav differential-aided GPS (DGPS) receiver that provides real-time correctors to the DGPS position fixes, providing spatial accuracies of <±0.5 m. All horizontal positions were georeferenced to the WGS84 ellipsoid and vertical referencing was to instantaneous sea level.
Water-column sound-speed profiles were calculated from casts of calibrated Sippican model Deep Blue expendable bathythermographs (XBTs) that measured to 760 m maximum water depth. XBT casts were routinely made every 6 h and between scheduled casts whenever the difference between measured sound speed at the transducers differed by more than 0.5 m/s from the sound speed calculated from the XBT value at the depth of the transducer.
The Kongsberg EM302 is capable of simultaneously collecting co-registered full time-series acoustic backscatter along with bathymetry. The backscatter data represent a time series of backscatter measurements across each individual beam footprint on the seafloor. If the received backscatter amplitudes are properly calibrated to the outgoing acoustic signal strength, receiver gains, spherical spreading, and attenuation, then the calibrated backscatter should provide clues about the composition of the surficial seafloor.
A digital terrain model (DTM) was constructed from the MBES bathymetry into a non-projected geographic grid with a resolution of 40 m/pixel using a weighted moving average with a weight diameter of 3 that provides a minimum of 8 of the nearest soundings to influence each grid node of the DTM [26]. The multibeam DTM was combined with a bathymetry grid from the NOAA Coastal Relief Model (CRM) (http://www.ngdc.noaa.gov/mgg/coastal/crm.html) to provide a complete view of the eastern 50 km of the canyon-channel system. The CRM is a compilation of NOAA hydrographic surveys and university single-beam and multibeam bathymetry data gridded at 90 m/pixel. All map and perspective figures in this report were generated from this DTM. Similarly, the MBES backscatter data were gridded at 40 m/pixel and draped over the co-registered MBES bathymetry.

4. Channel Descriptions

Schumm and Brakenridge [27] subdivide fluvial pattern morphologies into (1) straight channels; (2) sinuous-thalweg straight channels; (3) meandering channels; (4) and braided channels. They cite experimental and field studies that have shown that critical thresholds in stream power, gradient and sediment load lead to changes in channel pattern. Although their conclusions may not be relevant to submarine channels because of differences in densities between air and river waters and between oceanic bottom water and turbidity currents, their insights suggest that those three parameters might be important to the formation of submarine channel planforms. Unfortunately, two of those three parameters (stream power and sediment load) are unknown in Mendocino Channel although channel gradient is easily measured from the multibeam bathymetry. Nevertheless, the spirit of their subdivision of channel patterns was used to segment Mendocino Channel.
Mendocino Channel was subdivided into 6 reaches based on the planform geometry. The complete channel includes the following segments: (1) Mendocino and Mattole Canyon channels; (2) USR, an upper straight reach; (3) USinR, an upper sinuous reach; (4) a crevasse splay; (5) LSinR, a lower sinuous reach; and (6) LSR, a lower straight reach. These segments follow in a progression from the continental shelf to the western extent of Mendocino Channel. Each reach has distinct characteristics, as discussed below, that made the subdivision obvious. Although the crevasse splay is not described as a reach, it was identified by planform geometry as such a unique feature that it merited its own subdivision.
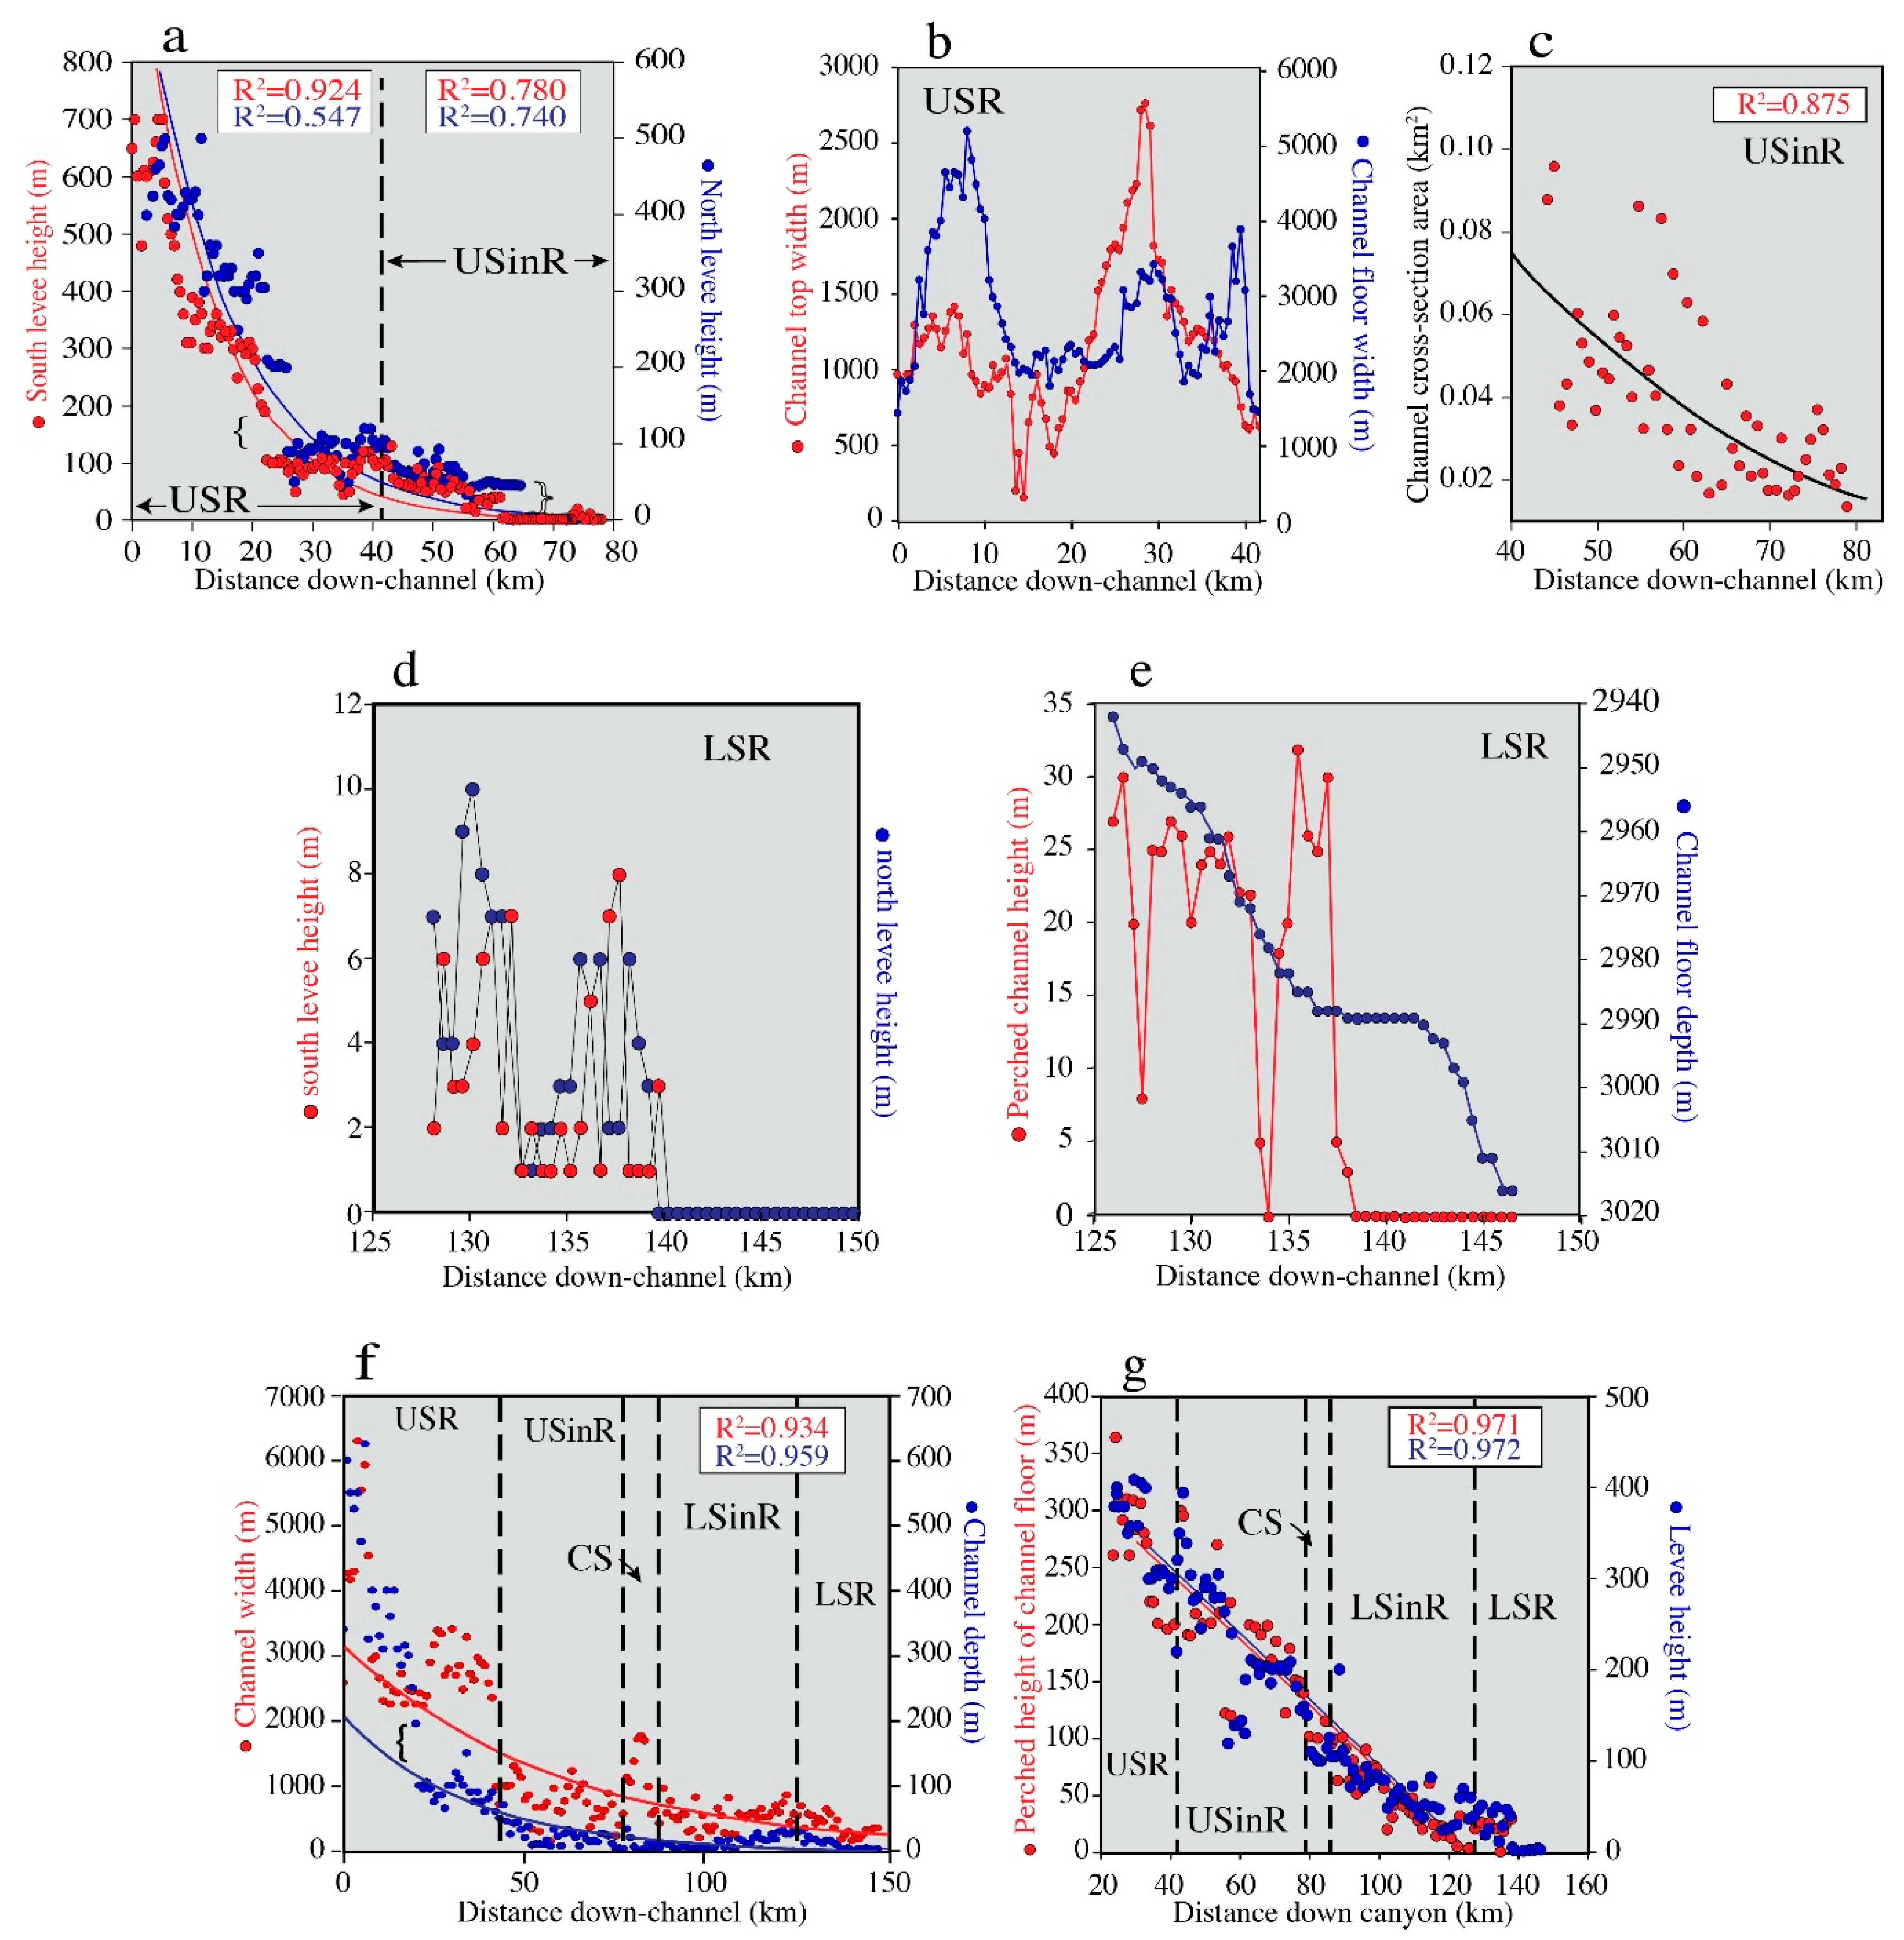
Measurements were taken every 0.5 km along the thalweg of the entire length of Mendocino Channel with the junction of Mattole and Mendocino Canyon channels as 0 km. The measured channel parameters include (1) channel floor width; (2) channel top width; (3) channel vertical relief; (4) south-side levee height above the channel floor; (5) north-side levee height above the channel floor; (6) channel cross-sectional area calculated using the formula for a trapezoid; (7) water depth of channel floor and (8) perched height of channel floor above basin depth (Figure 5). Of these measurements, relationships were found with levee heights, channel floor with channel top width, channel cross-section area, water depth of channel floor, perched height of channel floor, all with respect to down-channel distance. Other parameters typically measured in submarine channel meanders were measured (e.g., meander radius of curvature, meander wavelength, meander amplitude) but no statistically significant relationships were found.

4.1. Mendocino and Mattole Canyon Channels

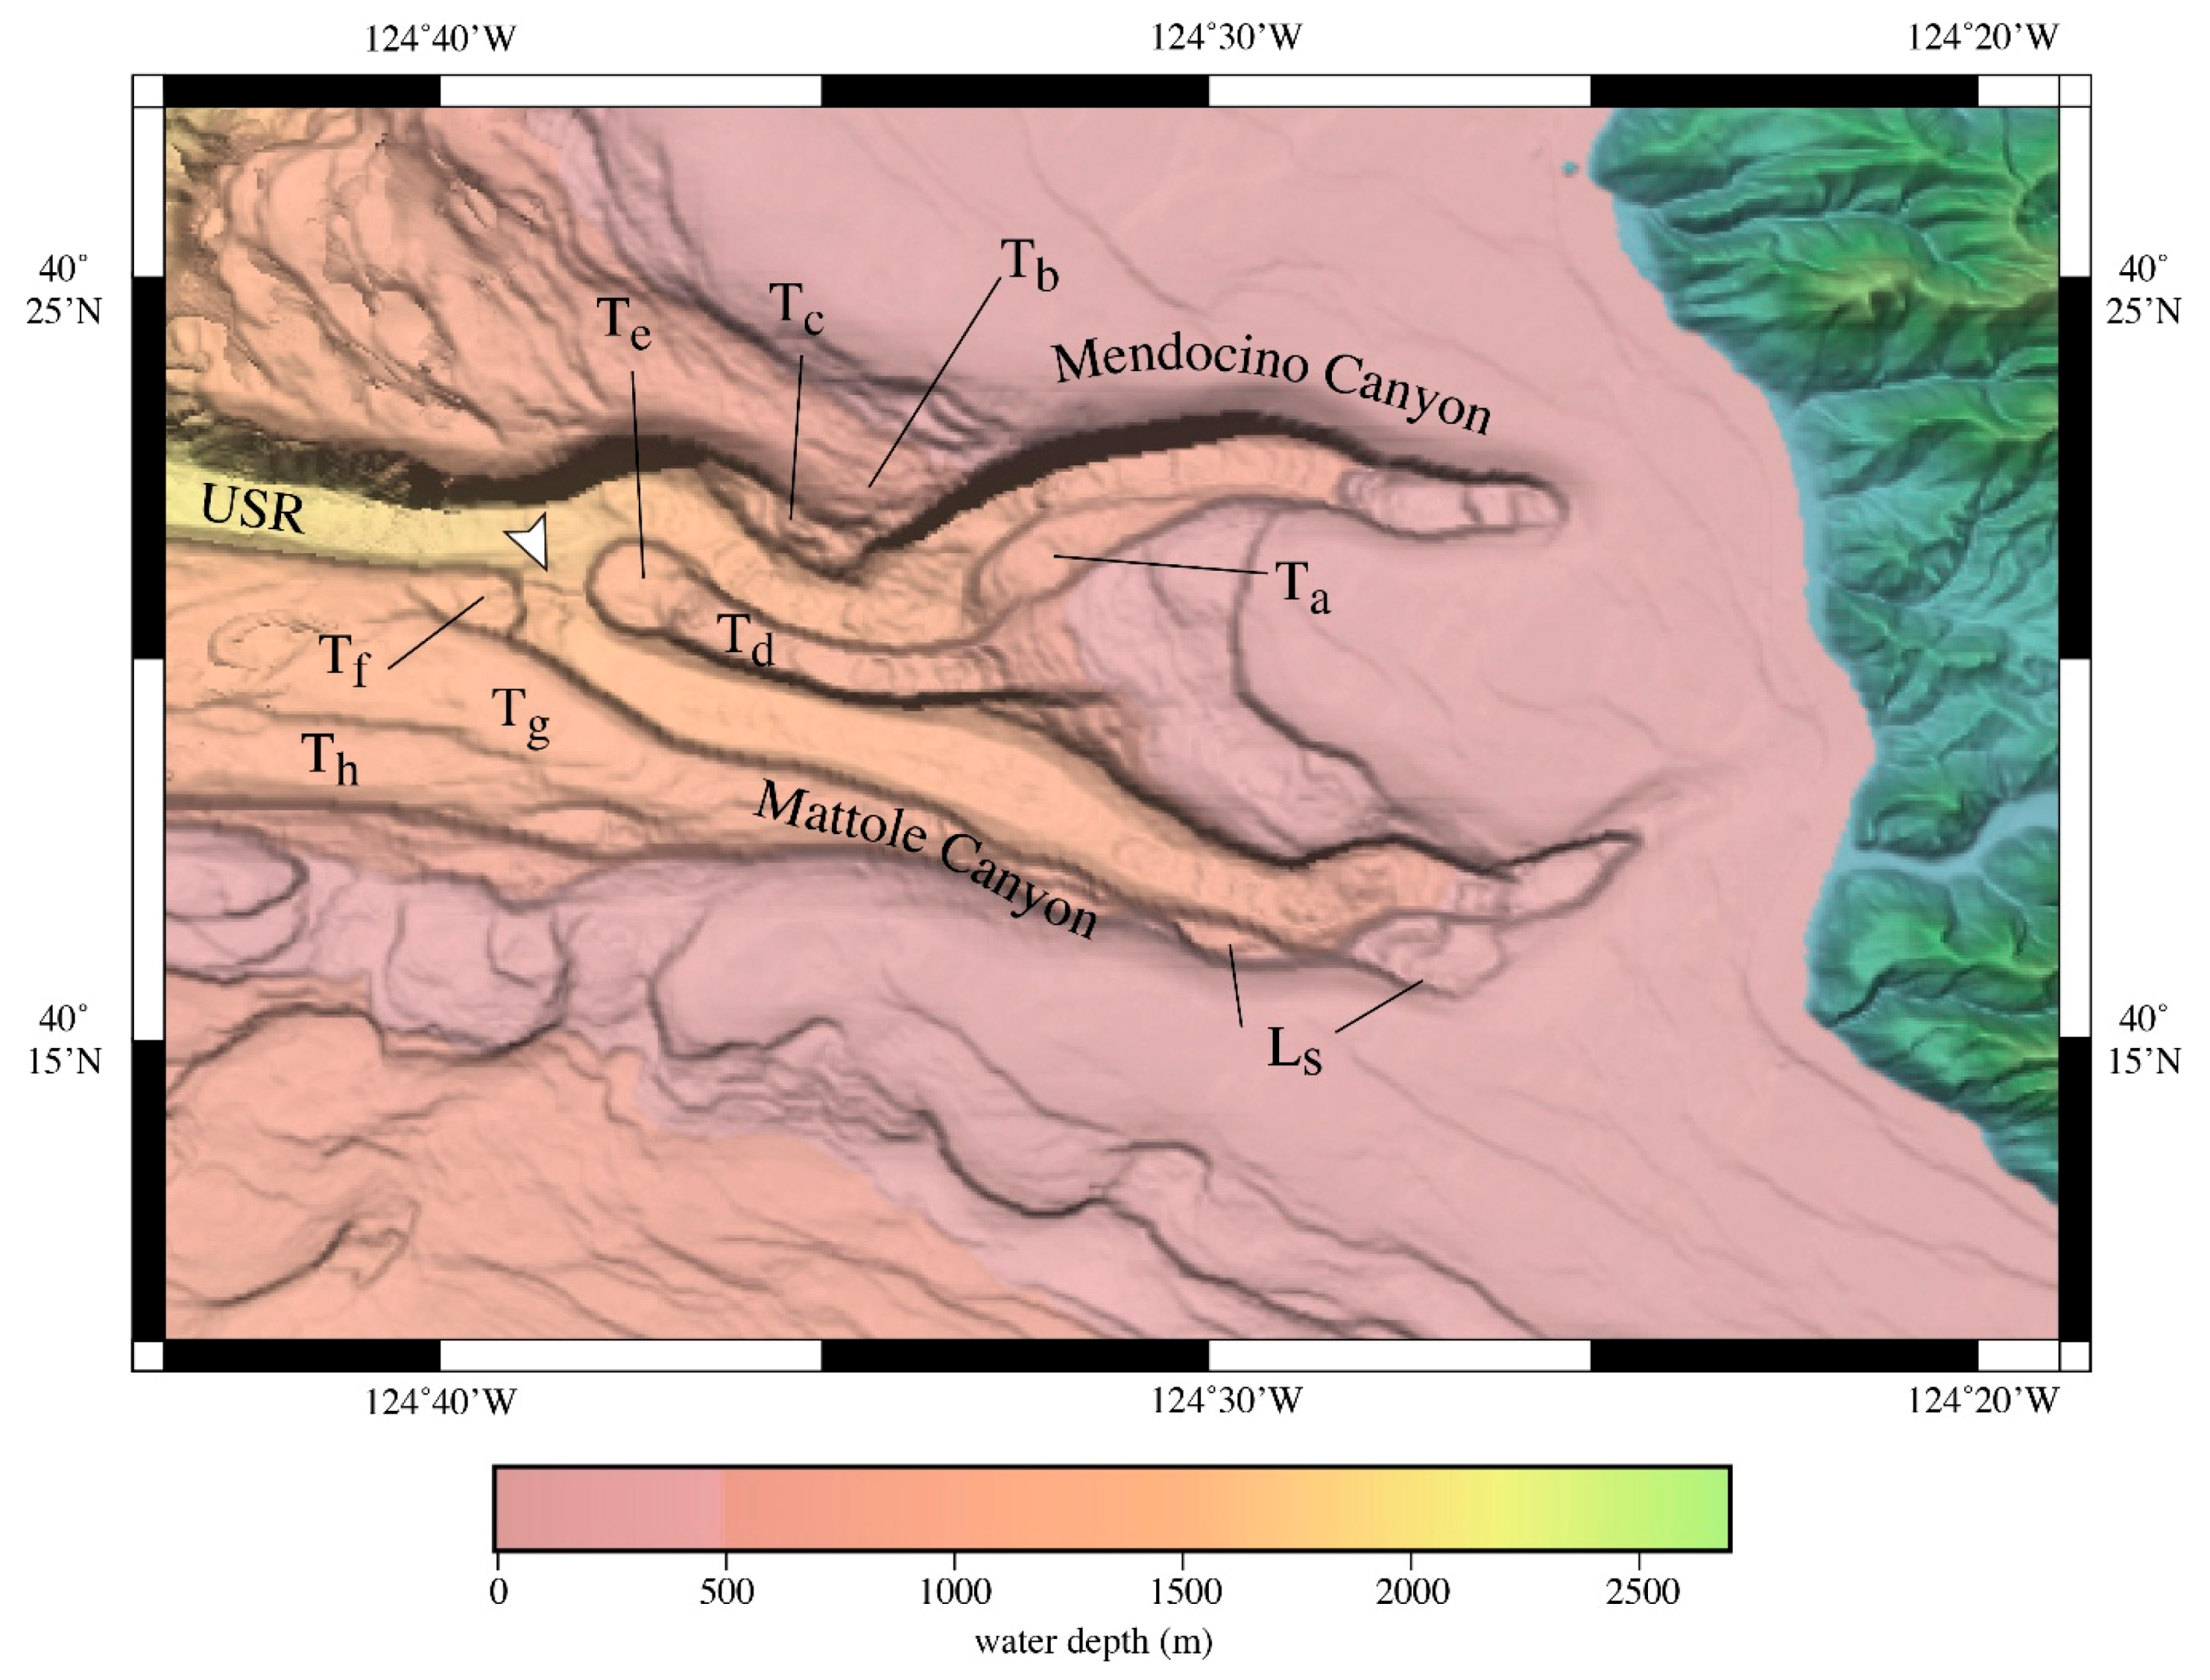
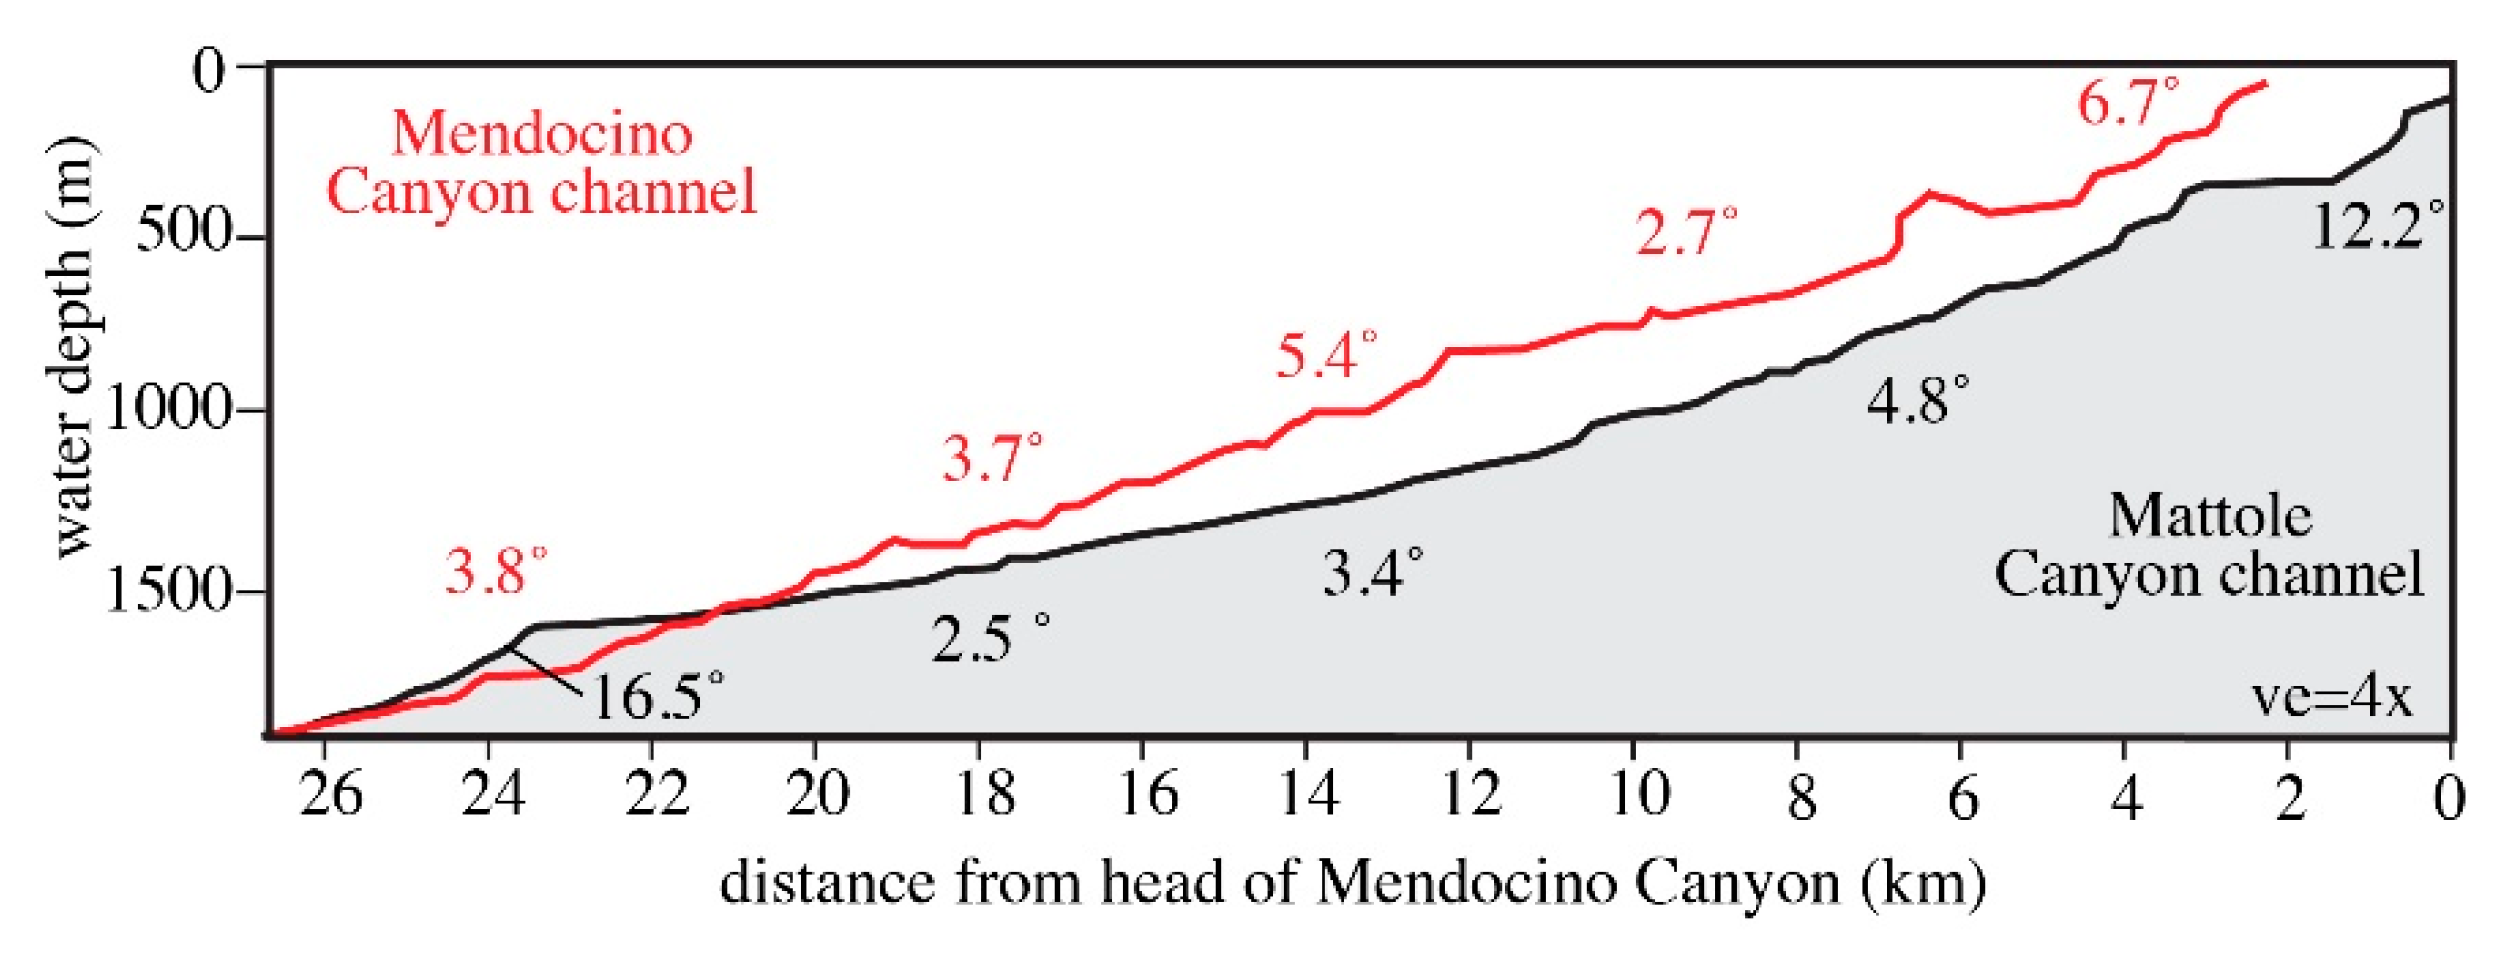
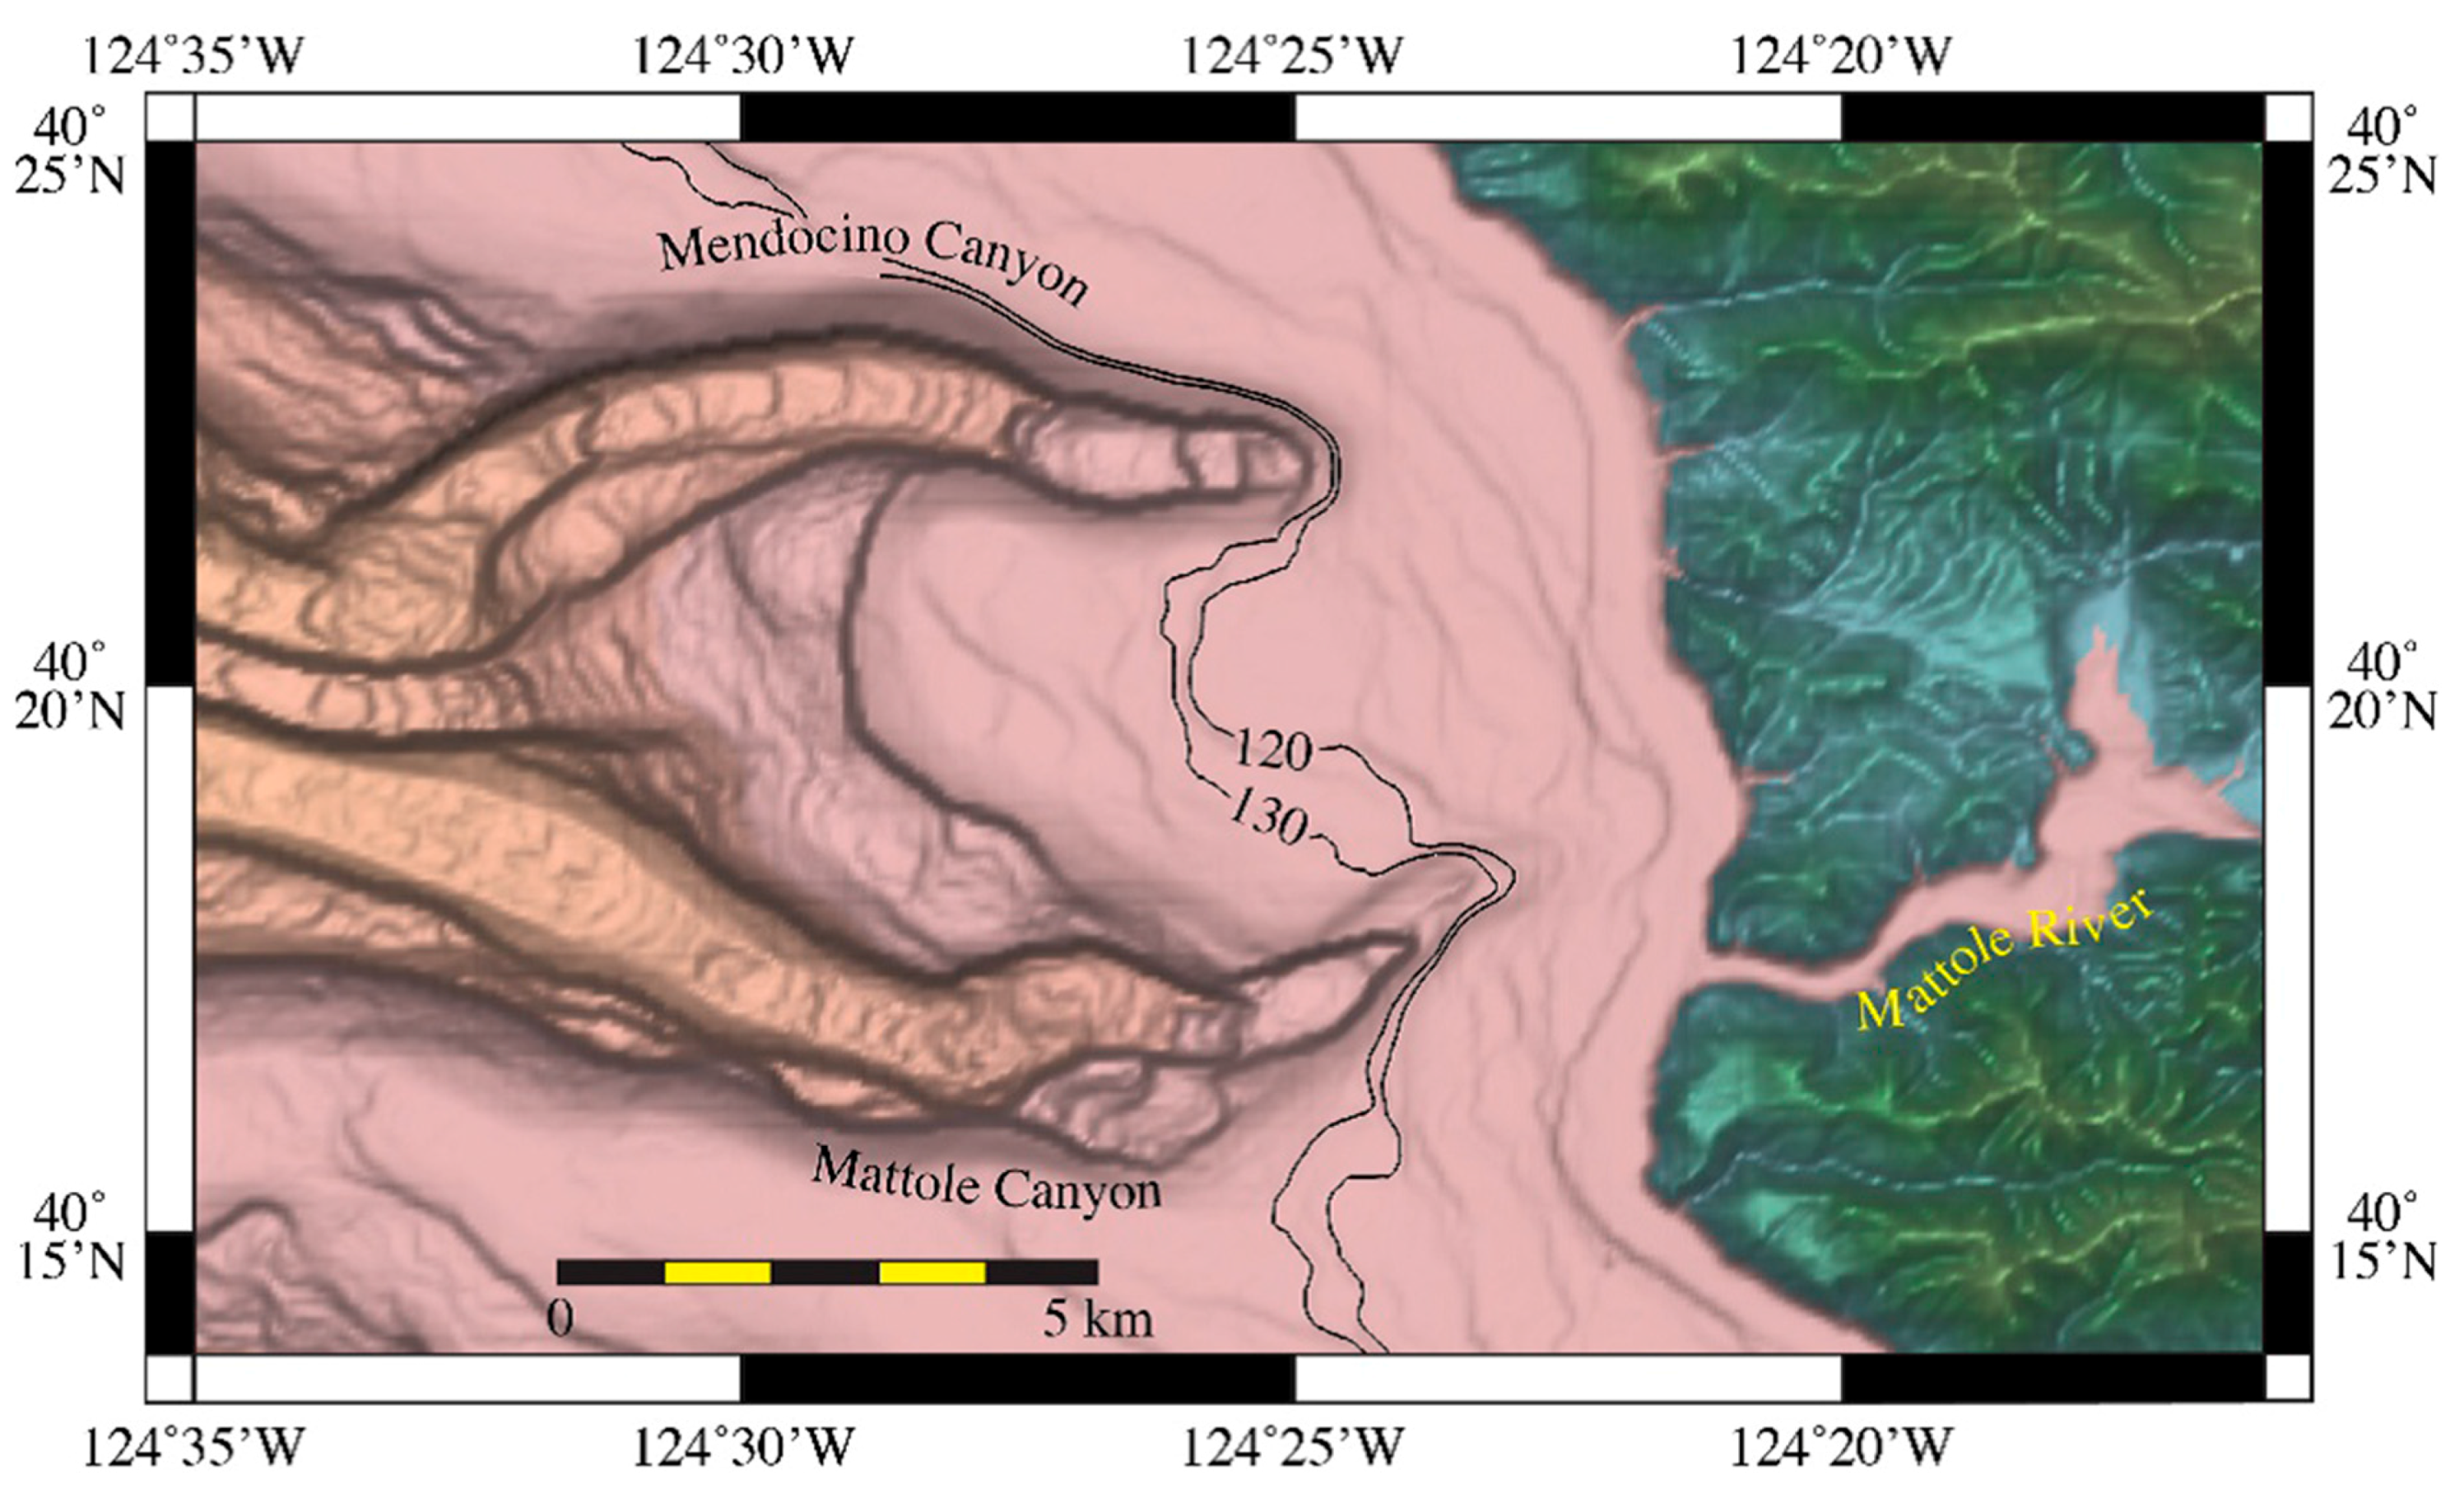
Mendocino Channel begins where Mendocino Canyon channel captured Mattole Canyon channel at the base of the northern California margin (white arrowhead on Figure 2 and Figure 6). The upper reaches and junction of Mendocino and Mattole Canyons were first illustrated and discussed by H.W. Murray in the late 1930s (www.history.noaa.gov/stories_tales/mendocino.html). Murray’s bathymetry was generated from a compilation of more than 80,000 laboriously collected lead-line soundings taken over a 3-year period and provides a remarkably good general overview of the two canyons, although Mendocino Channel was not discovered. Shepard and Dill [28] (their Figure 47) published a version of Murray’s map in 1966. The combined MBES and CRM bathymetry provides for the first time an accurate and high-resolution view of the two canyons that shows their complexities. The head of Mendocino Canyon is at a water depth of 109 m (Figure 6) with an overall gradient of 6.33°. Mendocino Canyon channel has a rough and stepped subtle concave-down descent with 7 distinct step-downs that range from 30 to 172 m (Figure 7). The widths of the broad U-shaped canyon valley progressively increase from 1 km at the proximal end to 2.47 km wide at the distal end just east of the capture point. A large 900 m wide, 4 km long terrace stands 200 m above the canyon channel floor on the gentle inside bend of the first bend of the valley (Ta on Figure 6). About 2.5 km down-canyon, a two-stepped tilted terrace occurs on the inside of the next bend (Tb and Tc on Figure 6). The lower terrace (Tc) stands about 350 m above the canyon channel floor and the higher terrace (Tb) stands 730 m above the floor. A flat unpaired terrace (Td) occurs across the channel from terrace Tc on the south bank (Td on Figure 6) that stands 355 m above the Mendocino Canyon channel floor. The canyon valley makes a sharp 40° left bend just down-canyon from the Tc terrace and immediately before the capture of Mattole Canyon channel. The upper reaches of Mendocino Canyon channel have no apparent incised thalweg, although any thalweg with less than 0.5 m of relief would be below the vertical resolution of the MBES in these water depths.
The head of Mattole Canyon has a water depth of ~74 m and begins as a gentle swale only 960 m from the present shoreline. The canyon is 26.8 km long with a gentle concave-up surface that has a two-step (40 and 80 m) descent along the reach (Figure 7), with an overall gradient of 4.09°, before it is captured by Mendocino Canyon channel and the two channels evolve into the upper Mendocino Channel at a water depth of 1773 m (Figure 6 and Figure 7). The initial 6.3 km of Mattole Canyon has a southwesterly trend with a broad zig-zag pattern of 3 reaches with lengths of 2.3, 2.1 and 1.9 km from the canyon head. The canyon channel then continues with a 17.3 km linear reach that trends N69W. Mendocino Canyon captured Mattole Canyon at this point and left an abrupt 80 m 16.5° slope down to the floor of the main Mendocino Channel (white arrowhead on Figure 6). The floor of Mattole Canyon descends to the confluence with Mendocino Canyon with numerous small steps mostly with less than 20 m of relief.
The width of the floor of Mattole Canyon channel varies from 515 m at the canyon head to 1155 m at the junction with Mendocino Canyon but the widest section of the canyon floor at 1.65 km occurs in a 3.8 km-long section area centered 12.8 km down canyon. Mattole Canyon has a three-step terrace just above the capture point with heights above the channel floor of 310, 510 and 660 m (Tf, Tg and Th on Figure 6). The three terraces Tf, Tg and Th are unpaired with terrace Td. Two scarps (Ls on Figure 6) occur on the southern wall of Mattole Canyon and the canyon-channel floor adjacent to the scarps is much rougher than the canyon floor farther down.

4.2. Mendocino Channel Upper Straight Reach

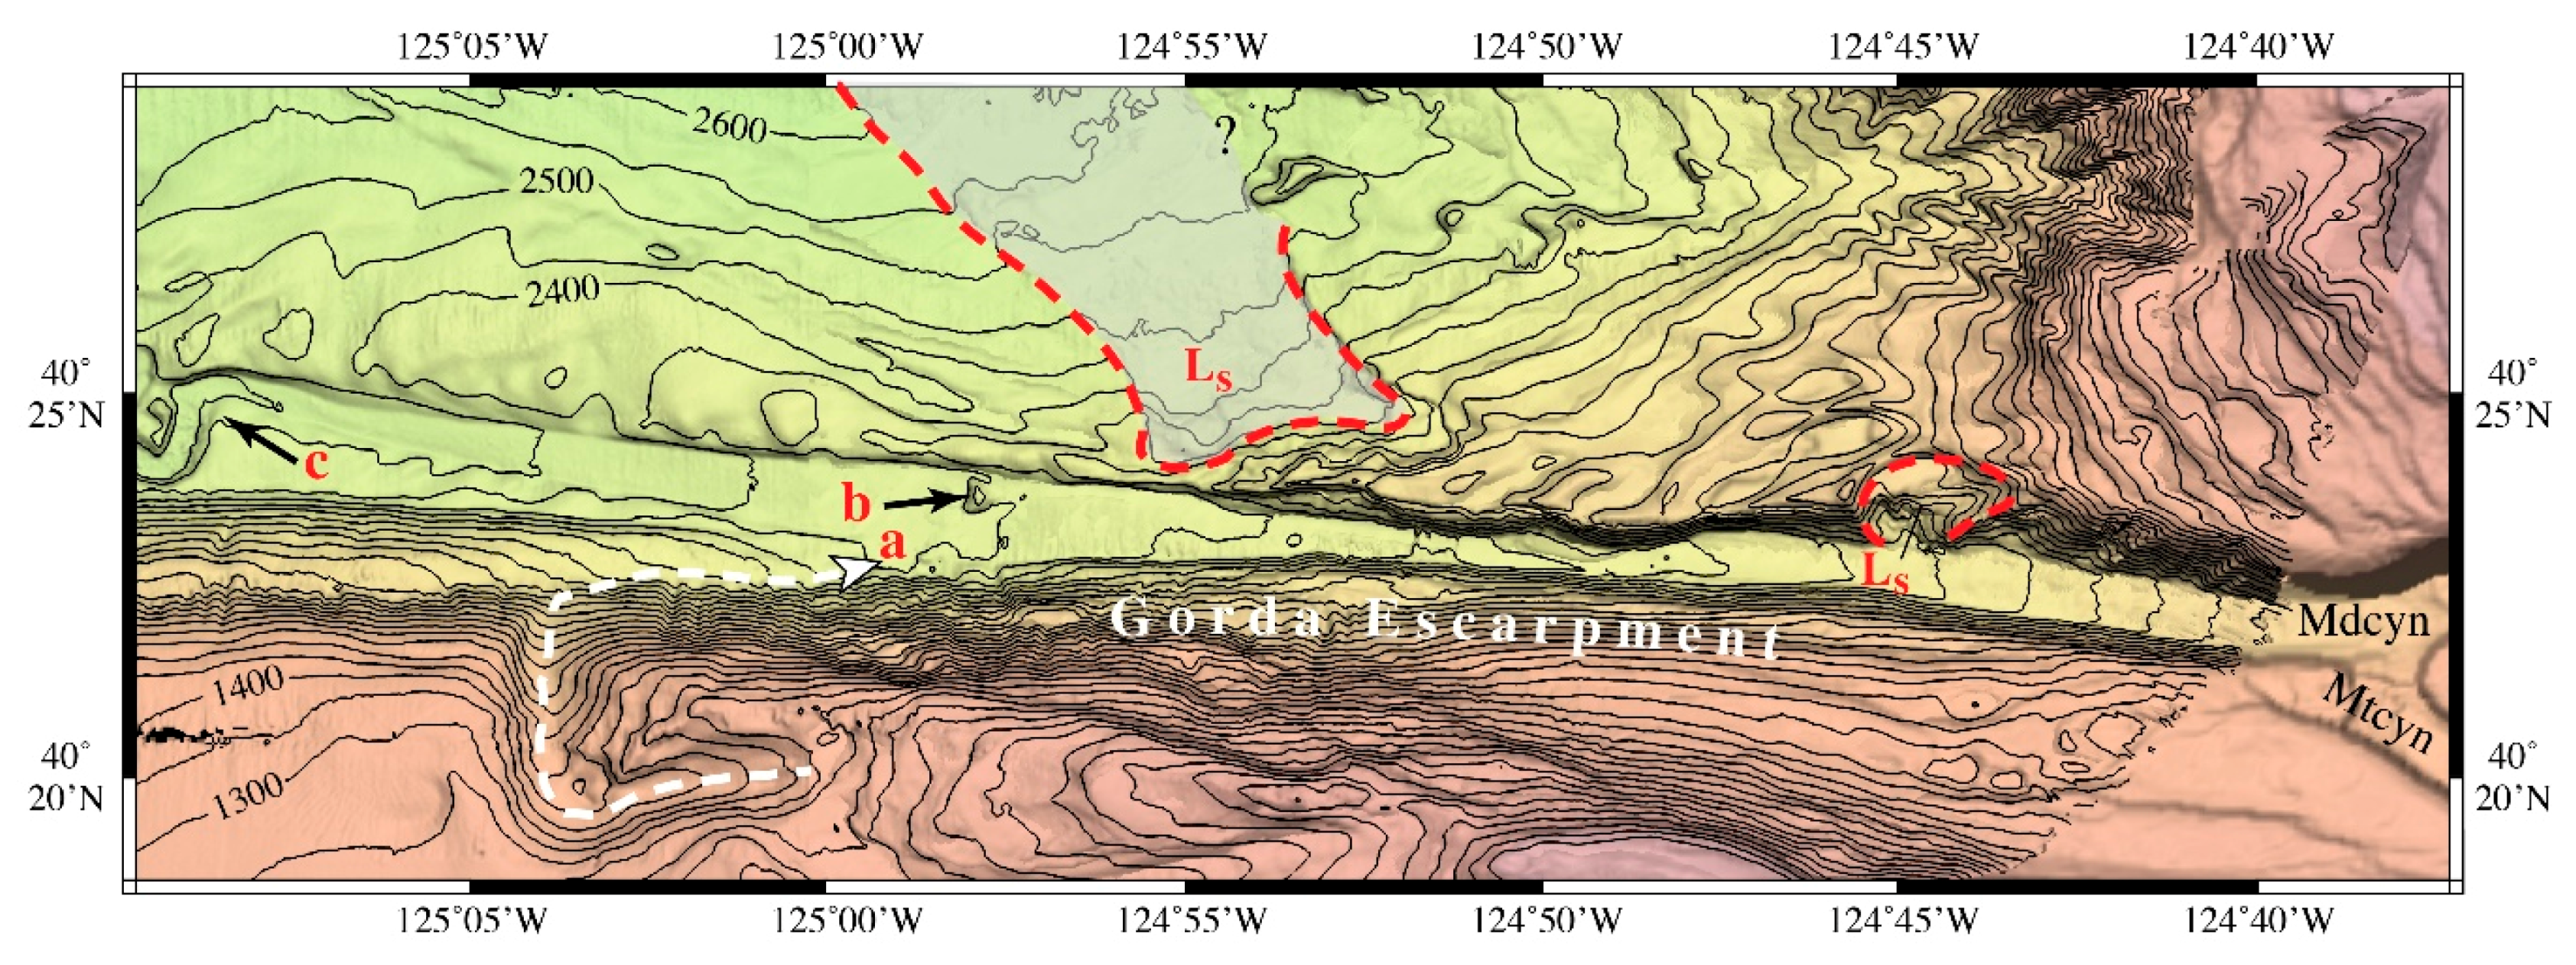
The south side of first 12 km of the USR is constrained by the steep (>20°) wall of the Gorda Escarpment whereas the first 12 km of the north side of the USR is flanked by the steep wall of the continental margin and then landslide deposits shed off the California margin (Figure 2 and Figure 8). The channel hugs the north wall of Gorda Escarpment along all but the last 12 km of its length. The upper straight reach extends west in a nearly straight strike for 41.6 km from the capture point of Mendocino and Mattole Canyon channels and ends at a sharp left-hand 90° bend to the south towards the wall of Gorda Escarpment (“c” on Figure 8). The channel floor is 1.1 km wide at the head of the reach and is 4.2 km wide at the top of the channel valley (Figure 5b). The channel floor descends at a smoothly decreasing gradient from 2.83° at its eastern edge to a point 15 km down-channel where the floor is only 145 m wide with a gradient of 1.88°; the top of the channel valley is 2.2 km wide at this point. From this point, the floor of the USR becomes progressively wider down-channel to a maximum floor width of 2.7 km at 31 km down channel and the valley top attains a maximum width of 3.6 km at its western limit. The USR is perched 365 m above general basin depths but slowly descends to 200 m at its down-channel boundary (Figure 5g).
A side channel heads on the eastern summit region of Gorda Escarpment (Figure 8 and Figure 9). The channel was first described by Tréhu et al. [25] and is clearly shown in their seismic data (Figure 4, lines 3, 16 and 24). The new MBES bathymetry shows that the upper side channel does not head in a canyon or even on the margin, but simply appears as a broad shallow swale at the 750 m isobath on a broad high. The first 12.2 km of the upper side channel is relatively straight, but then the channel makes an abrupt series of three near 90° bends before the channel plunges down the north-facing Gorda Escarpment. The upper side channel appears to make yet another 90° bend on a bench about 300 m above the USR floor and traverses east along the bench for another 6.4 km before it enters the USR channel floor at 26.8 km down-channel. At this point, the upper side channel makes an abrupt 120° bend to trend down-channel (west) but no longer can be identified on the MBES bathymetry. However, at the point where the upper side channel enters the USR, the MBES acoustic backscatter abruptly increases from −27 dB to −20 dB and the high backscatter is concentrated along the northern edge of the USR (Figure 9c). From this point on down-channel, the backscatter of the floor of USR spreads out across the channel floor and is consistently between −22 and −20 dB. A 2–5 m high bench occurs on the north side of the channel floor from this point to the end of the reach that reflects sediment from the upper side channel. A large solitary mound sits on the main channel floor at just the point where the side channel reaches the main channel floor (“a” on Figure 8 and Figure 9). The mound has 60 m of relief and basal dimensions of 700 × 940 m.
The head of the USR is perched 300–360 m above the basin water depths and descends 200 m above the basin depths at the end of the reach (Figure 5g). Levees appear at 12 km down-channel on the north bank of the channel and levee (plus undifferentiated landslide and mass transport deposits) heights decrease from 350 m high at 12 km down-channel to 200 m high at 21 km down-channel. At this point, there is a marked decrease in both north-side and south-side levee heights where the channel has moved beyond the immediate margin and trends out of the zone of landslide and mass transport deposits and onto the proximal basin floor (black curly bracket on Figure 5a). The levees are never higher than ~145 m throughout the remainder of the USR. There is a strong relationship (south levee R2 = 0.853 and north levee R2 = 0.830) of the levee heights with down-channel distance (Figure 5a). Also, there is a rough similarity in trends, but not in absolute values, of the width of the USR channel floor with the width of the USR channel top (Figure 5b). There is no statistical correlation (R2 = 0.275) between the channel floor widths and the down-channel distance. The channel floor width is 825 m at the beginning of the reach and decreases to a minimum of 210 m wide 16 km down-channel but then the channel attains a maximum width of almost 3000 m at 31 km down-channel. The width of the USR channel top decreases from a maximum of 4150 m wide at the beginning of the reach to a minimum of 1800 m wide at a point 20 km down channel. At this point, the channel floor width begins to decrease to a minimum of 100 m wide to the end of the reach. However, the channel top width is 3400 m wide at 32.5 km down-channel but decreases to only 1850 m at 35 km down-channel before increasing to 3690 m wide at 41 km down-channel.

4.3. Mendocino Channel Upper Sinuous Reach

The upper sinuous reach (USinR) is a 37.5 km section that begins 42.5 km down-channel and ends at 78.5 km down-channel with an overall gradient of 0.33°. The reach is perched 200 m above basin depths as it trends along the north wall of Gorda Escarpment and continues a westward descent to 140 m above basin depths at the western extent of the reach (Figure 5g). The north bank of USinR is bordered by the continuation of the extensive levee complex found along the upper straight reach but a sudden drop in levee height of 40 m down to basin depths occurs at 65 km down-channel (Figure 5a). The USinR is sinuous with 12 bends, one of which is an abandoned full 190° cut-off meander, whereas other bends turn as little as 20°. The reach has a sinuosity index (ratio of channel length to valley length) of 1.66. The width of the channel floor varies from 22–1107 m with no systematic pattern correlated to distance down-channel. However, there is a strong correlation (R2 = 0.875) of decreased channel cross-section area and distance down the USinR (Figure 5c).
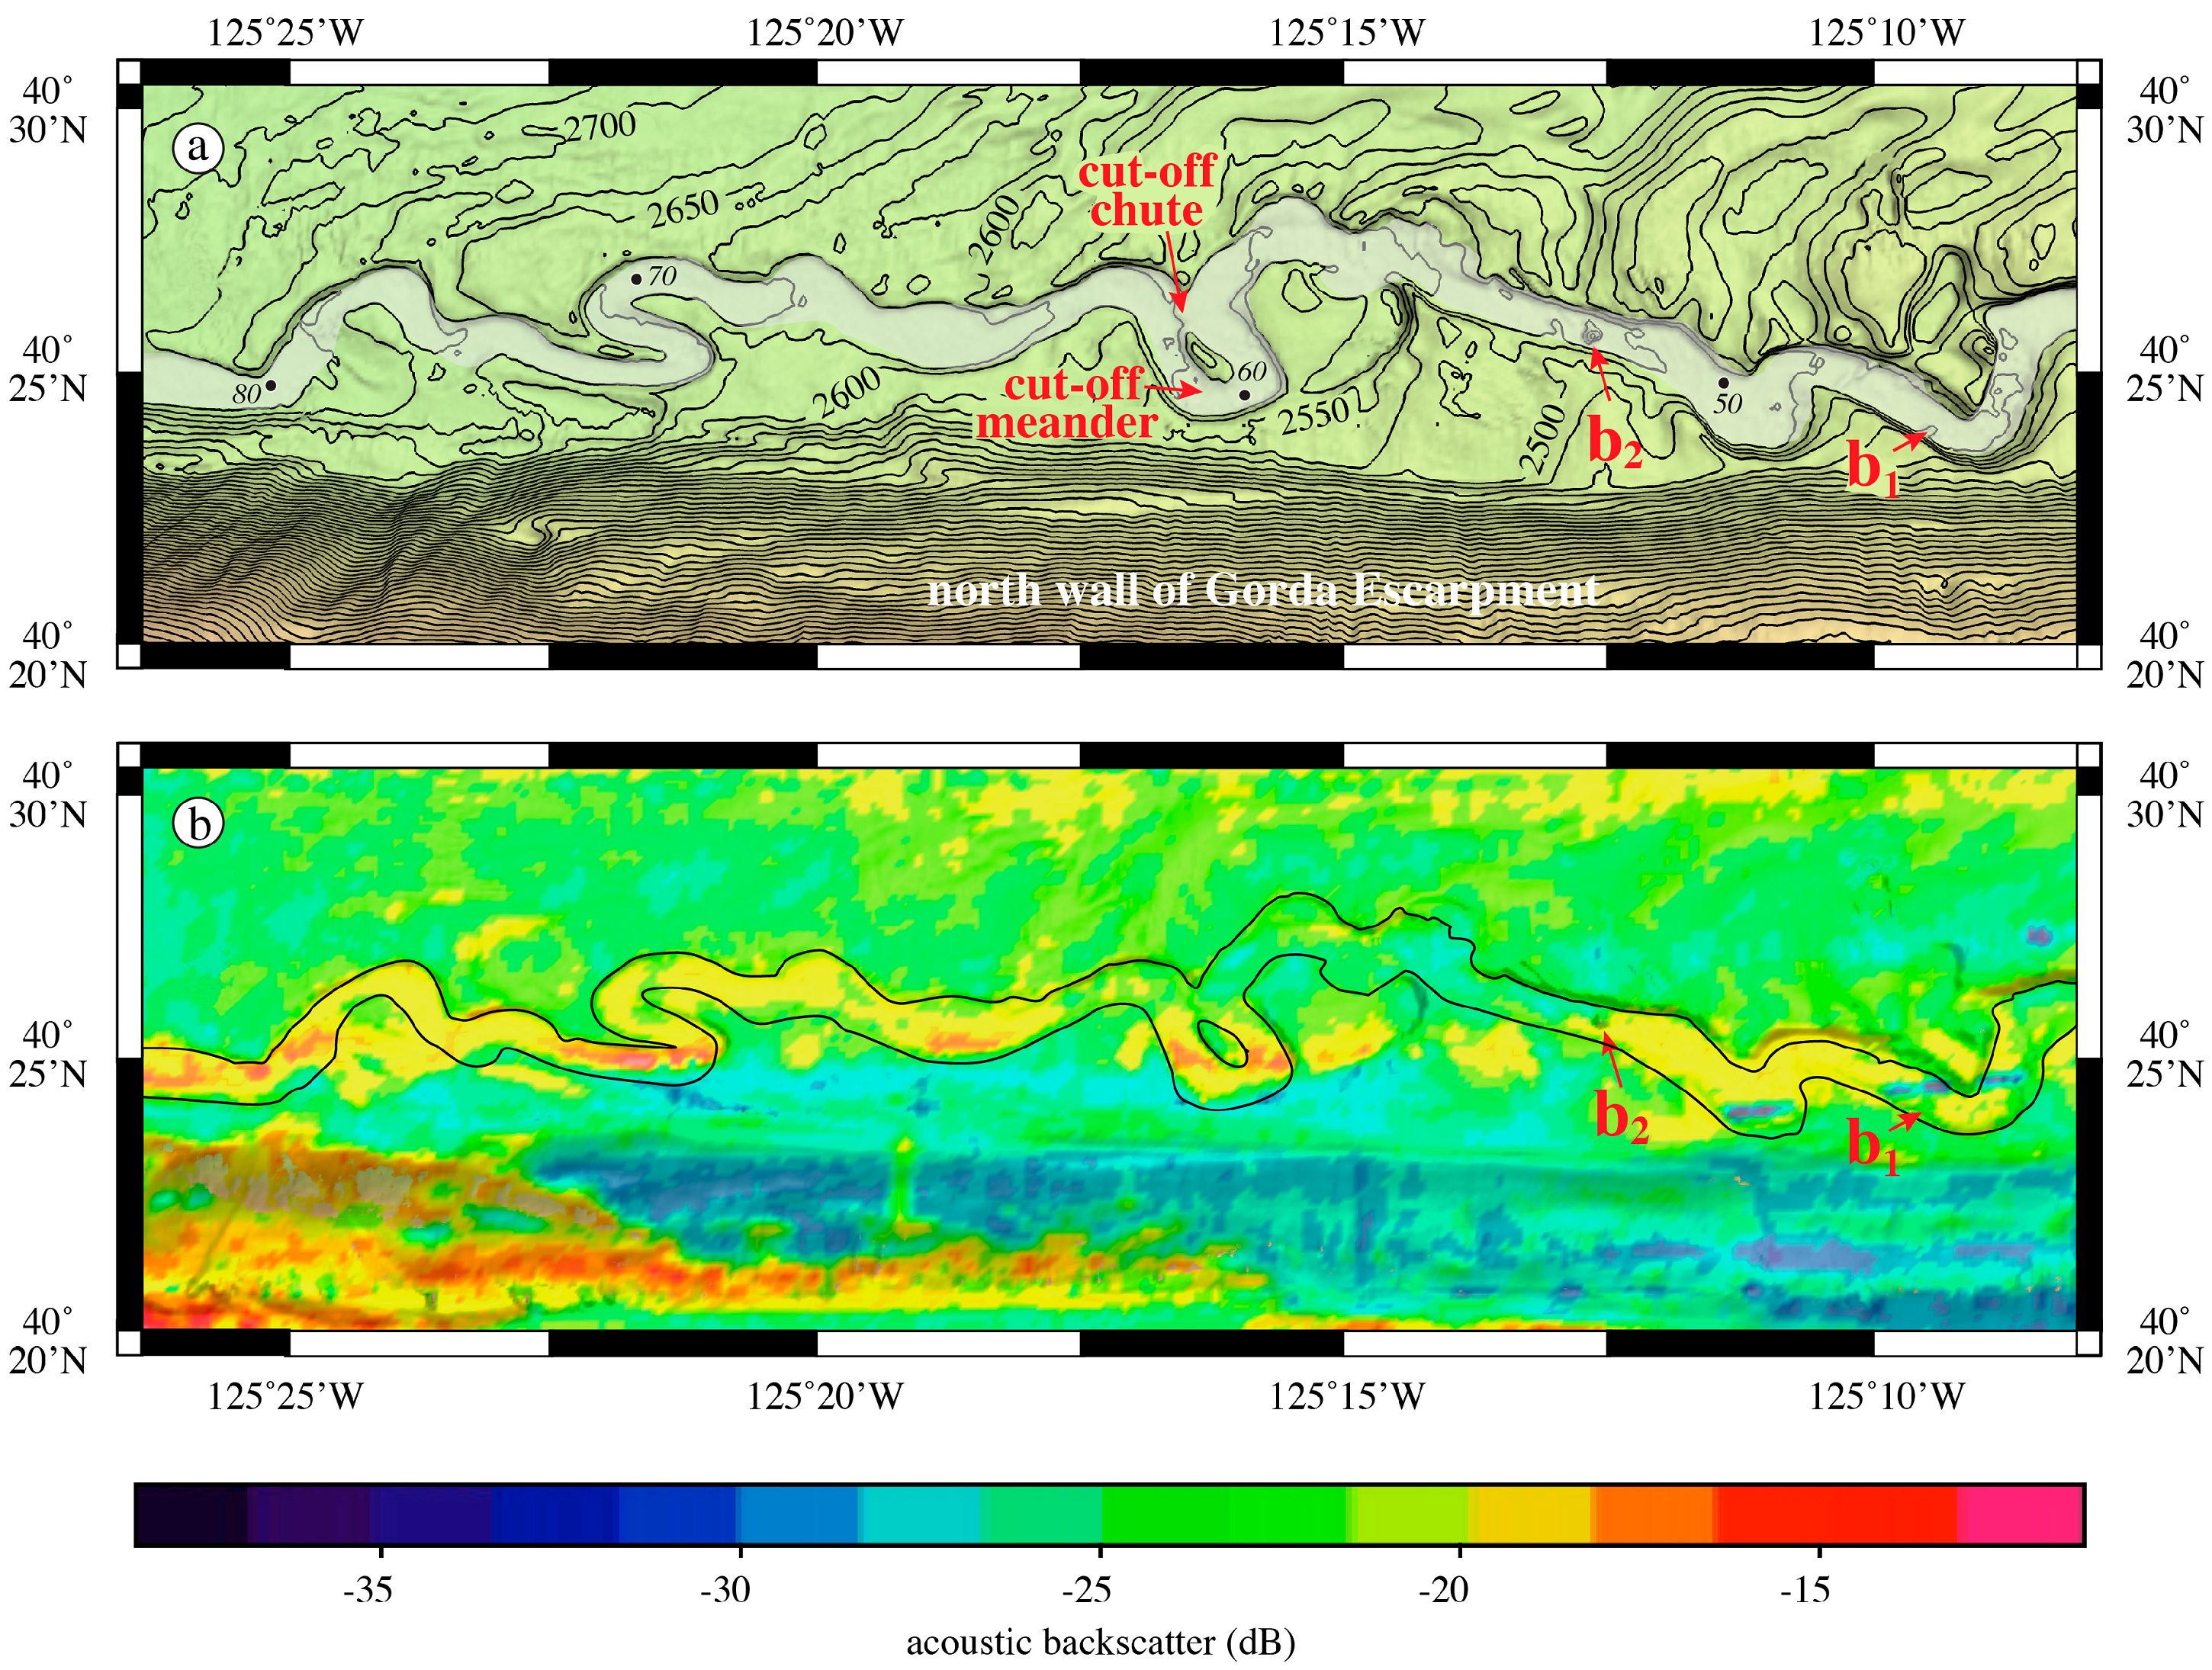
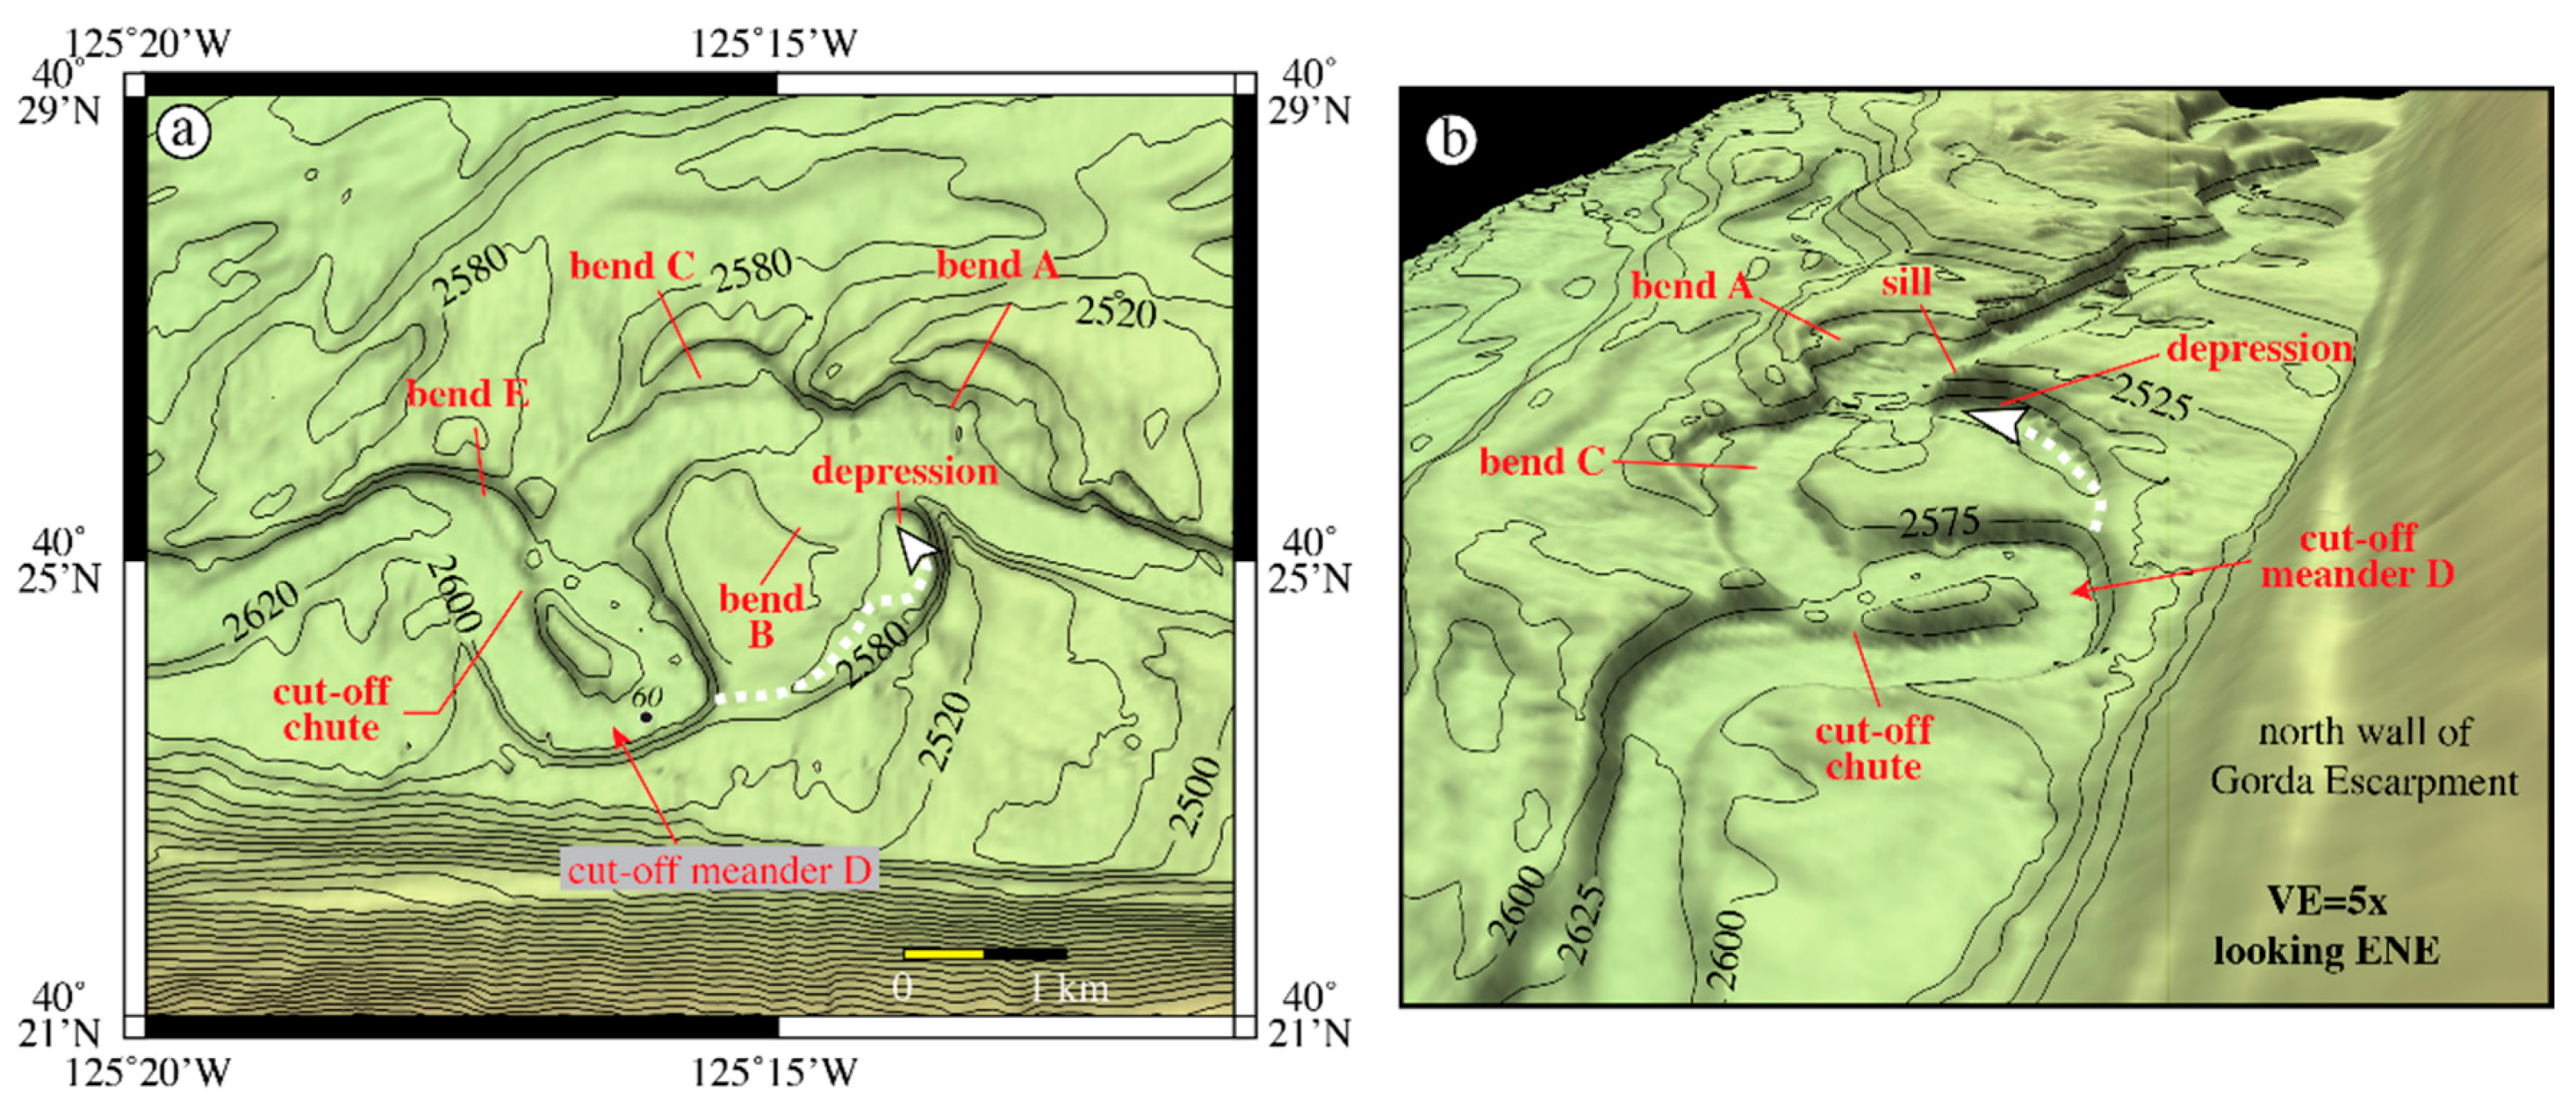
The floor of the USinR is relatively smooth at the vertical resolution of the MBES at these depths (~2 m) although two large mounds occur on the channel floor (b1 and b2 on Figure 10a). Mound b1 stands 18 m high with basal dimensions of 162 × 234 m and is located 4 km down the reach. Mound b2 is 40 m high with basal dimensions of 266 × 279 m and is located 14 km down channel. Most of the channel floor has high backscatter (−17–−15 dB) (Figure 10b) that is confined within the channel and occurs from a point 58 km down-channel and continues to the western end of the USinR. The middle of the USinR includes a complex series of bends and terraces (Figure 11). Bend A has a flat, level bench (terrace or outer-bank bar [29]) 45 m above the channel floor compared to bend B directly across the channel that has a tilted bench only 3 m above the channel floor. Bend C has a flat, level terrace (or outer-bank bar?) 18 m above the channel floor. Cut-off meander D is a 190° bend but a detailed analysis of the MBES bathymetry shows that a chute channel has broken through so that meander D is in fact a cut-off meander (Figure 11a,b).
A relict cut-off channel and deep depression occurs on the south bank opposite bend A (Figure 11a,b). The depression is 30 m deep at its deepest and its floor is 15 m below the adjacent channel floor at bend A. The depression is separated from the channel floor at bend A by a steep (50°) 200 m wide, 23 m high sill, although the depression is inline with a broad gently curved abandoned channel that begins 18 m above the inner bend of the cut-off meander, and descends to depths 21 m deeper at the center of the depression. The depression and associated abandoned channel are erosional, not depositional, features.

4.4. Mendocino Channel Crevasse Splay

A broad conspicuous 5 km-long flat area (4.5 km E-W × 1.7 km N-S) begins at 78.5 km down-channel just beyond the USinR. The area is bounded on the north by a discontinuous low bank. This section has the broadest channel width of the entire length of Mendocino Channel but it continues the perched descent to the west from 140 to 120 m above basin depths while it remains close to the north wall of Gorda Escarpment. The low, broad area resembles a crevasse splay where in the past the channel breached the north bank in several places (Figure 2 and Figure 12). The north-south gradient between the banks is only ~0.02° whereas the east-west gradient is 0.33°, the latter gradient is typical of the USinR immediately up-channel. The north bank varies between 4 and 12 m high except for the suspected breach areas, which are less than 2 m high. High backscatter (−17–−12 dB) decreases in intensity to the north in the broad area of the crevasse splay (Figure 12). Although the high backscatter might reflect debris shed off the escarpment, the location of the broad area of high backscatter is 6.5 km east of the eastern edge of the relief that reflects the large landslide deposit (see below) and nowhere else along the length of Mendocino Channel is high backscatter seen to extend to the north outside the channel.

4.5. Mendocino Channel Lower Sinuous Reach (Landslide and Beyond Landslide)

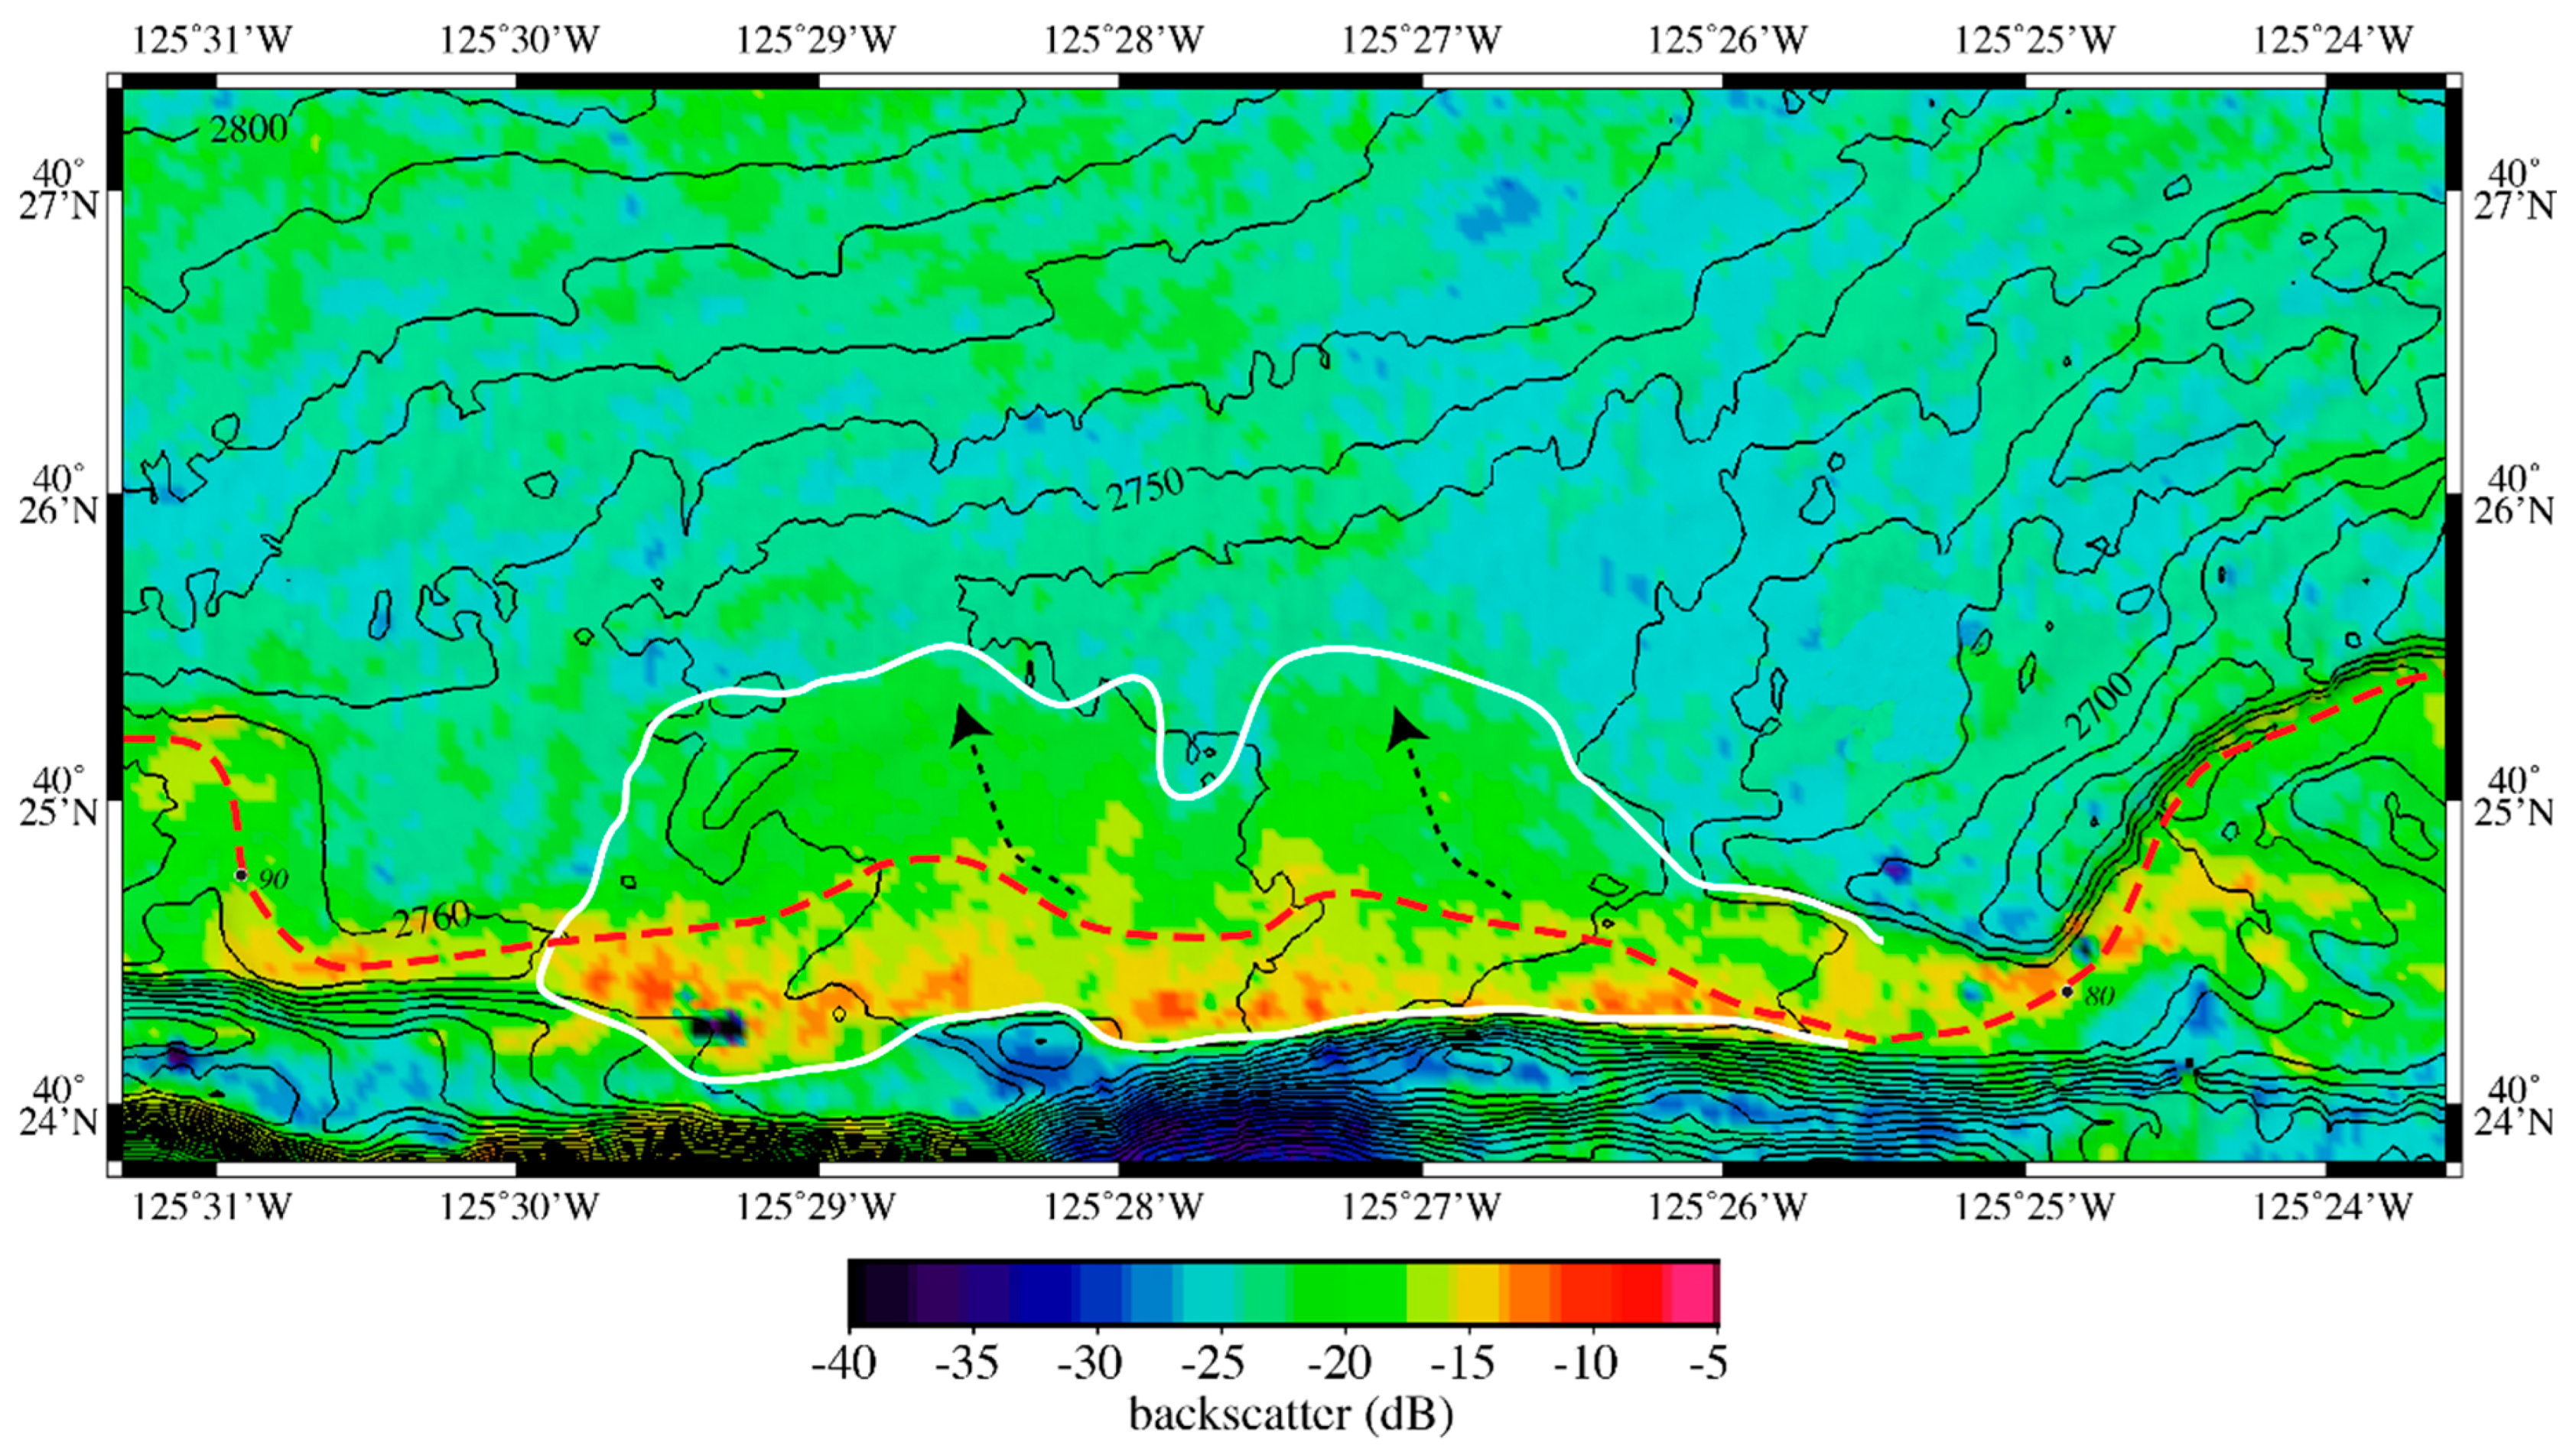
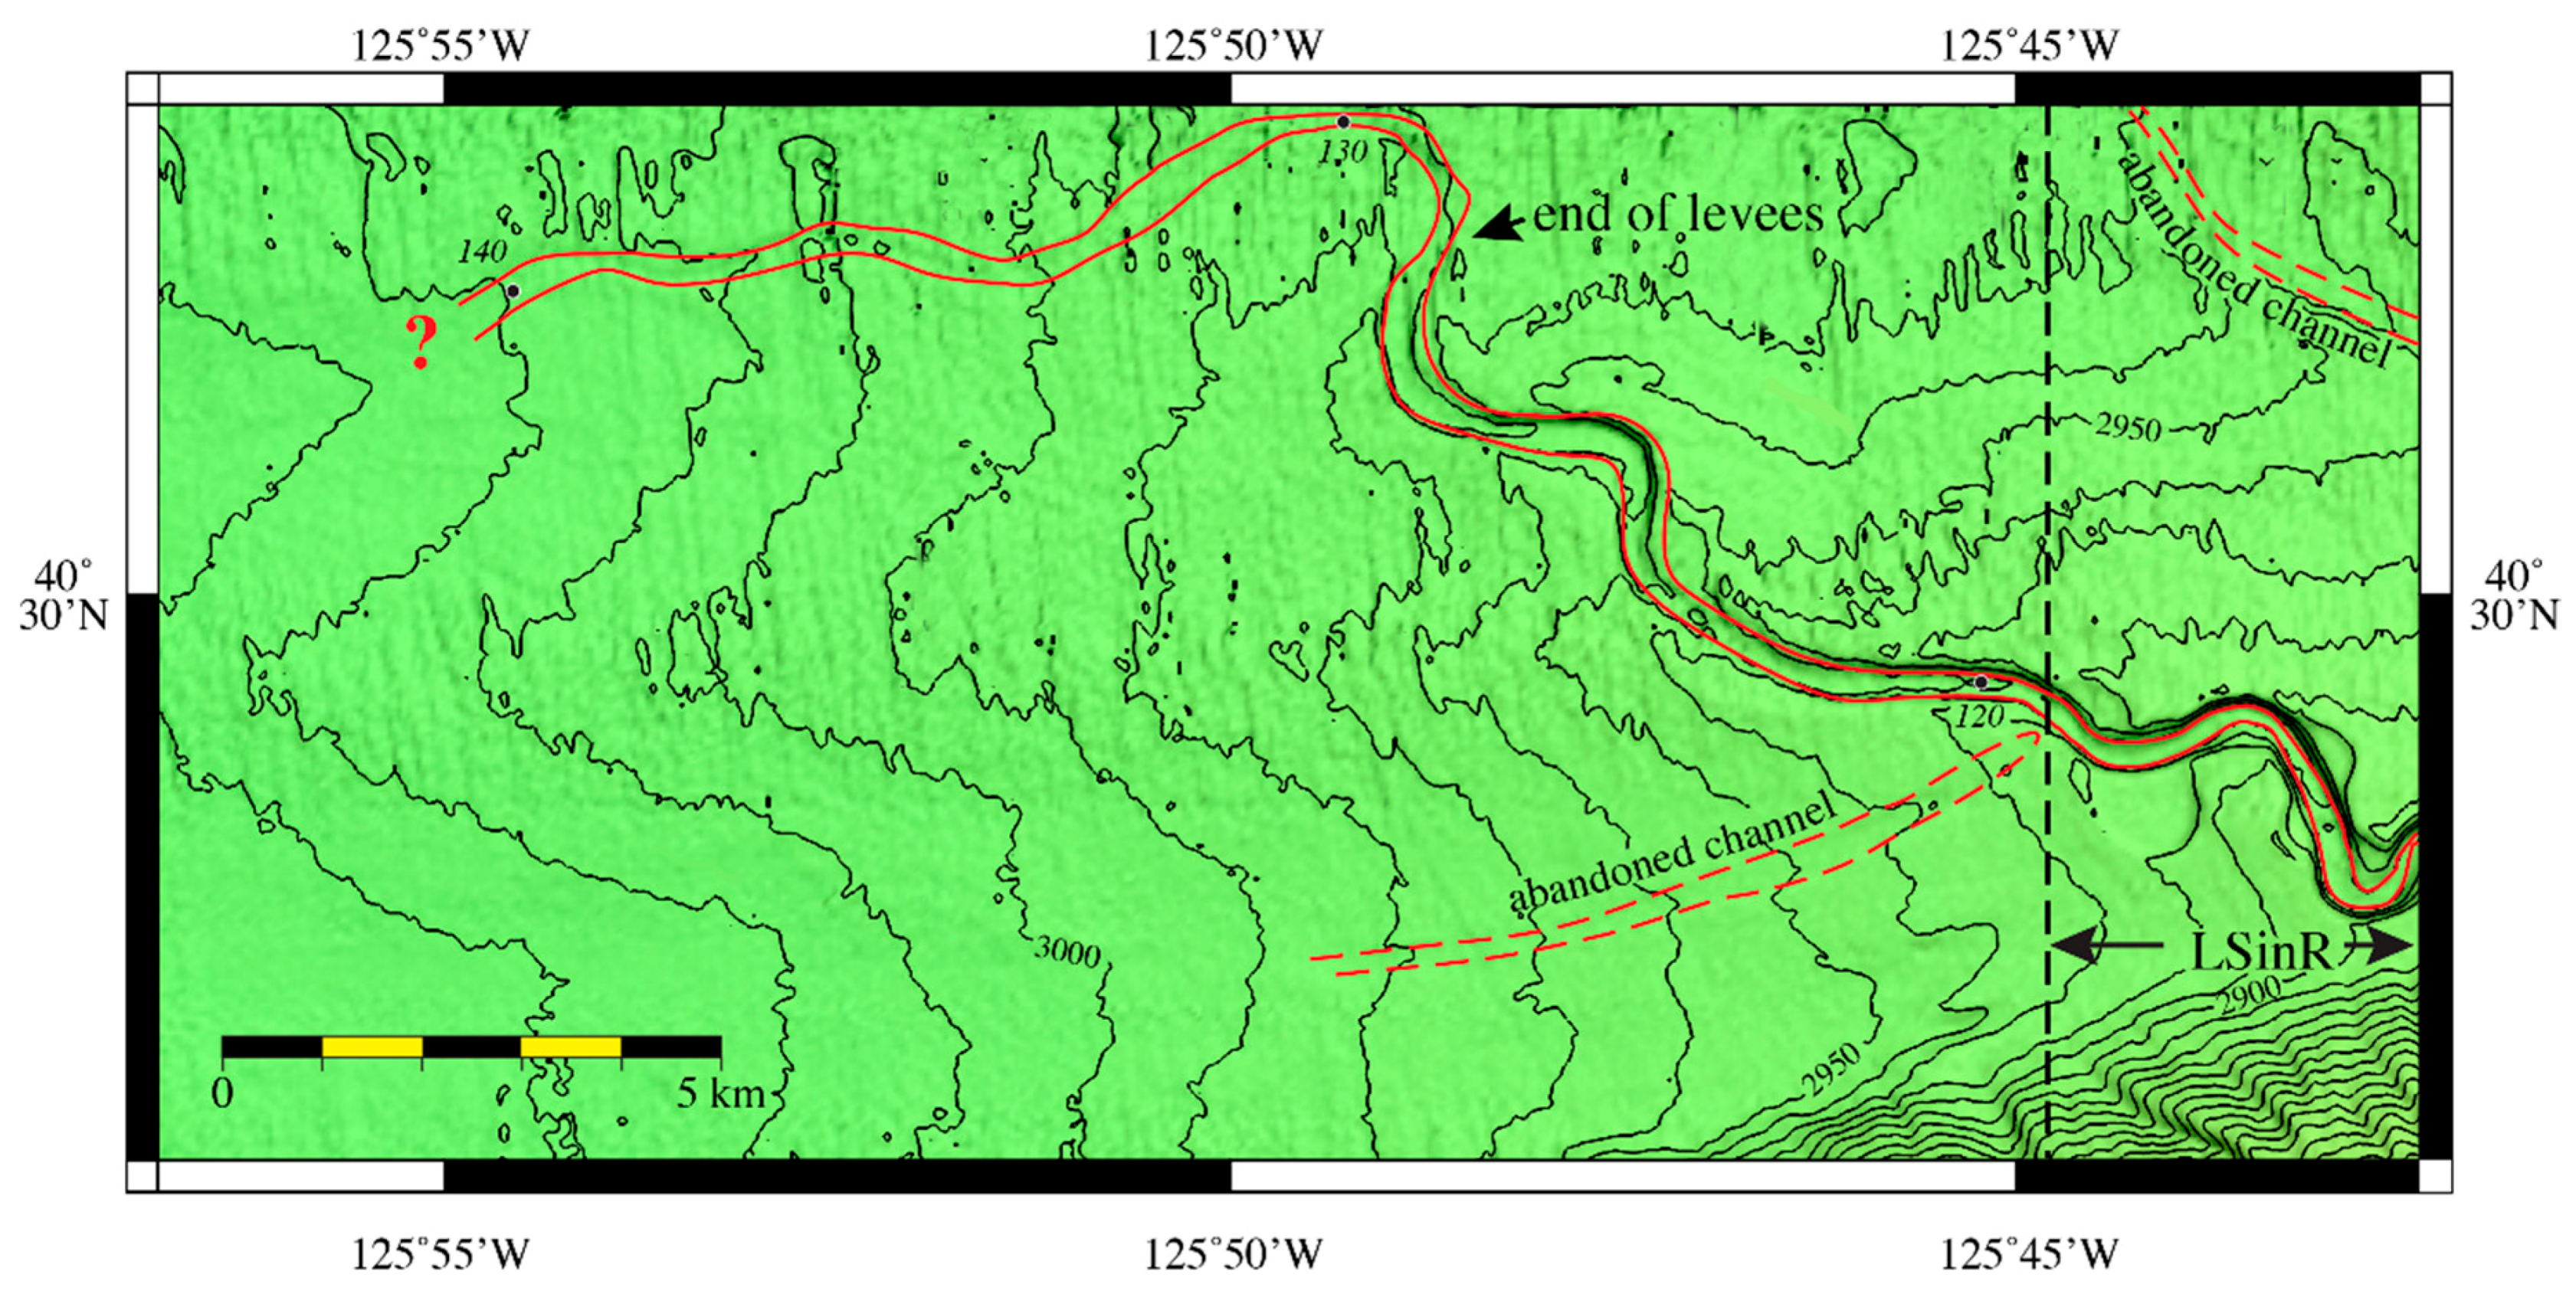
The lower sinuous reach (LSinR) includes a complex sinuous channel as well as a large landslide that shed debris off Gorda Escarpment and a channel blockage (Figure 13). The LSinR begins 85.5 km down-channel at a water depth of 2759 m, just beyond the crevasse splay, with a series of tight meanders and ends at 125.7 km down-channel at a water depth of 2944 m. The sinuosity index for LSinR is 1.83. The reach has a gradient of 0.27° with very little resolved relief on the channel floor. However, there is a 5.8 km section of the channel that starts at 94.8 km down-channel (red dashed bracket on Figure 13) that is completely blocked by 3–5 m high rough relief that appears to be debris from the large landslide. The material that blocks the channel has backscatter values of −16–−18 dB, not much different than the backscatter values immediately up-channel in the reach (Figure 13b). The width of the channel floor continues to decrease and water depths continue to increase down-channel (Figure 5f). Levees occur on both sides of the LSinR along almost the entire length. However, the available seismic data do not image levees beyond the LSinR so the full extent of the levees is unknown. The backscatter values are high (−18 to −20 dB) at the beginning of the LSinR but the values decrease to levee values (−26–−30 dB) by 147.6 km down-channel.
As with the other up-channel reaches, the LSinR is perched above basin depths (Figure 5g). The LSinR continues the westward decline, from 120 m above basin depths at the beginning of the reach to less than 20 m at the end of the reach. At the end of the reach, the LSinR has essentially reached basin depths.
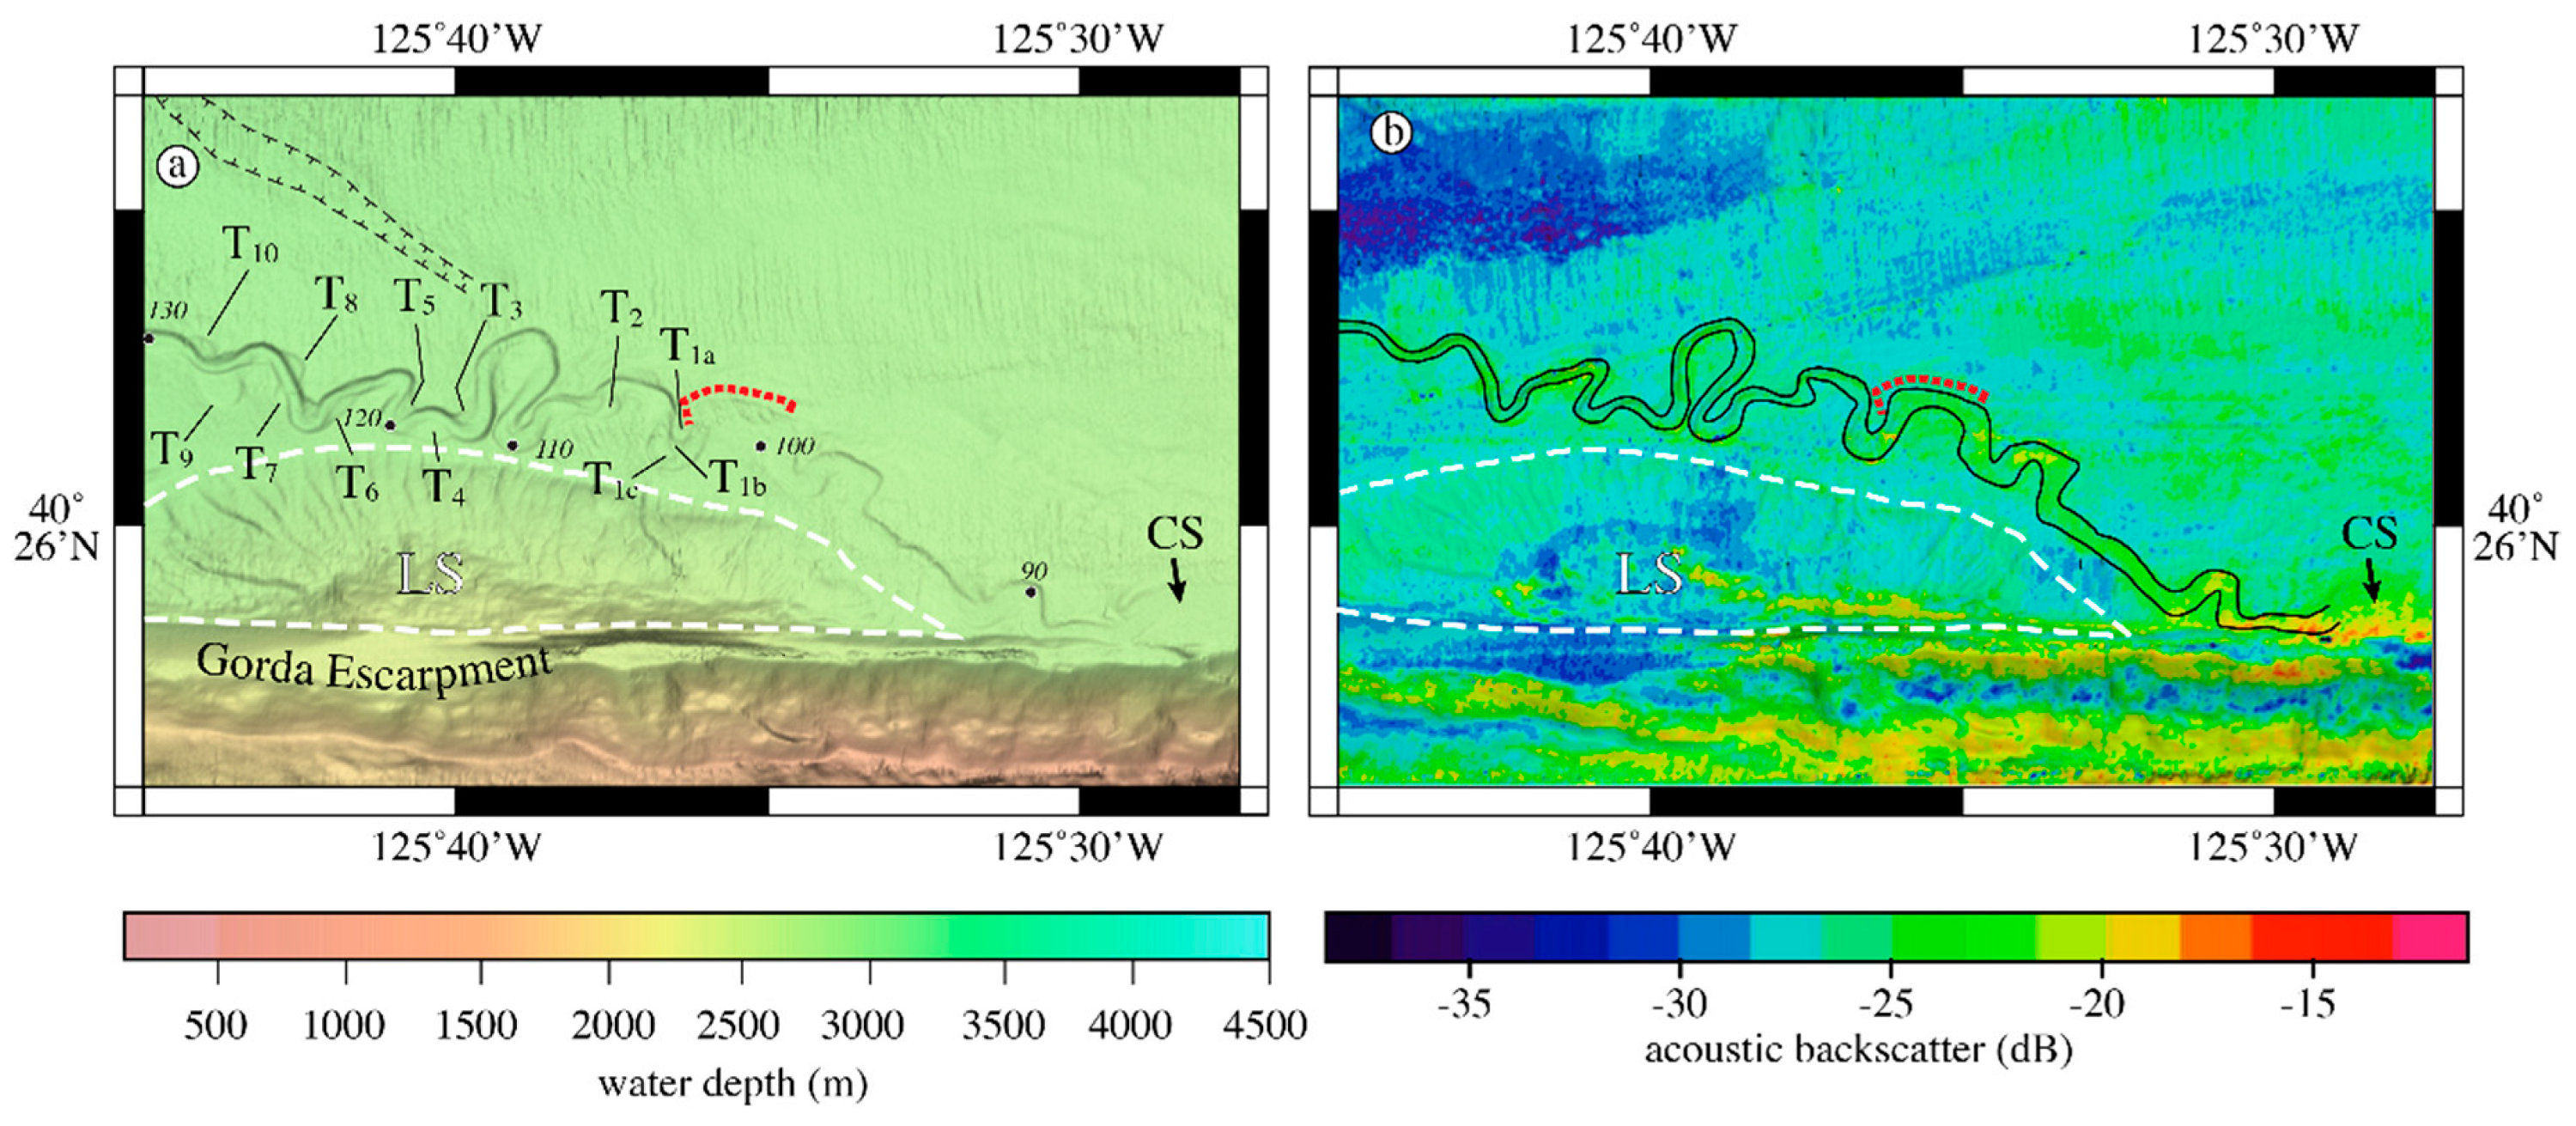
The initial west-trending LSinR channel abruptly changes course and trends northwest away from Gorda Escarpment at 89.9 km down-channel because of a large landslide deposit that originated on Gorda Escarpment (Figure 2 and Figure 13). The top of the landslide deposit is 550 m high, stretches 21.7 km along the base against Gorda Escarpment and fans out 4.7 km away from Gorda Escarpment, giving it a minimum volume of ~25 km3 of talus. There are no resolvable channel obstructions, and other than the area that blocks the channel, no high-backscatter debris within the LSinR that can be confidently attributed to the landslide. Also, there is no hint of a channel on the west side of the landslide deposits; consequently, it appears that the initiation of the landslide predates the formation of Mendocino Channel.
A series of outer- and inner-bend terraces (T1 through T10 on Figure 13) occurs throughout the LSinR, all at varying heights above the channel floor (Table 1). Some of the terraces are flat in a channel-orthogonal direction whereas other terraces are tilted towards the channel (Table 1). The terraces occur on the outside of channel bends (T1, T2, T3, T4, T5, T7, T8, T9, and T10) as well as along linear sections (T6 and T8). Paired terraces (similar water depths on adjacent inside and outside bend terraces) include T7 to T8 and T9 to T10 whereas all the other adjacent terraces are unpaired.
A subtle 2–3 m deep linear channel strikes NW from the LSinR (black hachured lines in Figure 13). The channel may be related to an older course of Mendocino Channel given that it is in line with the initial eastern straight section of the LSinR. The subtle channel’s closest approach to the LSinR at its SE end is only 1.5 km but the floor of the subtle channel is 30 m below the level of the LSinR channel floor and the two are separated by a 15–20 m high ridge. The backscatter values of the linear channel are no different than the levee values in the surrounding area and the multichannel seismic profiles (Figure 4) have no indication of this channel, both of which suggests the subtle channel has been buried by either LSinR levees or distal hemipelagic sediments of Gorda Basin.

4.6. Mendocino Channel Lower Straight Reach (LSR)

The lower straight reach (LSR) begins at 125.7 km down-channel and continues for 23 km before the channel is no longer resolved in the MBES bathymetry or backscatter (Figure 14). The reach has an overall gradient of 0.20° and consists of several relatively gentle bends and five 90° + bends. The LSR strikes west (~276°) for the first 5 km before it makes a broad 90° bend to the north but only stays on that course for 1.1 km before it makes another 90° bend to the west and runs for 2.9 km. At this point, the reach makes the third very broad 90° bend to the north for 3 km before it makes a final 105° turn to the west southwest (~261°) for the remainder of the resolved channel that ends at 148.7 km down channel. The last 105° bend in the reach may reflect the influence of the southern extent of the distal hemipelagic sediments of Gorda Basin or Eel Fan as well as influence from subsurface structure (see basement beneath red arrow on line 9 of Figure 4) that may have steered the LSR away from its NW trend out towards Gorda Basin. The LSR differs from the other reaches in that no terraces are found on either side of any bends. Levee heights have considerable variation down-channel (Figure 5d). The north-side levee is only 4–10 m high and the south-side levee is 2–7 m high until an abrupt decrease in levee height of less than 2 m high at 132.5 km down-channel. The levees then increase in heights to 6–8 m at 136–138 km down-channel and then decrease in height until no bathymetric expression of a levee is found at 140 km down-channel (Figure 5d).
The perched channel height vs. distance down-channel is highly variable for the first 15 km but then at a water depth of ~2990 m the channel has reached basin depths (Figure 5e).
A barely resolved channel trends to the southwest at the eastern beginning of the LSR with a 0.45° gradient. The channel can be followed for 3.9 km and heads just after a sharp bend in the LSR, although it is roughly orthogonal to the LSR trend (Figure 14). The incised depth of the channel ranges from 5 m at its head to less than 2 m at its western limit. The head of the side channel is 725 m WSW of the LSR and descends with a 0.8° gradient from the top of the south wall of LSR. This abandoned channel has no acoustic backscatter signature and appears unrelated to a former course of Mendocino Channel prior to the large landslide because it is not in line with the LSR and is well north of the landslide deposits. It might be a breakout channel from an earlier stage of Mendocino Channel but presently there is a 24 m high south-side levee that separates the eastern-most abandoned channel from the nearest channel floor of the LSinR and the LSR.

5. Discussion

The new multibeam bathymetry and backscatter data provide an unprecedented quantitative view of the morphology of the entire length of Mendocino Channel. The presence of Mendocino Channel, a sinuous channel on an active margin, begs an explanation for the age of the channel as well as what processes formed the channel. To investigate these questions, several lines of evidence were gathered from the literature and data archives that bear on explanations. The following discussion is focused on these questions.

5.1. The Age of Mendocino Channel

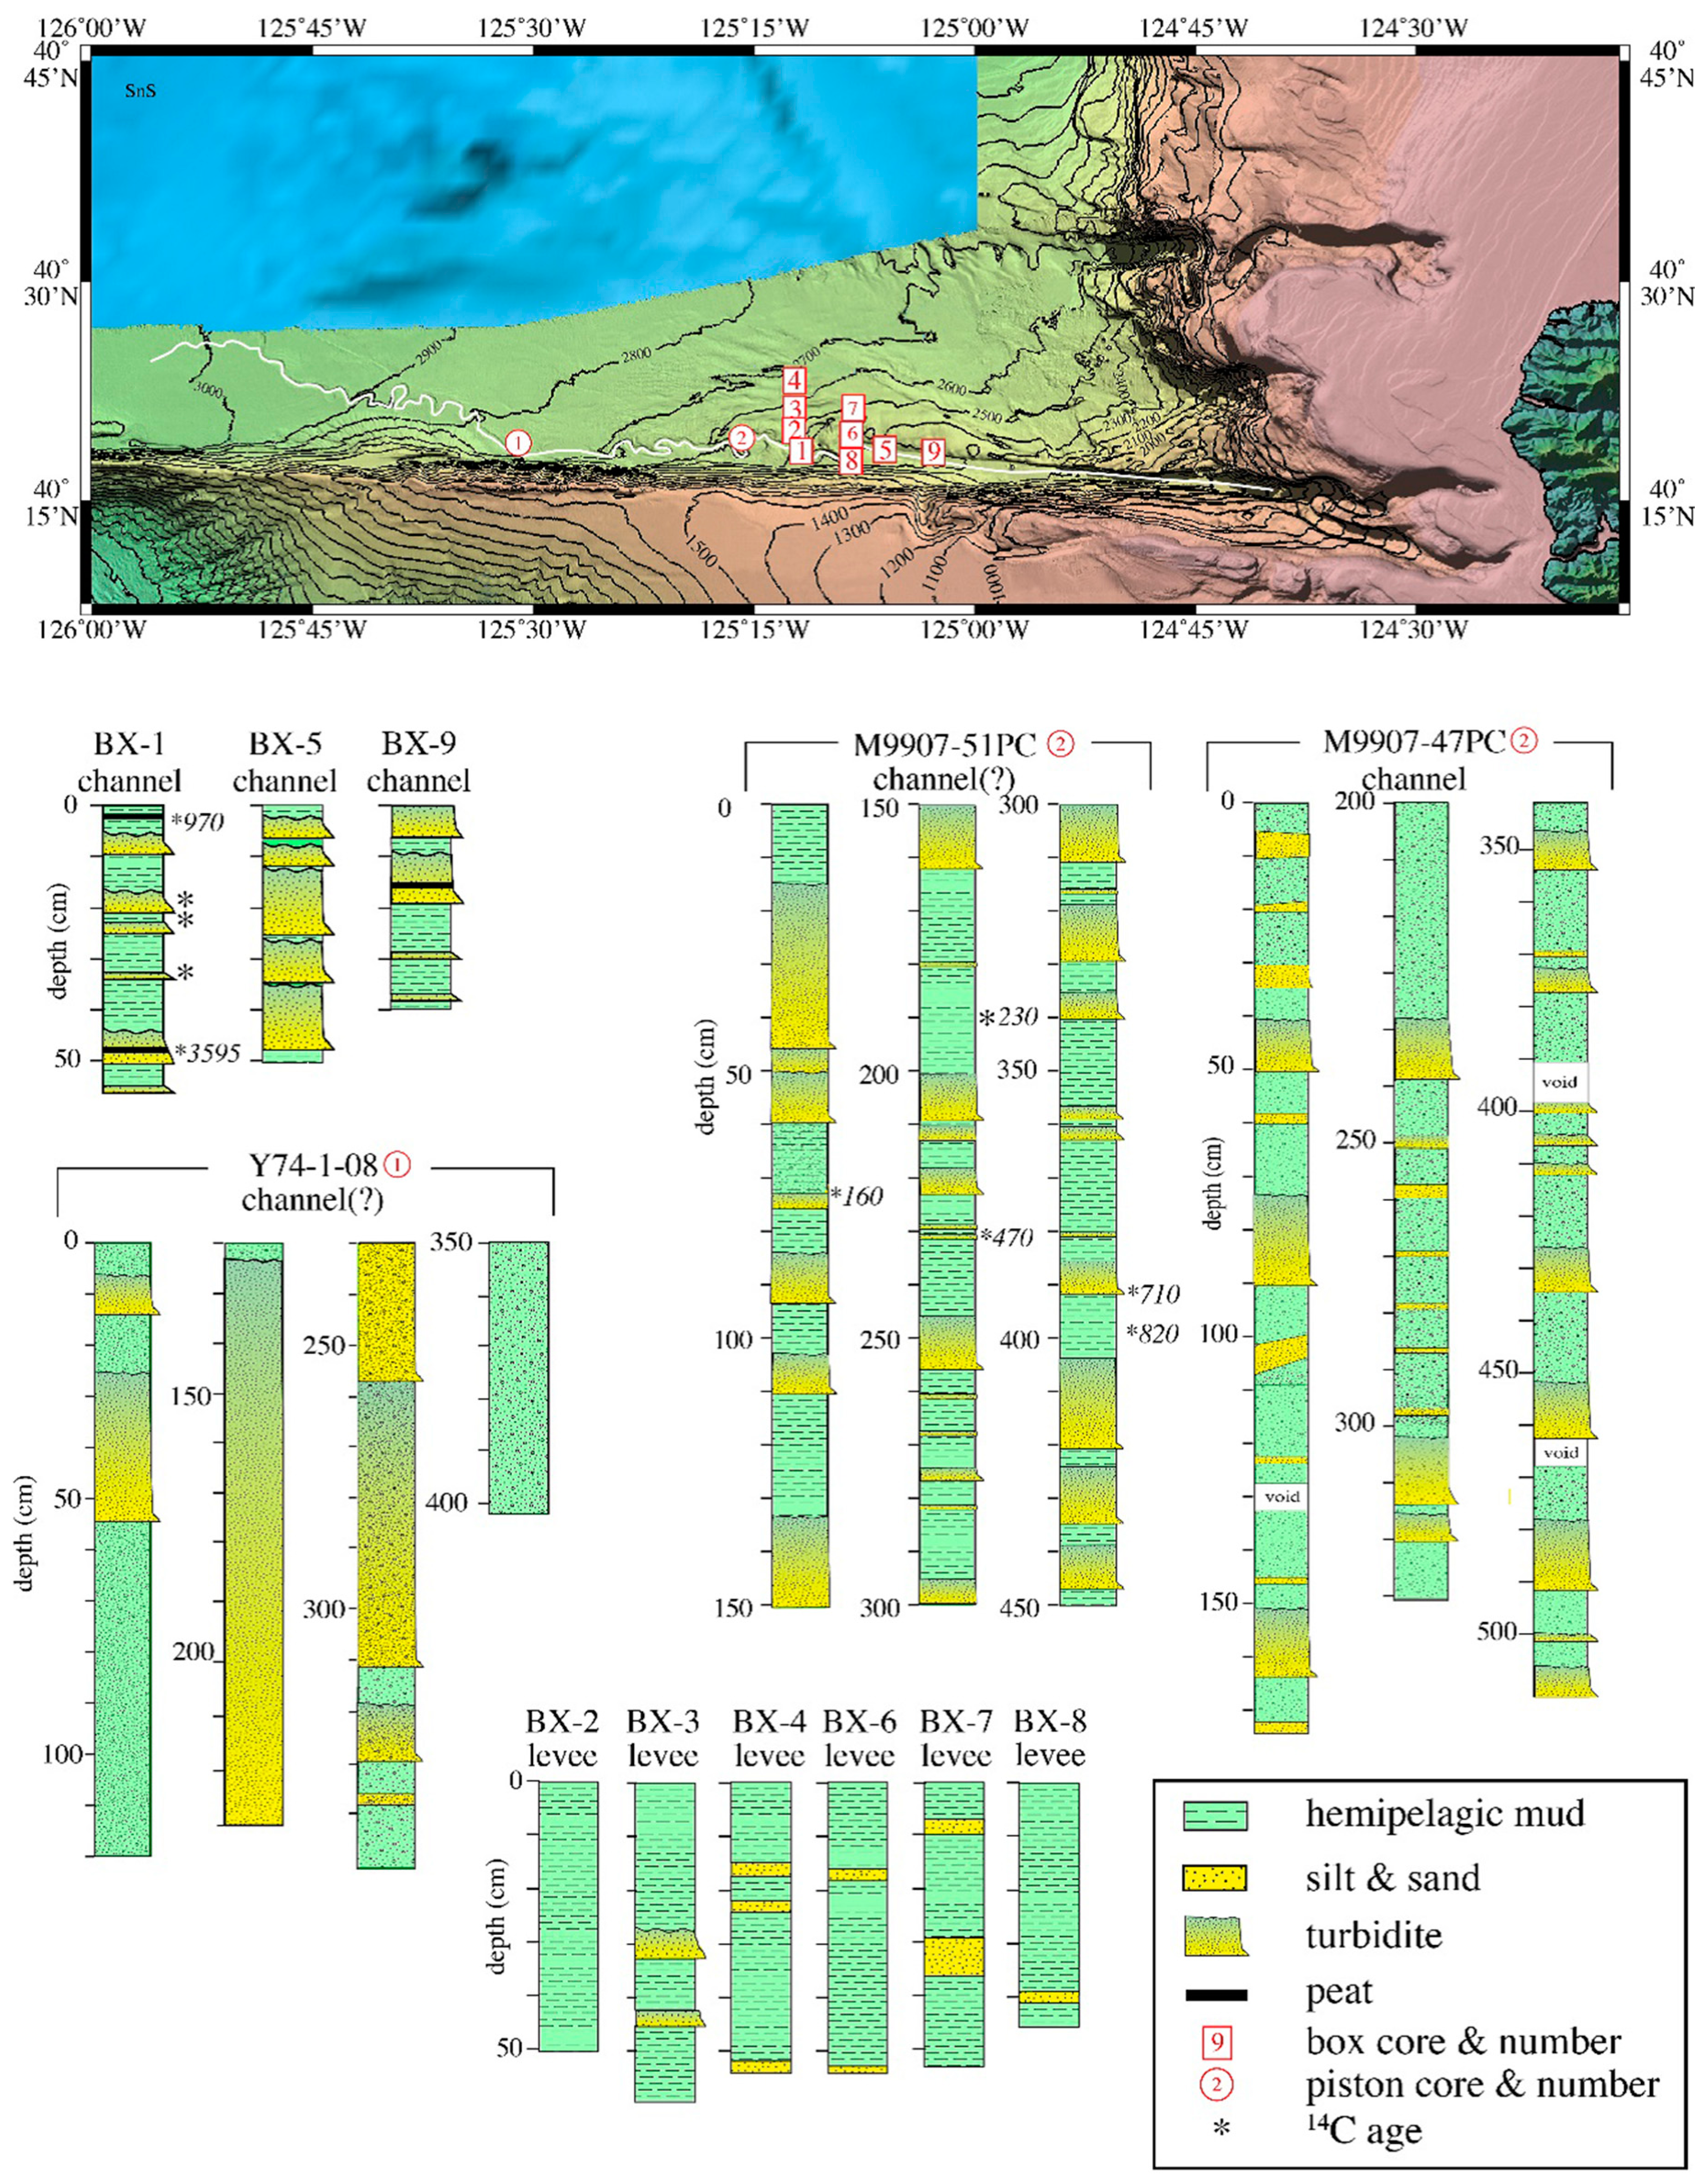
Twelve cores found in archives and the literature are either from within Mendocino Channel or from the northern levees, all located in the upper sinuous reach section (Figure 15). The lithostratigraphies and 14C dates of the cores show a complex pattern that is not straight forward to interpret. Three box cores (BX-1, BX-5 and BX-9) are from Cacchione et al. [5], two piston cores (M9907-47PC and M9907-51PC) are from Goldfinger et al. [30] and one piston core (Y74-1-08) is from www.ngdc.noaa.gov/mgg/curator/data/melville/avon/avon09mv/051/m9907_051pc_handwritten_corelog.pdf. Each box core sampled the upper 40–50 cm of the channel floor and is composed of numerous thin sandy turbidites interbedded with hemipelagic mud [5]. The sandy turbidites are 2–12 cm thick and conventional 14C dates from BX-1 range from 0.970 kaBP at 5-cm subbottom to 3.595 kaBP at 48-cm subbottom. None of the other box cores have been dated. BX-9 is the most up-channel box core and is located 33.1 km down-channel from the channel convergence point. BX-5 is located 11.4 km down-channel from BX-9 and BX-1 and is located 13.1 km down-channel from BX-5. BX-5 contains the thickest turbidites of the three box cores, more than likely because it was collected on a sharp bend in the reach whereas BX-1 and BX-9 were collected on straight sections of the USR.
The published locations of piston cores M9907-51PC and M9907-47PC are separated by less than 5 m so both piston cores were collected 6.7 km down-channel from BX-1. The top 50 cm of the two piston-core lithostratigraphies do not resemble one another at all and an AMS 14C age at 72 cm subbottom from M9907-51PC is 160 yrBP [30]. No ages have been reported from M9907_47PC. Assuming the turbidites and sands represent events that lasted only days or at most months, then the turbidites can be subtracted from the lithostratigraphies to represent only the hemipelagic mud in the sections. This, of course, assumes that the top of each turbidite is defined by the sand unit and the overlying mud is solely of hemipelagic origin and not deposition from the tail of the turbidity current. Nevertheless, if the 45 cm of sandy turbidites from the top 72 cm of M9907-51PC (the depth of the youngest 14C age) are subtracted from the section, then the linear sedimentation rate of the hemipelagic mud in this section of the core is 169 cm/kyr. Similarly, if the 14C date of 820 yrBP at 400 cm depth in core M9907-51PC is used, and the turbidites in the top 400 cm are subtracted, the hemipelagic sedimentation rate is 241 cm/kyr; both sedimentation rates that appear very fast for hemipelagic mud. For comparison, the nearest Ocean Drilling Program (ODP) site (Leg 167 Site 1020) is in Gorda Basin 80 km northwest of Mendocino Channel and collected an upper sequence of hemipelagic mud and no sandy turbidites with a sedimentation rate of only 11.5 cm/kyr [31]. If the same assumption and calculation is performed on BX-1 (the closest box core to the two M9907-47PC and M9907-51PC piston cores), using the 3.595 ka 14C age at 48 cm, then the linear sedimentation rate of the hemipelagic mud in BX-1 is 13.5 cm/kyr, a hemipelagic sedimentation rate that is comparable to that from the ODP site. Likewise, if the sandy turbidites are subtracted from the top 50 cm of M9907-47PC, and the 14C age at 48 cm in BX-1 is used as the age at 48 cm of M9907-47PC, then the linear sedimentation rate of the top of hemipelagic mud in M9907-47PC is 8.1 cm/yr, a sedimentation rate not too different than that of BX-1 and the nearby ODP site. These order-of-magnitude differences in hemipelagic sedimentation rates in M9907-51PC versus M9907-47PC, BX-1 and the ODP core, and the observation that the 14C age at 70 cm in M9907-51PC is considerably younger than the 14C age at 50 cm in BX-1, makes piston core M9907-51PC suspect, either because the published AMS 14C ages are grossly in error or the location of M9907-51PC is in error and the core is not from within Mendocino Channel.
An undated piston core (Y74-1-08PC) whose location plots on the channel floor contains only two sandy turbidites in the top 50 cm; the top turbidite is 7 cm thick and the next older turbidite is 25 cm thick. When the turbidites are subtracted from the section and the above assumptions are applied, applying the 14C age from BX-1 results in a linear sedimentation rate of 1.3 cm/kyr for the hemipelagic mud in this core, a sedimentation rate that seems too slow for hemipelagic sedimentation. This slow rate suggests the top of Y74-1-08PC is missing, a common occurrence in piston cores. The section below 50 cm subbottom is composed of 67 cm of sandy hemipelagic mud followed by a 119-cm thick sandy turbidite immediately overlying a 56-cm sandy turbidite. Piston core Y74-01-08PC was collected 33 km down-channel from BX-1, the farthest west box core from the channel floor and 91 km down-channel from the confluence point. Piston core Y74-1-08 is only 2.7 km away from the eastern edge of the large landslide from Gorda Escarpment, which may account for the thick sandy turbidite sequence from 50–300+ cm down core.
The lithostratigraphies of the 6 box cores (BX-2, BX-3, BX-4, BX-6, BX-7 and BX-8) collected from the north levee differ from that of the three box cores (BX-1, BX-5, BX-9) and the two piston cores (Y74-01-08PC and M9907-47PC) collected from the channel. The levee cores all have three or fewer thin sandy turbidites from 5–12-cm thick in the upper 50 cm that are interbedded with much thicker hemipelagic mud. Using the 14C age of 3.595 kaBP from BX-1 at 49 cm on the levee box cores, subtracting the thin turbidites using the assumptions above, yields linear sedimentation rates that only range from 11.4–13.9 cm/kyr for the hemipelagic muds on the levee. The sedimentation rates of the hemipelagic muds from the levees, even though there are no age dates, are similar to the calculated sedimentation rates of the hemipelagic muds of BX-1 that has a 14C date as well as to the sedimentation rate from the nearby ODP core.
The box and piston cores demonstrate that that channel has been a conduit for several sandy turbidity currents over at least the past 3.600+ kyrs but there is a conspicuous lack of high-amplitude reflectors in the multichannel seismic profiles that would indicate a significant amount of coarse sediment was deposited in the channel axis over time [4,16,32,33]. Although, the cores do not provide any evidence for how long the channel has existed, the single-channel seismic-reflection profiles from Cacchione et al. [5] and multichannel seismic-reflection profiles from Tréhu et al. [25] (Figure 4) show that the maximum thickness of the Mendocino Channel ranges from ~200–~300 m, using the formula for the conversion of travel time to subbottom depth for the western U.S. margin [34]. If the assumption used above that the turbidites and sands represent events of only days or perhaps months duration, then subtracting the turbidites and sands, and using the occurrences of turbidites in the cores as representative of the turbidites in the seismic section, the hemipelagic sedimentation rate from BX-1 can be used as typical for the entire thickness of the Mendocino Channel (admittedly these assumptions could be challenged, but that is all the data available). If the hemipelagic sedimentation rate of 11.5 cm/kyr from ODP Leg 167 Site 2010 is used as the hemipelagic sedimentation rate for the channels in the multichannel seismic sections, then the initiation of the Mendocino Channel may be as old as 2.6–1.8 Ma (early Quaternary).

5.2. Potential Processes

Mendocino Channel is a rare example of a sinuous channel on an active margin and one that is not associated with a submarine fan. However, Mendocino Channel has many of the characteristics of sinuous channels found on passive margins that are associated with submarine fans. The potential process or processes that formed and maintained Mendocino Channel include (1) frequent seismicity; (2) periodic storm-wave loadings on the narrow shelf that were large enough to re-suspend and transport shelf sediments to the head of Mattole Canyon; (3) periodic low eustatic sea levels throughout the Quaternary that moved the shoreline to the heads of Mattole and Monterey Canyons; (4) tsunamis and (5) hyperpycnal plumes generated by periodic floods of the Mattole River (there is no river that directly feeds to Mendocino Canyon).

5.2.1. Seismicity

Many studies have suggested that nearshore and offshore seismic activity can trigger turbidity currents, (e.g., [30,35,36]; see Pope et al. [37] for a global summary). There is evidence that seismicity has had some impact on Mendocino Channel (e.g., [5,30]). The heads of Mendocino and Mattole Canyons are located at the Mendocino Triple Junction (red star on Figure 1) and the entire area is seismically active with great earthquakes that are suggested to have occurred on this margin with a recurrence of ~500–530 yr and smaller earthquakes along the southern part of this margin with a higher frequency of recurrence [30,38,39,40]. Although dating the numerous landslides on the California margin adjacent to Mendocino Channel has not yet been attempted, the box cores taken within Mendocino Channel contain a series of thin sandy turbidites interbedded with thicker hemipelagic muds [5]. The top sand in each box core is overlain by 3–5 cm of hemipelagic mud. Conventional 14C ages of organic debris within the sands date the latest turbidite at 970 ± 80 yBP [5], but no turbidite was recovered that would correlate to the 1906 Mw 7.8 San Francisco earthquake. However, the occurrence of numerous large landslides in the immediate area of Mendocino Channel (e.g., [25]), coupled with the local seismicity makes earthquakes prime candidates for the initiation of sediment failures that evolved into turbidity currents that coursed down the margin and onto the basin floor.

5.2.2. Wave-Loading Resuspension

It is widely recognized that some submarine canyons have continued to be conduits for shelf-sediment transport to the deep sea, even during eustatic high stands, e.g., [41]. Wave-loading by periodic storms has been suggested as a mechanism that can re-suspend shelf sediment and generate high concentrations of suspended sediment at canyon heads (e.g., [42] and references within; [43]). This process is more likely in regions with high rainfall with steep terrestrial slopes and extensive mass wasting that generates and transports large volumes of sediment to local coastal rivers. Such rivers would then transport much of the suspended and bed-load sediment to the shelf and form depocenters for eventual resuspension by storm waves (see Nittrouer et al. [44]). If a depocenter is close to a canyon head, then storm-generated re-suspended sediment would have the potential to be transported into and down the canyon as a gravity-driven turbidity current. The coastal mountains of northern California are steep and there is abundant rainfall (annually 1100–2500 mm/yr) and, in addition, major winter storms impact the coast (e.g., 3–10 major storms/yr for the past 50 yr). If major storms occurred during El Niño events, then the major storms would have been intensified [45]. Records of El Niño events have been dated as old as 130 ka [46], so wave-loading resuspension by major storms is a distinctly possible process that could have generated turbidity currents in Mendocino and Mattole Canyons.

5.2.3. Hyperpycnal Plumes

River floods with a high concentration of suspended sediment, with concentrations high enough to make the flood water denser than the sea water it flows into, could form a hyperpycnal plume. An important criterion for the generation of a hyperpycnal flow is the degree of estuarine mixing prior to the flow entering the ocean [47]. Hyperpycnal plumes are generated by typhoons or intense rainfall that couple high river discharge with large suspended-sediment load. The plumes have the potential to flow downslope by gravity and, if the density of the hyperpycnal flow remains denser than the bottom water, sediment-laden plumes have the potential to evolve into a density-driven turbidity current that can flow out onto a basin floor [43,48,49,50,51]. Hyperpycnal plumes have been invoked for sediment waves off the California Margin just north of Mendocino Channel [52], in the Atlantic off Morocco [53], for deposits on Var Fan in the Mediterranean Sea [20,54], and off Taiwan [50,55,56]. This process has even been invoked as an alternate explanation for Humboldt Slide off northern California [57], although this interpretation is controversial (see discussion by Nittrouer et al. [51]). A dilute turbidity current was observed by Sumner and Paull [58] on an ROV dive in the head of Mendocino Canyon but only in water depths of less than 400 m. Whether this turbidity current reached the seafloor at water depths of 2000–3000 m is unknown, although Kao et al. [55] observed a hyperpycnal flow off Taiwan that reached water depths of 3000–3700 m. Regardless, this process would only be possible for the Mattole River and Canyon because the Mendocino Canyon has no adjacent river to feed sediment to the head of Mendocino Canyon.

5.2.4. Eustatic Sea Levels

Quaternary episodes of major regressions of eustatic sea levels located river mouths closer to adjacent canyon heads. Marine and ice-core studies have demonstrated that Quaternary eustatic sea levels dropped 120–130 m relative to today’s sea level during maximum global glacial conditions ([59]; see De Boer et al. [60] for discussion and references). The shoreline effect of the glacial eustatic low sea levels at the heads of Mendocino and Mattole Canyons is shown in Figure 16. The mouth of the Mattole River is presently 2.5 km from the head of Mattole Canyon. A 120 m drop in eustatic sea level would have fed the Mattole River directly into the canyon head. A 130 m drop in eustatic sea level would have fed the river farther down the canyon head. The head of Mendocino Canyon is presently 3.2 km offshore the shoreline. A 120 m drop in eustatic sea level would have placed the shoreline 370 m from the head of Mendocino Canyon and a 130 m eustatic lowering would have placed the shoreline an additional 75 m closer to the canyon head. In these instances, there was virtually no shelf between the shoreline and the two canyon heads. The last eustatic low stand occurred about 20 ka, but the youngest turbidite in BX-1, collected within Mendocino Channel, dates at about 0.97 ka and the fifth turbidite in the sequence at 50 cm subbottom in BX-1 is dated at 3.59 ka, so eustatic sea levels could not be the dominant forcing process that generated many of the late stage channel turbidites.

5.2.5. Tsunamis

Tsunamis can have a profound effect on a continental shelf, especially on a very narrow shelf ([61,62] and references within; [63,64,65]). The outgoing tsunami waves, after first eroding the shore, have the capacity to transport mud, sand and even large boulders to the ocean in the backflow. Once in the head of a canyon, gravity and the sediment-laden density of the backflows would transport the sediment down-canyon as gravity-driven sediment flows that potentially could reach a basin floor. Atwater and Hemphill-Haley [66] and Hemphill-Haley [67] reported tsunami deposits on coastal Washington State and Garrison-Laney et al. [68] reported on 5 tsunami deposits within the last 3500 years at the southern end of the Cascadia Subduction Zone, near the shoreline adjacent to the heads of both Mendocino and Mattole Canyons. However, Weiss [69] modeled tsunami effects on non-cohesive sediments from the shelf and slope and calculated that even the 2004 Boxing Day tsunami in the Indian Ocean transported fine sand only 335 m offshore in a water depth of 985 m. This study suggests that if a nearby earthquake generated a submarine landslide that in turn initiated a tsunami, the resuspension and transport of fine sand and silt could have reached the heads of both Mendocino and Mattole Canyons.

6. Conclusions

The new multibeam bathymetry and backscatter data provide the first quantitative description of the entire Mendocino Channel. A more thorough understanding of the immediate area of Mendocino Channel was gained by combining the new analyses of the multibeam data with interpretations of published multichannel seismic and sediment cores from the channel and immediate vicinity. Several aspects of the entire Mendocino Channel system are intriguing. For instance, the concave-down profile of Mendocino Canyon channel suggests it is presently largely inactive and has accumulated sediment in the canyon-channel reaches. Conversely, the concave-up profile of Mattole Canyon channel suggests it is presently active and either has or is in the process of establishing an equilibrium profile. The similar water depths of the flat surfaces of terraces Tg and Td on either side of Mattole Canyon, together with the sharp 80 m drop of the floor of Mattole Canyon at the capture point by Mendocino Canyon, is strong evidence that Mattole Canyon channel is older than Mendocino Canyon channel and that it was captured by Mendocino Canyon channel. The lack of obvious high-amplitude reflectors in the subsurface on multichannel seismic profiles (Figure 4) suggests Mendocino Channel floor has not been the site of significant deposits of coarse sediments. However, the maximum ~350 m thick north-side levees of the USR suggests a large amount of sediment has transited the channel over the life span of Mendocino Channel.
What changed the nature of the reaches from straight to sinuous and back to straight? Typically, major changes of planform characteristics of fluvial channels are the result of changes of sediment load, an increase in peak discharge or a change in channel gradient or some combination of the three [70]. The gradient of the USR decreases from 0.71° at its beginning to 0.12° at the beginning of the USinR. The gradient at the beginning of the LSinR is 0.18° and varies down-channel less than ±0.2° to the end of the reach. Is this small gradient enough to cause a change from linear to sinuous in channel character? Why did the levee heights suddenly decrease in height at two locations? The large north-side levee heights along the USR suddenly decrease from 200 m above the channel floor at 25 km down-channel to 100 m high, about the location where the channel emerges from the steep continental margin, but the change in channel character from the USR to the USinR occurs 41.8 km down-channel where the north and south levees remain less than 100 m above the channel floor. The sudden decreases in north levee heights might reflect the end of continental margin sediment mixed with the north levee sediments. The overall decrease in north and south levee heights in the USR is fairly smooth until the abrupt decrease in height at 22–25.5 km down-channel (Figure 5a). If this is the case, then the sudden decrease in north and south levee heights in the USinR at 62–65 km down-channel must reflect a reduction in the carrying capacity of the turbidity currents and a subtle decrease in channel gradient. The gradient of the channel floor of the USR just before it changes to the USinR is 0.71° and it flattens to 0.12° at the beginning of the USinR. The remainder of the USinR has a gradient of ~0.33° throughout the reach and both north and south levees suddenly end at 60–65 km down channel, 80+ km before the channel is no longer resolved in the bathymetry data. Nothing in the multichannel seismic subsurface data suggests any basement control for these changes.
It seems that a combination of significant and numerous earthquakes (seismicity) and wave-loading resuspension are the most likely processes that created the turbidity currents that formed and maintained Mendocino Channel. Eustatic lowered sea levels are possible contributors to the initial formation of the channel, but the lack of high-amplitude reflectors and the young ages for the turbidites in BX-1 suggest that eustatic sea levels are not the major forcing for activity within Mendocino Channel. Answers to the intriguing aspects and questions raised by the analyses presented here must await future dedicated seismic and sediment sampling cruises that can provide the necessary data to address these observations.

7. Summary

  • Newly acquired multibeam bathymetry and backscatter data, together with published multichannel seismic and sediment core data provides a quantitative geomorphometric analysis of the entire extent of Mendocino Channel and to explore the age and possible causes that may have contributed to the formation and maintenance of the channel.
  • Mendocino Channel has evolved from the confluence of Mendocino and Mattole Canyon channels at the point where Mattole Canyon channel was captured by Mendocino Canyon channel.
  • The concave-up profile of Mattole Canyon channel suggests it is in the process of reaching, or has reached, an equilibrium profile whereas the concave-down profile of Mendocino Canyon channel suggests it is largely inactive.
  • The 148 km length of Mendocino Channel can be subdivided into sinuous and linear reaches based on planform geometry.
  • Mendocino Channel trends westward along the base of Gorda Escarpment and descends 365 m along an inclined perch towards basin water depths until the channel is deflected to the northwest by a large landslide deposit.
  • Changes from a linear reach to a sinuous reach and back to a linear reach are abrupt with 90° bends.
  • There are several 180° meanders and 2 cut-off meanders in the sinuous reaches.
  • Both inside-bend and outside-bend terraces are found on the sinuous reaches; some are paired terraces and some are unpaired.
  • Although landslides are evident along the north wall of Gorda Escarpment, there is very little evidence of landslide debris within Mendocino Channel.
  • Dated box and piston cores provide an estimate of the hemipelagic sedimentation rates that, when applied to the thickness of the channel-levee complex suggests the channel may be as old as 2.6–1.8 Ma (early Quaternary).
  • A combination of significant and numerous earthquakes (seismicity) and wave-loading resuspension are the most likely processes that created the turbidity currents that have flowed down Mendocino Channel.

Acknowledgments

The data for this paper were collected on NOAA Ship Okeanos Explorer cruise EX0903 funded by the National Oceanic and Atmospheric Administration. The Captain, crew and technical staff aboard the cruise were critical to achieving the success we had. I am grateful for all their help at sea. I am especially indebted to Mashkoor Malik, my co-Chief Scientist on the cruise and to David A. Cacchione who discovered Mendocino Channel on a 1984 USGS GLORIA cruise and sparked my initial interest in Mendocino Channel. I appreciate the constructive reviews of an earlier version of the manuscript by Larry A. Mayer and two anonymous reviewers. I especially appreciate the thorough and thought-provoking review by Jeffrey Peakall and I absolve all of the reviewers of any responsibility for my interpretations. The multibeam echosounder data were collected to support the bathymetry mapping for the U.S. Extended Continental Shelf efforts conducted by the University of New Hampshire’s Center for Coastal & Ocean Mapping/Joint Hydrographic Center. The data collection and analyses were funded under NOAA grants NA15NOS4000200 and NA10NOS4000073. The U.S Extended Continental Shelf bathymetry effort is unique among maritime nations in that the data collected are freely available within a month after completion of each cruise for use by the scientific and industrial communities and the public. The data are available at http://ccom.unh.edu/data/mendocino-east-bathymetry as well as from https://maps.ngdc.noaa.gov/viewers/bathymetry/. Any use of the data should be referenced to doi:10.7289/V5B56GRV (bathymetry) and doi:10.7289/V56D5R03 (backscatter).

Conflicts of Interest

The author declares no conflict of interest.

References

  1. Damuth, J.E.; Flood, R.D. Morphology, sedimentation processes, and growth pattern of the Amazon deep-sea fan. Geo-Marine Lett. 1983, 3, 109–117. [Google Scholar] [CrossRef]
  2. Flood, R.D.; Damuth, J.E. Quantitative characteristics of sinuous distributary channels on the Amazon deep-sea fan. Geol. Soc. Am. Bull. 1987, 98, 728–738. [Google Scholar] [CrossRef]
  3. Shanmugam, G.; Moiola, R.J. Submarine fans: Characteristics, models, classification, and reservoir potential. Earth Sci. Rev. 1988, 24, 383–428. [Google Scholar] [CrossRef]
  4. Wynn, R.B.; Cronin, B.T.; Peakall, J. Sinuous deep-water channels: Genesis, geometry and architecture. Mar. Pet. Geol. 2007, 24, 341–387. [Google Scholar] [CrossRef]
  5. Cacchione, D.A.; Drake, D.E.; Gardner, J.V. Recent meandering channel at the base of Mendocino Escarpment. In Geology of the U.S. Seafloor: The View from GLORIA; Gardner, J.V., Field, M.E., Twichell, D.C., Eds.; Cambridge University Press: Cambridge, UK, 1996; pp. 181–192. [Google Scholar]
  6. Gardner, J.V. Program EEZ-SCAN: A Reconnaissance View of the Western U.S. Exclusive Economic Zone. Available online: https://books.google.com.hk/books?id=-4vKMaCm2RUC&pg=PA125&lpg=PA125&dq=A+reconnaissance+view+of+the+western+U.S.+Exclusive+Economic+Zone&source=bl&ots=WjSK8mYdC1&sig=XZ7J2vHuNt7rLG1nlrsph_XPfWM&hl=en&sa=X&ved=0ahUKEwjf08CU6q3XAhVDT7wKHTMTBgQQ6AEIOjAH#v=onepage&q=A%20reconnaissance%20view%20of%20the%20western%20U.S.%20Exclusive%20Economic%20Zone&f=false (accessed on 9 September 2017).
  7. EEZ-SCAN 84 Scientific Staff. Atlas of the Exclusive Economic Zone, Western Conterminous United States: U.S. Geological Survey Miscellaneous Investigations Series I-l792; U.S. Geological Survey: Reston, VA, USA, 1986.
  8. Damuth, J.E.; Kolla, V.; Flood, R.D.; Kowsmann, R.O.; Monteiro, M.; Gorini, M.A.; Palma, J.J.; Belderson, R.H. Distributary channel meandering and bifurcation patterns on the Amazon deep-sea fan as revealed by long-range side-scan sonar (GLORIA). Geology 1983, 11, 94–98. [Google Scholar] [CrossRef]
  9. Primez, C.; Flood, R.D. Morphology and Structure of Amazon Channel. Available online: http://www-odp.tamu.edu/publications/155_IR/VOLUME/CHAPTERS/ir155_03.pdf (accessed on 9 September 2017).
  10. Curray, J.R.; Moore, D.G. Growth of the Bengal deep-sea fan and denudation in the Himalayas. Geol. Soc. Am. Bull. 1971, 82, 563–572. [Google Scholar] [CrossRef]
  11. Weber, M.E.; Wiedicke, M.H.; Kudrass, H.R.; Hübscher, C.; Erienkeuser, H. Active growth of the Bengal Fan during sea-level rise and highstand. Geology 1997, 25, 315–318. [Google Scholar] [CrossRef]
  12. Hubscher, C.; Spieβ, V.; Breitzke, M.; Weber, M.E. The youngest channel-levee system of the Bengal Fan: Results from digital sediment echosounder data. Mar. Geol. 1997, 141, 125–145. [Google Scholar] [CrossRef]
  13. Curray, J.R.; Emmel, F.J.; Moore, D.G. The Bengal Fan: Morphology, geometry, stratigraphy, history and processes. Mar. Pet. Geol. 2003, 19, 1191–1223. [Google Scholar] [CrossRef]
  14. Schwenk, T.; Spieβ, V.; Hübscher, C.; Breitzke, M. Frequent channel avulsions within the active channel-levee system of the middle Bengal Fan-an exceptional channel-levee development derived from Parasound and Hydrosweep data. Deep-Sea Res. II 2003, 50, 1023–1045. [Google Scholar] [CrossRef]
  15. Deptuck, M.E.; Steffens, G.S.; Barton, M.; Pirmez, C. Architecture and evolution of upper fan channel-belts on the Niger Delta slope and in the Arabian Sea. Mar. Pet. Geol. 2003, 20, 649–676. [Google Scholar] [CrossRef]
  16. Kastens, K.A.; Shor, A.N. Evolution of a channel meander on the Mississippi deep-sea fan. Mar. Geol. 1983, 71, 165–175. [Google Scholar] [CrossRef]
  17. Twichell, D.C.; Kenyon, N.H.; Parson, L.M.; McGregor, B.A. Depositional patterns of the Mississippi Fan surface: Evidence from GLORIA II and high-resolution seismic profiles. In Seismic Facies and Sedimentary Processes of Submarine Fans and Turbidite Systems; Weimer, P., Link, M.H., Eds.; Springer: New York, NY, USA, 1991; pp. 349–363. [Google Scholar]
  18. Droz, L.; Bellaiche, G. Rhone Deep-Sea Fan: Morphostructure and growth pattern. Am. Assoc. Pet. Geol. Bull. 1985, 69, 460–479. [Google Scholar]
  19. Droz, L.; Marsset, T.; Ondréas, H.; Lopez, M.; Savoye, B.; Spy-Anderson, F.-L. Architecture of an active mud-rich turbidite system: The Zaire Fan (Congo-Angola margin southeast Atlantic): Results from ZaïAngo 1 and 2 cruises. Am. Assoc. Pet. Geol. Bull. 2003, 87, 1145–1168. [Google Scholar] [CrossRef]
  20. Mulder, T.; Savoye, B.; Piper, D.J.W.; Syvitski, J.P.M. The Var submarine sedimentary system: Understanding Holocene sediment delivery processes and their importance to the geological record. In Geological Processes on Continental Margins: Sedimentation, Mass-Wasting and Stability; Stocker, M.S., Evans, D., Cramp, A., Eds.; Special Publication 129; Geological Society of London: London, UK, 1998; pp. 145–166. [Google Scholar]
  21. Lonsdale, P.; Hollister, C.D. Cut-offs at an abyssal meander south of Iceland. Geology 1979, 7, 597–601. [Google Scholar] [CrossRef]
  22. Lewis, K.B.; Pantin, H.M. Channel-axis, overbank and drift sediment waves in the southern Hikurangi Trough, New Zealand. Mar. Geol. 2002, 192, 123–151. [Google Scholar] [CrossRef]
  23. Gardner, J.V.; Malik, M.; Walker, S. Plume 1400 meters high discovered at the seafloor off the northern California margin. EOS 2009, 90, 275. [Google Scholar] [CrossRef]
  24. Peakall, J.; McCaffrey, B.; Kneller, B. A process model for the evolution, morphology; architecture of sinuous submarine channels. J. Sediment. Res. 2000, 70, 434–448. [Google Scholar] [CrossRef]
  25. Tréhu, A.M.; Stakes, D.S.; Bartlett, C.D.; Chevallier, J.; Duncan, R.A.; Goffredi, S.K.; Potter, S.M.; Salamy, K.A. Seismic and seafloor evidence for free gas, gas hydrates; fluid seeps n the transform margin offshore Cape Mendocino. J. Geophys. Res. 2003, 108. [Google Scholar] [CrossRef]
  26. Ware, C.; Knight, W.; Wells, D. Memory intensive statistical algorithms for multibeam bathymetric data. Comput. Geosci. 1991, 17, 985–993. [Google Scholar] [CrossRef]
  27. Schumm, S.A.; Brakenridge, G.R. River responses. In The Geology of North America, North America and Adjacent Oceans during the Last Deglaciation; Ruddiman, W.F., Wright, H.E., Jr., Eds.; v. K-3; The Geological Society of America: Boulder, CO, USA, 1987; pp. 221–240. [Google Scholar]
  28. Shepard, F.P.; Dill, R.F. Submarine Canyons and Other Sea Valleys; Rand McNally & Company: Chicago, IL, USA, 1966. [Google Scholar]
  29. Nakajima, T.; Peakall, J.; McCaffrey, W.D.; Paton, D.A.; Thompson, P.J.P. Outer-bank bars: A new intra-channel architectural element within sinuous submarine slope channels. J. Sediment. Res. 2009, 79, 872–886. [Google Scholar] [CrossRef]
  30. Goldfinger, C.; Nelson, C.H.; Morey, A.E.; Johnson, J.E.; Patton, J.R.; Karabanov, E.; Gutiérrez-Pastor, J.; Eriksson, A.T.; Gàrcia, E.; Dunhill, G.; et al. Turbidite Event History–Methods and Implications for Holocene Paleoseismicity of the Cascadia Subduction Zone. Available online: http://www.wou.edu/las/physci/taylor/g473/Goldfinger_etal_2011_excerpt_reading.pdf (accessed on 9 September 2017).
  31. Lyle, M.; Koizumi, I.; Richter, C. Proceedings of the Ocean Drilling Program, Initial Reports; Site 1020; U.S. Government Printing Office: Washington, DC, USA, 1997.
  32. Manley, P.I.; Flood, R.D. Cyclic sediment deposition within Amazon deep-sea fan. Am. Assoc. Pet. Geol. Bull. 1988, 72, 912–925. [Google Scholar]
  33. Flood, R.D.; Manley, P.L.; Kowsmann, R.O.; Appi, C.J.; Pirmez, C. Seismic facies and late Quaternary growth of Amazon submarine fan. In Seismic Facies and Sedimentary Processes of Submarine Fans and Turbidite Systems; Weimer, P., Link, M.H., Eds.; Springer: New York, NY, USA, 1991; pp. 415–433. [Google Scholar]
  34. Carlson, R.L.; Gangi, A.F.; Snow, K.R. Empirical reflection-traveltime/depth and velocity/depth functions for the deep-sea sediment column. J. Geophys. Res. 1986, 91, 8249–8266. [Google Scholar] [CrossRef]
  35. Gorsline, D.S.; De Diego, T.; Nava-Sanchez, E.H. Seismically triggered turbidites in small margin basins: Alfonso Basin, western Gulf of California and Santa Monica Basin, California Borderland. Sediment. Geol. 2000, 135, 21–35. [Google Scholar] [CrossRef]
  36. Babonneau, N.; Cattaneo, A.; Ratzov, G.; Déverchère, J.; Yelles-Chaouche, A.; Lateb, T.; Bachir, R. Turbidite chronostratigraphy off Algiers, central Algerian margin: A key for reconstructing Holocene paleo-earthquake cycles. Mar. Geol. 2017, 384, 63–80. [Google Scholar] [CrossRef]
  37. Pope, E.L.; Talling, P.J.; Carter, L. Which earthquakes trigger damaging submarine mass movements: Insights from a global record of submarine cable breaks? Mar. Geol. 2017, 384, 131–146. [Google Scholar] [CrossRef]
  38. Adams, J. Paleoseismicity of the Cascadia subduction zone–Evidence from turbidites off the Oregon-Washington margin. Tectonics 1990, 9, 569–583. [Google Scholar] [CrossRef]
  39. Clarke, S.H., Jr.; Carver, G.A. Late Holocene tectonics and paleoseismicity, southern Cascadia subduction zone. Science 1992, 255, 188–192. [Google Scholar] [CrossRef] [PubMed]
  40. Smith, S.; Knapp, J.S.; McPherson, R.C. Seismicity of the Gorda plate, structure of the continental margin, and an eastward jump of the Mendocino triple junction. J. Geophys. Res. 1993, 98, 8153–8171. [Google Scholar] [CrossRef]
  41. Covault, J.A.; Graham, S.A. Submarine fans at all sea-level stands: Tectono-morphologic and climatic controls on terrigenous sediment delivery to the deep sea. Geology 2010, 38, 939–942. [Google Scholar] [CrossRef]
  42. Puig, P.; Ogston, A.S.; Mullenbach, B.L.; Nittrouer, C.A. Shelf-to-canyon sediment-transport processes on the Eel continental margin (northern California). Mar. Geol. 2003, 193, 129–149. [Google Scholar] [CrossRef]
  43. Parsons, J.D.; Friedrichs, C.T.; Traykovski, P.A.; Mohrig, D.; Imran, J.; Syvitski, J.P.M.; Parker, G.; Puig, P.; Buttles, J.L.; Garcia, M.H. The mechanics of marine sediment gravity flows. In Continental Margin Sedimentation: From Sediment Transport to Sequence Stratigraphy; Nittrouer, C.A., Austin, J.A., Field, M.E., Kravity, J.H., Syvitski, J.P.M., Wiberg, P.L., Eds.; International Association of Sedimentologists Special Publication 37; Wiley-Blackwell: Hoboken, NJ, USA, 2007; pp. 275–337. [Google Scholar]
  44. Nittrouer, C.A.; Austin, J.A.; Field, M.E.; Kravitz, J.H.; Syvitski, J.P.M.; Wiberg, P.L. Continental Margin Sedimentation: From Sediment Transport to Sequence Stratigraphy; International Association of Sedimentologists Special Publication 37; John Wiley & Sons, Inc.: Hoboken, NJ, USA, 2007. [Google Scholar]
  45. Jin, F.-F.; Bourharel, J.; Lin, I.-I. Eastern Pacific tropical yclones intensified by El Nino delivery of subsurface ocean heat. Nature 2014, 516, 82–84. [Google Scholar] [CrossRef] [PubMed]
  46. Cane, M.A. The evolution of El Niño, past and future. Earth Planet. Sci. Lett. 2005, 230, 227–240. [Google Scholar] [CrossRef]
  47. Felix, M.; Peakall, J.; McCaffrey, W.D. Relative importance of processes that govern the generation of particulate hyperpycnal flows. J. Sediment. Res. 2006, 76, 382–387. [Google Scholar] [CrossRef]
  48. Mulder, T.; Syvitski, J.P.M. Turbidity currents generated at river mouths during exceptional discharges to the world oceans. J. Geol. 1995, 103, 285–299. [Google Scholar] [CrossRef]
  49. Imran, J.; Syvitski, J.P.M. Impact of extreme river events on the coastal ocean. Oceanography 2000, 13, 85–92. [Google Scholar] [CrossRef]
  50. Mulder, T.; Syvitski, J.P.M.; Migeon, S.; Faugères, J.-C.; Savoye, B. Marine hyperpycnal flows: Initiation, behavior and related deposits: A review. Mar. Pet. Geol. 2003, 20, 861–882. [Google Scholar] [CrossRef]
  51. Dadson, S.J.; Hovius, N.; Chen, H.; Date, W.B.; Lin, J.-C.; Hsu, M.-L.; Lin, C.-W.; Horng, M.J.; Chen, T.-C.; Milliman, J.; et al. Earthquake-triggered increase in sediment delivery from an active mountain belt. Geology 2004, 32, 733–736. [Google Scholar] [CrossRef]
  52. Nittrouer, C.A.; Austin, J.A.; Field, M.E.; Kravitz, J.H.; Syvitski, J.P.M.; Wiberg, P.L. Writing a Rosetta stone: Insights into continental-margin sedimentary processes and strata. In Continental Margin Sedimentation: From Sediment Transport to Sequence Stratigraphy; International Association of Sedimentologists Special Publication 37; Wiley-Blackwell: Hoboken, NJ, USA, 2007. [Google Scholar]
  53. Wynn, R.B.; Weaver, P.P.E.; Ercilla, G.; Stow, D.A.V.; Masson, D.G. Sedimentary processes in the Selvage sediment-wave field, NE Atlantic: New insights into the formation of sediment waves by turbidity currents. Sedimentology 2007, 47, 1181–1197. [Google Scholar] [CrossRef]
  54. Piper, D.J.W.; Savoye, B. Processes of late Quaternary turbidity current flow and deposition of the Var deep-sea fan, north-west Mediterranean Sea. Sedimentology 1993, 40, 557–582. [Google Scholar] [CrossRef]
  55. Kao, S.J.; Dai, M.; Selvaraj, K.; Zhai, W.; Cai, P.; Dhen, S.N.; Yang, J.Y.T.; Liu, J.T.; Liu, C.C.; Syvitski, J.P.M. Cyclone-driven deep sea injection of freshwater and heat by hyperpycnal flow in the subtropics. Geophys. Res. Lett. 2010, 37, 1–5. [Google Scholar] [CrossRef]
  56. Gavey, R.; Carter, L.; Liu, J.T.; Talling, P.J.; Hsu, R.; Pope, E.; Evans, G. Frequent sediment density flows during 2006 to 20154, triggered by competing seismic and weather events: Observations from subsea cable breaks off southern Taiwan. Mar. Geol. 2017, 384, 147–158. [Google Scholar] [CrossRef]
  57. Lee, H.J.; Locat, J.; Desgagnés, P.; Parsons, J.D.; McAdoo, B.G.; Orange, D.L.; Puig, P.; Wong, F.L.; Dartnell, P.; Boulanger, E. Submarine mass movements on continental margins. In Continental Margin Sedimentation: From Sediment Transport to Sequence Stratigraphy; Nittrouer, C.A., Austin, J.A., Field, M.E., Kravitz, J.H., Syvitski, J.P.M., Wiberg, P.L., Eds.; International Association of Sedimentologists Special Publication 37; Wiley-Blackwell: Hoboken, NJ, USA, 2007; pp. 213–274. [Google Scholar]
  58. Sumner, E.J.; Paull, C.K. Swept away by a turbidity current in Mendocino submarine canyon, California. Geophys. Res. Lett. 2014, 41, 7611–7618. [Google Scholar] [CrossRef]
  59. Shackleton, N.J. Oxygen isotopes, ice volume and sea level. Quat. Sci. Rev. 1987, 6, 183–190. [Google Scholar] [CrossRef]
  60. De Boer, B.; van de Wal, R.S.W.; Bintanja, R.; Lourens, L.J.; Tuenter, E. Cenozoic global ice-volume and temperature simulations with 1-D ice-sheet models forced by benthic δ18O records. Ann. Glaciol. 2010, 51, 23–33. [Google Scholar] [CrossRef]
  61. Shanmugam, G. The tsunamite problem. J. Sediment. Res. 2006, 76, 718–730. [Google Scholar] [CrossRef]
  62. Bourgeois, J. Geologic effects and records of tsunamis. In The Sea; Robinson, A.R., Bernard, E.N., Eds.; v. 15: Tsunamis; Harvard University Press: Cambridge, MA, USA, 2009; pp. 53–91. [Google Scholar]
  63. Paris, R.; Fournier, J.; Poizot, E.; Etienne, S.; Morin, J.; Lavigne, F.; Wassmer, P. Boulder and fine sediment transport and deposition by the 2004 tsunami in Lhok Nga (western Banda Aceh, Sumatra, Indonesia): A coupled offshore-onshore model. Mar. Geol. 2010, 268, 43–54. [Google Scholar] [CrossRef]
  64. Yamazaki, Y.; Cheung, K.F. Shelf resonance and impact of near-field tsunami generated by the 2010 Chile earthquake. Geophys. Res. Lett. 2011, 38. [Google Scholar] [CrossRef]
  65. Sakuna, C.; Szczuciński, W.; Feldens, P.; Schwarzer, K.; Khokiattiwong, S. Sedimentary deposits left by the 2004 Indian Ocean tsunami on the inner continental shelf offshore of Khao Lak, Andaman Sea (Thailand). Earth Planets Space 2012, 64, 931–943. [Google Scholar] [CrossRef]
  66. Atwater, B.F.; Hemphill-Haley, E. Recurrence Intervals for Great Earthquakes of the Past 3500 Years at Northeastern Willapa Bay; U.S. Government Printing Office: Washington, DC, USA, 1997; p. 108.
  67. Hemphill-Haley, E. Diatom evidence for earthquake-induced subsidence and tsunami 300 yr ago in southern coastal Washington. Geol. Soc. Am. Bull. 1995, 107, 367–378. [Google Scholar] [CrossRef]
  68. Garrison-Laney, C.E.; Abramson-Ward, H.F.; Carver, G.A. Late Holocene tsunamis near the southern end of the Cascadia subduction zone. Seismol. Res. Lett. 2002, 73, 248. [Google Scholar]
  69. Weiss, R. Sediment grains moved by passing tsunami waves: Tsunami deposits in deep water. Mar. Geol. 2008, 50, 251–257. [Google Scholar] [CrossRef]
  70. Schumm, S.A. Patterns of alluvial rivers. Annu. Rev. Earth Planet. Sci. 1985, 13, 5–27. [Google Scholar] [CrossRef]
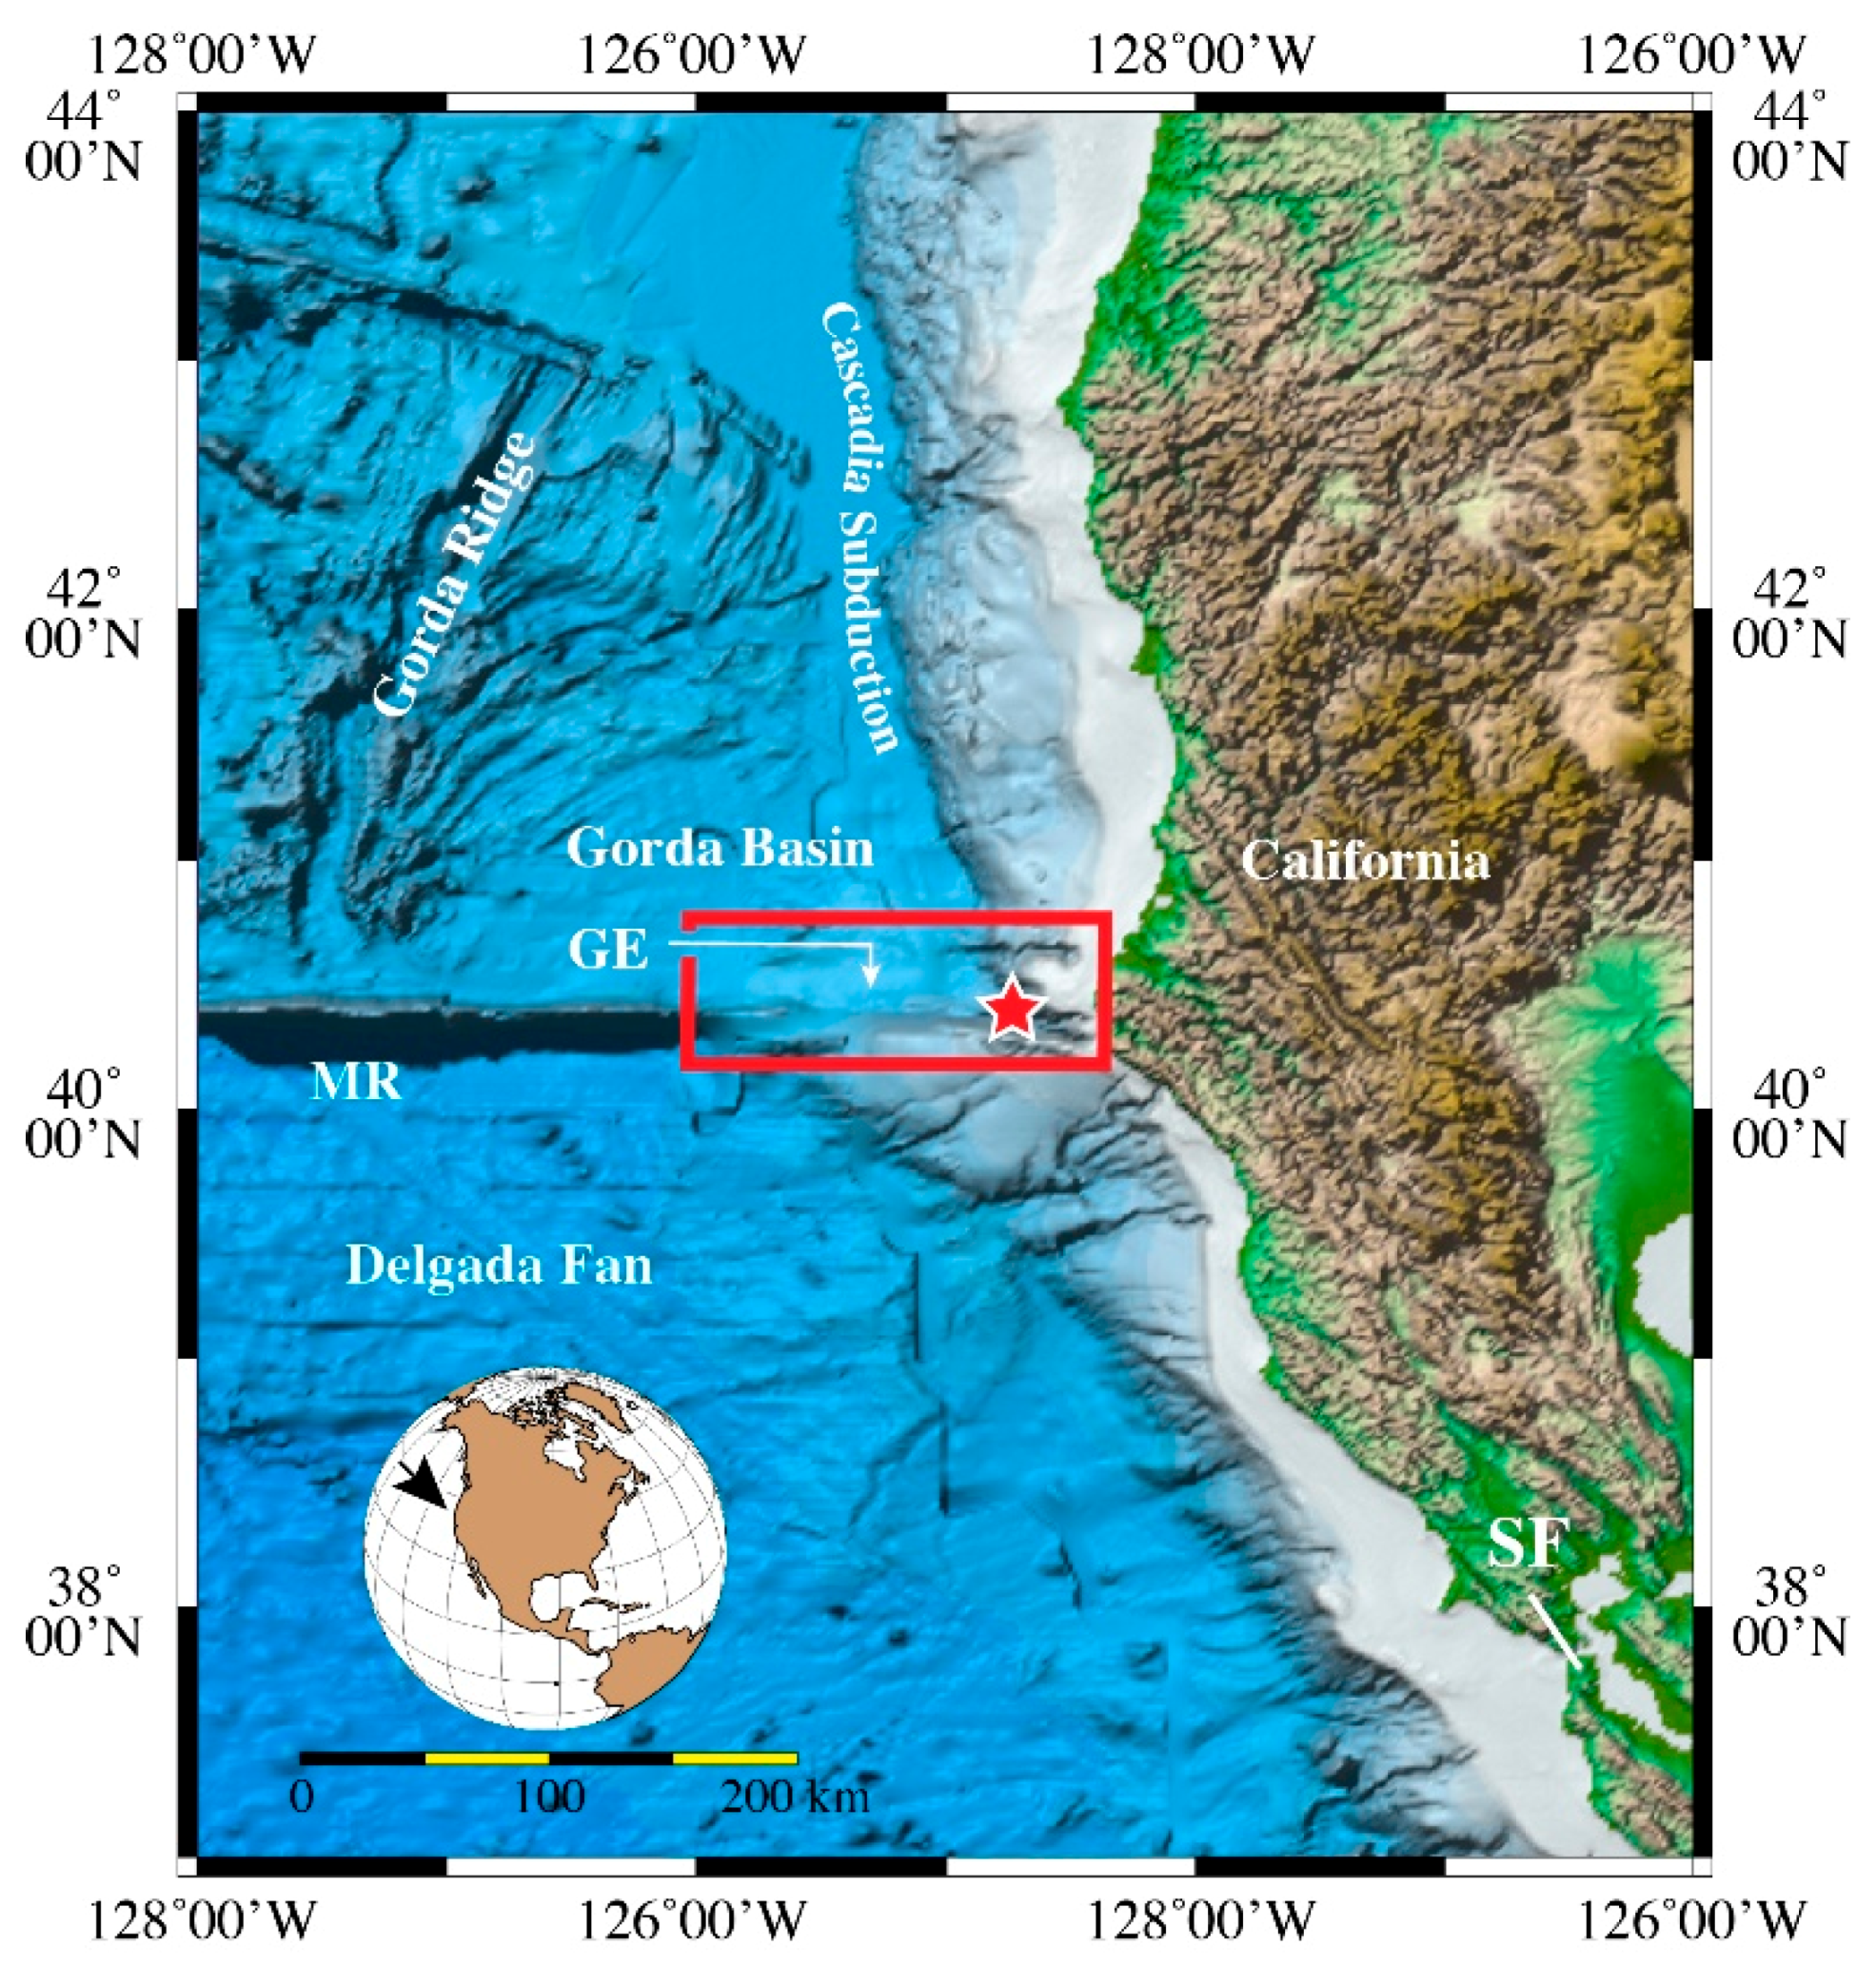
Figure 1. Location of Mendocino Channel (red rectangle) at the base of the northern flank of Gorda Escarpment (GE) in the eastern Pacific Ocean. Red star is Mendocino Triple Junction, MR is Mendocino Ridge and SF is San Francisco, CA. Data from Geomapapp.org v. 3.6.6.
Geosciences 07 00124 g001
Figure 2. (Upper) Overview map view of multibeam bathymetry of the summit and northern flank of Gorda Escarpment, southern-most Gorda Fan and Gorda Basin to the north. Bathymetry east of red dashed line from NOAA Coastal Relief Model (https://ngdc.noaa.gov/mgg/coastal/crm.html) (See text). Contour interval 100 m. (Lower) Locations of Mendocino and Mattole Canyon channels and upper side channel (red), landslides (yellow) and levees (purple). Black circles every 10 km mark distances in italics from the junction of Mendocino and Mattole Canyons. White “CM” is Cape Mendocino, Calif., white arrow head is location where Mendocino Channel captured Mattole Channel. LSs is landslide scar. Locations of subsequent figures shown as black rectangles.
Geosciences 07 00124 g002
Figure 3. (a) GLORIA (6.5-kHz sidescan sonar) backscatter image of the eastern portion of Mendocino Channel, modified from [5]; (b) Multibeam bathymetry of same area. Dashed line (yellow and black) outline area of high 6.5-kHz backscatter in area immediately north of crevasse splay (see text for discussion). Location slightly larger than rectangle labeled “Fig. 10” on Figure 2.
Geosciences 07 00124 g003
Figure 4. Multichannel seismic-reflection profiles (EW9905) collected by Tréhu et al. [25] and accessed at www.geomapapp.com. TWTT is two-way travel time. Red circle surrounds location of Mendocino Channel; red arrow is location of the distal end of the levee. Large black arrows show the progression of seismic lines from east to west. No channel was resolved on lines 6, 8 and 23. USC is upper side channel (see canyon discussion below).
Geosciences 07 00124 g004aGeosciences 07 00124 g004b
Figure 5. Plots of relationships between (a) upper straight reach (USR) and upper sinuous reach (USinR) levee heights vs. distance down-channel. Curly black bracket is gap in USR north levee heights in an otherwise smooth decrease and curly white bracket is gap in USinR north levee heights; (b) USR channel floor width and channel top width vs. distance down-channel; (c) plot of USinR channel cross-sectional area vs. distance down-channel; (d) plot of LSR levee heights vs. distance down-channel; (e) plots of LSR perched height above basin depth and depth of channel floor vs. distance down-channel; (f) plots of entire Mendocino Channel floor width and channel incision depth vs. distance down-channel. Curly bracket is gap in channel width and depth with down-canyon distance; (g) plots of entire Mendocino Channel perched height above basin depths and levee height vs. distance down-channel.
Geosciences 07 00124 g005
Figure 6. Map view of NOAA Coastal Relief Model bathymetry of Mendocino and Mattole Canyons. Features labeled Tx are 6 individual terraces (see discussion in text) and white arrowhead is an 80 m step-down of the floor of Mattole Channel to the floor of Mendocino Channel at the capture point. Ls points to two scarps on the wall of Mattole Canyon. USR is Upper Straight Reach of Mendocino Channel. See Figure 2 for location.
Geosciences 07 00124 g006
Figure 7. Thalweg profiles of Mendocino Canyon channel (red) and Mattole Canyon channel (black). Note the rough and subtle concave-down profile of Mendocino Canyon channel relative to the smooth but stepped distinct concave-up profile of Mattole Canyon channel.
Geosciences 07 00124 g007
Figure 8. Map view of multibeam bathymetry of the upper straight reach (USR). Ten km black circles mark distances in km in italics from the junction of Mendocino and Mattole Canyons. White dashed arrow shows thalweg of upper side channel (see discussion below), red “a” is the point where the upper side channel enters the USR, red “b” is a large 60 m high mound on the floor of Mendocino Channel (see text) and red “c” is 90° channel bend. “Mdcyn” is lower Mendocino Canyon and “Mtcyn” is lower Mattole Canyon. Red dashed lines outline landslide scarps (Ls) with area of hummocky relief in gray. Isobath interval is 50 m, representative 100 m isobaths are labeled. Isobaths of Gorda Escarpment intentionally not labeled. See Figure 2 for location.
Geosciences 07 00124 g008
Figure 9. (a) Map view of multibeam bathymetry of upper side channel. White dashed line and arrowhead traces the thalweg of the upper side channel. Red “b” points to large mound on upper straight reach (USR) floor. Isobaths of Gorda Escarpment intentionally left unlabeled; (b) Perspective view with 5× vertical exaggeration of multibeam bathymetry of the upper side channel, north wall of Gorda Escarpment, and the floor of upper straight reach. Red “b” points to large mound on USR floor; (c) Perspective view of multibeam acoustic backscatter draped on the multibeam echosounder (MBES) bathymetry of upper side channel (white dashed line and arrowhead), the north wall of Gorda Escarpment, floor of upper straight and upper sinuous reaches and adjacent levee. White “a” is entry point of upper side channel to Mendocino Channel, white “b” points to large mound on USR floor. Note the high backscatter (red and yellow colors) in Mendocino Channel floor that begins where the upper side channel enters the Mendocino Channel floor and continues down-channel.
Geosciences 07 00124 g009
Figure 10. (a) Map view of MBES bathymetry and (b) backscatter of upper sinuous reach floor (grayed area) and immediate surrounding area. “b1”and “b2” are two large mounds on the floor of the reach. A cut-off meander occurs 14 km down-channel. Black circles in (a) mark 10 km distances in italics from the junction of Mendocino and Mattole Canyons. See Figure 2 for location. Isobath interval 25 m; isobaths of north wall of Gorda Escarpment intentionally left unlabeled.
Geosciences 07 00124 g010
Figure 11. (a) Map view of middle of upper sinuous reach (USinR) that shows the cut-off chute that created cut-off meander D and the depression and channel on the southern bank of bend A perched 18 m above the adjacent floor of the USinR. White dashed arrow marks the path of the abandoned channel that leads to the depression. Black circles mark distances in km in italics from the junction of Mendocino and Mattole Canyons. Isobaths of Gorda Escarpment intentionally left unlabeled; (b) Perspective view of the same area and features.
Geosciences 07 00124 g011
Figure 12. MBES backscatter image of crevasse splay with isobaths. White outline is the extent of the high-backscatter sediment of the crevasse splay that broke out of the channel towards the north (black dashed arrows). Red dashed line is the thalweg of Mendocino Channel. Black circles mark distances in km in italics from the junction of Mendocino and Mattole Canyons. Isobath interval 10 m, isobaths of Gorda Escarpment intentionally left unlabeled. See Figure 2 for location.
Geosciences 07 00124 g012
Figure 13. (a) Map view of multibeam bathymetry of the lower sinuous reach and large landslide deposit (white dashed polygon labeled LS) shed off the Gorda Escarpment. Terraces (T) are numbered and discussed in the text. Red dashed bracket is the zone of 3–5 m of relief that presently blocks the channel, discussed in the text. Black hachured lines outline a relict channel. Ten km black circles mark distances in km in italics from the junction of Mendocino and Mattole Canyons; (b) Map view of multibeam backscatter of the lower sinuous reach that shows that the high backscatter from up-channel slowly decreases in intensity with distance down-channel. CS is crevasse splay. See Figure 2 for location.
Geosciences 07 00124 g013
Figure 14. Map view of multibeam bathymetry of the western end of the lower straight reach (LSR) and the western-most lower sinuous reach (LSinR). LSR outlined in red. Ten km black circles mark distances in km in italics from the junction of Mendocino and Mattole Canyons. Red dashed lines outline two abandoned channels. The end of levees on either side of Mendocino Channel indicated with a black arrowhead. Isobath interval 10 m. See Figure 2 for location.
Geosciences 07 00124 g014
Figure 15. Location map of piston (circles) and box (squares) cores from within the channel and the north levee of Mendocino Channel. Numbers within the symbols indicate the core number in the core descriptions below the map. BX indicates a box core and the other cores are piston cores. Piston core descriptions were downloaded from www.ngdc.noaa.gov/mgg/curator/data/melville/avon/avon09mv/047/. Descriptions of box cores are from [5]. AMS14C ages of box cores in italics from [5] and from piston cores from [30].
Geosciences 07 00124 g015
Figure 16. Map view of Coastal Relief Model bathymetry of heads of Mendocino and Mattole Canyons. The 120 and 130 m isobaths represent the range of the shoreline at the glacial maximum isostatic low stands of eustatic sea level. See Figure 2 for location.
Geosciences 07 00124 g016
Table 1. LSinR terrace water depths and heights above channel floor.
Terrace NumberTerrace Water Depth (m)Height above Channel (m)Terrace Orientation
T128464flat
T228578tilt towards channel 1.2°
T3289115tilt towards channel 1.6°
T4288720tilt towards channel 1.4°
T5289715tilt towards channel 1.5°
T6290921tilt towards channel 3.2°
T7291227tilt towards channel 1.5°
T8291427flat
T9292424flat
T10292325flat