Abstract
The present work reconsiders our current knowledge of the presence of brachiopod genera in the Chattian and Aquitanian stages (late Oligocene and Early Miocene, respectively). Two of the most important sources of paleontological information were used. The uncertain presence of taxa in the particular stages was recorded. The results indicated that the total number of brachiopod genera in the Chattian and the Aquitanian was generally the same, irrespective of the chosen dataset. If so, the short-term paleoenvironmental perturbations did not affect the generic diversity of brachiopods. These findings contribute to a better understanding of the presently available, traditional estimates of the generic diversity of brachiopods. However, further critical consideration and improvement of the data and application of some advanced analytical tools is needed.
1. Introduction
Classical (traditional) fossil diversity estimates and, first of all, calculations of the total number of taxa in geologic time units still matter in contemporary paleontology and geology. Fresh examples can be found in the enriching works by Pérez-Claros [1] and Stock et al. [2]. Paying attention to such estimates can also be helpful to enhance the development and diversification of new-generation, advanced techniques such as those considered by Alroy [3].
Of special interest are those situations in which the alternative paleontological datasets depict changes in the total number of taxa with significant differences. A typical example is as follows. The Oligocene–Miocene transition lasted >5 Ma [4], and Ruban [5] noted the differently measured generic diversity dynamics of brachiopods across it. This transition is treated as the interval consisting of the Chattian and Aquitanian stages. When the paleontological data from the most authoritative synthesis of the knowledge of brachiopods [6,7,8,9,10] was used, a significant diversity rise across this transition became evident [11]. In contrast, when the other modern source of information was employed, a more or less notable decrease in the total number of genera was realized [12]. How should this difference be understood? Answering this question is especially important because contemporary specialists sometimes (if not often) choose between two “camps”—one preferring the classical paleontological datasets such as Treatise on Invertebrate Paleontology [6,7,8,9,10] and the other preferring only new-age, regularly updated, online sources such as the Paleobiology Database [12]. Apparently, the choices are made subjectively in many cases. Moreover, answering the noted question is necessary to determine how the available paleontological data can be improved. Abandoning the classical diversity estimates seems to be unreasonable.
The objective of the present work is to reconsider the already available knowledge of the generic diversity of brachiopods at the Oligocene–Miocene transition, paying special attention to stratigraphic ranges of taxa. The main task is to realize how these ranges are represented in the available paleontological datasets. This study is moderate in its ambitions and rather methodological, and it does not pretend to make any fundamental advance in understanding the generic diversity of brachiopods at the Oligocene–Miocene transition. This study follows on from the discussion started by Ruban [5], but fully differs in its focus and approach.
This work deals with different, traditional diversity estimates. A practical argument for such a focus is as follows. If a geologist or paleontologist decides to examine the diversity changes of brachiopods at the Oligocene–Miocene transition (e.g., for comparison with any geological pattern), it is very probable that this specialist will begin by looking at the traditionally drawn curves: one provided by Curry and Brunton [11] and the other generated with the Paleobiology Database [12]. Both curves will be considered in their original form and irrespective of possible errors in the underlying paleontological datasets. Then, this geologist or paleontologist will note the differences of these curves, and thus, it will be important to explain them, irrespective of how well the chosen curves reflect the true diversity changes. The present work attempts to provide such an explanation regarding the possible uncertainties in the stratigraphic ranges of taxa.
2. Materials and Methods
2.1. General Problem
Uncertainties in paleontological data are very difficult to minimize. However, it would be incorrect to postpone diversity estimates and wait for the quality of this data to improve through further paleontological and stratigraphical research. One must agree with Benton et al. [13], who explained that the various limitations of paleontological data that hinder diversity analysis are (almost) unavoidable and, therefore, should be accepted “as they are” (although specific approaches can help to minimize these limitations).
To understand the above-mentioned difference between the alternative brachiopod generic diversity estimates, it is important to examine how these estimates were made and, if necessary, to replicate them. The outline of the present work is presented in Figure 1.
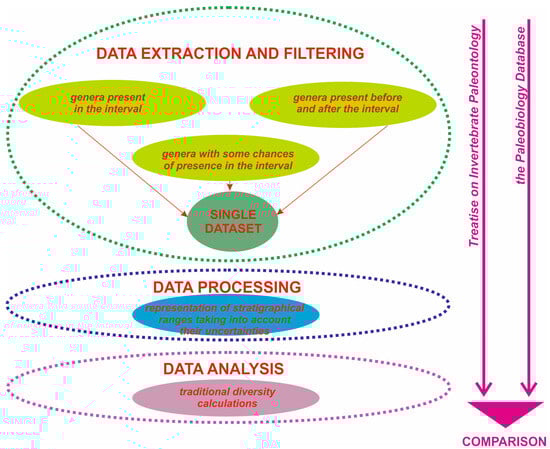
Figure 1.
A sequence of procedures followed in the present work. Arrows indicate the direction of the workflow.
Curry and Brunton [11] analyzed information from Treatise on Invertebrate Paleontology [6,7,8,9,10]. Close attention to this information reveals that the stratigraphic ranges of many genera were documented with significant uncertainties. For instance, consider a genus with a range defined as Eocene–Oligocene. This means that the taxon disappeared either in the Rupelian or the Chattian. Now imagine the range of another genus, which is Miocene–Pleistocene. This means that this brachiopod appeared in one of the six stages of the Miocene Epoch, not necessarily in the Aquitanian. The same problem, although to a lesser extent, exists in the Paleobiology Database [12]. This means that the number of brachiopod genera in the Chattian and Aquitanian stages should be recalculated, taking into account the noted stratigraphic uncertainties.
2.2. Procedures
The lists of potentially Chattian and Aquitanian brachiopods were extracted from the work by Curry and Brunton [11] and the Paleobiology Database [12]. The expressions “potentially Chattian” and “potentially Aquitanian” mean that these lists include three groups of genera: brachiopods known with certainty from these stages; brachiopods known from older and younger intervals (in such cases, their ranges crossed the Oligocene–Miocene transition); and brachiopods with ranges documented in such a way that only the possibility of their existence in the considered stages remains (e.g., Oligocene, Miocene, Early Miocene, Paleogene, etc.). Information on all taxa from the extracted lists was checked against the relevant sources, i.e., Treatise on Invertebrate Paleontology [6,7,8,9,10] and the Paleobiology Database [12]. The presence of genera in the Chattian and the Aquitanian was expressed probabilistically (see below) and separately for the two datasets.
For each case of uncertainty, a probability of the taxon’s presence in a given stage was assigned. For instance, if a given genus was reported from the Chattian, its presence was valued as 1.0. Similarly, if a given genus was reported from the Eocene and the Pliocene, its presence in the Chattian was also valued as 1.0 (although an attempt was made to identify all such genera, the search engines used may have missed a few, which is a limitation, albeit apparently not a significant one). However, if a given genus was reported from the Oligocene (without stage specification), an equal probability of its presence in all stages of this series was assumed. The presence of such a genus in the Chattian was recorded as 0.5 because the Oligocene consists of two stages. The Miocene consists of six stages; thus, if the presence of a genus was reported for the entire Miocene, the probability of its existence in the Aquitanian was valued as 0.17. Additionally, the presence of some taxa was documented as questionable in the considered sources of information, and thus it was valued as 0.1. This approach does not aim to significantly improve the diversity estimates and therefore does not elevate them to a new, higher level of quality. Its purpose is solely to make the already available, traditional estimates expressed in a more or less similar manner—that is, to make them compatible.
Five diversity indices were considered (Table 1). Three of them (Dt1, Dp1, and Dp2—the original estimates) were taken from the original sources [11,12], and the other two (Dt2 and Dp3—the probabilistic estimates) were calculated based on the probabilistic values of genus presence in the stages (see above). These indices were then compared to assess how stratigraphic uncertainties influence the diversity estimates.

Table 1.
Indices used to express the generic diversity of brachiopods in the present study.
3. Results
A total of 91 brachiopod genera were considered for the Chattian–Aquitanian interval based on paleontological data from Treatise on Invertebrate Paleontology [6,7,8,9,10]. The stratigraphic ranges of many of them are reported with uncertainty (Table 2). The probabilistic expression of their presence in the Chattian and the Aquitanian is shown in Table A1. Taking these values into account, the generic diversity for the Chattian was Dt2 = 54.01 and for the Aquitanian it was Dt2 = 53.88. This means that the total number of genera remained almost the same across the Oligocene–Miocene transition. A decrease by a factor of 1.002 can be considered insignificant.
A total of 75 brachiopod genera were considered for the Chattian–Aquitanian interval based on paleontological data from the Paleobiology Database [12]. The stratigraphic ranges of a small number of them were reported with uncertainty (Table 2). The probabilistic expression of their presence in the Chattian and the Aquitanian is shown in Table A2. Taking these values into account, the generic diversity for the Chattian was Dp3 = 66.11 and for the Aquitanian it was Dp3 = 61.67. This means that the total number of genera decreased only very slightly at the Oligocene–Miocene transition. A decrease by a factor of 1.07 cannot be considered significant, and one can postulate the absence of any fundamental diversity change.
A comparison of the diversity indices reflected in Figure 2 yields three main outcomes. First, Dt2 indicates the absence of any diversity increase in the Aquitanian relative to the Chattian. Second, Dp3 indicates a weak, ephemeral diversity decline. Third, although Dp3 is generally higher than Dt2, both imply that generic brachiopod diversity remained stable across the Oligocene–Miocene transition.
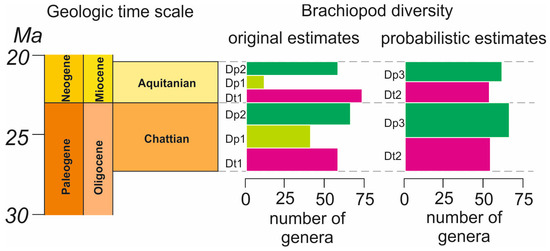
Figure 2.
The generic diversity of brachiopods in the Chattian and the Aquitanian. See Table 1 for the explanation of the diversity indices. The geologic time scale follows the developments of the International Commission on Stratigraphy [4]. Time units are colored standardly, and columns on the graphs are colored provisionally for a better visual distinction of the patterns. Dashed lines correspond to the stage boundaries.
4. Discussion
4.1. Understanding the Differences Between the Original Diversity Estimates
At first glance, the differences between the original diversity estimates (Dt1 and Dp1, Dp2) can be explained by some essential differences in the paleontological datasets used. A simplistic idea is that the Paleobiology Database [12] updates Treatise on Invertebrate Paleontology [6,7,8,9,10] due to subsequent reports of new genera and taxonomic corrections. However, there are two serious arguments against this idea. First, knowledge of Cenozoic brachiopods has not been updated significantly, with only several regional studies [14], reports of new genera [15], and certain taxonomic improvements [16] during the past two decades. Nonetheless, one should note the debates on the essential information used in the identification and representation of brachiopod taxa [17]. Second, the results of the present study imply that the probabilistic estimates (Dt2 and Dp3) indicate similar changes (or better said, their absence). This means that taxonomic developments are not a sufficient explanation for the differences between the original diversity estimates.
The main source of the above-mentioned differences is linked to the incompatible quality of the stratigraphic ranges of taxa presented in Treatise on Invertebrate Paleontology [6,7,8,9,10] and the Paleobiology Database [12]. Apparently, the total number of genera was overestimated by Curry and Brunton [11] due to counting taxa which did not necessarily exist in the particular stages, i.e., their existence was only potential. When probabilistic values are used, the difference between the diversity estimates disappears. A comparison of the lists of taxa (Table A1 and Table A2) shows that the Paleobiology Database [12] reports 1.2 times fewer genera than Treatise on Invertebrate Paleontology [6,7,8,9,10]. A detailed check of both datasets indicates that the noted difference does not result from poorer coverage of brachiopod genera in the Paleobiology Database [12]. The true cause is the different documentation of the stratigraphic ranges of some taxa. These interpretations imply that in addition to minimizing the sampling bias of fossil records [18,19,20], paleobiologists should strive against various stratigraphic uncertainties.
The presence of brachiopod genera in the Aquitanian and the Chattian is documented with significantly better certainty in the Paleobiology Database [12] (Table A2) than in Treatise on Invertebrate Paleontology [6,7,8,9,10] (Table A1). This evidence could be used as an argument for the better quality of the paleontological data in the former. However, two other arguments should be considered. First, sampling bias cannot be excluded (its examination is outside the scope of the present study). Second, it is unclear whether the stratigraphic ranges in the Paleobiology Database [12] are truly correct when they differ from those in Treatise on Invertebrate Paleontology [6,7,8,9,10]. The same reasons can be used to realize that the outcomes of the present study only signify that the evidence from the two paleontological datasets is comparable, but not necessarily correct. In other words, this study explains why brachiopod diversity can be measured differently without attention to stratigraphic uncertainties, but paleontologists may still be far from understanding what actually happened to the total number of brachiopod genera at the Oligocene–Miocene transition. The stability of generic diversity (Figure 2) can only be accepted as a tentative scenario.
4.2. Avoiding Paleoenvironmental Misinterpretations
The planetary climate changed significantly during the Cenozoic, with significant effects on biotic evolution, as shown by Deng et al. [21], Figueirido et al. [22], Kuznetsov [23], Lazarus et al. [24], Marx and Uhen [25], Rousseau et al. [26], and Samuels and Hopkins [27]. The Oligocene–Miocene transition involved significant environmental perturbations, including the so-called Mi-1 glaciation [28,29,30,31,32,33,34]. There were shifts and fluctuations in temperature [35,36,37], carbon dioxide concentration [38], ice volume [39,40], and global sea level [41,42]. Methane hydrates dissociated [43], and biotic turnovers and extinctions occurred [44,45,46]. Scotese et al. [36] outlined the Late Oligocene Warm Interval (a significant part of the Chattian) interrupted by the Late Oligocene Warm Event (mid-Chattian) and the Early Miocene Cool Interval (which started in the Aquitanian and extended into the Burdigalian) preceded by the Early Miocene Cool Event (Figure 3).
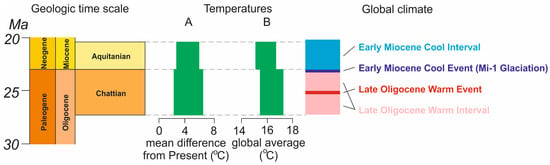
Figure 3.
The global climate context of the Chattian and the Aquitanian. Temperature ranges: A—following [37], B—following [36]. The width of the green bars indicate the differences between the minimum and maximum temperatures interpreted for the stage. The global climate episodes are shown according to Scotese et al. [36]. The geologic time scale follows the developments of the International Commission on Stratigraphy [4].
The original diversity estimates (Dt1 and Dp1, Dp2) permitted the formulation of two opposing hypotheses. First, global environmental perturbations positively affected brachiopod communities (e.g., due to the creation of new niches alongside cooling and increased differentiation of global environments). This hypothesis is related to the diversity estimates based on Treatise on Invertebrate Paleontology [6,7,8,9,10] (see Dt1 in Figure 2). Second, the same perturbations negatively affected brachiopod communities (e.g., via the global establishment of unfavorable conditions or the significant stress from short-term shifts in seawater temperature). This hypothesis is related to the diversity estimates based on the Paleobiology Database [12] (see Dp1 and Dp2 in Figure 2).
The implication of the probabilistic approach suggests that neither of the above-proposed hypotheses is correct. Irrespective of which dataset is chosen, the generic diversity of brachiopods remained stable across the Oligocene–Miocene transition (see Dp2 and Dt3 in Figure 2). If so, one must hypothesize that brachiopods were either resistant to the global environmental perturbations at this transition or recovered quickly from the short-term stress associated with the Mi-1 event, and the effect of the latter on brachiopods cannot be detected at the stage level. Perhaps both explanations are correct. However, they may also be premature. On the one hand, they are related to the information on Chattian–Aquitanian brachiopods considered in the present work (Table A1 and Table A2), not to their actual diversity changes, which are yet to be revealed. On the other hand, the temporal scale of global climate changes must be addressed (see below).
The Chattian represented the Late Oligocene Warm Interval, and the Aquitanian corresponded to the Early Miocene Cool Interval [36]. Judd et al. [35] indicated a shift from transitional to coolhouse conditions in the Chattian–Aquitanian. However, a detailed examination of the reconstructions proposed by Scotese et al. [36] and Westerhold et al. [37] implies that the global temperatures averaged over the entire Chattian and Aquitanian stages did not differ significantly (Figure 3). This interpretation is consistent with the probabilistic diversity estimates made in the present work (Figure 2). The absence of overly strong changes in temperatures averaged over entire stages could be a more important control on generic diversity than single, short-term episodes of global environmental change. This is another hypothesis requiring verification by future studies.
4.3. Conclusive Remarks and Wider Perspective
Three principal outcomes of the present reconsideration of the available knowledge on the generic diversity of brachiopods at the Oligocene–Miocene transition are as follows:
- (1)
- the presence of brachiopod genera in the Chattian and Aquitanian stages is reported with many uncertainties in the available datasets;
- (2)
- after the probabilistic expression of the stratigraphic ranges of brachiopod genera, the difference between the diversity estimates disappears, and it becomes clear that diversity remained stable across the transition;
- (3)
- the apparent absence of any strong changes in brachiopod diversity across the Oligocene–Miocene transition may be explained by the stage-long state of the global environment.
The present analysis stresses the urgency of attention to various uncertainties in the available sources of paleontological data when diversity changes are measured. For instance, stratigraphic uncertainties can be no less (or even more) important than sampling bias. Many fossil diversity estimates need reconsideration through careful analysis of the related datasets.
The present study only explains the difference between the selected traditional estimates of the generic diversity of brachiopods at the Oligocene–Miocene transition. Proposing a new-generation diversity curve for this time slice seems a more ambitious task, requiring some advanced techniques (e.g., those considered by Alroy [3]). A solution to this important task is left for future investigations. Nonetheless, the analysis of the available paleontological data for the purpose of the present study raises an intriguing question: Which dataset should be employed in future investigations? Presently, all causes of the differences in stratigraphic ranges between Treatise on Invertebrate Paleontology [6,7,8,9,10] and the Paleobiology Database [12] cannot be detected, and thus it would be difficult to make a clear choice between these sources of information.
The present study focuses on the uncertainties of the stratigraphic ranges of taxa. But there may be uncertainties and errors of other kinds; moreover, occasional errors in the above-mentioned sources of paleontological knowledge can exist. For instance, why is Seymourella documented as an Eocene–Oligocene taxon in one case [9] and as an Eocene genus in the other case [12]? Is it possible that an occasional error was made in the first case when the information was compiled from the original source(s)? Similarly, the Paleobiology Database [12] includes Liothyrina, although the status of this genus has already been reconsidered [47,48]. Why is it still present in the mentioned source? Such questions do not seem uncommon, and special studies will be required in the future to obtain proper answers and make the related improvements. Therefore, high-quality data can mean more than the choice of proper methodology (either traditional or new-age, advanced). Additional work is necessary to check how correct (in various aspects) the information in Treatise on Invertebrate Paleontology [6,7,8,9,10] was for the time when it was published, and how correct (also in various aspects) the brachiopod-related data in the Paleobiology Database [12] are presently. Some advanced tools can become helpful [49], although their application will require the development of skills (new errors can arise from insufficient skills). In any case, preparing syntheses of data (either as published monographs or online databases) and their subsequent critical re-examination will remain essential, never-ending tasks of paleobiological research in the future.
Funding
This research received no external funding.
Data Availability Statement
All data are contained within the article.
Conflicts of Interest
The author declares no conflicts of interest.
Appendix A
Table A1.
Probabilistic expression of the stratigraphical distribution of brachiopod genera in the Chattian–Aquitanian interval based on the information from Treatise on Invertebrate Paleontology [6,7,8,9,10]. The absence of values (blank spaces) indicates on the absence of genera in the particular stage (as indicated in the considered source).
| Genera | Chattian | Aquitanian |
|---|---|---|
| Abyssothyris | 0.17 | |
| Acanthobasiliola | 0.17 | |
| Acrobrochus | 1 | 1 |
| Aetheia | 1 | 1 |
| Agulhasia | 0.5 | |
| Aliquantula | 0.5 | |
| Anakinetica | 1 | 1 |
| Aphelesia | 1 | 1 |
| Argyrotheca | 1 | 1 |
| Aulites | 1 | 1 |
| Austrothyris | 1 | 1 |
| Basiliola | 1 | 1 |
| Bouchardia | 1 | 1 |
| Bouchardiella | 0.11 | |
| Campages | 0.17 | |
| Cancellothyris | 0.17 | |
| Chlidonophora | 0.1 | 0.1 |
| Coptothyris | 0.17 | |
| Craniscus | 1 | 1 |
| Cryptopora | 1 | 1 |
| Cudmorella | 0.17 | |
| Dallina | 0.17 | |
| Dallinella | 0.17 | |
| Dallithyris | 0.1 | 0.1 |
| Diedrothyris | 1 | 1 |
| Diestothyris | 0.17 | |
| Discinisca | 1 | 1 |
| Discradisca | 1 | 1 |
| Elderra | 0.17 | |
| Eohemithiris | 1 | 1 |
| Epacrothyris | 1 | 1 |
| Erihadrosia | 0.5 | |
| Eucalathis | 1 | 1 |
| Frieleia | 0.1 | 0.17 |
| Glottidia | 1 | 1 |
| Gmelinmagas | 1 | 1 |
| Gryphus | 1 | 1 |
| Hemithiris | 1 | 1 |
| Hispanirhynchia | 1 | 1 |
| Iheringithyris | 0.17 | |
| Jolonica | 0.17 | |
| Kakanuiella | 1 | 1 |
| Lacazella | 1 | 1 |
| Landonella | 0.5 | |
| Laqueus | 0.17 | |
| Lingula | 1 | 1 |
| Lingularia | 0.1 | 0.1 |
| Liothyrella | 1 | 1 |
| Macandrevia | 1 | 0.17 |
| Magadina | 1 | 1 |
| Magadinella | 1 | 1 |
| Magella | 0.5 | |
| Magellania | 0.1 | |
| Malleia | 1 | 1 |
| Maltaia | 0.17 | |
| Megathiris | 1 | 1 |
| Megerlia | 0.17 | |
| Megerlina | 0.13 | |
| Miogryphus | 0.17 | |
| Murravia | 1 | 1 |
| Neobouchardia | 1 | 1 |
| Neothyris | 0.17 | |
| Nipponithyris | 0.17 | |
| Notosaria | 1 | 1 |
| Novocrania | 1 | 1 |
| Pachymagas | 1 | 1 |
| Paraldingia | 1 | 1 |
| Pegmathyris | 0.17 | |
| Pelagodiscus | 0.1 | |
| Phragmothyris | 0.5 | |
| Pilkena | 0.5 | |
| Platidia | 1 | 1 |
| Pliothyrina | 1 | 1 |
| Praemagadina | 0.5 | |
| Rhizothyris | 1 | 1 |
| Rhynchonellopsis | 0.5 | |
| Sendaithyris | 0.17 | |
| Seymourella | 0.5 | |
| Stethothyris | 0.5 | |
| Streptaria | 1 | 1 |
| Tanakura | 0.17 | |
| Tegulorhynchia | 1 | 1 |
| Terebratalia | 1 | 1 |
| Terebratella | 1 | 1 |
| Terebratula | 0.17 | |
| Terebratulina | 1 | 1 |
| Thecidellina | 1 | 1 |
| Tichosina | 1 | 1 |
| Victorithyris | 1 | 1 |
| Waiparia | 1 | 1 |
| Yabeithyris | 0.17 |
Table A2.
Probabilistic expression of the stratigraphical distribution of brachiopod genera in the Chattian–Aquitanian interval based on the information from the Paleobiology Database [12]. The absence of values (blank spaces) indicates the absence of genera in the particular stage (as indicated in the considered source).
| Genera | Chattian | Aquitanian |
|---|---|---|
| Acrobrochus | 1 | 1 |
| Aetheia | 1 | |
| Aldingia | 1 | 1 |
| Aliquantula | 1 | 1 |
| Anakinetica | 1 | |
| Aphelesia | 1 | 1 |
| Argyrotheca | 1 | 1 |
| Aulites | 1 | |
| Austrothyris | 1 | 1 |
| Basiliola | 1 | 1 |
| Bouchardia | 1 | 1 |
| Bronnothyris | 1 | 1 |
| Campages | 1 | 1 |
| Cancellothyris | 1 | 1 |
| Coptothyris | 1 | 1 |
| Craniscus | 1 | 1 |
| Cryptopora | 1 | 1 |
| Cudmorella | 1 | 1 |
| Dallina | 1 | 1 |
| Dallithyris | 1 | 1 |
| Diestothyris | 0.17 | |
| Discinisca | 1 | 1 |
| Discradisca | 1 | 1 |
| Eohemithiris | 1 | |
| Epacrothyris | 1 | 1 |
| Eucalathis | 1 | 1 |
| Germanoplatidia | 1 | |
| Glottidia | 1 | 1 |
| Gmelinmagas | 1 | 1 |
| Gryphus | 1 | 1 |
| Hemithiris | 1 | 1 |
| Iheringithyris | 0.5 | |
| Joania | 1 | 1 |
| Lacazella | 1 | 1 |
| Landonella | 1 | |
| Laqueus | 1 | 1 |
| Lingula | 1 | 1 |
| Liothyrella | 1 | 1 |
| Liothyrina | 1 | 1 |
| Macandrevia | 1 | 1 |
| Magadina | 1 | 1 |
| Magadinella | 1 | 1 |
| Magasella | 1 | 1 |
| Magella | 0.11 | |
| Magellania | 1 | 1 |
| Megathiris | 1 | 1 |
| Megerlia | 1 | 1 |
| Megerlina | 0.5 | |
| Murravia | 1 | 1 |
| Neobouchardia | 1 | |
| Neothyris | 1 | 1 |
| Notosaria | 1 | 1 |
| Notozyga | 0.5 | |
| Novocrania | 1 | 1 |
| Pachymagas | 0.5 | 1 |
| Paraldingia | 0.5 | |
| Patagorhynchia | 0.5 | |
| Phragmothyris | 0.5 | |
| Pilkena | 1 | |
| Platidia | 1 | 1 |
| Plicirhynchia | 1 | 1 |
| Pliothyrina | 1 | 1 |
| Praemagadina | 1 | |
| Rhizothyris | 1 | 1 |
| Stethothyris | 1 | 1 |
| Streptaria | 1 | 1 |
| Tegulorhynchia | 1 | 1 |
| Terebratalia | 1 | 1 |
| Terebratella | 1 | 1 |
| Terebratula | 1 | 1 |
| Terebratulina | 1 | 1 |
| Thecidellina | 1 | 1 |
| Tichosina | 1 | 1 |
| Victorithyris | 1 | 1 |
| Waiparia | 1 | 1 |
References
- Pérez-Claros, J.A. Generic diversity and septal complexity in Cretaceous ammonoids. Effects of oceanic anoxic events on the ammonoid evolutionary dynamic. J. Iber. Geol. 2024, 50, 395–410. [Google Scholar] [CrossRef]
- Stock, C.W.; May, A.; Ebert, J.R.; Scotese, C.R.; Hagadorn, J.W. Early Devonian (Pragian) decrease in global generic diversity of stromatoporoids, and their extreme decrease in paleogeographic distribution in North America. Palaeogeogr. Palaeoclimatol. Palaeoecol. 2025, 663, 112719. [Google Scholar] [CrossRef]
- Alroy, J. On four measures of taxonomic richness. Paleobiology 2020, 46, 158–175. [Google Scholar] [CrossRef]
- International Commission on Stratigraphy. Available online: https://stratigraphy.org (accessed on 21 July 2025).
- Ruban, D.A. Brachiopod Diversity and Paleoenvironmental Changes in the Paleogene: Comparing the Available Long-Term Patterns. Diversity 2025, 17, 505. [Google Scholar] [CrossRef]
- Williams, A.; Brunton, C.H.C.; Carlson, S.J. (Eds.) Treatise on Invertebrate Paleontology. Part H. Brachiopoda. Revised. Vol. 2; Geological Society of America, University of Kansas: Boulder, CO, USA; Lawrence, KS, USA, 2000. [Google Scholar]
- Williams, A.; Brunton, C.H.C.; Carlson, S.J. (Eds.) Treatise on Invertebrate Paleontology. Part H. Brachiopoda. Revised. Vol. 3; Geological Society of America, University of Kansas: Boulder, CO, USA; Lawrence, KS, USA, 2000. [Google Scholar]
- Williams, A.; Brunton, C.H.C.; Carlson, S.J. (Eds.) Treatise on Invertebrate Paleontology. Part H. Brachiopoda. Revised. Vol. 4; Geological Society of America, University of Kansas: Boulder, CO, USA; Lawrence, KS, USA, 2002. [Google Scholar]
- Williams, A.; Brunton, C.H.C.; Carlson, S.J. (Eds.) Treatise on Invertebrate Paleontology. Part H. Brachiopoda. Revised. Vol. 5; Geological Society of America, University of Kansas: Boulder, CO, USA; Lawrence, KS, USA, 2006. [Google Scholar]
- Williams, A.; Brunton, C.H.C.; Carlson, S.J. (Eds.) Treatise on Invertebrate Paleontology. Part H. Brachiopoda. Revised. Vol. 6; Geological Society of America, University of Kansas: Boulder, CO, USA; Lawrence, KS, USA, 2007. [Google Scholar]
- Curry, G.B.; Brunton, C.H.C. Stratigraphic distribution of brachiopods. In Treatise on Invertebrate Paleontology. Part H. Brachiopoda. Revised. Vol. 6; Williams, A., Brunton, C.H.C., Carlson, S.J., Eds.; Geological Society of America, University of Kansas: Boulder, CO, USA; Lawrence, KS, USA, 2007; pp. 2901–3081. [Google Scholar]
- The Paleobiology Database. Available online: https://paleobiodb.org/ (accessed on 19 July 2025).
- Benton, M.J.; Dunhill, A.M.; Lloyd, G.T.; Marx, F.G. Assessign the quality of the fossil record: Insights from vertebrates. Geol. Soc. Lond. Spec. Publ. 2011, 358, 63–94. [Google Scholar] [CrossRef]
- Bitner, M.A.; Lozouet, P.; Cahuzac, B. Upper Oligocene (Chattian) brachiopod fauna from the Aquitaine Basin, southwestern France and its paleoenvironmental implications. Geodiversitas 2013, 35, 579–606. [Google Scholar] [CrossRef]
- Dulai, A.; von der Hocht, F. Upper Oligocene brachiopods from NW Germany, with description of a new Platidiinae genus, Germanoplatidia n. gen. Riv. Ital. Paleontol. Stratigr. 2020, 126, 223–248. [Google Scholar]
- Robinson, J.; Donald, K.; Brandt, A.; Lee, D. Magasella sanguinea (Leach, 1814) and Magasella haurakiensis (Allan, 1931): Resolving the taxonomic placement of these endemic New Zealand brachiopods using morphological and molecular traits. J. R. Soc. N. Z. 2016, 46, 139–163. [Google Scholar] [CrossRef]
- Alvarez, F.; Brunton, C.H.C.; Carlson, S.J. Orientations of the valves when presenting serial sections of post-Palaeozoic brachiopods: Tradition and utility versus the revised Treatise: A reply to Motchurova-Dekova, Radulović and Bitner. Lethaia 2008, 41, 497–498. [Google Scholar] [CrossRef]
- Alroy, J. Geographical, environmental and intrinsic biotic controls on Phanerozoic marine diversification. Palaeontology 2010, 53, 1211–1235. [Google Scholar] [CrossRef]
- Danelian, T.; Monnet, C. Early Paleozoic radiolarian plankton diversity and the Great Ordovician Biodiversification Event. Earth-Sci. Rev. 2021, 218, 103672. [Google Scholar] [CrossRef]
- Ubukata, T. Biases in paleontological data and their calibration for paleobiodiversity studies. Fossils 2016, 100, 29–43. [Google Scholar]
- Deng, T.; Hou, S.; Wu, F. Faunal evolution under the background of the Cenozoic greenhouse and icehouse climate. Chin. Sci. Bull. 2023, 68, 1557–1566. [Google Scholar] [CrossRef]
- Figueirido, B.; Janis, C.M.; Pérez-Claros, J.A.; De Renzi, M.; Palmqvist, P. Cenozoic climate change influences mammalian evolutionary dynamics. Proc. Natl. Acad. Sci. USA 2012, 109, 722–727. [Google Scholar] [CrossRef]
- Kuznetsov, A.P. The role of Antarctica in the formation of the Cenozoic climate and contemporary open sea abyssal fauna. Biol. Bull. 2001, 28, 536–538. [Google Scholar] [CrossRef]
- Lazarus, D.; Barron, J.; Renaudie, J.; Diver, P.; Türke, A. Cenozoic planktonic marine diatom diversity and correlation to climate change. PLoS ONE 2014, 9, e84857. [Google Scholar] [CrossRef]
- Marx, F.G.; Uhen, M.D. Climate, Critters, and Cetaceans: Cenozoic drivers of the evolution of modern whales. Science 2010, 327, 993–996. [Google Scholar] [CrossRef]
- Rousseau, D.-D.; Bagniewski, W.; Lucarini, V. A punctuated equilibrium analysis of the climate evolution of cenozoic exhibits a hierarchy of abrupt transitions. Sci. Rep. 2023, 13, 11290. [Google Scholar] [CrossRef]
- Samuels, J.X.; Hopkins, S.S.B. The impacts of Cenozoic climate and habitat changes on small mammal diversity of North America. Glob. Planet. Change 2017, 149, 36–52. [Google Scholar] [CrossRef]
- Arenas, C.; Cabrera, L.; Osácar, M.C.; Pérez-Rivarés, F.J.; Valero, L.; Bastida, J. On land record of the Oligocene–Miocene transition. Climatic insights from a multiproxy study on a lacustrine system in the Ebro Basin (NE Iberia, SW Europe). Palaeogeogr. Palaeoclimatol. Palaeoecol. 2025, 668, 112880. [Google Scholar] [CrossRef]
- Greenop, R.; Sosdian, S.M.; Henehan, M.J.; Wilson, P.A.; Lear, C.H.; Foster, G.L. Orbital Forcing, Ice Volume, and CO2 Across the Oligocene-Miocene Transition. Paleoceanogr. Paleoclimatol. 2019, 34, 316–328. [Google Scholar] [CrossRef]
- Lear, C.H.; Wilson, P.A.; Liebrand, D. The Oligocene-Miocene transient glaciation: Insights from IODP Expedition 342. Rend. Online Soc. Geol. Ital. 2014, 31, 137–138. [Google Scholar] [CrossRef]
- Liebrand, D.; Wade, B.S.; Beddow, H.M.; King, D.J.; Harrison, A.D.; Johnstone, H.J.H.; Drury, A.J.; Pälike, H.; Sluijs, A.; Lourens, L.J. Oceanography of the Eastern Equatorial Pacific Ocean Across the Oligocene-Miocene Transition. Paleoceanogr. Paleoclimatol. 2024, 39, e2024PA004892. [Google Scholar] [CrossRef]
- Passchier, S.; Krissek, L.A. Oligocene–Miocene Antarctic continental weathering record and paleoclimatic implications, Cape Roberts drilling Project, Ross Sea, Antarctica. Palaeogeogr. Palaeoclimatol. Palaeoecol. 2008, 260, 30–40. [Google Scholar] [CrossRef]
- Zachos, J.; Pagani, H.; Sloan, L.; Thomas, E.; Billups, K. Trends, rhythms, and aberrations in global climate 65 Ma to present. Science 2001, 292, 686–693. [Google Scholar] [CrossRef]
- Zou, Z.; Huang, C.; Li, M.; Zhang, Y. Climate change response to astronomical forcing during the Oligocene-Miocene transition in the equatorial Atlantic (ODP Site 926). Sci. China Earth Sci. 2016, 59, 1665–1673. [Google Scholar] [CrossRef]
- Judd, E.J.; Tierney, J.E.; Lunt, D.J.; Montanez, I.P.; Huber, B.T.; Wing, S.L.; Valdes, P.J. A 485-million-year history of Earth’s surface temperature. Science 2024, 385, 1316. [Google Scholar] [CrossRef]
- Scotese, C.R.; Song, H.; Mills, B.J.W.; van der Meer, D.G. Phanerozoic paleotemperatures: The earth’s changing climate during the last 540 million years. Earth-Sci. Rev. 2021, 215, 103503. [Google Scholar] [CrossRef]
- Westerhold, T.; Marwan, N.; Drury, A.J.; Liebrand, D.; Agnini, C.; Anagnostou, E.; Barnet, J.S.K.; Bohaty, S.M.; De Vleeschouwer, D.; Florindo, F.; et al. An astronomically dated record of Earth’s climate and its predictability over the last 66 million years. Science 2020, 369, 1383–1388. [Google Scholar] [CrossRef]
- Hönisch, B.; Royer, D.L.; Breecker, D.O.; Polissar, P.J.; Bowen, G.J.; Henehan, M.J.; Cui, Y.; Steinthorsdottir, M.; McElwain, J.C.; Kohn, M.J.; et al. Toward a Cenozoic history of atmospheric CO2. Science 2023, 382, eadi5177. [Google Scholar]
- van der Meer, D.G.; Stap, L.B.; Scotese, C.R.; Mills, B.J.W.; Sluijs, A.; van Hinsbergen, D.J.J. Phanerozoic orbital-scale glacio-eustatic variability. Earth Planet. Sci. Lett. 2025, 667, 119526. [Google Scholar] [CrossRef]
- Verard, C. On greenhouse and icehouse climate regimes over the Phanerozoic. Terra Nova 2024, 36, 292–297. [Google Scholar] [CrossRef]
- Haq, B.U.; Ogg, J.G. Retraversing the Highs and Lows of Cenozoic Sea Levels. GSA Today 2024, 34, 4–11. [Google Scholar] [CrossRef]
- Miller, K.G.; Schmelz, W.J.; Browning, J.V.; Rosenthal, Y.; Hess, V.A.; Kopp, R.E.; Wright, J.D. Global Mean and Relative Sea-Level Changes Over the Past 66 Myr: Implications for Early Eocene Ice Sheets. Earth Sci. Syst. Soc. 2024, 3, 10091. [Google Scholar] [CrossRef]
- Kim, B.; Zhang, Y.G. Methane hydrate dissociation across the Oligocene–Miocene boundary. Nat. Geosci. 2022, 15, 203–209. [Google Scholar] [CrossRef]
- Edinger, E.N.; Risk, M.J. Oligocene-Miocene extinction and geographic restriction of Caribbean corals: Roles of turbidity, temperature, and nutrients. Palaios 1994, 6, 576–598. [Google Scholar] [CrossRef]
- Harzhauser, M.; Neubauer, T.A. A review of the land snail faunas of the European Cenozoic—Composition, diversity and turnovers. Earth Sci. Rev. 2021, 217, 103610. [Google Scholar] [CrossRef]
- Kamikuri, S.-I.; Nishi, H.; Moore, T.C.; Nigrini, C.A.; Motoyama, I. Radiolarian faunal turnover across the Oligocene/Miocene boundary in the equatorial Pacific Ocean. Mar. Micropaleontol. 2005, 57, 74–96. [Google Scholar] [CrossRef]
- Alvarez, F.; Emig, C.C.; Treguier, J. Brachiopodes actuels. Historique et révision de la collection D.-P. OEhlert (Laval). Brachiopodes des côtes françaises métropolitaines. Carnets De Géologie Madr. 2017, CG2017_B02, 1–386. [Google Scholar]
- Verhoeff, T. World Brachiopoda Database. Liothyrina Oehlert, 1887. World Register of Marine Species. Available online: https://www.marinespecies.org/aphia.php?p=taxdetails&id=869090 (accessed on 27 November 2025).
- Flannery-Sutherland, J.T.; Raja, N.B.; Kocsis, Á.T.; Kiessling, W. fossilbrush: An R package for automated detection and resolution of anomalies in palaeontological occurrence data. Methods Ecol. Evol. 2022, 13, 2404–2418. [Google Scholar] [CrossRef]
Disclaimer/Publisher’s Note: The statements, opinions and data contained in all publications are solely those of the individual author(s) and contributor(s) and not of MDPI and/or the editor(s). MDPI and/or the editor(s) disclaim responsibility for any injury to people or property resulting from any ideas, methods, instructions or products referred to in the content. |
© 2026 by the author. Licensee MDPI, Basel, Switzerland. This article is an open access article distributed under the terms and conditions of the Creative Commons Attribution (CC BY) license.