Abstract
We investigated the CO2 emissions in a mofette gas pool located in Covasna, Romania. Using a custom-built remote multi-sensor device, we monitored the gas concentrations, temperature, and pressure for seven months. The measurements showed both diurnal cycles and short-term bursts of CO2 emissions along with instances of erratic yield anomalies. We employed the convection–diffusion equation to estimate gas flow rates without altering the natural state of the mofette. Additionally, we developed a model that uses the measured pressure and temperature to predict the CO2 outflow yield. The model’s overall predictions approximate well the observed CO2 flux. However, the subtle mismatches between these two suggest that subsurface geological processes, which require further investigation, may also influence the gas flow. This research provides insights into the dynamics of focused CO2 emissions, with potential applications in environmental monitoring and therapeutic practices.
1. Introduction
Understanding the dynamics of carbon dioxide () emissions from natural sources is crucial in the broader context of climate science and environmental studies. is a primary greenhouse gas, contributing significantly to global warming [1]. While anthropogenic sources of have been at the forefront of climate change discussions, natural emissions, either diffuse or focused, such as those from mofettes—natural springs—also play a role in the carbon cycle.
Mofettes are unique geological features that emit gases rich in from the Earth’s interior. They are commonly found in volcanic and seismotectonically active areas, providing a natural laboratory for studying concentrated emissions. The study of mofettes is not only relevant to understanding the geological processes that drive their activity but it also bears importance in the medical field. There is a growing interest in the therapeutic use of mofettes, where the -rich environment is used for its vasodilatory and anti-inflammatory properties, aiding in the treatment of circulatory diseases [2,3]. On the other side, risk assessment in gas-rich environments is another focus in mofette studies [4]. In addition, along with diffuse regional emissions, locally focused natural degassing in mofettes contributes to the global carbon cycle, hence their environmental importance cannot be neglected or underestimated when discussing climate models.
In the context of geochemical research, much focus has been placed on the diffuse emissions of from the soil to the Earth’s atmosphere, which are distributed over wide areas [5,6,7,8,9]. However, focused emissions like those from mofettes present an opportunity to study release mechanisms under a different lens. These emissions are intense and localized, providing a contrast to the broad-scale diffuse emissions [10]. Despite their potential for offering insights into underground gas dynamics and their influence on local environments, focused emissions from natural sources like mofettes have received less attention in the scientific literature compared to their diffuse counterparts. Woith et al. [11] emphasize that “Despite the obvious potential, systematic studies of mofettes to monitor magmatic processes at depth are rare”.
Most studies address geogenic flux estimates and their contribution to the atmospheric levels in active volcanic areas where both diffuse and focused gas emanations are intense and readily measurable [12,13]. However, “non-volcanic fluxes in «colder» environments are much greater than generally assumed” as Mörner and Etiope [14] observed. Their links to seismotectonic structures are discussed by Barnes et al. [12]. On the other part, geothermal systems, related or unrelated to volcanism, are geogenic sources of emission in both diffuse and focused manners. In the Sousaki geothermal field in Greece, for example, “point sources in the same area” account for less than 1/10 of the total output [15].
In Romania, pioneering investigations of mofette gas dynamics were undertaken by Airinei and Pricăjan in the 1970s [16], when they monitored and obtained time series of levels, a proxy for gas yield, measured systematically in mofettes of the Călimani–Gurghiu–Harghita volcanic range, other than those in Covasna. These authors found systematic meteo-independent variations of the gas emanations at three different timescale: 4 years, 8 months, 12–15 days, and 2–5 days, corresponding to “continental type”, “regional”, “intermediate”, and “local” anomalies, respectively, and showing complex rhythmicity patterns. Although concluding that the recorded gas flux modulations have subsurface causes linked to deep-seated geological structures, the authors refrained themselves from naming such causes, excepting the generally accepted paradigm of “post-volcanic activity” and its presumed links to volcanism.
After a decades-long time-gap, recent investigations focused on both the origin of the [17,18,19] and on the quantitative evaluation of its diffuse surface emanations at a local scale [20]. For instance, ref. [18] although reinforcing the mantle-derived origin of the fluids, still links them to volcanic degassing processes within the “post-volcanic” paradigm. According to [21], the -rich mantle fluids can have a complex origin from various deep-seated sources (asthenosphere, sinking slab and lithospheric mantle). Mofette studies also included radon concentration investigations in gas pools in the Harghita Mts. and neighboring areas where is the carrier of the radioactive gas [22].
In the current research, we aim to contribute to a better understanding of the gas dynamics of mofettes at much shorter time scales than previously considered. Our focus is on the dynamic aspects of gas behavior within the mofette pool, rather than on the origins and geodynamic connections of this volatile species.To achieve this, we developed a low-cost remote sensing device that monitors the concentrations, temperature, and pressure inside a selected mofette with high temporal resolution (1 s). Using the measured concentration data, we can indirectly estimate the flow yield emanating from the mofette by utilizing the convection–diffusion equation, without altering the original state of the mofette. To validate our device’s reliability, we conducted an extensive measurement campaign lasting over seven months of nearly continuous observation, demonstrating that our device is capable of operating under the conditions present within the studied mofette. Prior to this study, we conducted pilot measurements during winter months (October 2021–February 2022) to test our device performance. During these, we observed moisture condensation on sensors due to low external temperatures, leading to sensor corrosion and anomalous readings. These technical issues necessitated focusing our main measurement campaign on warmer months.
2. Location and Regional to Local Geological Background
We investigated gas dynamics in a mofette located in the touristic and health resort town of Covasna, at the interior of the East Carpathian bend area. The site is specifically situated at coordinates 45°51′10.7″ N, 26°11′19.5″ E (Figure 1). Spatially and geologically, it is connected to a major trans-crustal fracture zone at the boundary between the Quaternary Târgu Secuiesc Basin to the west and the orogenic structure of the East Carpathian thrust-and-fold belt to the east. Such deep fracture zones control both the regional tectonic evolution of the area, namely the sinking of the basin and the uplift of the orogenic belt, and the upward migration of the deep-origin fluids, such as , serving as pathways for them. The geological structure of the Covasna area is composed of folded and fractured flysch deposits (mostly sandstone and claystone) of Cretaceous and Paleogene age, overthrusted onto each other within a westward-verging nappe system as a result of the Alpine orogenesis of the Carpathians (Figure 1) [23].
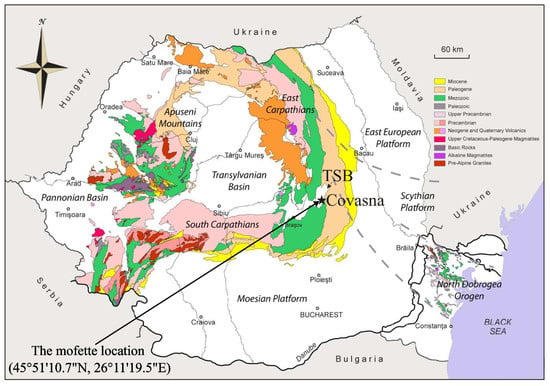
Figure 1.
Location of the Târgu Secuiesc Basin (TSB) and Covasna town on the background on the simplified Geological map of Romania (Geological Institute of Romania). The mofette we studied is specifically located at coordinates 45°51′10.7″ N, 26°11′19.5″ E within the Covasna area.
Since the most numerous and intense gas emanations occur within, and in the vicinity of, the Neogene to Pleistocene volcanic areas, a genetic link between gas emanations and volcanic activity was, and still is, traditionally assumed in the relevant literature. The emanations were considered as the most relevant manifestation of the so-called “post-volcanic activity”, implying that magma chambers located in the subsurface of volcanoes still release gases after volcanic activity ceased ignoring the fact that the most mobile volatiles are expelled first before magma arrives at the surface. The occurrence area of emergences is collectively called as the “mofettic aureole” of the volcanic range, irrespective of the lack of actual timing and space relationship between the two. As so, the wet and dry emanations in Covasna and the surrounding areas are still considered as part of that “mofettic aureole”. An alternative explanation to the “post-volcanic” origin of has been recently proposed by Kovács et al., considering a much deeper source of the -rich volatiles than the crustal magma chambers of extinct volcanoes [24].
The deep subcrustal (i.e., mantle) origin of at least part of the -dominated fluids was documented earlier by He-isotopic measurements [17]. Along its upwelling through the crust, the gas encounters aquifers hosted by the sedimentary rocks, recent sediments and soil, generating carbogazeous mineral waters by dissolution, which emerge at the surface as natural springs or intercepted by pits and wells. The Covasna area is rich in mineral water springs. Bubbling through flowing water at valley bottoms is a common view in Covasna and environs. The “Devil’s lake” in the center of the town with its bubbling muddy water, which erupts sporadically, is a tourist attraction.
In the near-surface environment, the dissolved content of these waters of the uppermost aquifer often degasses underground as the confining pressure decreases, releasing the gas phase which emerges at the surface as diffuse (in soil) or focused (in mofettes) dry gas emanations. Moreover, the accumulates in subsurface natural and manmade cavities (e.g., subsoil parts of buildings and cellars), posing a lethal threat to the inhabitants. Otherwise, it is captured, conducted, and used for therapeutic purposes in specially designed mofette pools under permanent surveillance.
The small-sized mofette shown in Figure 2a, which we investigated, is out of use and remains available for exclusive research purposes.
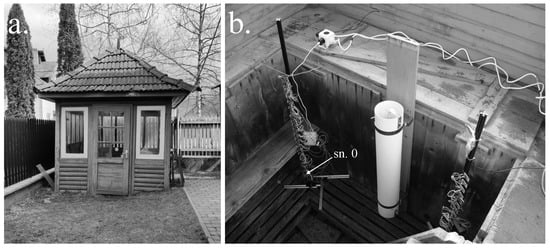
Figure 2.
The studied mofette in Covasna: (a) External view of the building housing the mofette; (b) Interior view of the mofette pool, showing the experimental setup with vertical sensor arrays. Each sensor array begins with the lowest sensor, labeled as sn.0, positioned near the bottom of the mofette, with subsequent sensors placed at regular 5 cm intervals above it.
3. Methodology
The mofette we studied is shown in Figure 2b. The height of the wooden mofette pool is 109 cm, with constant cross-sectional dimensions of 165 cm and 153 cm, respectively, across its entire depth.
Our objective was to measure the gas yield while preserving the existing structure of the mofette. This approach is beneficial because it allows the technique to be applied to other mofettes without requiring any modifications to their original state. To measure the gas yield, we based our approach on the relationship described by Equation (1), which governs the distribution of carbon dioxide concentration within the mofette as a function of height, considering both advection and diffusion processes
In Equation (1), denotes the concentration of , z is the depth measured from the topmost sensor in the stack (), D is the diffusion coefficient, and v is the drift velocity of the gas. To solve this equation analytically, we assumed that the outflow yield is quasi-stationary (the change in the gas flow yield is slower than the time needed to achieve the equilibrium state). Therefore, the time derivative term vanishes, simplifying Equation (1) to a steady-state form as shown below:
At the level, where the topmost sensor is located, the concentration is . At the lowest level , where the bottommost sensor is located, the concentration is . Taking these boundary conditions into account, the solution for Equation (2) is
Equation (3) describes how the concentration varies with height z and drift velocity v. By measuring the concentration at different heights, we can estimate the drift velocity v, which is a key factor in determining the outflow yield.
To estimate the drift velocity v, we used 20 sensors placed at 5 cm intervals along the height of the mofette. We then adjusted the value of v in Equation (3) to minimize the difference between the theoretical concentration values and the experimentally measured values . The minimized difference, represented as , ensures that our theoretical calculations fit the observed concentrations. Once the optimal drift velocity v was determined, it was used to calculate the flow yield as
where S is the cross-section of the mofette. It is worth mentioning that our yield measurement method outlined above is similar to the dynamic concentration method for measuring soil emissions described in the following study [7].
3.1. Experimental Setup
Our gas yield measurement method requires concentration measurements at various heights within the mofette. The mofette environment poses significant challenges, including concentrations ranging from 0% to over 95%, high humidity levels near the dew point, and fluctuating temperatures. To address these conditions, we selected the STC31 sensor [25] for measurements. This sensor was chosen for its proven reliability in similar conditions, having been successfully deployed in wet mofette studies under equally demanding conditions [10].
The STC31 offers high measurement precision, with an accuracy of 1 vol% plus 3% of the measured value, and a repeatability of 0.2 vol% across its full 0–100 vol% range. Its integrated humidity compensation (using DHT11 sensor data for humidity compensation) and temperature stability (temperature coefficient: 0.025 vol%/°C) ensure consistent performance in the conditions typical of mofettes [25].
We used 20 STC31 sensors mounted on an extruded aluminum rod at 5 cm intervals using 3D-printed holders, with the lowest sensor, labeled as sn.0, positioned 43 cm away from the bottom of the mofette. The aluminum rod was placed at the right corner of the mofette, approximately 20 cm away from the adjacent walls, as shown in Figure 2b. Given that the observed flow velocities are on the order of centimeters per second, the proximity to the walls does not significantly impact the gas distribution compared to the center of the chamber, nor does it affect the laminarity of the flow.
To ensure the accurate operation of the STC31 sensors, it was necessary to monitor air pressure and relative humidity. For this, we utilized DHT11 (humidity) and BMP280 (pressure) sensors [26,27].
The sensors were connected to the ESP8266 microcontroller via an bus, which managed the measurements. Firmware updates for the ESP8266, as well as local data recording, were handled by a Raspberry Pi. The mechanical design of the device is shown in Figure 3a, while the schematic diagram of the electronics is presented in Figure 3b.
The entire mofette gas-monitoring methodology and setup were designed, developed, and tested in the laboratories of the Physics Department at Babeș-Bolyai University in Cluj-Napoca.
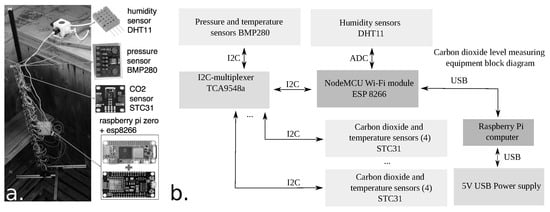
Figure 3.
Integrated measurement system of CO2 concentration. Image (a) shows the physical setup with sensor arrays. Figure (b), presents the block diagram of the electronics.
3.2. Data Collection
We collected data at a sampling rate of 1 Hz, sequentially reading the concentration (STC31), temperature (STC31, BMP280), pressure (BMP280), and humidity (DHT11) measured by the sensors. These data were locally saved on a Raspberry Pi and transmitted to an MQTT server. The code used on the microcontroller and the Raspberry Pi is available at the following link [28]. Before processing the data, we conducted a data-cleaning step. This cleaning involved removing erroneously read sensor values and filling missing data points with linear interpolation for intervals during which the measurement was interrupted due to power outages or other technical issues. The program executing the data cleaning is available at the link [28]. Figure 4 shows the concentration, temperature, and air pressure data measured by some of the sensors.
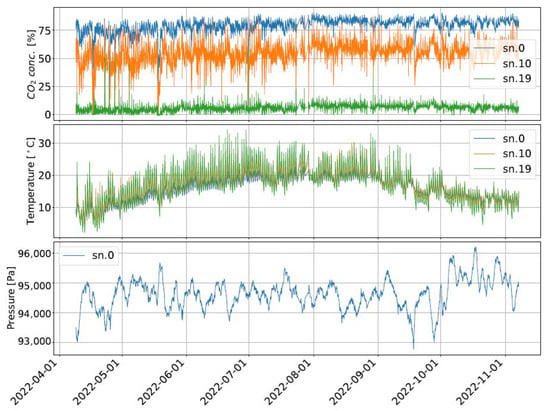
Figure 4.
A seven-month time series from the mofette, illustrating fluctuations in carbon dioxide concentration, temperature, and pressure recorded by different sensors. The lowermost sensor in the stack is labeled as sn.0, with sn.10, and sn.19 positioned 50 cm and 95 cm above it, respectively.
4. Modeling of the Measured Gas Flow
The measured data reveal correlations between temperature changes and variations in flow yield, as well as between pressure changes and yield variations. Figure 5a illustrates the relationship between pressure change and yield variation, including the fitted linear function. Similarly, Figure 5b shows the correlation between temperature change and yield variation.
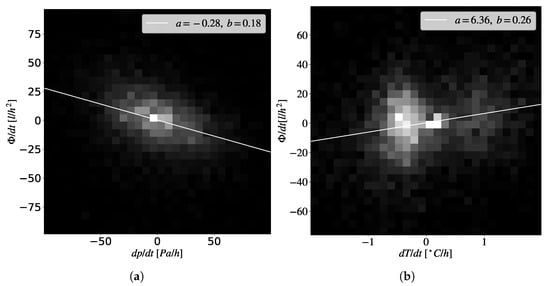
Figure 5.
(a) Yield change as a function of pressure variation. (b) Yield change as a function of temperature variation.
Given the correlations observed, we hypothesized that modeling of the flow yield using pressure and temperature is at least partially feasible. We constructed a model to approximate the underground gas transport processes. In our model, flows through a system of chambers, corresponding to a highly simplified representation of natural cavities arranged in a square grid. Indeed, as a physical model, this approach oversimplifies the complex, heterogeneous fracture networks with anisotropic permeability and variable gas supply characteristic of real geological systems.In this modeleach chamber has an identical volume and is interconnected with neighboring chambers via channels. It is assumed that enters each chamber at a constant rate, this inflow rate being one of our model parameters . Another assumption is that the transport between chambers is proportional to the pressure difference in adjacent chambers and is governed by the temperature-dependent parameter . The form of is shown in Equation (5), with parameters , , and scaling exponent . These parameters control the temperature dependence, with determining the steepness of the response.
In our model, gas outflow occurs through the coupling of one chamber to the external environment. The flow between the environment and the coupled chamber is proportional to the pressure difference between the chamber and the external environment in the same way as the inter-chamber transport. Given the relatively small size of the system used in modeling (10 × 10 chamber grid), we applied periodic boundary conditions. Our chamber system is schematically illustrated in Figure 6, while Equation (6) describes the transport within the chamber system.
The transport between the environment and the chamber system is described by
In Equations (6) and (7), denotes the quantity of in units of mols in chamber i, j, R denotes the universal gas constant, denotes the temperature of the chamber, is the volume of the chamber and is a constant inflow rate to the chambers. We selected the parameter such that the total amount of entering all chambers equals the average outflow observed over the entire examined interval (, here denotes the number of the chambers).
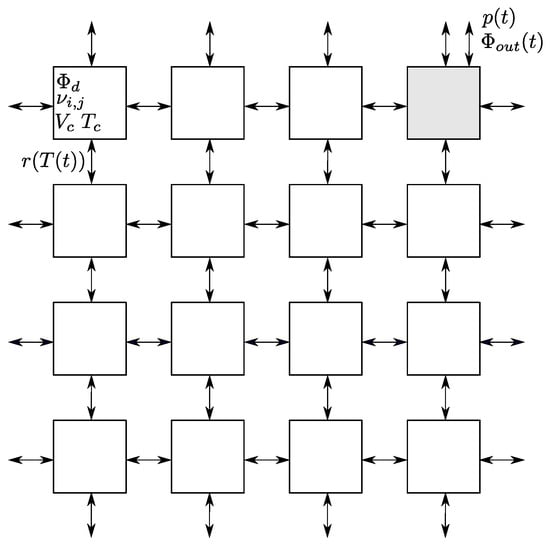
Figure 6.
Schematic representation of the chamber system used for modeling outflow from the mofette. Each square represents a chamber connected to its adjacent chambers. Gas transport between chambers is driven by pressure differences and is regulated by the temperature-dependent resistance, . In the figure, denotes the diffuse gas inflow rate to the chambers, represents the volume of each chamber, indicates the temperature within the chambers, is the external pressure, quantifies the amount of in the chambers (in moles), and is the rate of outflow.
4.1. Numerical Implementation of the Model
The simulation of the model was performed using the 4th-order Runge–Kutta method. At the beginning of the simulation, the initial amount of gas in the chambers is , where is the first element of the measured pressure time series. At the initial state, the amount of gas in the chambers is far from the equilibrium amount. To achieve the equilibrium state, we simulate the system with the initial , (pressure and temperature at ) values until the difference in the outflowing yield between consecutive steps is less than mol/s. After the system reaches an equilibrium state, we numerically integrate the equations for , values, thereby obtaining the values.
4.2. Determining Model Parameters
This subsection describes the methodology used to optimize the parameters that determine the flow dynamics in our model. Our model contains 5 parameters: the scale factor of the resistance between chambers , and the factors modulating the resistance as a function of between chambers, the temperature of the chambers, and the volume of the chambers. Given the practically constant underground temperature, we decided to fix at 283 K. The optimization of the remaining parameters () were performed as follows. We selected a set of initial parameters, , , . For these parameters, we calculated the time series of yield predicted by the model. We calculated the mean squared error (MSE) for the predicted time series (model prediction) and the yield computed from the concentration using the following formula:
where is the predicted value, is the value calculated from the concentrations, and m is the length of the time series. This measure characterizes the goodness of the model parameters. During the optimization, each model parameter was positively and negatively perturbed by . If this perturbation led to a reduction in the mean squared error, the adjustment to the parameter was kept otherwise it was ignored. We continued the optimization until we reached a local minimum in the MSE. Given that processes may occur over long timescales that our current model neglects, we divided our dataset into nine equal segments. We performed parameter optimization for each segment independently.
5. Results and Discussion
5.1. Experimental Data
Temperature measurements within the mofette, illustrated in Figure 7a, demonstrate the expected daily fluctuations as well as the overall seasonal variation with the highest values in the June–August time interval. These fluctuations are notably more pronounced at the upper sensors and decrease progressively towards the lower sensors. Figure 7b displays the power spectral density (PSD) for the temperature time series from Sensor No. 10, positioned midway in the sensor array. The PSD highlights a peak corresponding to the 24 h cycle, emphasizing the diurnal pattern. Throughout the study period, recorded temperatures ranged from a minimum of 2.26 °C to a maximum of 34.01 °C.
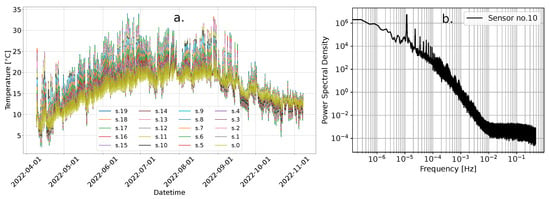
Figure 7.
(a) Daily temperature oscillations recorded by the sensor array (STC31 sensors). (b) The power spectral density (PSD) of the temperature time series from Sensor No. 10, located midway on the array, where the peak around Hz corresponds to the diurnal temperature oscillation.
The measured concentration time series within the mofette are shown in Figure 8a. At the level of the uppermost sensor, the average concentration throughout the measurement period is relatively low, 5.5%. In contrast, at the level of the lowest sensor, the average concentration is 79%. The peak concentration observed during the study was 90.6%. Figure 8b shows the power spectral density (PSD) calculated for the time series measured by Sensor No. 10. The PSD shows two peaks corresponding to 24 h and 12 h oscillations. Moreover, we can observe three distinct frequency regimes where the PSD scales according to a power–law function with frequency. While the underlying mechanisms for this scaling remain unclear, this behavior seems notable. For each of these regimes, we fitted a power function, shown in Figure 8b.
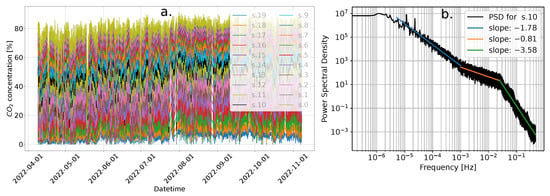
Figure 8.
(a) Time series of concentrations measured by our sensor array in the mofette. (b) Power spectral density (PSD) for the concentration time series measured by Sensor No. 10. In the figure, one can observe two distinct peaks corresponding to 24 h and 12 h cycles. Additionally, three frequency regimes are visible where the PSD scales as a power function of the frequency. For each of these regimes, the power exponents are shown.
Figure 9 shows two randomly chosen zoomed-in views (50 min windows) from the measured concentration time series to better showcase the typical behavior of the concentrations in the mofettes. It can be clearly seen that both zoomed-in views exhibit some degree of fluctuation, but overall, the time series vary around an average value. In addition to the typical behavior, we observed multiple events where a sudden burst of anomalous outflow occurred within a few minutes. In some of these events, the concentration at the uppermost sensor exceeded 60%. Figure 10 shows a zoomed-in view of two such events. Following the initial bursts, multiple subsequent bursts appear, which are especially noticeable in the right panel. The sudden gas up-flow causes mixing between different layers, making the usual concentration gradient less pronounced.
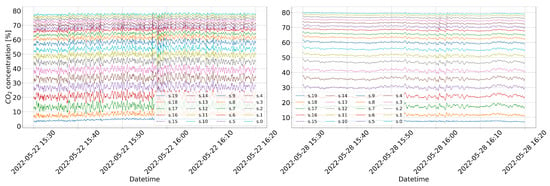
Figure 9.
Two randomly selected zoomed-in views (50 min windows) from the measured concentration time series. These segments illustrate the typical fluctuation of the within the mofette.
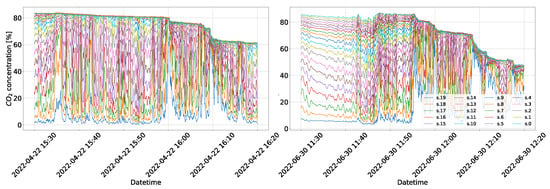
Figure 10.
Time series sections of concentrations exhibiting anomalous behavior. The figure displays sudden bursts in emissions where the concentration measured by the upper sensors spikes sharply. After the initial bursts, multiple subsequent bursts appear; this is especially noticeable in the right figure. One can also see that as a result of the sudden gas upflow, a mixing occurs between different layers. As a result of the mixing, the usually present concentration gradient (as a function of height) is less pronounced.
5.2. Modeling the Emission of the Mofette
As shown in Figure 9, there is practically a constant presence of some level of concentration fluctuation within the mofette, occurring over short seconds-to-minutes time scales. It is also evident that the time series measured by the individual sensors are strongly correlated (the concentrations measured by the sensors increase and decrease in sync). This suggests that the surrounding air movements create a flow causing a swirling process within the mofette. A stochastic modulation is superimposed on the concentration height dependency resulting from the diffusion and advection processes (due to outflow) described in Equation (1). To mitigate the influence of these fluctuations on the flow yield calculation, we performed a two-minute averaging on the time series measured by the sensors. Subsequently, we used Equation (3) presented in the ‘Methodology section’ on the averaged data to obtain the average outflow yield for the given time intervals. The obtained flow yields are shown in Figure 11. The yield shown in Figure 11 was first converted into mole units. We then applied the optimization procedure outlined in the ‘Determining model parameters’ section. For this optimization, the average temperature recorded by all STC31 sensors was used, and the pressure time series were obtained from the uppermost pressure sensor. After determining the optimal model parameters, we used these to predict the yield. Figure 12 compares the yields measured directly and those predicted by the simulation, showing that the model predictions reproduce well the yields calculated from the concentrations.
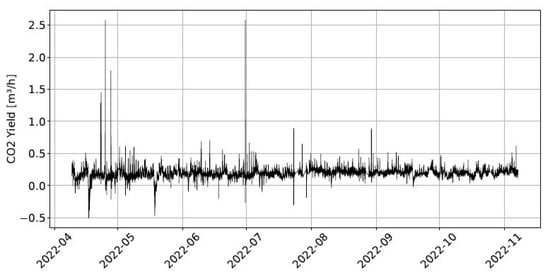
Figure 11.
flow yield calculated from the concentrations using Equation (3).
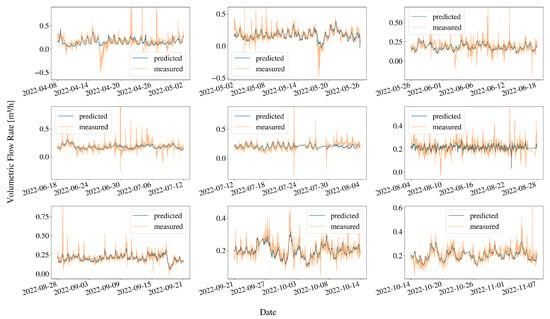
Figure 12.
Comparison of simulated and measured flow yields over time. The figures shows a good agreement between the predicted (blue line) and the measured flow yield values (orange line).
6. Conclusions
This study investigates the dynamics of emissions from a mofette, contributing to a relatively underexplored area in the field of environmental science. By developing a low-cost remote sensing device, we monitored concentrations, temperature, and pressure within the mofette at high temporal resolution. This enabled us to capture data without altering its natural state.
During the 7-month measurement period, ranging from April to November 2022, the predominant behavior observed is a steady oscillatory dynamic in concentration, as illustrated in Figure 9. The concentration fluctuated around an average value, with amplitude varying across different time intervals. Notably, concentration variations at different heights are correlated, rising and falling synchronously, indicating that inflow and outflow from the mofette pool are responsible for these fluctuations. The timescale of the variations ranges from seconds to minutes. Given the short timescale of fluctuations and their varying amplitudes depending on the specific observation interval, atmospheric effects (such as wind gusts) are likely responsible for the observed variations. Consistent with atmospheric influences, the power spectrum of the time series (Figure 8b) shows periodic 12 and 24 h peaks, suggesting that these conditions contribute to the observed variations. In addition to the steady oscillatory dynamics, we observe another type of behavior characterized by abrupt increases in concentration at higher levels (Figure 10). The observed bursts in concentration occur rapidly with a timescale of a few minutes. As illustrated in Figure 10, each burst is followed by a decrease in maximum concentration, likely due to the intense mixing it triggers. These sudden bursts could result from atmospheric effects; however, the violent nature of the increases of the concentration may indicate involvement of geological processes. Similar behavior has been observed at -rich mineral springs in the Covasna area, where random gas bursts occur through water at minutes to tens of minutes intervals, suggesting modulation by underground gas–flux variations.
The flow yield from concentration data exhibits the same two characteristic behaviors: steady oscillatory dynamics and sudden bursts, as illustrated in Figure 11. Additionally, Figure 5 reveals a correlation between yield variations and changes in pressure and temperature. This suggest a relationship between these atmospheric parameters and the outflow yield. To quantify and better understand the impact of these atmospheric factors, we developed a model to predict outflow yield using temperature and pressure. Figure 12 presents a comparison between the model predictions and the yields calculated from the measured concentrations. It is evident that the model-derived curve generally follows the trends of the measured yield in most cases. However, there are regions where the curves differ significantly, especially during large fluctuations or bursts. This discrepancy suggests that the complete dynamics of emissions cannot be attributed solely to atmospheric effects. The observed deviations between modeled and measured yields indicate that additional factors beyond atmospheric pressure and temperature influence gas emission patterns. Heavy precipitation events, which Woith et al. reported as capable of producing sudden gas flux spikes at Hartoušov, Czech Republic [11], did not occur during our monitoring period and therefore cannot account for the discrepancies. The unexplained variations may arise from subsurface processes that operate independently of surface atmospheric pressure and temperature conditions. Historical studies in the broader region, such as those by Airinei [16], documented systematic gas emanation variations across multiple timescales ranging from days to months, suggesting that non-atmospheric factors can influence mofette behavior. However, identifying the specific mechanisms responsible for the pressure- and temperature-independent variations observed in this study will require expanded monitoring approaches and additional measurement techniques beyond those employed at this single location.
Author Contributions
A.S. and Á.G. conceived the idea for this research. The design and construction of the measurement setup, as well as data collection, were performed by A.G. The model was constructed by Z.N. and A.G. Model analyses were conducted by A.G. and Z.N. The manuscript was written by A.G., Z.N., and A.S. All authors contributed to discussing the results and shaping the manuscript. All authors have read and agreed to the published version of the manuscript.
Funding
This research was supported by the Topo Transylvania Project grant NKFIH K141956, the Collegium Talentum Programme of Hungary, and a grant from the Ministry of Research, Innovation and Digitization, CNCS/CCCDI—UEFISCDI, project number PN-IV-P8-8.1-PRE-HE-ORG-2023-0118, within PNCDI IV. Partial funding for the sensor network was provided through a SEED research grant. Logistical support for the measurements was provided by the Comandău Forestry Office in Covasna.
Data Availability Statement
All data collected in this study are available in the following link [28].
Acknowledgments
A.S. and Á.G. performed their contributing work benefiting from the Topo Transylvania Project grant NKFIH K141956. We would like to express our thanks and respect to the Comandău Forestry Office in Covasna for hosting the instrumentation and ensuring the smooth supervision of our measurements. We are especially grateful to the director of the Forestry Office of Covasna, Mihai Ciocîrlan, for granting us access to the studied mofette. The work of A.G. is supported by the Collegium Talentum Programme of Hungary and by a grant from the Ministry of Research, Innovation and Digitization, CNCS/CCCDI—UEFISCDI, project number PN-IV-P8-8.1-PRE-HE-ORG-2023-0118, within PNCDI IV. The work of Z.N. and A.G. was supported by the project “A better understanding of socio-economic systems using quantitative methods from Physics” funded by the European Union—NextgenerationEU and the Romanian Government, under National Recovery and Resilience Plan for Romania, contract no 760034/23.05.2023, cod PNRR-C9-I8-CF255/29.11.2022, through the Romanian Ministry of Research, Innovation and Digitalization, within Component 9, Investment I8. Additionally, we extend our thanks to Zsuzsanna Sárközi for her help in financing part of the cost of the sensor network from her SEED research grant.
Conflicts of Interest
The authors declare no conflicts of interest.
References
- The Royal Society. The Carbon Cycle: Better Understanding Carbon-Climate Feedbacks and Reducing Future Risks. 2018. Available online: https://royalsociety.org/-/media/policy/projects/climate-change-science-solutions/climate-science-solutions-carbon-cycle.pdf (accessed on 27 June 2024).
- Dogaru, G.; Motricală, M.; Bulboacă, A.; Ciumărnean, L.; Stănescu, I. The Effect of Carbonated Mineral Water and Mofette Treatment in Baile Tusnad After Ischemic Stroke—A Case Report. Balneo Res. J. 2018, 9, 11–14. [Google Scholar] [CrossRef]
- Suceveanu, M.; Suceveanu, P.; Pop, D.; Sitar Taut, A.; Zdrenghea, D.; Hăncu, N. Role of Mofette Therapy in Cardiovascular Rehabilitation—The Covasna Model. Balneo Res. J. 2015, 6, 69–74. [Google Scholar] [CrossRef]
- Roberts, J.J.; Wood, R.A.; Haszeldine, R.S. Assessing the health risks of natural CO2 seeps in Italy. Proc. Natl. Acad. Sci. USA 2011, 108, 16545–16548. [Google Scholar] [CrossRef]
- Chiodini, G.; Cioni, R.; Guidi, M.; Raco, B.; Marini, L. Soil CO2 flux measurements in volcanic and geothermal areas. Appl. Geochem. 1998, 13, 543–552. [Google Scholar] [CrossRef]
- Carapezza, M.L.; Granieri, D. CO2 soil flux at Vulcano (Italy): Comparison between active and passive methods. Appl. Geochem. 2004, 19, 73–88. [Google Scholar] [CrossRef]
- Camarda, M.; Gurrieri, S.; Valenza, M. CO2 flux measurements in volcanic areas using the dynamic concentration method: Influence of soil permeability. J. Geophys. Res. Solid Earth 2006, 111. [Google Scholar] [CrossRef]
- Diliberto, I.; Gurrieri, S.; Valenza, M. Relationships between diffuse CO2 emissions and volcanic activity on the island of Vulcano (Aeolian Islands, Italy) during the period 1984–1994. Bull. Volcanol. 2002, 64, 219–228. [Google Scholar] [CrossRef]
- Kies, A.; Hengesch, O.; Tosheva, Z.; Raschi, A.; Pfanz, H. Diurnal CO2-cycles and temperature regimes in a natural CO2 gas lake. Int. J. Greenh. Gas Control 2015, 37, 142–145. [Google Scholar] [CrossRef]
- Büchau, Y.G.; Leven, C.; Bange, J. A portable low-cost device to quantify advective gas fluxes from mofettes into the lower atmosphere: First application to Starzach mofettes (Germany). Environ. Monit. Assess. 2024, 196, 138. [Google Scholar] [CrossRef] [PubMed]
- Woith, H.; Vlček, J.; Vylita, T.; Dahm, T.; Fischer, T.; Daskalopoulou, K.; Zimmer, M.; Niedermann, S.; Stammeier, J.A.; Turjaková, V.; et al. Effect of Pressure Perturbations on CO2 Degassing in a Mofette System: The Case of Hartoušov, Czech Republic. Geosciences 2022, 13, 2. [Google Scholar] [CrossRef]
- Barnes, I.; Irwin, W.; White, D. Global distribution of carbon-dioxide discharges, and major zones of seismicity, scale 1:40,000,000. In Water Resources Investigation WRI 78-39; U.S. Geological Survey: Reston, VA, USA, 1978. [Google Scholar] [CrossRef]
- Orcutt, B.N.; Daniel, I.; Dasgupta, R. (Eds.) Deep Carbon: Past to Present; Cambridge University Press: Cambridge, UK, 2019; p. 678. [Google Scholar] [CrossRef]
- Mörner, N.A.; Etiope, G. Carbon degassing from the lithosphere. Glob. Planet. Change 2002, 33, 185–203. [Google Scholar] [CrossRef]
- D’Alessandro, W.; Brusca, L.; Kyriakopoulos, K.; Rotolo, S.; Michas, G.; Minio, M.; Papadakis, G. Diffuse and focused carbon dioxide and methane emissions from the Sousaki geothermal system, Greece. Geophys. Res. Lett. 2006, 33. [Google Scholar] [CrossRef]
- Airinei, S.; Pricajan, A. Some Geological Connections Between the Mineral Carbonic and Thermal Waters and the Post-Volcanic Manifestations Correlated with the Deep Geological Structure of the East Carpathians Territory, Romania, 1975. In Proceedings of the Lucrările Simpozionului Internațional de Ape Minerale și Termale, Eforie, Bucharest, Romania, 7–14 June 1974. [Google Scholar]
- Vaselli, O.; Minissale, A.; Tassi, F.; Magro, G.; Seghedi, I.; Ioane, D.; Szakacs, A. A geochemical traverse across the Eastern Carpathians (Romania): Constraints on the origin and evolution of the mineral water and gas discharges. Chem. Geol. 2002, 182, 637–654. [Google Scholar] [CrossRef]
- Kis, B.M.; Caracausi, A.; Palcsu, L.; Baciu, C.; Ionescu, A.; Futó, I.; Sciarra, A.; Harangi, S. Noble Gas and Carbon Isotope Systematics at the Seemingly Inactive Ciomadul Volcano (Eastern-Central Europe, Romania): Evidence for Volcanic Degassing. Geochem. Geophys. Geosyst. 2019, 20, 3019–3043. [Google Scholar] [CrossRef]
- Kis, B.M.; Baciu, C.; Zsigmond, A.R.; Kékedy-Nagy, L.; Kármán, K.; Palcsu, L.; Máthé, I.; Harangi, S. Constraints on the hydrogeochemistry and origin of the CO2-rich mineral waters from the Eastern Carpathians—Transylvanian Basin boundary (Romania). J. Hydrol. 2020, 591, 125311. [Google Scholar] [CrossRef]
- Kis, B.M.; Ionescu, A.; Cardellini, C.; Harangi, S.; Baciu, C.; Caracausi, A.; Viveiros, F. Quantification of carbon dioxide emissions of Ciomadul, the youngest volcano of the Carpathian-Pannonian Region (Eastern-Central Europe, Romania). J. Volcanol. Geotherm. Res. 2017, 341, 119–130. [Google Scholar] [CrossRef]
- Lange, T.; Palcsu, L.; Szakács, A.; Kovágó, A.; Gelencsér, O.; Gál, A.; Gyila, S.; Tóth, T.M.; Maţenco, L.; Krézsek, C.; et al. The link between lithospheric scale deformations and deep fluid emanations: Inferences from the Southeastern Carpathians, Romania. Evol. Earth 2023, 1, 100013. [Google Scholar] [CrossRef]
- Néda, T.; Szakács, A.; Cosma, C.; Mócsy, I. Radon concentration measurements in mofettes from Harghita and Covasna Counties, Romania. J. Environ. Radioact. 2008, 99, 1819–1824. [Google Scholar] [CrossRef] [PubMed]
- Matenco, L.; Bertotti, G.; Leever, K.; Cloetingh, S.; Schmid, S.M.; Tărăpoancă, M.; Dinu, C. Large-scale deformation in a locked collisional boundary: Interplay between subsidence and uplift, intraplate stress, and inherited lithospheric structure in the late stage of the SE Carpathians evolution. Tectonics 2007, 26. [Google Scholar] [CrossRef]
- Kovács, I.J.; Liptai, N.; Koptev, A.; Cloetingh, S.A.; Lange, T.P.; Maţenco, L.; Szakács, A.; Radulian, M.; Berkesi, M.; Patkó, L.; et al. The ‘pargasosphere’ hypothesis: Looking at global plate tectonics from a new perspective. Glob. Planet. Change 2021, 204, 103547. [Google Scholar] [CrossRef]
- Sensirion AG. STC31 CO2 Sensor Datasheet. 2020. Available online: https://sensirion.com/media/documents/7B1D0EA7/61652CD0/Sensirion_Thermal_Conductivity_Datasheet_STC31_D1_1.pdf (accessed on 27 June 2024).
- Adafruit Industries LLC. DHT11 Humidity and Temperature Sensor Datasheet. 2020. Available online: https://cdn-learn.adafruit.com/downloads/pdf/dht.pdf (accessed on 27 June 2024).
- Bosch Sensortec GmbH. BMP280 Barometric Pressure Sensor Datasheet. 2018. Available online: https://www.bosch-sensortec.com/media/boschsensortec/downloads/product_flyer/bst-bmp280-fl000.pdf (accessed on 27 June 2024).
- Gergely, A. Supplementary Materials for Research Programs and Data. 2024. Available online: http://comodi.phys.ubbcluj.ro:8087/supplementary/ (accessed on 27 June 2024).
Disclaimer/Publisher’s Note: The statements, opinions and data contained in all publications are solely those of the individual author(s) and contributor(s) and not of MDPI and/or the editor(s). MDPI and/or the editor(s) disclaim responsibility for any injury to people or property resulting from any ideas, methods, instructions or products referred to in the content. |
© 2025 by the authors. Licensee MDPI, Basel, Switzerland. This article is an open access article distributed under the terms and conditions of the Creative Commons Attribution (CC BY) license (https://creativecommons.org/licenses/by/4.0/).