Article

Hydrothermal Modeling of Groundwater–Surface Water Interactions Under an Evolving Climate

Centre Eau Terre Environnement, Institut National de la Recherche Scientifique (INRS), 490 Rue de la Couronne, Québec, QC G1K 9A9, Canada
*
Author to whom correspondence should be addressed.
Geosciences 2025, 15(9), 370; https://doi.org/10.3390/geosciences15090370
Submission received: 7 July 2025 / Revised: 15 September 2025 / Accepted: 19 September 2025 / Published: 22 September 2025

Abstract

Groundwater–surface water interactions play a critical role in regulating river temperature and flow, particularly in northern regions affected by climate change. This study evaluates the influence of climate warming on groundwater discharge for two rivers in Quebec: the Sainte-Marguerite River, located in a humid continental zone without permafrost, and the Berard River, situated in a subpolar continental zone with discontinuous permafrost. Using two-dimensional hydrothermal modeling supported by field data, the analysis reveals that climate warming will increase groundwater seepage into both river systems. The effect is notably more pronounced in permafrost regions, where thawing accelerates subsurface flow. Model projections indicate that permafrost near the Berard River may vanish by 2040 under high-emission scenarios or by 2070 under low-emission scenarios. This transition is expected to result in more than a thirtyfold increase in groundwater discharge by the end of the century. These findings highlight the growing influence of groundwater in shaping river hydrology under changing climatic conditions and underscore the need to incorporate subsurface flow dynamics into future water resource management and habitat conservation strategies in northern environments.

1. Introduction

Groundwater (GW) and surface water (SW) are tightly interconnected, and the extent of their interaction depends on the climate, geological setting, and human activities [1,2,3]. Changes in the GW system, driven by climate change (e.g., altered precipitation and recharge patterns) or human interventions (e.g., extraction and contamination), directly influence the quantity, quality, and temperature of GW-dependent wetlands, lakes, and rivers [4,5,6,7].
Among the complex GW-SW interactions, the contribution of GW to SW through seepage and upwelling is of particular importance in riverine ecosystems [8,9,10]. This GW discharge shapes river hydrology and ecology by influencing chemical composition and creating stable thermal environments [7,11].
The thermal regime of rivers plays a pivotal role in aquatic ecosystem health, particularly in regions such as northern Quebec, which hosts abundant Salmonidae species (brook/lake trout, Arctic char, and Atlantic salmon). Fishing in these rivers supports local communities and contributes to regional economies through sport fishing [12]. Salmonids have optimal growth temperatures between 7 °C and 17 °C, while lethal thresholds range between 25 °C and 27 °C [13,14,15]. Rising summer river temperatures increase the risk of thermal stress, threatening fish survival. Specific river zones act as thermal refuges that sustain fish populations during warm periods [16,17]. GW discharge through upwelling or lateral seepage is one of the main sources of such refuges, since the temperature of GW exhibits less daily and seasonal variability than that of SW [18,19,20,21]. Consequently, GW provides a reliable source of cold water in summer and warm water in winter [22].
In northern environments, the presence of permafrost adds further complexity to GW-SW dynamics [23,24]. Previous research has demonstrated that permafrost thaw in northern regions is imminent and will reshape the GW temperature and flow pathways [25,26,27]. Understanding these processes is of great importance and needs to be better investigated in permafrost regions such as northern Quebec, which is expected to undergo substantial environmental change in the coming decades.
Understanding these complex processes requires integrated approaches that explicitly couple GW flow and thermal dynamics. Combined GW and heat transfer models are well-established and have been extensively applied to hydrogeological (e.g., [28]) and geothermal (e.g., [29]) studies and, recently, for the simulation of permafrost evolution (e.g., [30]). Multidimensional hydrothermal models are valuable tools for assessing GW-SW interactions and predicting the evolution of aquatic ecosystems under future climatic conditions, although a limited number of field studies in northern regions hinder calibration and validation efforts [6,31,32,33].
The objective of this study was to evaluate the impact of climate change on GW seepage and its influence on river thermal regimes in northern Quebec, narrowing the gap left by previous studies with the use of site-specific hydrothermal models. Two sites—one in a permafrost-free setting and the other in a discontinuous permafrost zone—provided natural laboratories to conduct this study and draw general conclusions that can be applicable to permafrost regions. These two natural laboratories were selected because of the baseline information availability and their relative ease of access. This made field instrumentation, data acquisition, and, consequently, model development feasible. Using a consistent methodological approach across both sites—which is a novel practice—enabled a direct comparison. This approach allowed conclusions to be drawn about the impact of climate change in two substantially different environments with extended GW-SW interactions.

2. Materials and Methods

2.1. Study Area

The two rivers selected for this study are the Sainte-Marguerite River, located about 12 km from the Sacré-Coeur municipality in the Cote-Nord (North Shore of the St. Lawrence River) region of the Quebec Province, and the Berard River, which discharges into the Ungava Bay in the northern village of Tasiujaq in Nunavik, northern Quebec (Figure 1A). The Sainte-Marguerite River is located in southern Quebec, has no surrounding permafrost, and is in a continental cold and humid climate. The Berard River is located at the boundary of continuous (a thick, unbroken layer of frozen ground that covers nearly the entire landscape) and discontinuous (patches of frozen ground interspersed with areas of unfrozen ground) permafrost [25] and experiences a continental subpolar climate. The permafrost is overlain by an active layer (the topmost layer of ground that thaws above 0 °C in summer and freezes below 0 °C in winter) with a thickness that varies between 2 m and 10 m near the Berard River [25,34,35]. The permafrost base (the deepest point where the ground temperature remains below 0 °C for two or more consecutive years) is expected to be around 200 m to 280 m below the ground surface, according to the extrapolation of recorded ground temperature profiles [36].
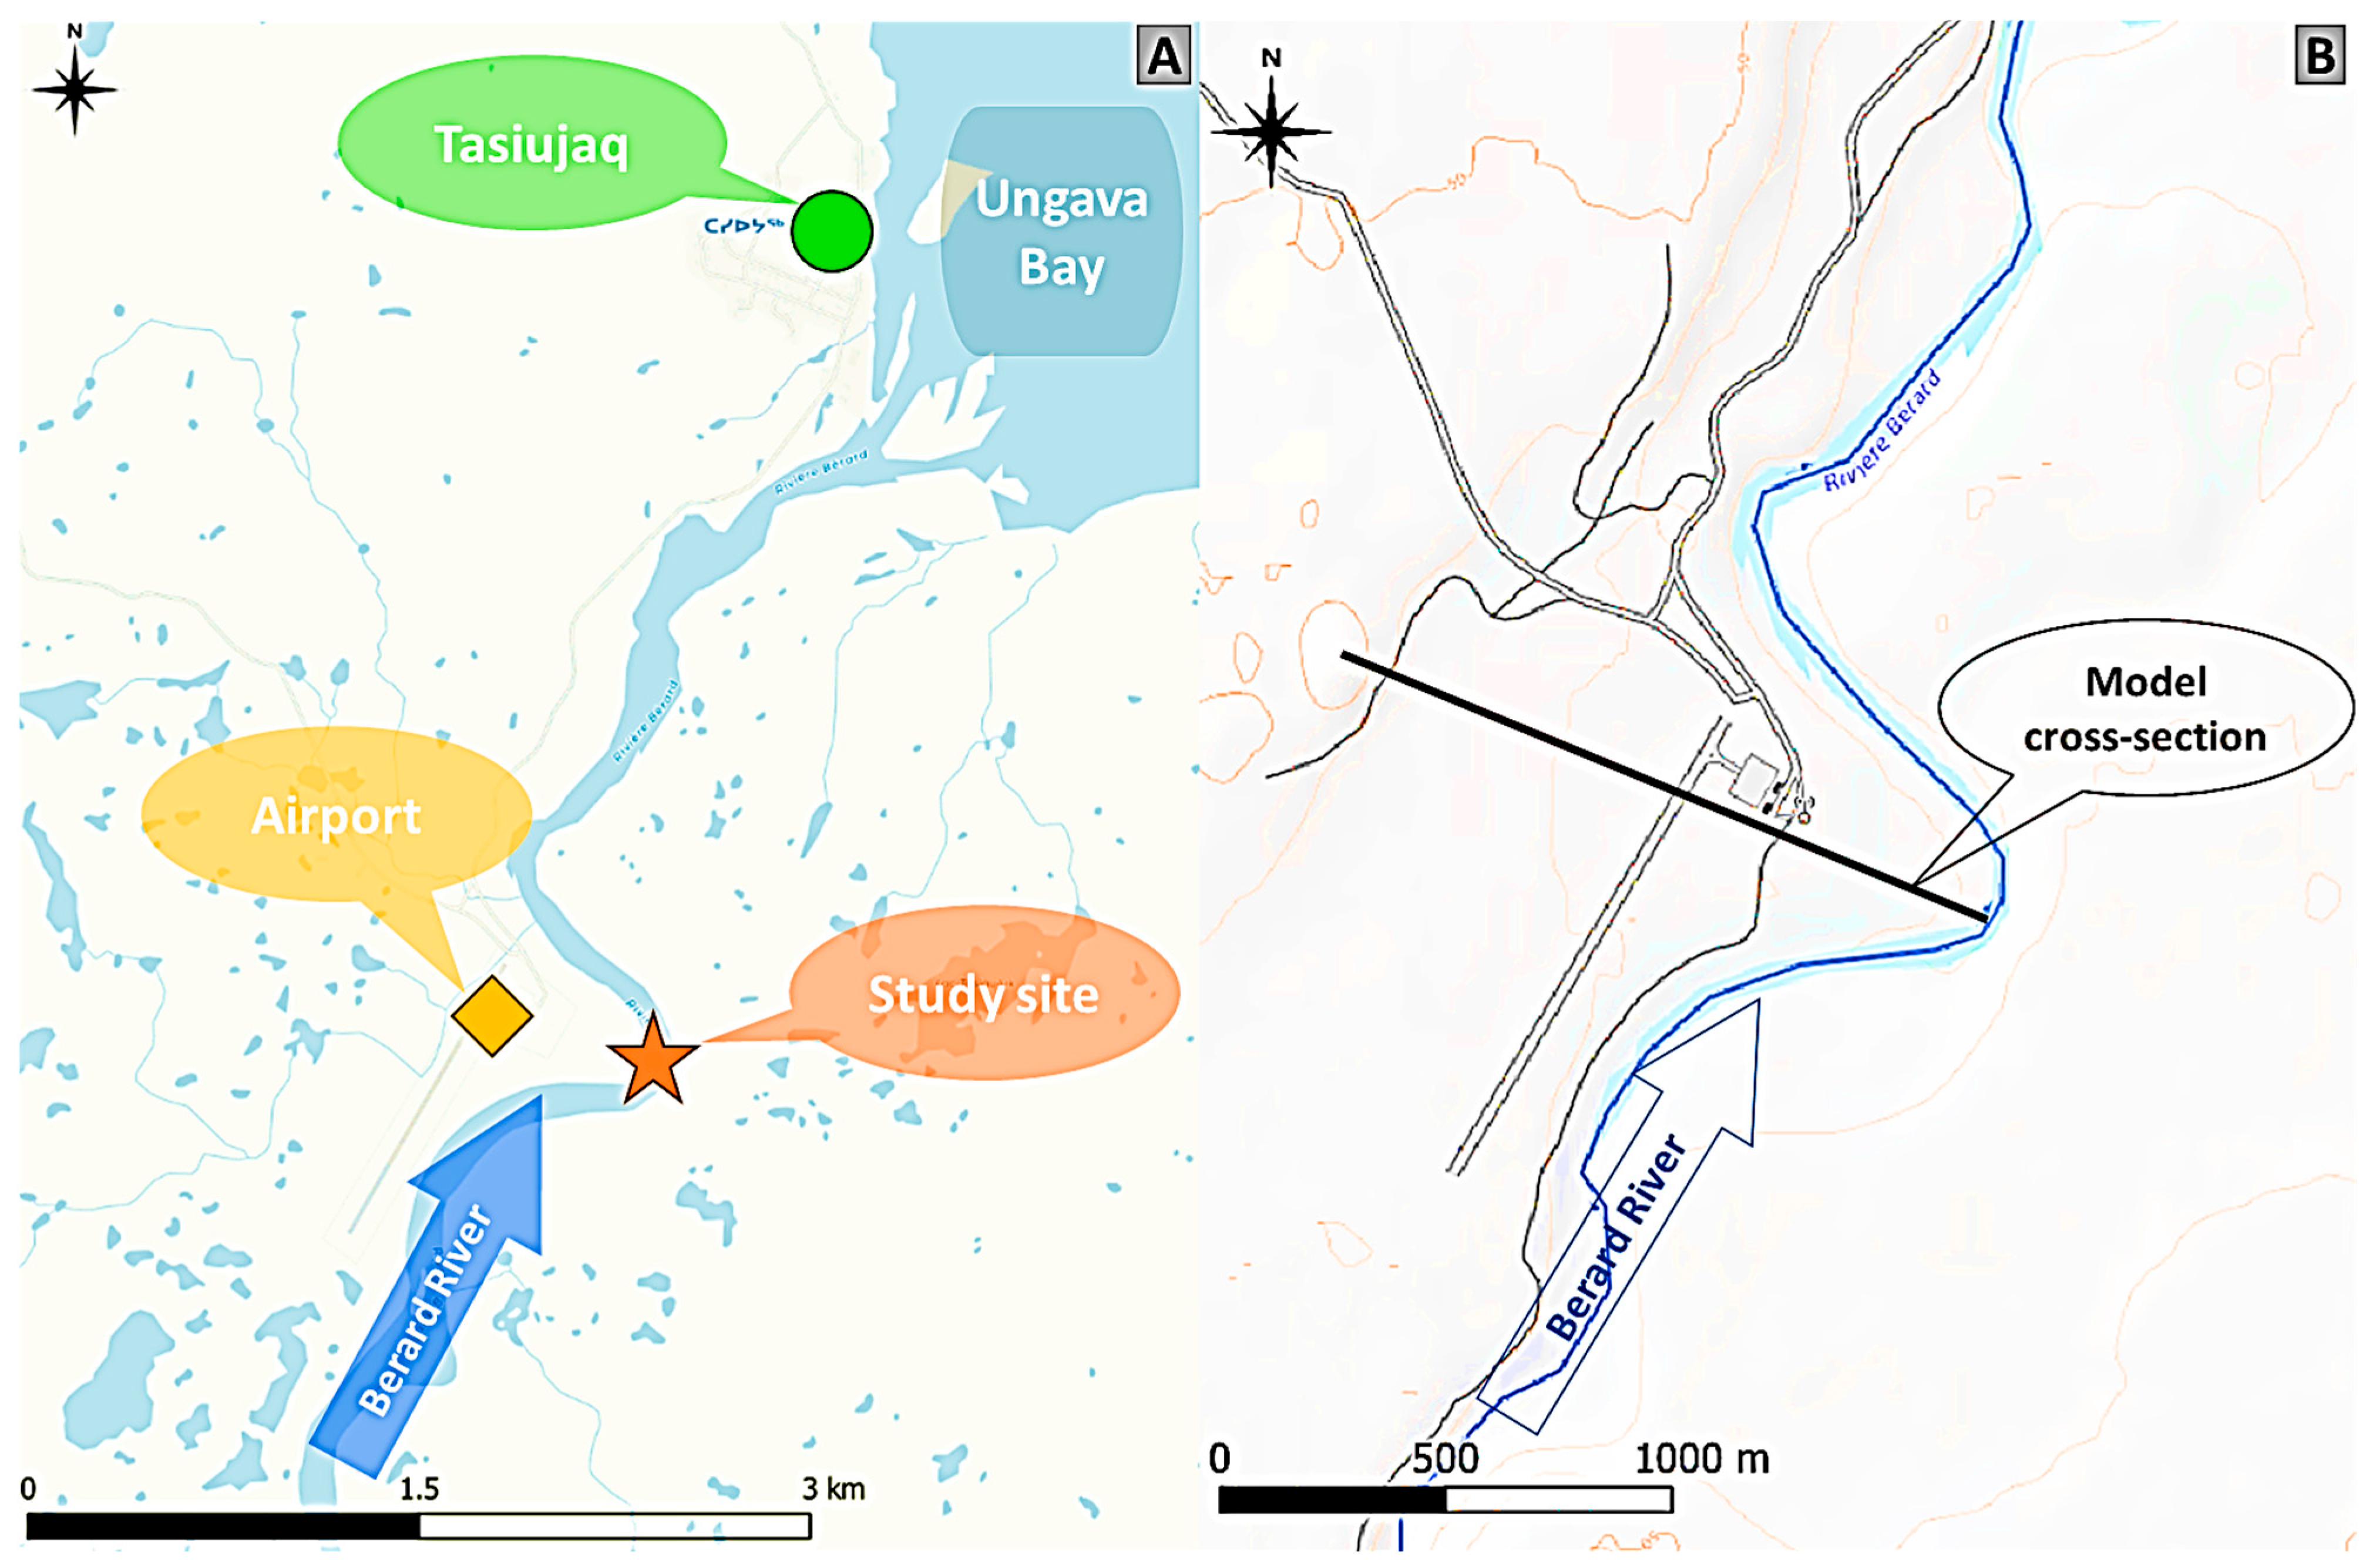
Previous studies have identified several sites along the Sainte-Marguerite and Berard rivers exhibiting substantial GW seepage [19,20]. In this study, one site from each river—previously documented—was selected for detailed measurement and analysis. The study site on the Sainte-Marguerite River is located on the main branch, 36 km upstream from the river mouth (Figure A1 in the Appendix A). The study site on the Berard River is located 5.5 km upstream from the river mouth (Figure A2 in the Appendix A). Based on 1971–2000 climate data for Sacré-Coeur (in the Sainte-Marguerite River watershed), the annual average air temperature (AT) and the total annual precipitation (TP) were 2.6 °C and 1002 mm, respectively, while for the same period, the AT in Tasiujaq was −5.9 °C and the TP was 484 mm [37]. In the studied rivers, Salmonidae, such as arctic char, brook and sea trout, and Atlantic salmon, have been identified [38,39]. These fish species are temperature-dependent, and fishing is popular in these rivers, such that studies regarding water temperature are imperative.
Geology near the study site consists of bedrock outcropping on both sides of the valley, which is partly filled with Quaternary deposits in the central depression. At the Sainte-Marguerite River site, the bedrock is made of Mesoproterozoic igneous rocks of the Grenville Province, overlain by Quaternary sediments consisting of glacial till with a maximum thickness of 30 m and alluvial sand, sandy silt, and gravel with a 1–30 m thickness [40]. At the Berard River site, the bedrock is made of Paleoproterozoic sedimentary rocks of the Churchill Province, overlain by Quaternary sediments consisting of glacial till with a thickness of 1–40 m and alluvial sand, sandy silt, and gravel with a maximum thickness of 15 m [25,40].
The topographic elevation difference between the riverbed and the top of nearby hills is about 200 m for the Sainte-Marguerite River cross-section and 30 m for the Berard River cross-section. The cross-section at the selected site on both rivers is near-symmetric; therefore, half of the cross-sections were used for the visualization of geological units (Figure 1B,C).

2.2. Data Collection

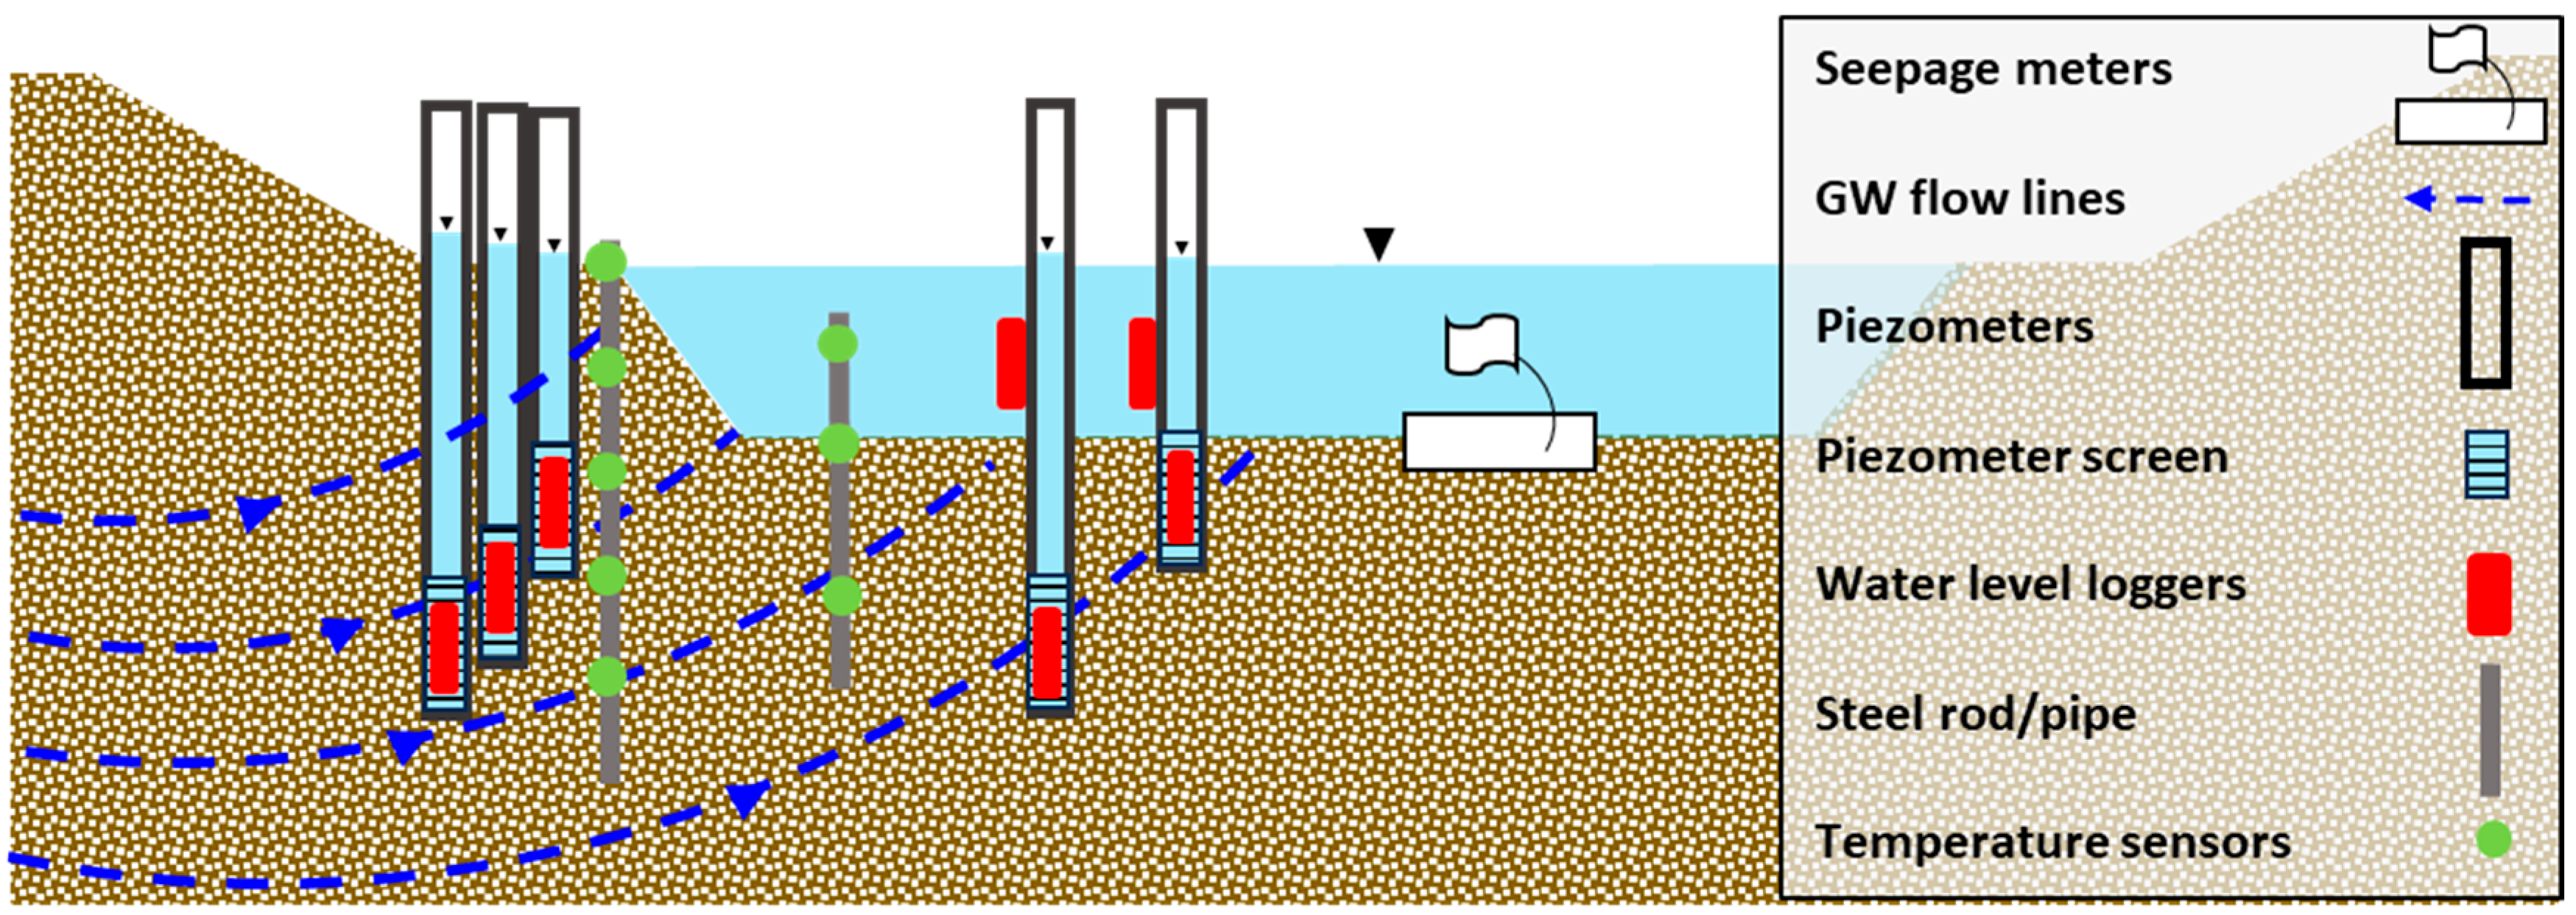
Measurements of the riverbed GW seepage rate (GWSR), water level, and temperature provide important data for monitoring and measuring GW-SW interactions and to calibrate and validate models. Shallow piezometers (maximum depth of 2.9 m from the ground surface) were installed on the riverbank and below the riverbed to monitor the GW level and temperature at each site. River water levels and temperature were also monitored over the same period (Figure A3 in the Appendix A). Onset HOBO MX2201 Pendant temperature sensors (Hoskin Scientific Ltd., Montreal, QC, Canada), with an accuracy of ±0.5 °C, were installed at 0.25 m intervals from zero to two meters below the surface to record detailed temperature profiles. Solinst Levelogger-M5 water level sensors (Solinst Canada Ltd, Georgetown, ON, Canada), with an accuracy of ±5 mm, were installed in the piezometers. The water level was recorded for one year (July 2019 to July 2020), and the temperature was recorded for two years (July 2019 to July 2021). Seepage meters were also installed in July 2019 and 2020 at different locations on the riverbed to measure the GWSR to the river at the selected reach for two to three days [41]. It should be mentioned that the field dataset (2019–2021) was not intended to capture interannual variability, but rather to provide representative baseline conditions for model calibration of hydraulic and thermal parameters. While the field data encompass a limited period (1–2 years), these measurements ensured that the model reproduced the observed GW heads, seepage rates, and riverbed temperatures at the study sites before long-term predictions from climate scenarios were made.

2.3. Hydrothermal Modeling Framework

Combined GW flow and heat transfer models considering latent heat effects were used to solve the flow and energy balance equations of the system. Complex coupling of all equations in the system was carried out using the COMSOL Multiphysics Software Version 6.0, a finite element software package suitable for a variety of engineering fields [42].
Riverbed temperature (RBT) and GWSR were the main outputs of 2D transient models. Thermal equilibrium was considered for heat transfer simulations. Thus, RBT was assumed to be equal to the river water temperature at its deepest location in the river. Long-term simulations considered varying AT and TP based on climate change scenarios to predict the RBT and GWSR until the end of the century (2100). Details of these scenarios are presented in the following section.
Flow in porous media was solved using Darcy’s Law. Heat transfer in the Sainte-Marguerite River system considered convection and conduction, while latent heat and phase change were not considered (Figure 2, left) since permafrost is not present and the AT of the area is always above 0 °C according to climate norms [37]. On the other hand, permafrost is present around the Berard River, which is highlighted by historical sub-zero atmospheric temperatures [37], and its thaw due to climate change is of interest. Thus, latent heat and phase change were considered in the simulations of the Berard River case study (Figure 2, right).

2.4. Geometry of Subsurface Geology

The porous media zone can be divided into subdomains based on the three present geological units (Figure 1B,C). The 2D models’ geometries are the same as the study sites’ topography and stratigraphy, as shown in Figure 1B,C. The Sainte-Marguerite River model has a total thickness of around 300 m on the left side, reaching the river valley top, and a thickness of 100 m on the right side below the river center line. The Berard River model has a thickness of 250 m on the highlands and 220 m thickness below the river center line.

2.5. Inputs and Parameter Estimation

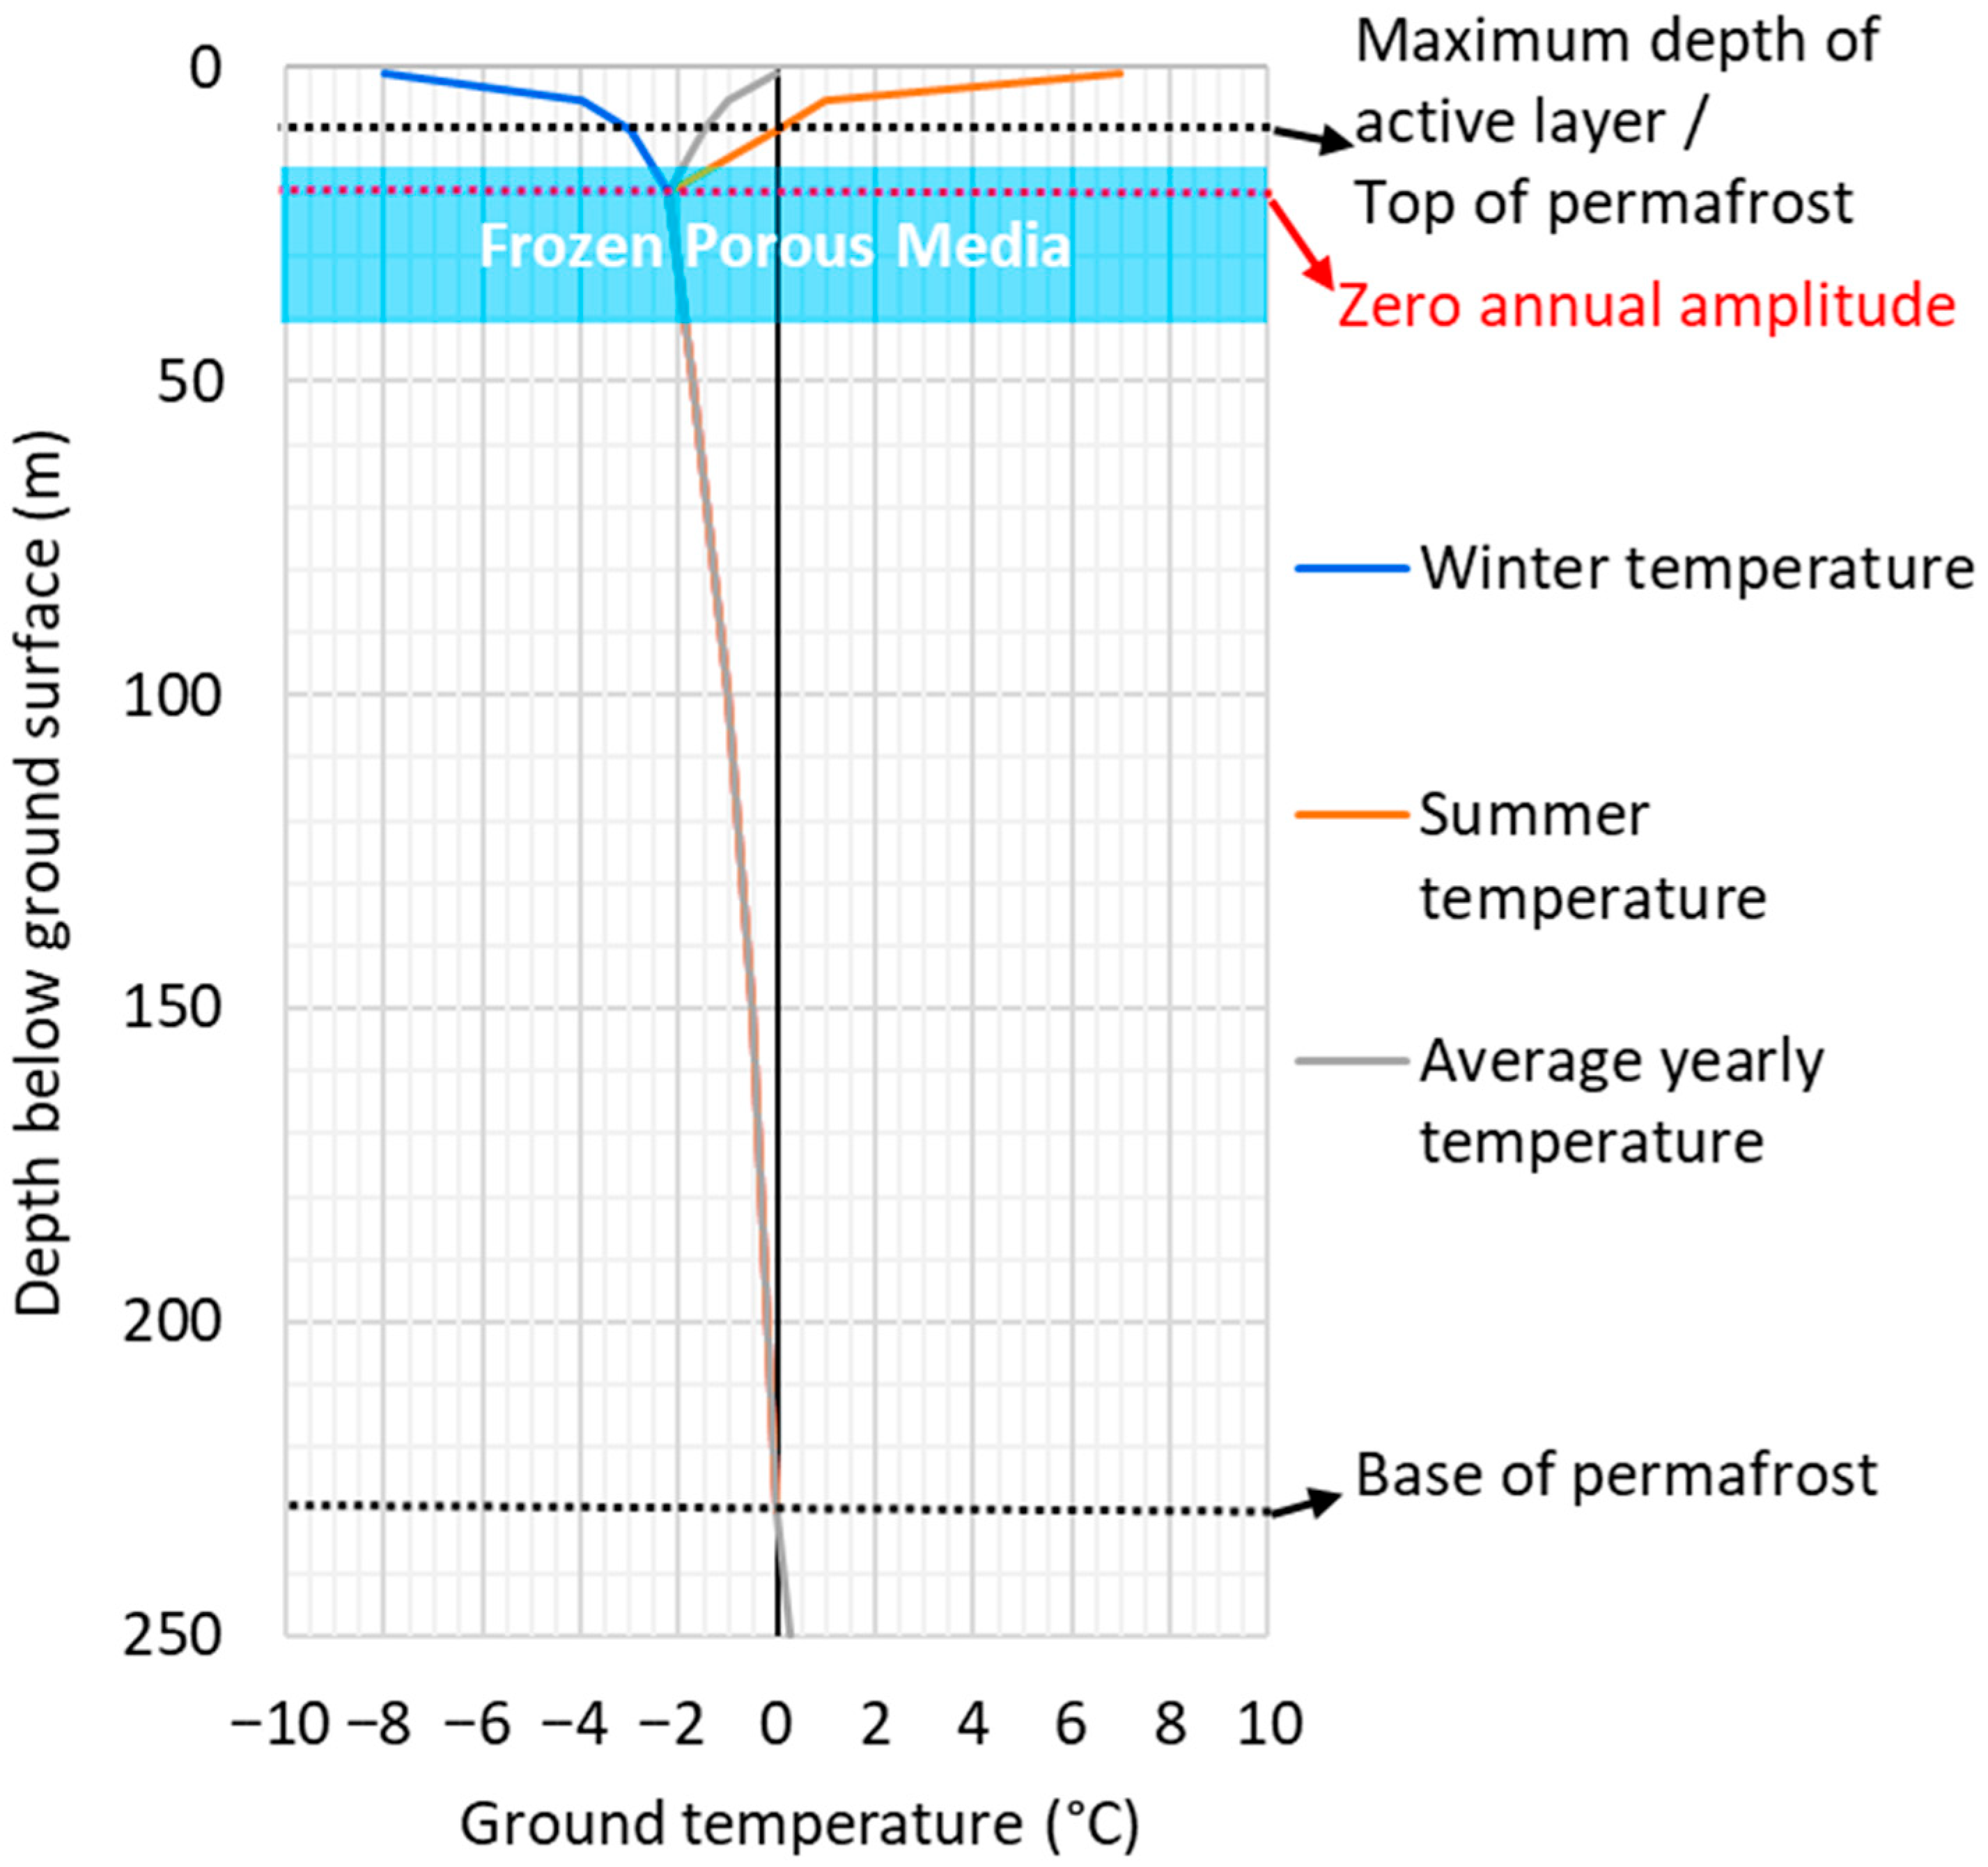
Ground temperature measurements conducted in this study reached a maximum depth of approximately 3 m, which could not be used to evaluate the ground temperature profile and the exact depth of the permafrost top and bottom. However, prior research conducted near Tasiujaq (e.g., [25,34,35,36]) allowed us to define an initial ground temperature profile, as illustrated in Figure 3. Based on this expected temperature profile, an average yearly ground temperature below 0 °C was found between ~10 m and ~230 m depth, which should correspond to the depth of the permafrost. The freezing point of previously gathered soil samples influenced by GW salinity was found to be −2 °C in the vicinity of Tasiujaq [25]. Thus, −2 °C was considered to be the phase change temperature for the simulations. Therefore, based on the ground temperature profile and phase change threshold, the frozen porous media (where the temperature is below −2 °C) are located between 15 m and 40 m depth for the initial condition (Figure 3). Based on ground-penetrating radar measurements near Tasiujaq, an ice-rich layer is effectively present everywhere in the region, even in areas close to the bay [25]. The presence of an ice-rich layer at a depth of around 15 m and the location of Tasiujaq at the boundary of continuous and discontinuous permafrost zones in regional permafrost distribution maps (Figure 1A) provided sufficient justification to consider a continuous permafrost layer with a thickness of about 25 m in the model of the Berard River.
The hydraulic and thermal properties of the materials were initially set based on the available literature and field and lab measurements [20,25,41,43,44,45,46]. These parameters were then further refined as the models were calibrated to observed temperatures and the GWSR from field instrumentation (Table 1 and Table 2) [20,41].
The properties of the porous media domain were based on frozen and unfrozen conditions. Only unfrozen conditions were considered for geological units of the Sainte-Marguerite River since permafrost is not present. However, for the Berard River case, the hydraulic and thermal properties were introduced as variable and temperature-dependent values. In this study, −2 °C was set as the limit where parameters change between respective frozen/ice (T < −4 °C) to unfrozen/water (T > 0 °C) conditions. The parameter ω was introduced to show the ratio of unfrozen/water to frozen/ice phases. During the phase change (−4 °C ≤ T ≤ 0 °C), ω varies between zero and one depending on temperature (Equation (1) and Figure A4 in the Appendix A).
ω = 1   for   T > 0 0.25 × T _ Value   + 1   for   4 T 0 0   for   T < 4
where ω is the temperature dependency factor (−), T_Value is a unitless temperature value (−), and T is temperature (°C), showing the range for selecting the proper ω.
During the phase change, the hydraulic conductivity of units was calculated using a weighted average (based on Ref. [47]), considering the ω factor (Equation (2)).
k e q = ω k u f + ( 1 ω ) k f
where k is the hydraulic conductivity (L·t−1). The subscripts uf and f denote unfrozen and frozen conditions, respectively.
In the frozen condition, permeability should be set to an arbitrary small minimum value [48]. However, since the model convergence was difficult if the permeability of two adjacent cells was more than three orders of magnitude different, the arbitrary small minimum permeability value for each unit in the frozen condition was considered to be 1000 times lower than in the unfrozen condition (Table 1).
Thermal properties of solids for the three porous media units in Table 2 were defined according to laboratory measurements made in dry conditions. Thermal conductivity and heat capacity in the model were calculated using a volumetrically weighted arithmetical mean of the parameters (based on Ref. [47]) for solids, water, and ice, depending on the ω factor (Equations (3) and (4)).
c e q = ε ω ρ w c w + ( 1 ω ) ρ i c i + ( 1 ε ) ρ s c s
λ e q = ε ω λ w + ( 1 ω ) λ i + ( 1 ε ) λ s
where c is the specific heat capacity (L2·t−2·T−1), ε is the porosity (−), λ is the thermal conductivity (M·L·t−3·T−1), and ρ is the density (M·L−3). The subscript eq denotes that the physical variables are calculated by using the volumetrically weighted arithmetical mean method, considering the temperature-dependent ω factor and subscripts i , w , and s denote ice, water, and solid particles, respectively.

2.6. Boundary Conditions

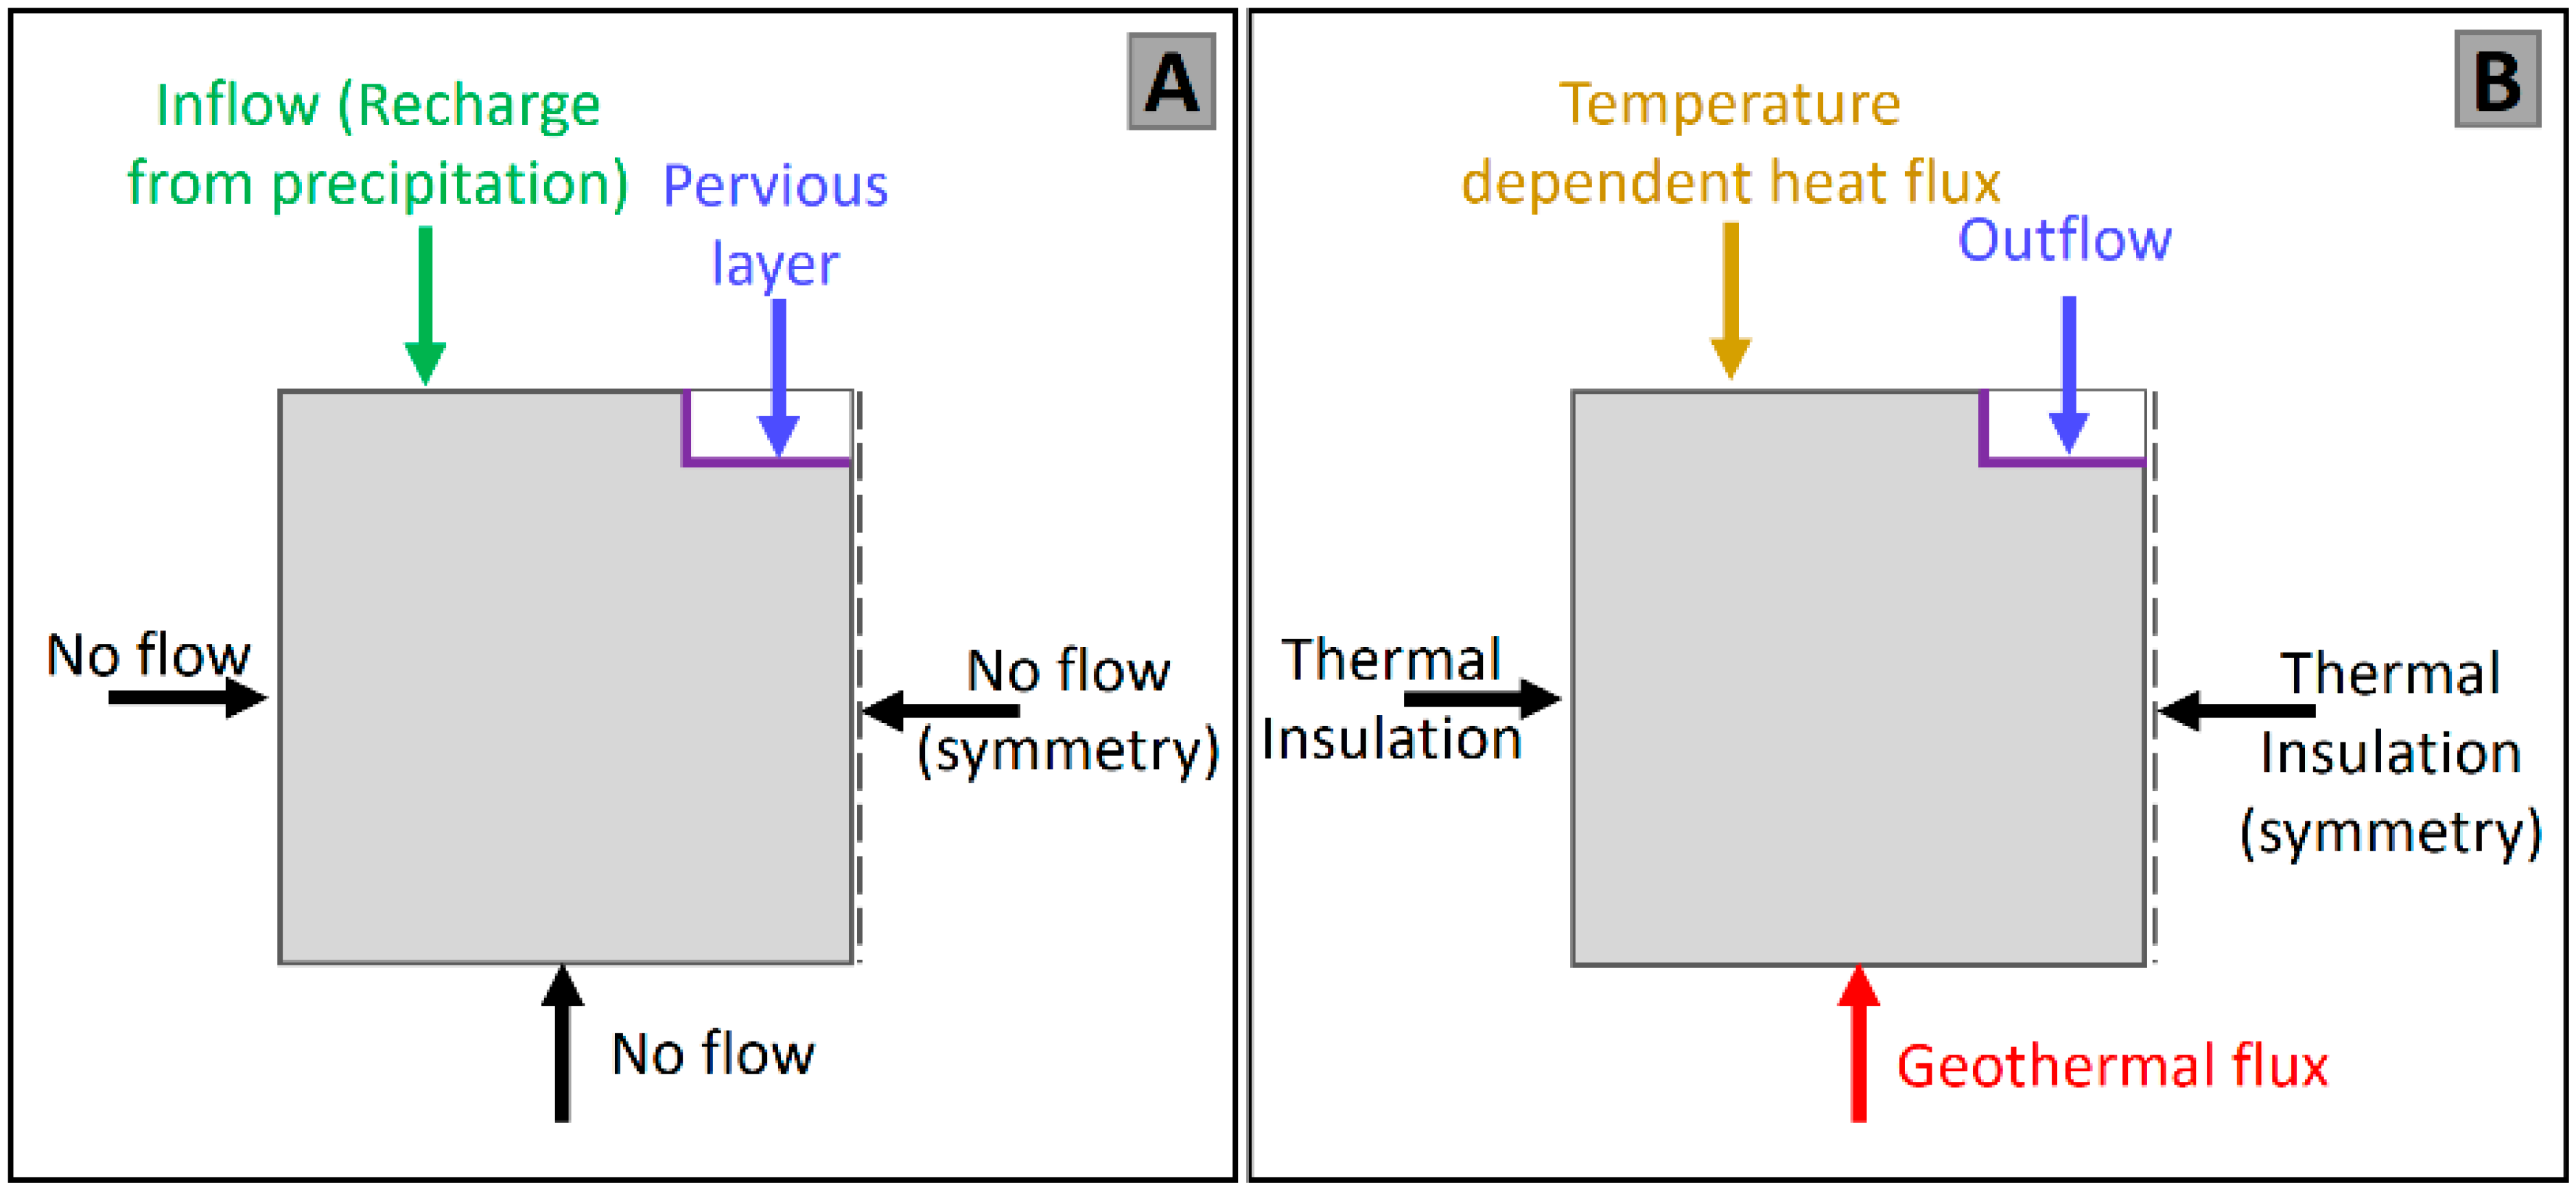
The right boundary was set along the river’s centerline, assuming symmetry in the valley, a common simplification in 2D cross-sectional models to reduce computational time while capturing the essential dynamics of hillslope–river exchange. The left model boundary was extended to the topographic divide (hilltop), where GW divides are typically located, justifying the no-flow condition. By including the bedrock unit below the sedimentary deposits and extending models to the hills on the left side of the models, no-flow boundaries could be assumed. It would have been difficult to set closer boundaries due to the lack of field information, such as the measured hydraulic head, which would allow setting boundaries based on equipotential lines. At the top face, an infiltration rate was assigned on the ground surface simulating GW recharge from increasing TP based on climate change scenarios. The riverbed was set to the pervious layer boundary condition, which describes a flux through a layer connected to an external fluid source at different pressures, which are the GW pressure in porous media and the pressure at the bottom of the river (Figure 4A). The bottom face was considered a no-flow boundary.
The sides of the heat transfer model were thermal isolation boundary conditions. The temperature-dependent heat flux boundary condition was applied at the top of the heat transfer simulations. Inward heat flux at each time step was calculated with variable ambient temperature (AT) based on climate scenarios, the emissivity of the material, and the initial temperature of the surface (Equation (A1) in the Appendix A). In addition, 0.99 and 0.98 were considered as the water and soil emissivity factors in this study, respectively (based on Refs. [49,50]). The bottom face of the model was set to an inward heat flux based on the estimated geothermal heat flux in the study area. The Sainte-Marguerite River is located in Grenville Province of the Canadian Shield with a heat flux of 0.033 W·m−2, and the Berard River is located in Churchill Province with 0.034 W·m−2 heat flux [45]. The riverbed was set to an outflow boundary condition, which states that the only heat transfer occurring across the boundary is by convection. This boundary condition ensured no direct effect of AT on the riverbed and constant GW seepage at its calculated temperature, which was determined by the physical processes simulated in the model (Figure 4B).

2.7. Initial Conditions

A steady-state simulation was initially performed using the 50-year (1950–2000) average TP. The result of this steady-state simulation was used for the initial conditions for the transient simulations, which incorporated climate scenarios covering the 2020–2100 period. The initial temperature for heat transfer simulations was set to 2 °C for the entire domain of the Sainte-Marguerite River model. A ground temperature profile (Figure 3) representative of the average yearly temperature based on available sources [25,34,35] was assigned to the Berard River model. This temperature profile defined the initial location of frozen ground/permafrost in the system.

2.8. Mesh

The mesh for 2D models was made of triangular elements with minimum and maximum dimensions of 25 cm and 25 m, respectively. This resulted in 585 elements for the Sainte-Marguerite River and 5745 elements for the Berard River (Figure A5 in the Appendix A). Different mesh sizes were tested, and models were shown to be mesh-independent.

2.9. Time Step

Yearly time steps were considered since yearly temperature and precipitation increases from climate models were used as input data for 2D simulations. Five- and ten-year time steps were also tested and showed similar results with slightly better calculation time. Using time steps longer than one year but recording the outputs on a yearly basis could lead to interpolated results. To avoid this and since yearly changes were of interest, the time step in climate change simulations was set to one year.

2.10. Simulated Scenarios

The long-term climate scenarios in this study were selected based on anticipated increased AT and TP from Canada’s Coupled Model Intercomparison Project Phase 6 (CMIP6) climate models. Forty-nine climate modeling groups, considering 100 different climate models, were included in this latest phase of CMIP. The results of these climate models are openly available from the ClimateData.ca website [37]. Climate models, in this source, consider three different Representative Concentration Pathways (RCPs) to provide plausible future scenarios of human emissions patterns. The scenarios are as follows: RCP8.5—a high global emission scenario representative of a situation with no measures to limit (mitigate) climate change, RCP4.5—a medium global emission scenario that includes some mitigation actions, and RCP2.6—a low global emission scenario that requires strong mitigation actions. In this study, RCP2.6 (low emissions) and RCP8.5 (high emissions) scenarios were selected to represent the lower and upper bounds of projected climate uncertainty, providing a plausible range of future outcomes. The intermediate RCP4.5 scenario was excluded to streamline the analysis and focus on the most contrasting futures.
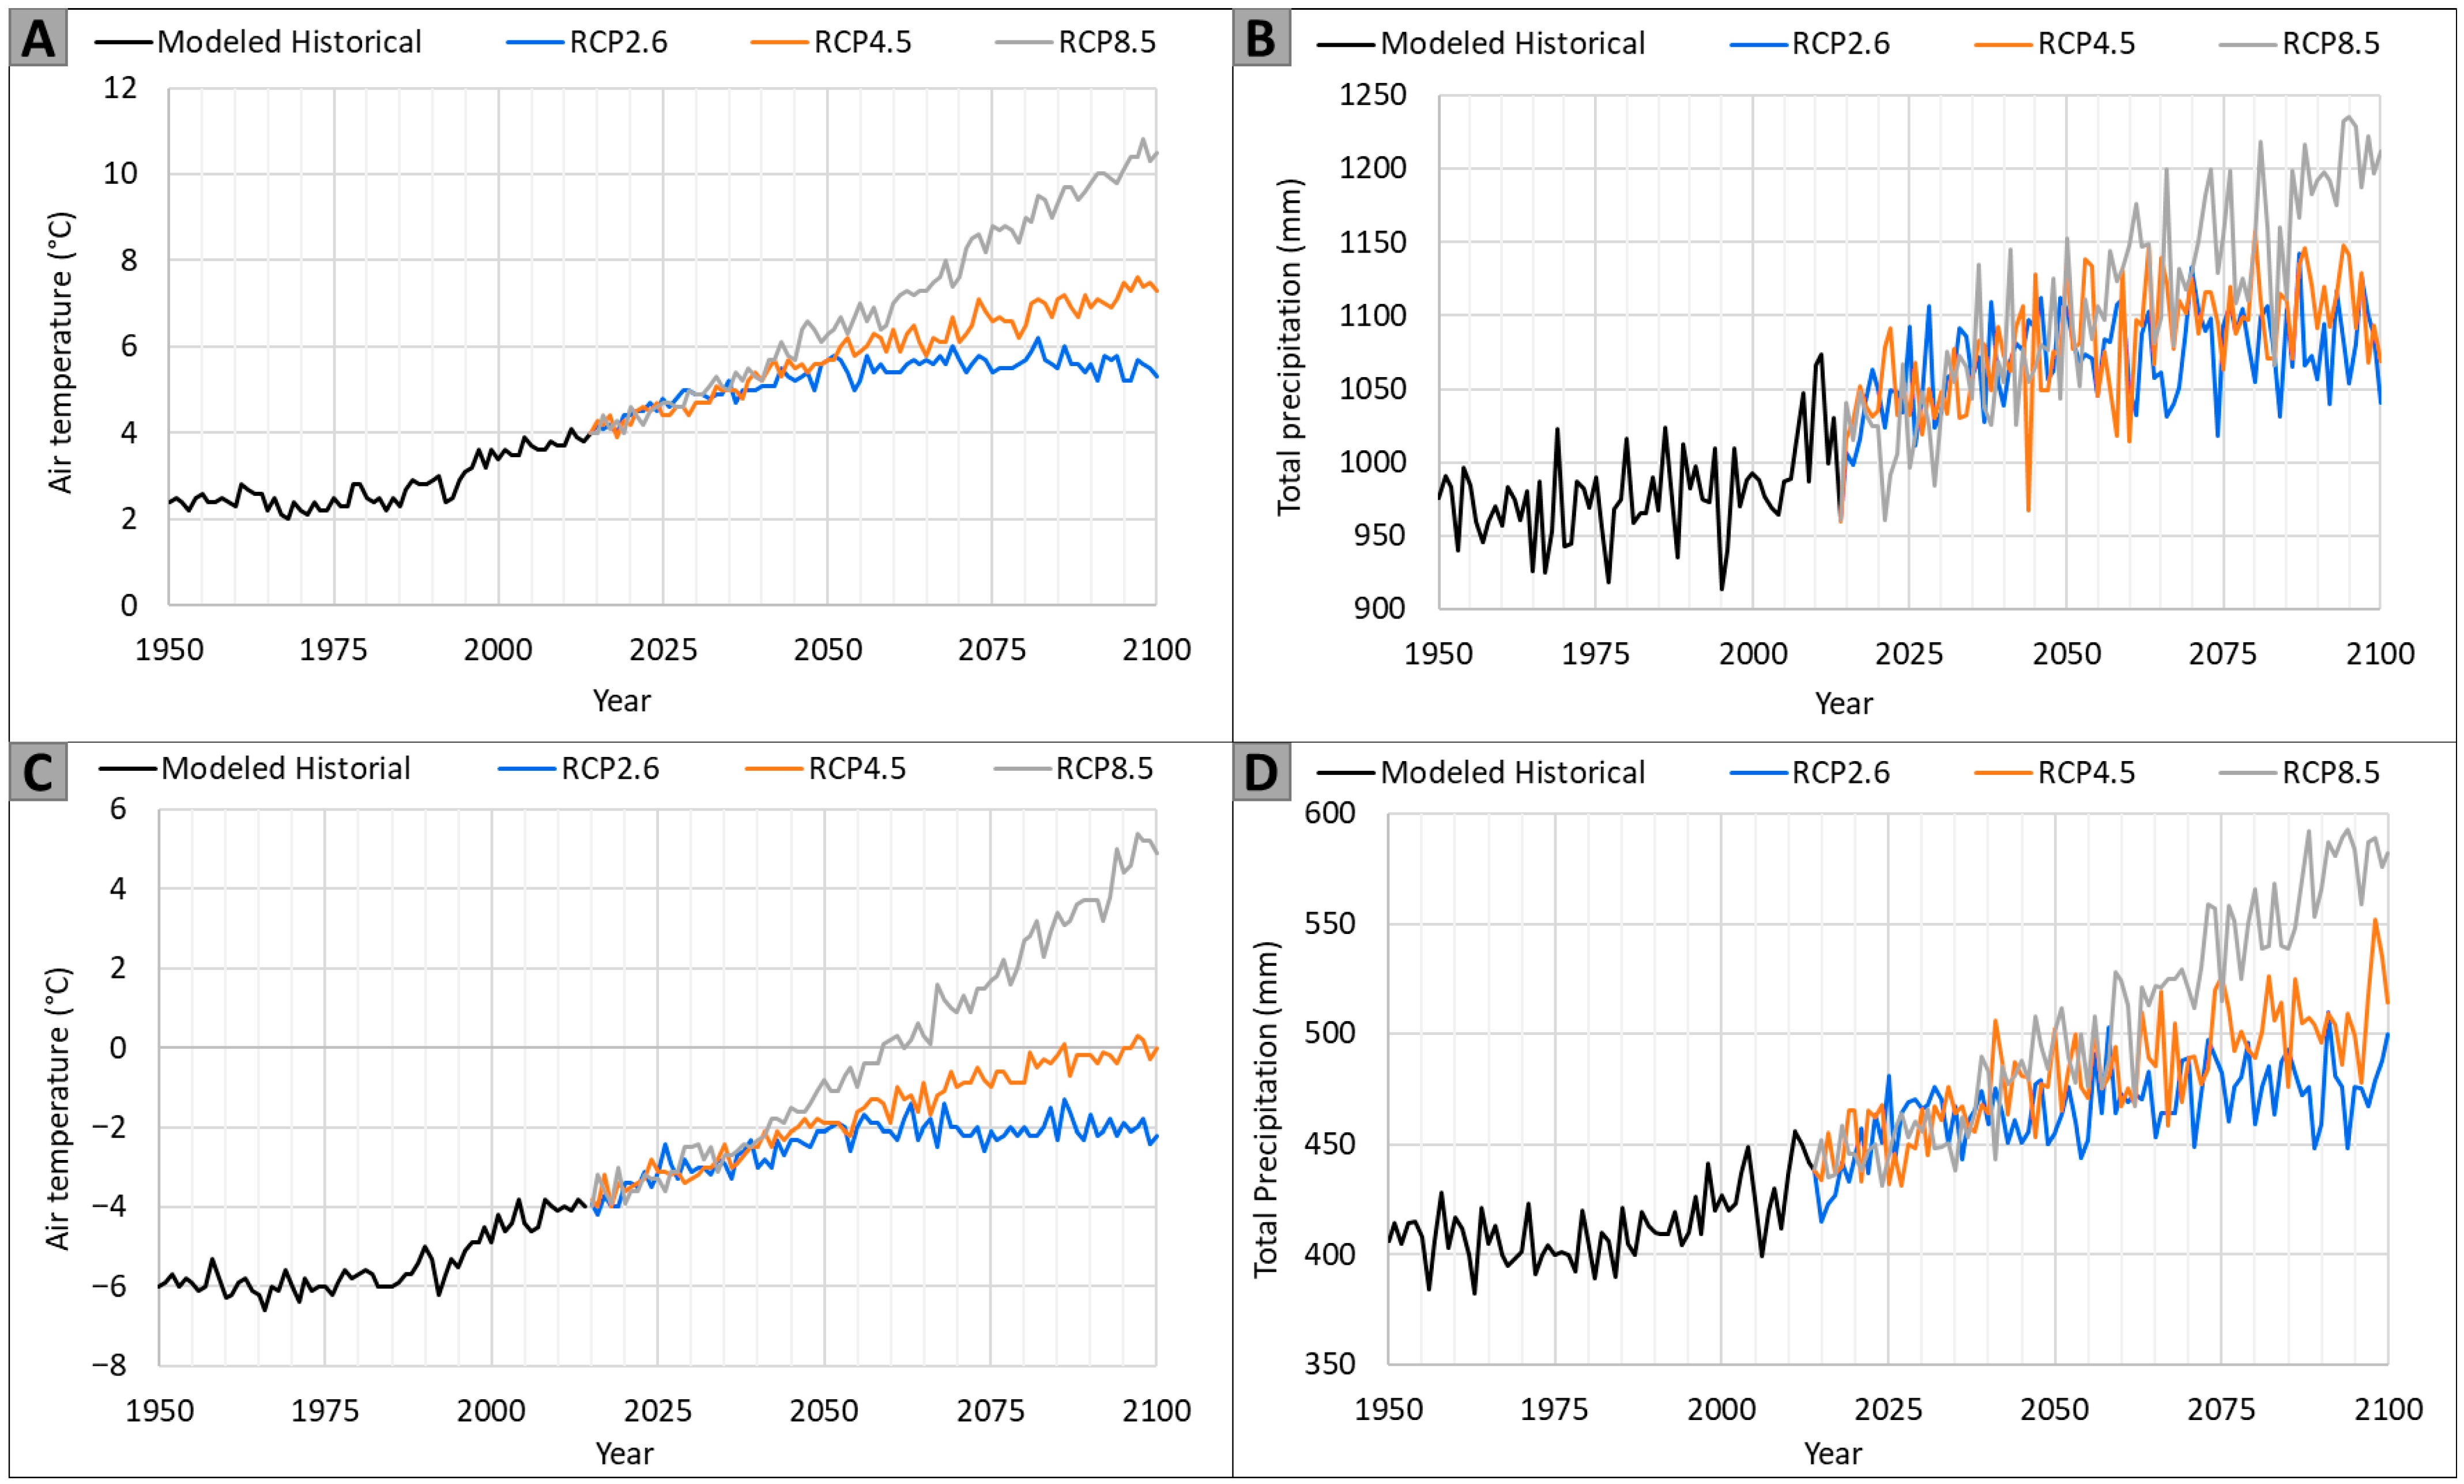
The resulting increases in AT and TP for the Sainte-Marguerite River (Sacré-Coeur) and Berard River (Tasiujaq) are presented in Figure 5. More details regarding climate models, including the available inputs, can be found on the ClimateData.ca website. The AT and TP are almost constant from 1950 to 1990, while from 1990 onward, a positive increase in AT and TP can be identified for both study sites. To simplify model inputs, instead of simulated AT and TP from climate models (Figure 5), an extracted linear increase in AT and TP was used as input in the models. The linear increase rates of AT and TP for the Sainte-Marguerite and Berard Rivers based on the two selected climate scenarios are shown in Table 3. These estimated trends were used in the 2D models to simulate changes in GWSR and RBT from 2020 to 2100.

3. Results

3.1. Sensitivity Analysis and Calibration

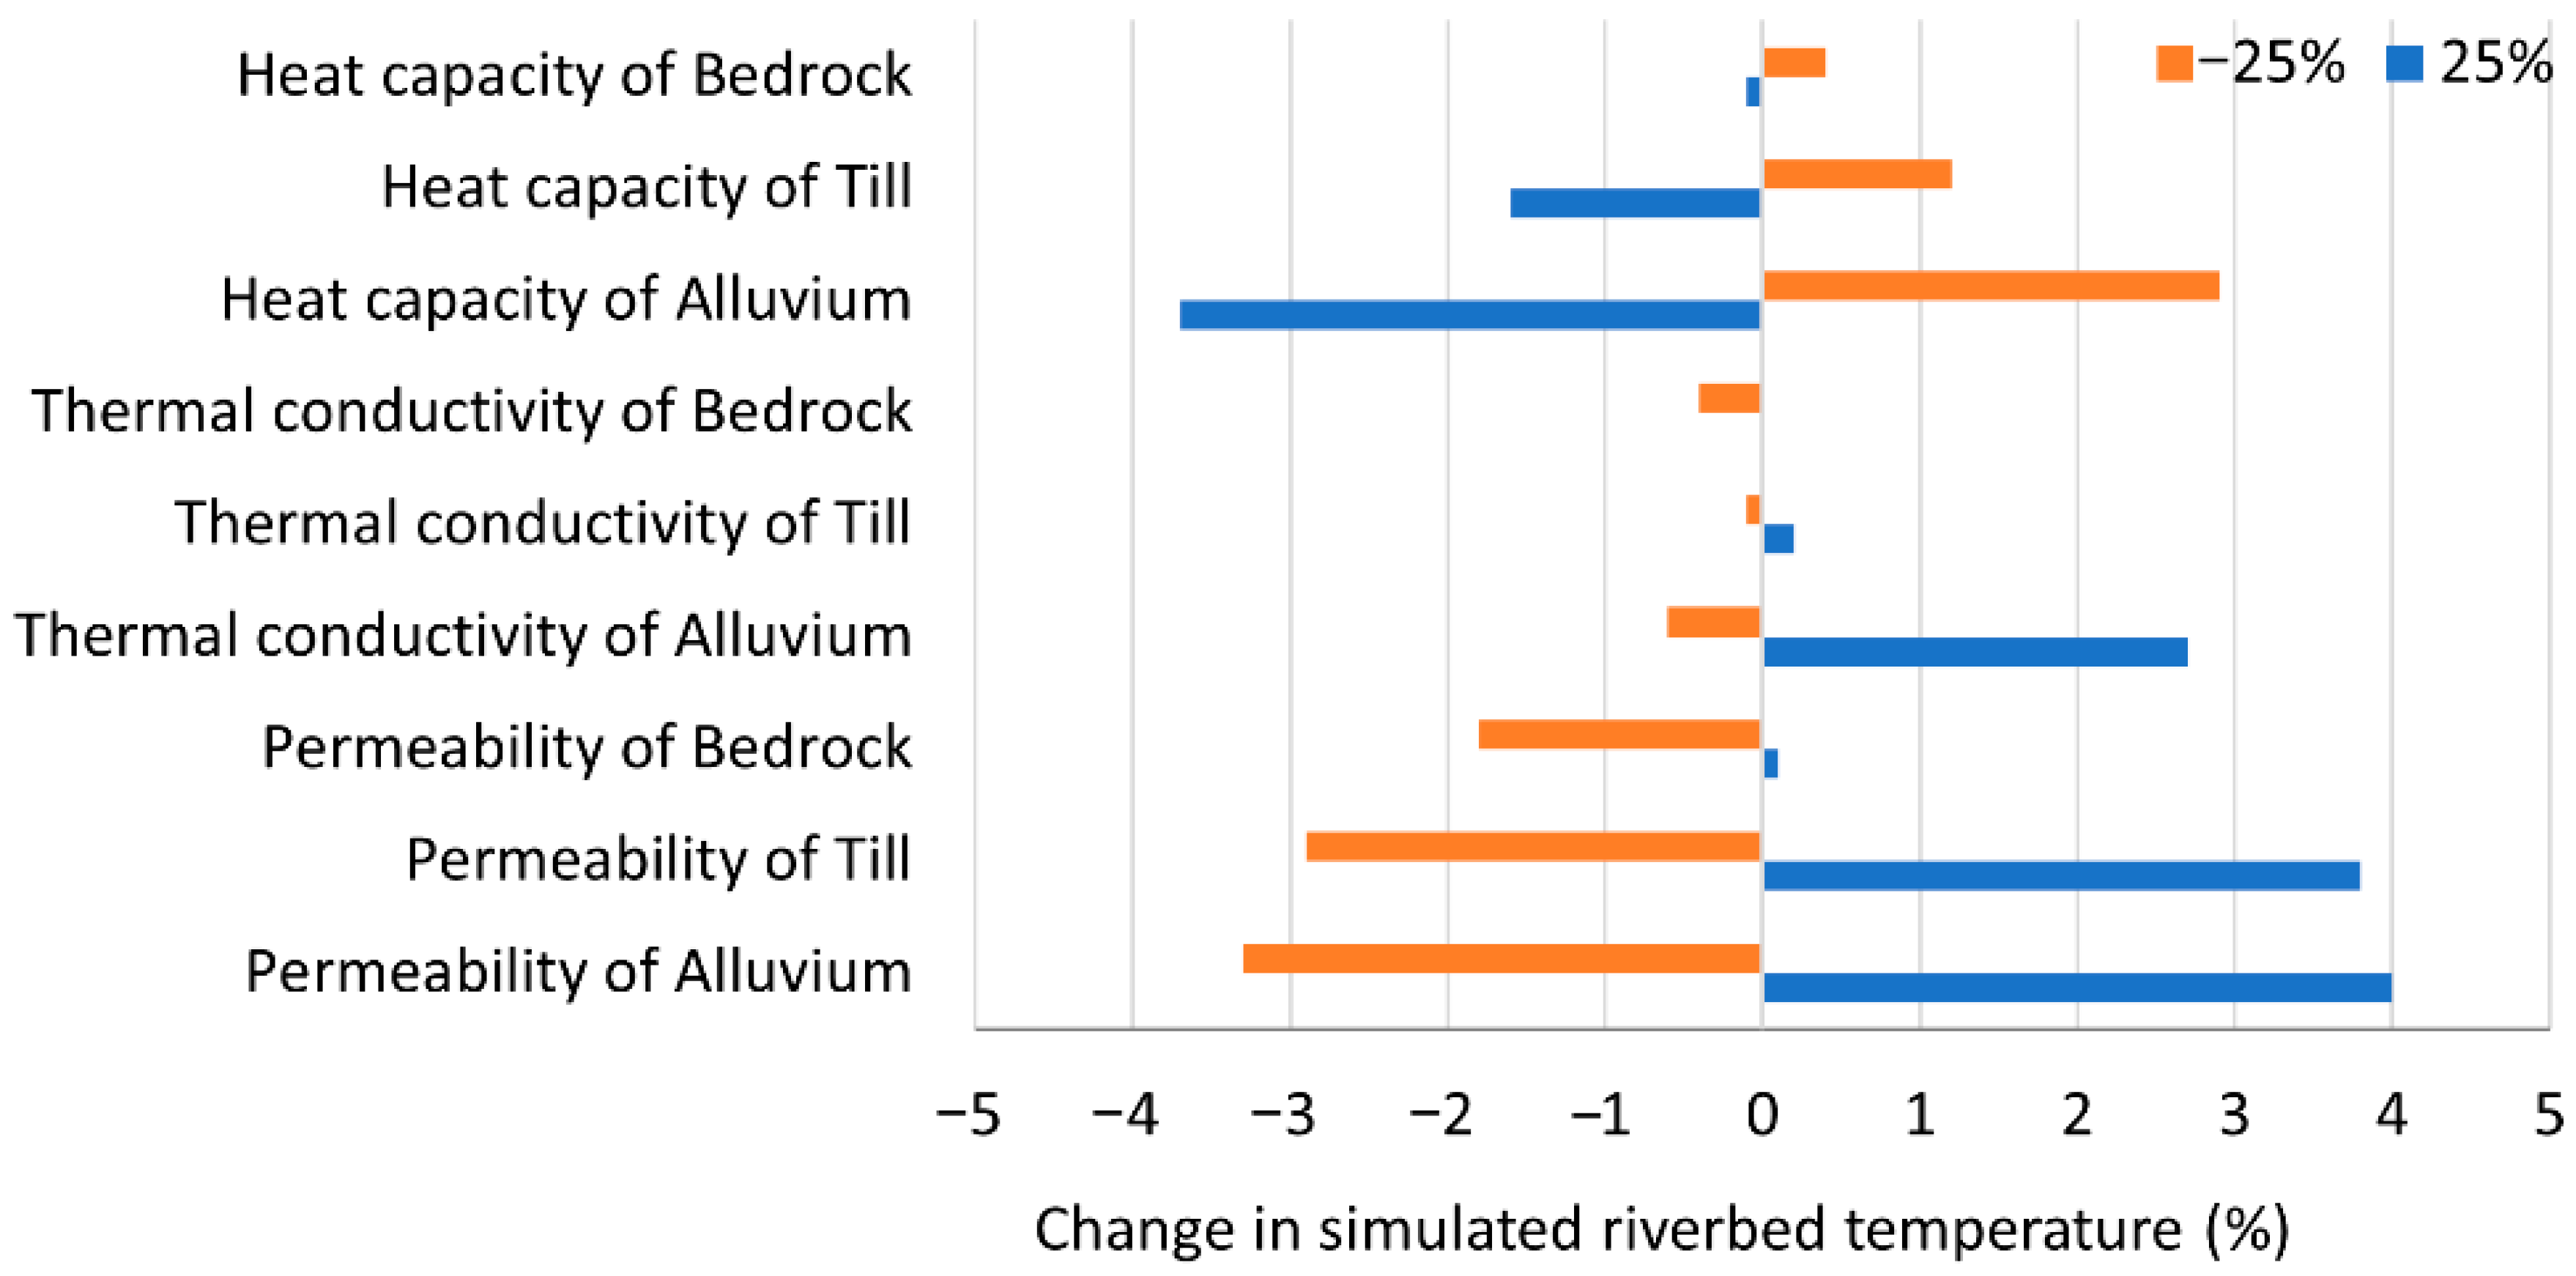
Sensitivity analysis was carried out on input parameters for models of both study sites. At the early stages of the work, different values for the thickness of geological units and hydraulic conductivity from different sources were used in the models. Some parameters, like hydraulic conductivity, were changed by more than one or two orders of magnitude to help select the most representative values and define the models’ properties. At each step of the sensitivity analysis, only one parameter was changed at a time, and the percentage of change in simulated RBT and GWSR was assessed. The results revealed that the models were most sensitive to the hydraulic properties of the alluvial unit. Simulated GWSR was most sensitive to permeability values, specifically, the permeability of the alluvial unit, since it has the highest permeability and controls the interaction between GW flow and the river. GWSR in models with a permafrost unit was also sensitive to the heat capacity of the unit containing the frozen ground. Heat capacity was found to be the factor controlling the timing of permafrost thaw and the increase in GW flow due to a change in the permeability value from the frozen condition to the unfrozen condition. Simulated RBT was sensitive to changes in permeability, heat capacity, and thermal conductivity of geological units, considering this order. While permeability and thermal conductivity had a direct correlation to simulated RBT, heat capacity showed the reverse effect. Figure 6 shows the results of the sensitivity analysis with a ±25% change in each input parameter of the Berard River 2D model as an example.
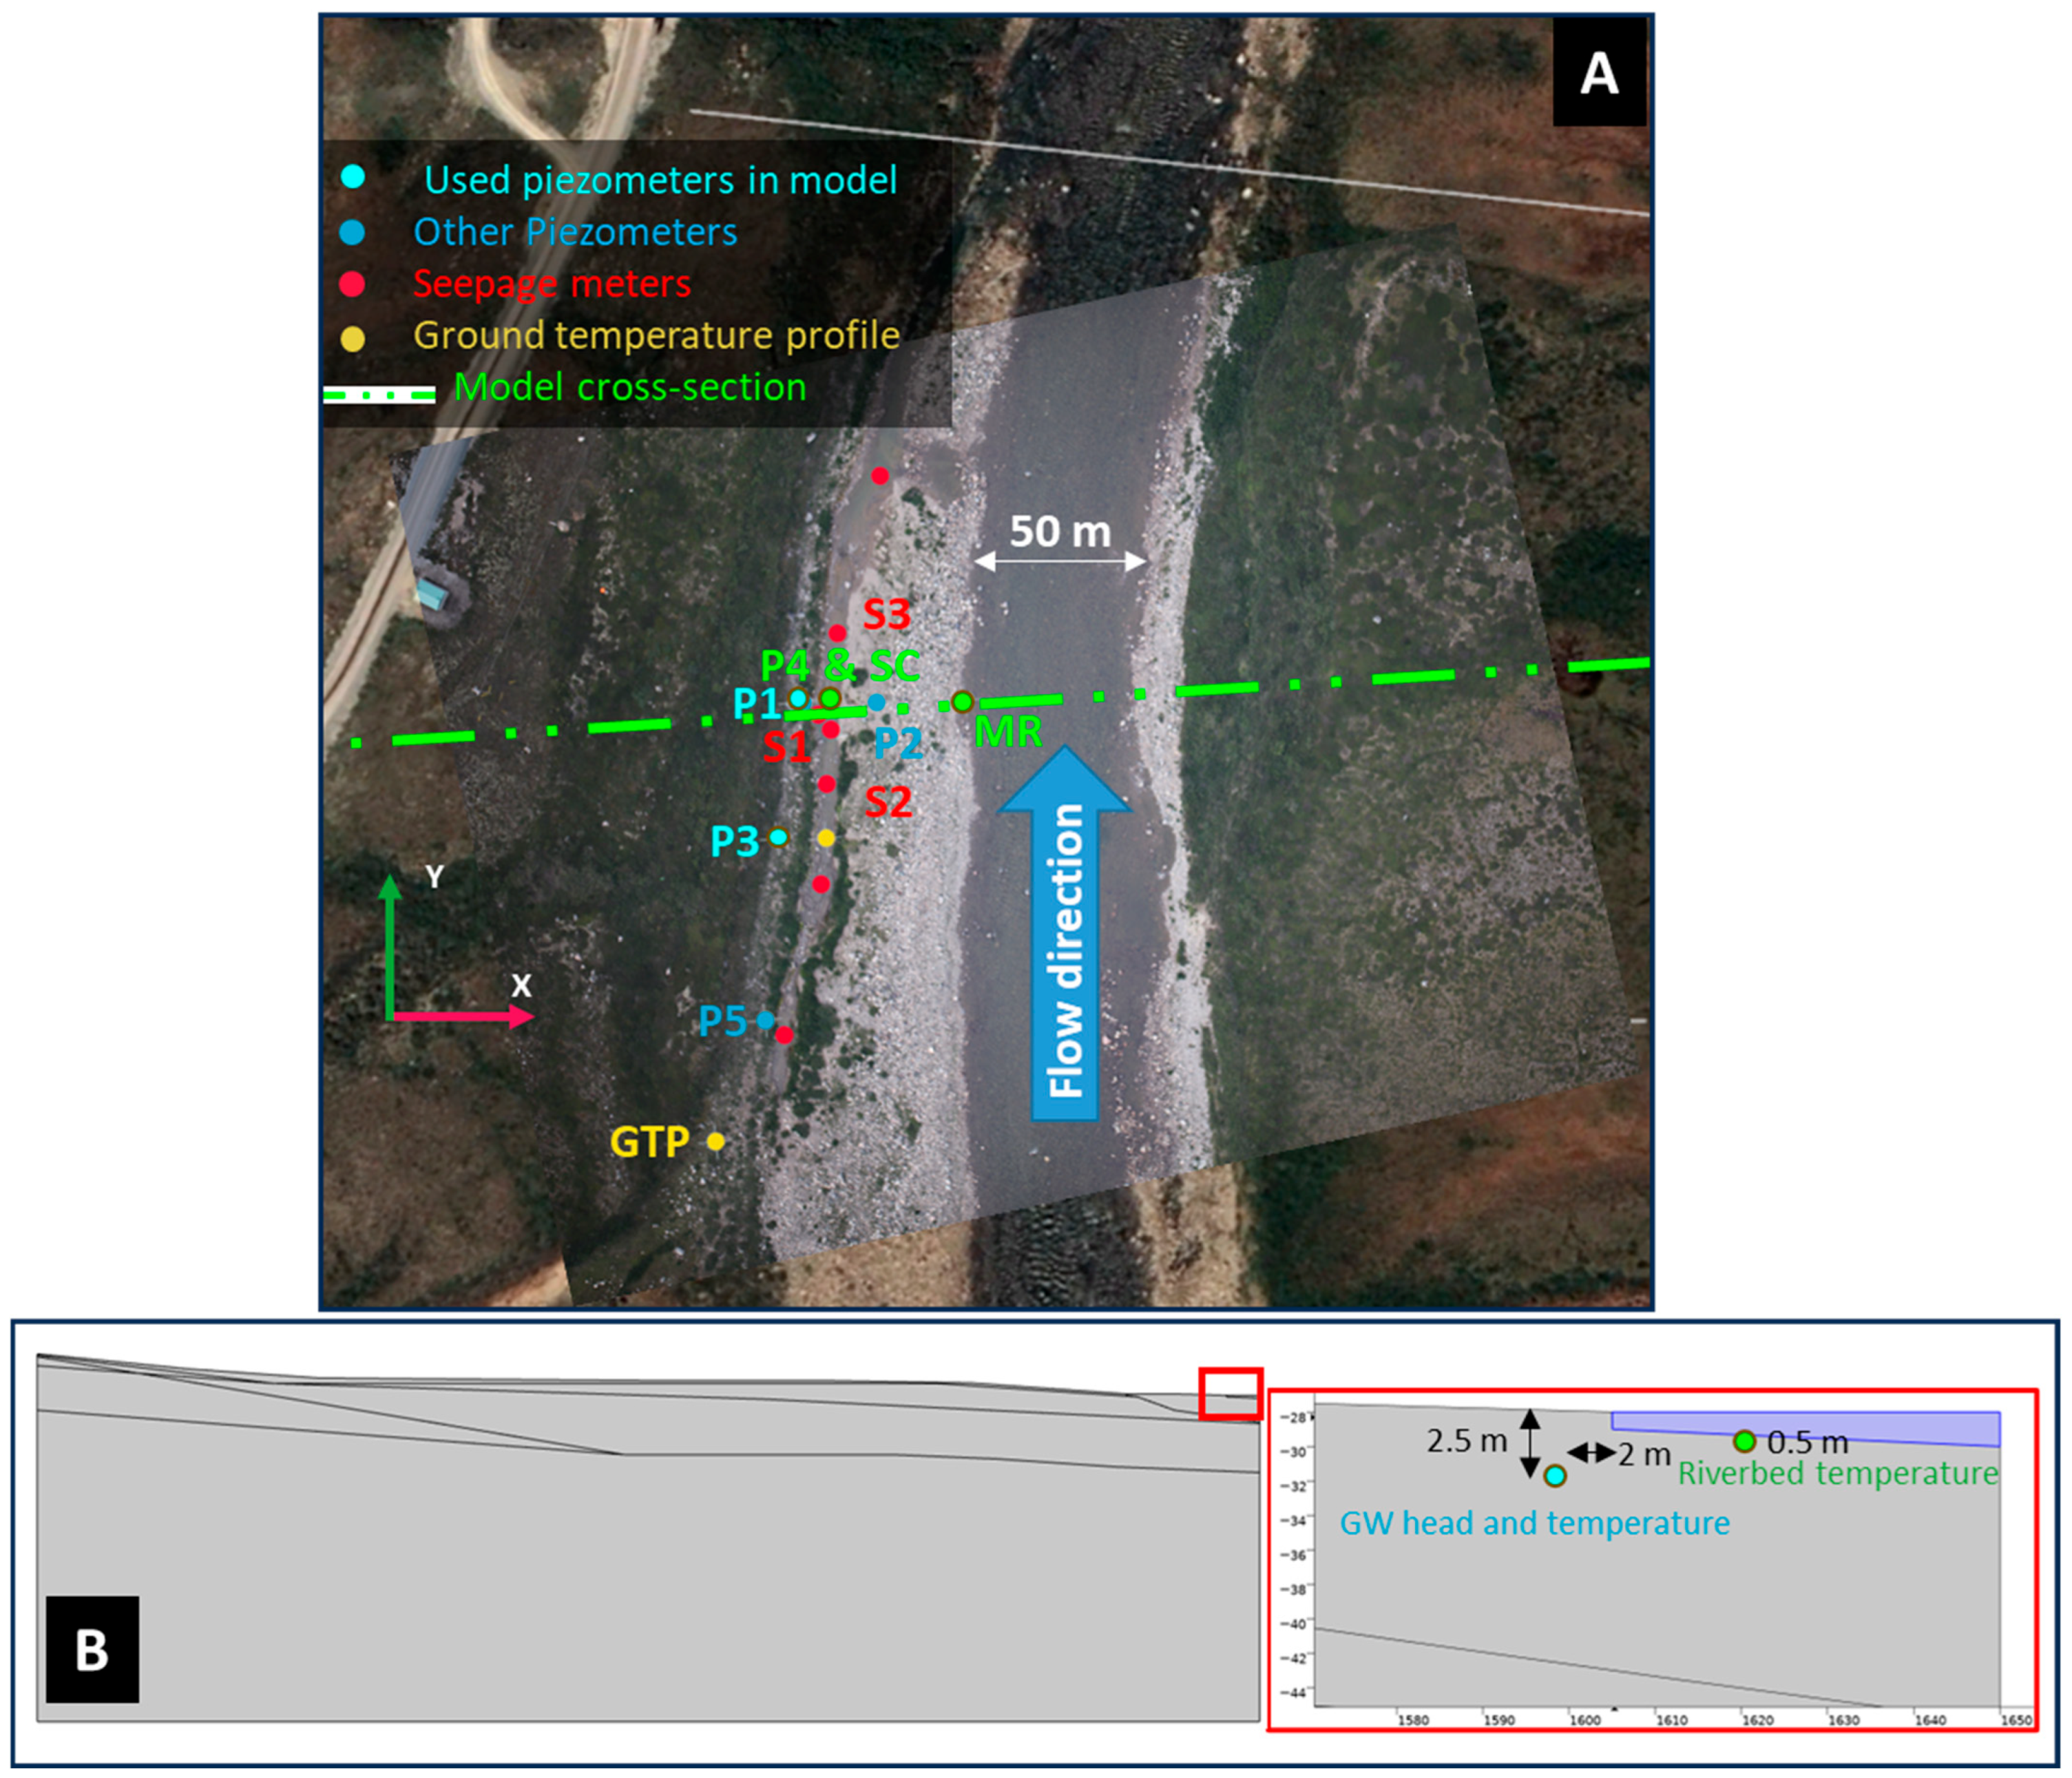
The calibration of hydraulic and thermal properties was carried out manually and one by one, starting from the most sensitive to the least sensitive parameter. The simulated and recorded pressure and temperature of the river were compared to those of GW adjacent to the river using the installed water level loggers and the GWSR measured with seepage meters (see Table A1 in the Appendix A for the calibration results). The average yearly GW head recorded by water level loggers was compared to the simulated head by the model at an early simulation time in 2020 for the same location and depth of investigation by piezometers (Figure A4 and Figure A5 in the Appendix A). The hydraulic conductivity of geological units was specifically calibrated using this comparison. After calibration, the comparison between the observed and simulated GW pressure head showed less than a 15% difference for both models. Another calibration factor was the comparison of GW and river water temperature to the recorded data. This comparison allowed us to calibrate the heat capacity of units. At early simulation time (year 2020), the RBT simulated by the models showed less than a 20% difference compared to the average yearly RBT recorded by shallow temperature sensors at the study sites.

3.2. Long-Term Climate Change Scenarios

Predictions under climate change scenarios were made following the calibration. For the baseline year (2020), the Sainte-Marguerite River (without permafrost) showed an average RBT of 3 °C and a modest GWSR (about 1.3 × 10⁻⁶). In contrast, the Berard River (permafrost site) had a colder RBT (−2.2 °C) and strongly reduced GWSR (about 1.3 × 10⁻⁸). This initial contrast highlights the role of permafrost in restricting GW-SW interactions and provides a reference point for interpreting future climate-driven changes.
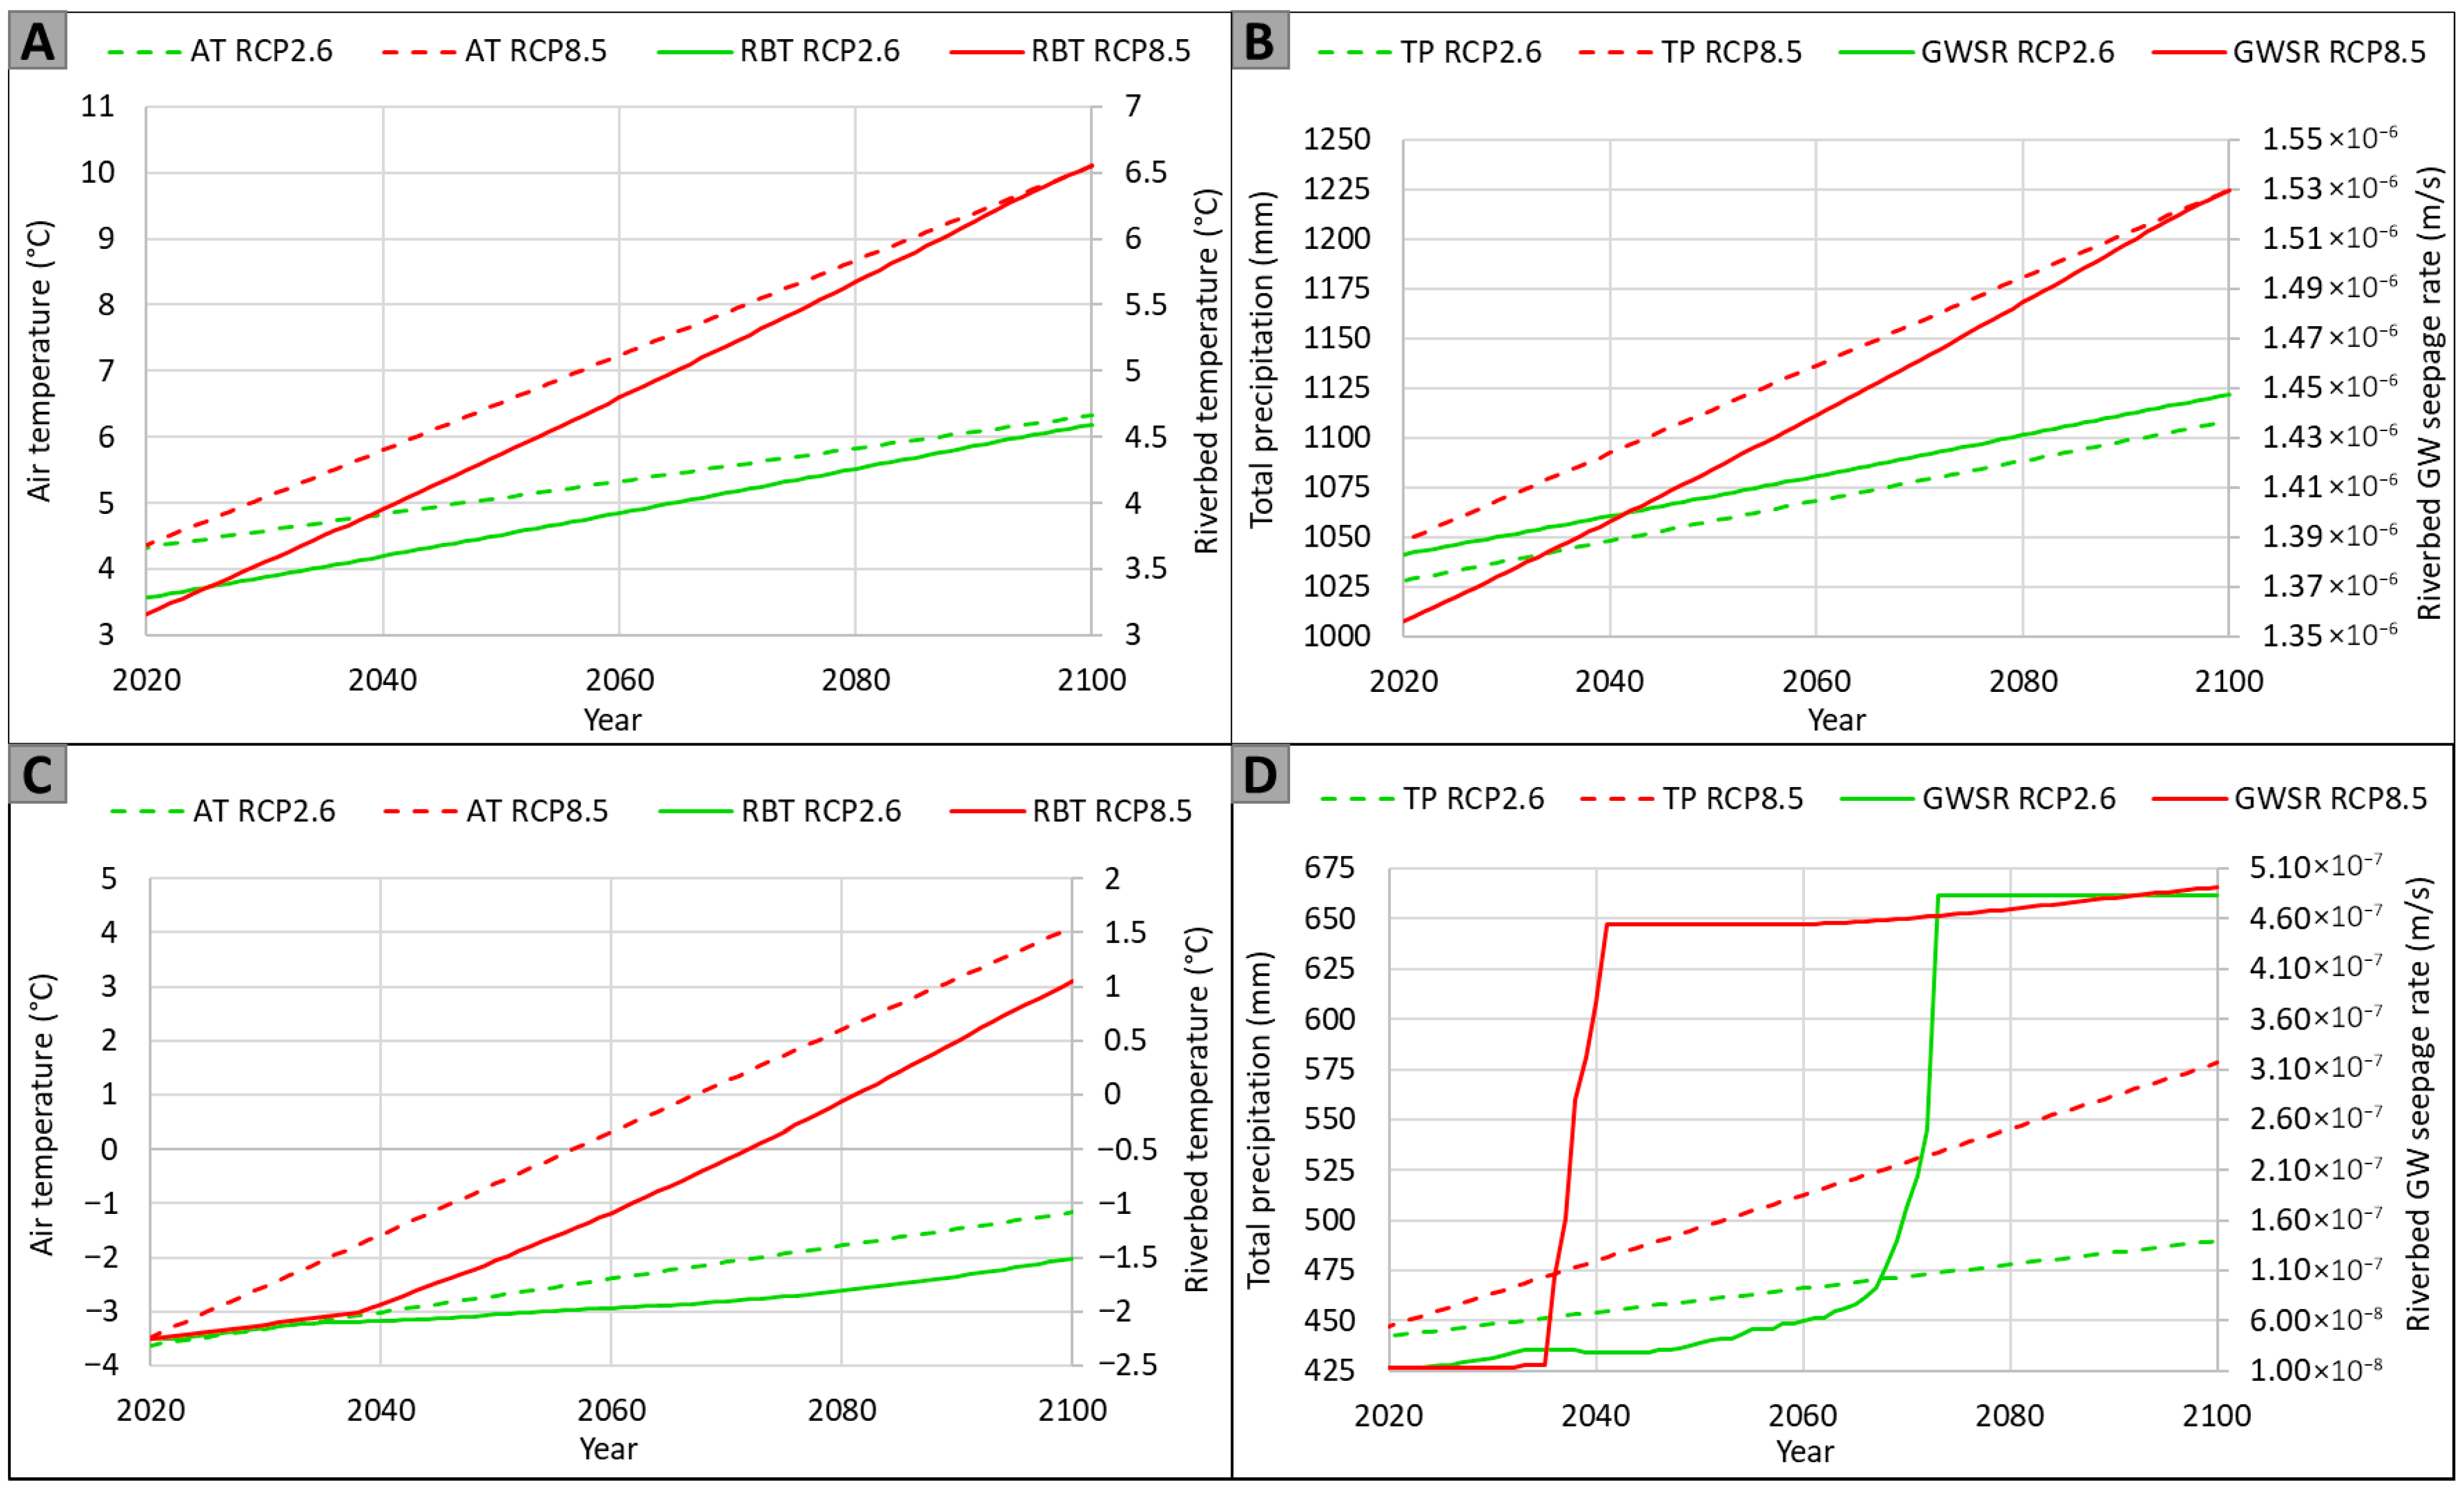
For the Sainte-Marguerite River case study, the GWSR increased by 5%, and the RBT increased by 1.4 °C over the period of 2020 to 2100 under the RCP2.6 scenario. Under the RCP8.5 scenario, the GWSR was 40% and RBT was 3.5 °C higher in 2100 compared to 2020 (Figure 7A,B). However, the simulated GW flowlines do not change significantly over time under the various climate scenarios (Figure A6 in the Appendix A).
Simplified climate change models of the Berard River based on RCP2.6 suggested linear growth of AT and TP from 2020 to 2100 by about 2 °C and 11%, respectively. Under the RCP8.5 scenario, the linear increases in AT and TP were about 4 °C and 29%, respectively. However, according to the 2D models of the Berard River site, the increase in RBT and GWSR did not follow a linear increase pattern. From 2020 to 2100, the RCP2.6 scenario was associated with an increase in RBT and GWSR of 0.7 °C and 3749%, respectively, whereas the RCP8.5 scenario resulted in an increase in RBT and GWSR of 3.2 °C and 3784%, respectively (Figure 7C,D). The simulated GWSR in 2100 for the RCP2.6 and RCP8.5 scenarios was comparable. However, the sudden non-linear increase in GWSR occurred around 2070 for the RCP2.6 scenario and around 2040 for the RCP8.5 scenario.
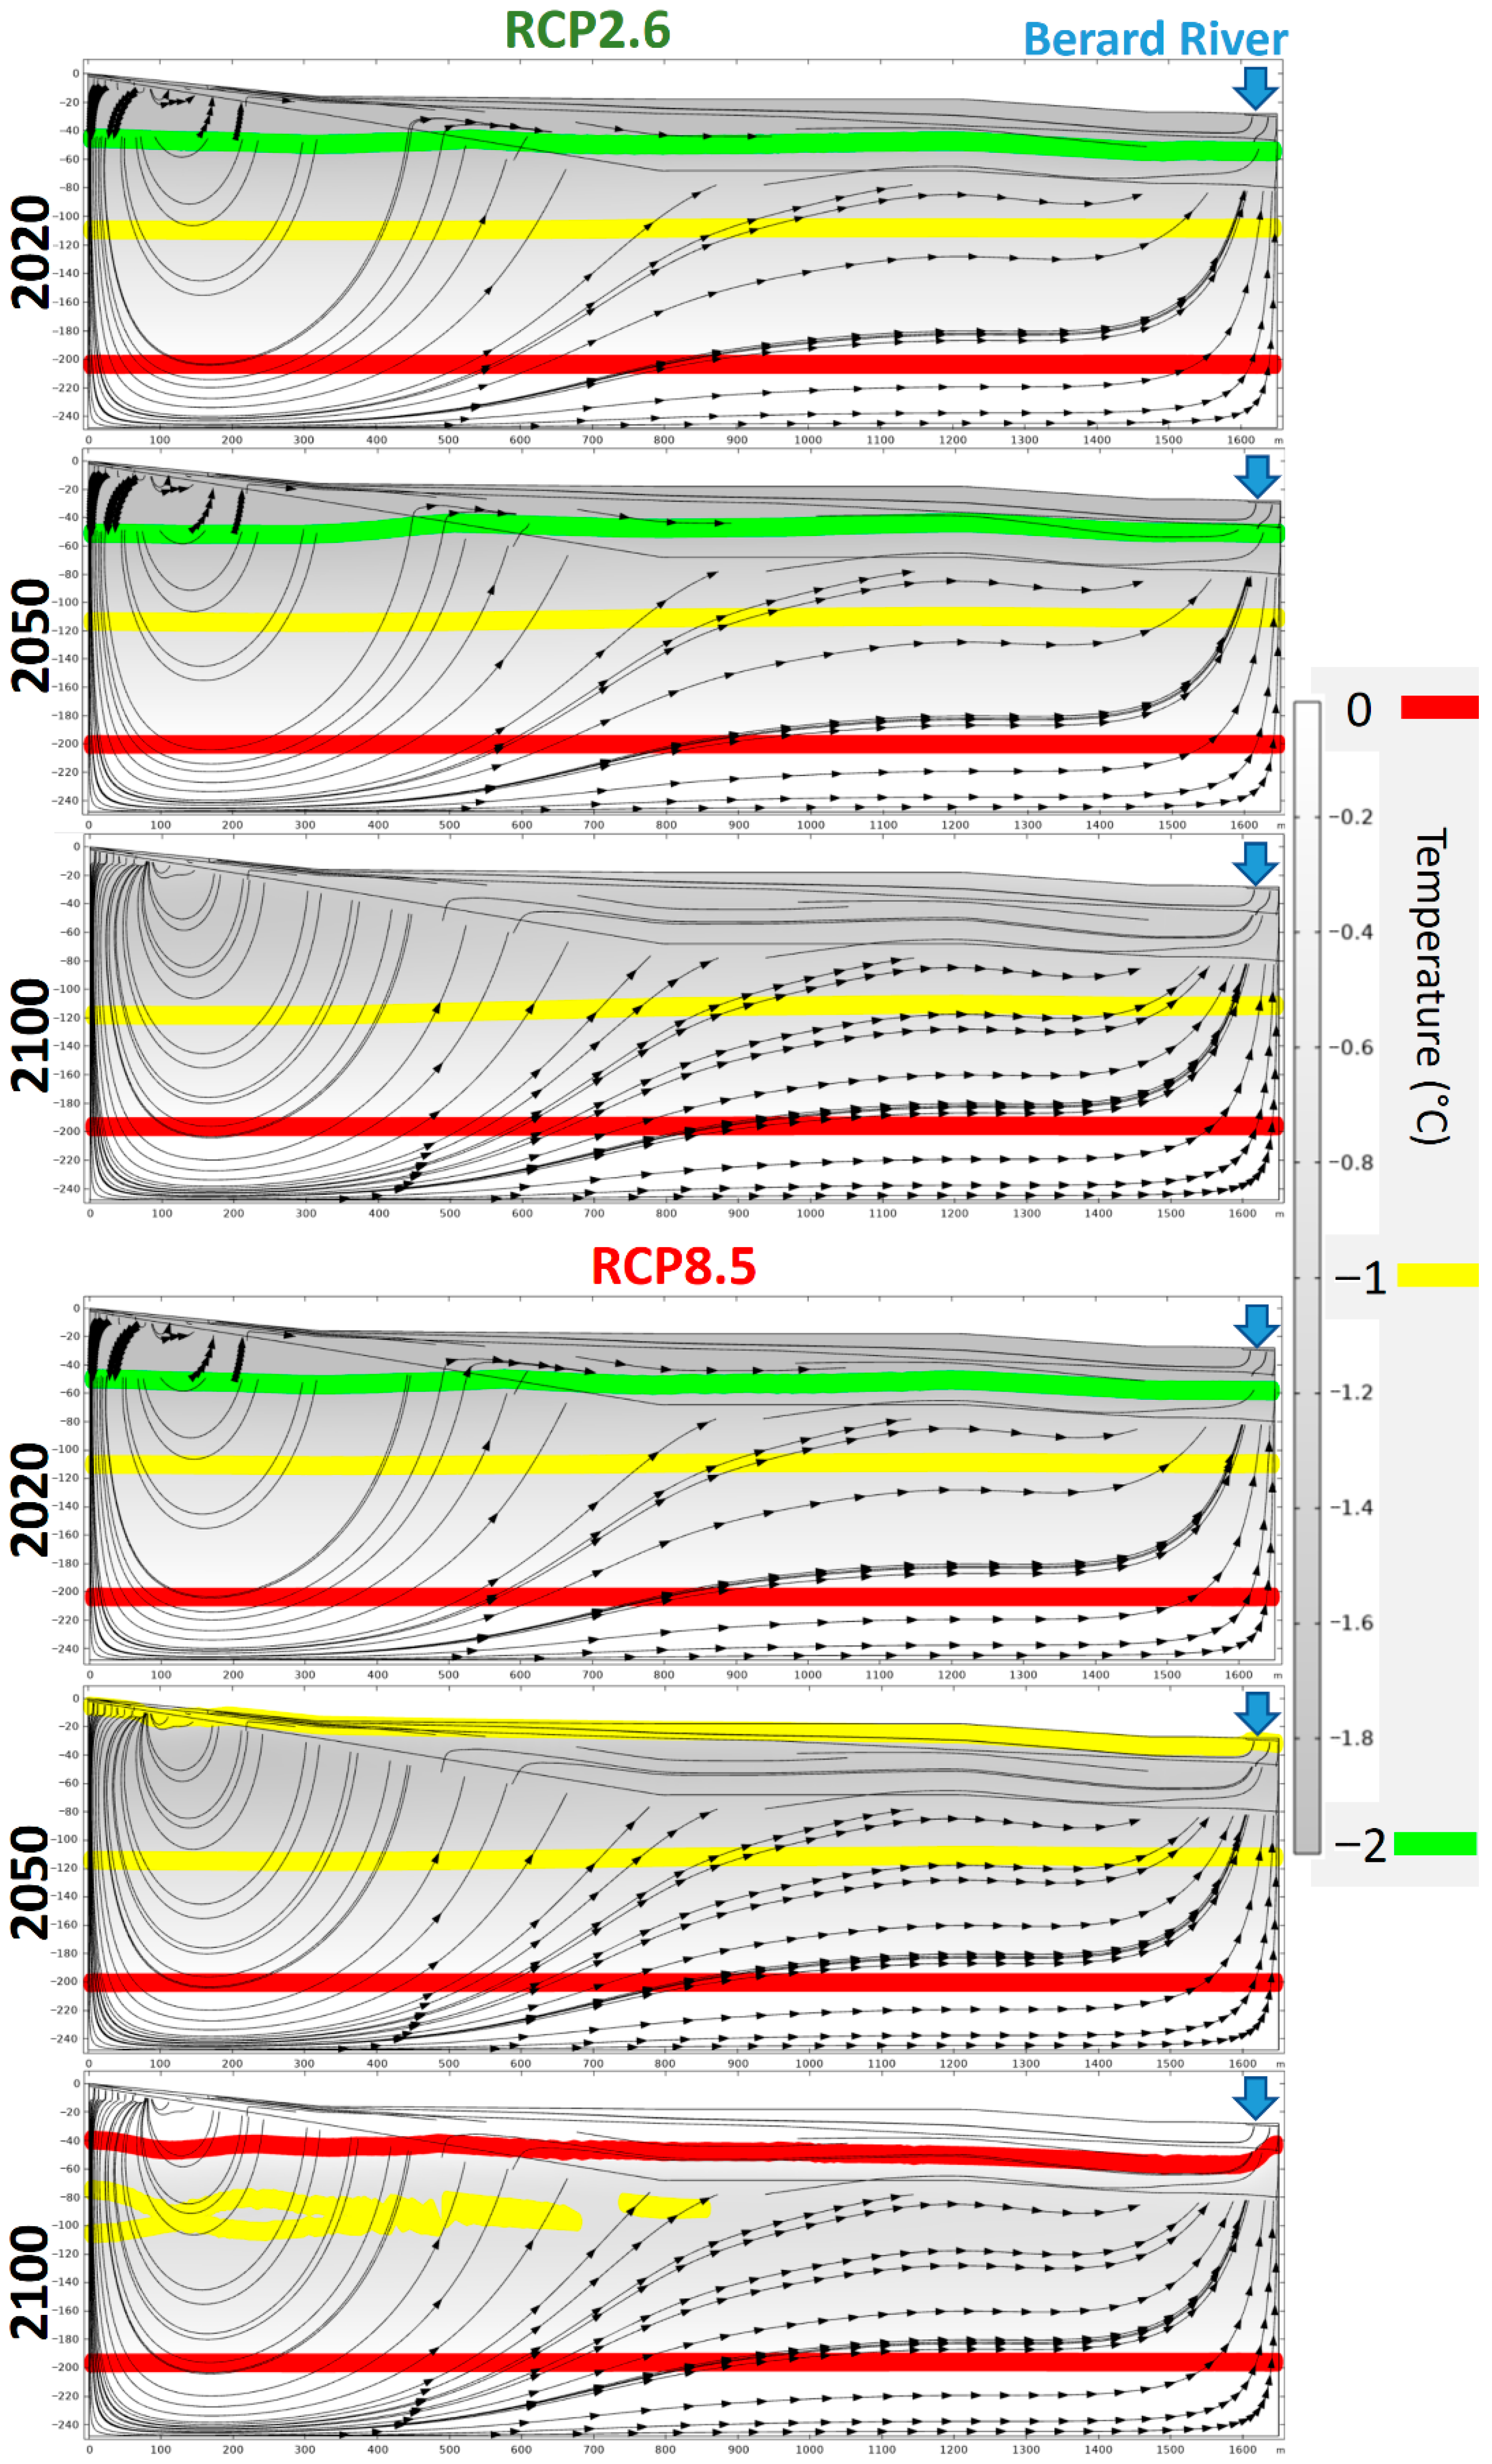
Moreover, models of the Berard River study site showed significant changes in the simulated GW flow system over time according to climate change scenarios (Figure 8). In Figure 8, arrowheads on the calculated GW flow lines show a specific travel time of several years, which are always present at the base of the model where the bedrock unit is located. Dense arrows mean that the GW flow is small, and no arrow means the flow is fast. At the start of the simulations, in 2020, arrows are present at the top of the model in unconsolidated deposits. These arrows remain present in 2050 for the RCP2.6 scenario but not for the high-emission scenario (Figure 8). In Figure 8, the presence of arrows in the top units of the models coincides with the presence of a −2 °C contour line (green line in Figure 8), meaning the low flow in unconsolidated deposits is due to the presence of frozen ground. The earlier increase in GW flow (i.e., disappearance of the green line) in RCP8.5 compared to RCP2.6 can be seen in Figure 8.

4. Discussion

4.1. Limitations and Prospects for Improvement

The 2D models integrate primary processes and are well-constrained by field data focusing on vertical and lateral cross-valley exchanges. The 2D approach provides a good understanding of site-specific GW-SW dynamics that is easily visualized. However, the use of the 2D cross-sectional approach can be considered as a limitation of this study, since it does not resolve large-scale three-dimensional regional GW fluxes or lateral tributary inflows, which may affect temperature predictions in reaches with complex inflow structures. Future work involving 3D simulations with additional data along the river systems could improve predictions, which require more intense data collection.
Only 1–2 years of field measurements were available for calibration. While this short period cannot represent interannual variability, it provides reliable baseline conditions to constrain model input parameters. Long-term dynamics were subsequently introduced through the climate scenarios (RCP2.6 and RCP8.5), which prescribe systematic changes in air temperature and precipitation. This approach, commonly used in hydrothermal modeling studies in remote areas, allows for robust projections despite the limited field monitoring period. Extensive monitoring (5 years) at multiple sites, requiring significant financial resources, which were not available for this study, would be beneficial for improving model calibration, validation, and reliability.
Surface emissivity was considered to be constant over time in this study because the focus was on long-term (decadal) trends, where seasonal effects are averaged. The comparison of the simulated average annual ground temperature to recorded values (for 2019–2021) showed close correlation and justified this simplification. However, the emissivity index of the ground surface varies seasonally at both study sites due to snow accumulation in winter [26]. The emissivity of the river surface also changes between warm and cold seasons as the rivers may be partially or entirely frozen. Thus, the addition of a variable emissivity could improve the results for future work incorporating simulations with half a year or even monthly time steps.
AT was used as a model input, considering the yearly increase based on climate change scenarios. AT was selected as this was sufficient to evaluate changes over years or decades. However, the use of maximum and minimum yearly ATs from climate scenarios with a half-year time step in the models allows for some seasonal representation within the model. This is expected to be more significant in the case of the Berard River due to the presence of permafrost and yearly freeze-and-thaw cycles in the model’s top layer, which is the most permeable with the highest GW flow. However, Evans and Ge [24] showed that under climate change scenarios, changes in deep permanent permafrost have more effects on GW systems compared to seasonal changes in frozen ground near the surface. Thus, the use of yearly time steps without simulating the freezing and thawing near the surface can be justified, and simulating seasonal changes can be a goal for future work.
In this study, the thaw of permafrost and change from continuous permafrost to its complete disappearance happened over a duration of a few years (around 2035 to 2040 for the high-emission scenario and around 2065 to 2070 for the low-emission scenario in Figure 7D). When the thawing of permafrost reaches a stage where the continuity of permafrost is interrupted, the GW flow system becomes connected to the river. Until permafrost has not completely disappeared, GW flow around partially frozen ground can be cooled. Thus, increased GW seepage with low temperature can have a higher impact on the river’s thermal budget during this period. For future work, the use of adaptive and smaller time steps is suggested for this period to better pinpoint permafrost thaw and understand its detailed effects on the river’s thermal budget.
The projections presented are deterministic outcomes based on a single calibrated model. The primary sources of uncertainty include the simplified climate forcing (linear trends), model parameters, and 2D model structure. The results should be interpreted as an illustration of the system’s potential sensitivity and trajectory rather than a precise forecast.

4.2. Impacts of Climate Change

The baseline comparison between permafrost and non-permafrost rivers underscores the distinct initial conditions: limited seepage and colder riverbeds in the permafrost setting (Berard River) versus warmer and more connected systems without permafrost (Sainte-Marguerite River). These initial differences explain the divergent response between the non-permafrost and permafrost-affected systems under the same emission scenarios. The simulations for the Sainte-Marguerite River resulted in an increase in the RBT and GWSR following a linear growth pattern similar to the applied AT and TP increases. However, the increase in RBT and GWSR from 2020 to 2100 was not linear for the Berard River. The non-linearity in GWSR is a direct result of the step change in hydraulic conductivity as permafrost thaws (Table 1). In contrast, RBT responds more linearly to increasing air temperature because heat transfer is governed by both conduction and advection, and the warming signal is strong and continuous, even if the advective component (GWSR) increases abruptly.
The jump in the GWSR graph for the Berard River (Figure 7D) and the change in the slope of the RBT graph (Figure 7C) occur at the same time when the ground is no longer expected to be frozen (no ground with a temperature below −2 °C). According to the high-emission climate scenario (RCP8.5), the degradation of permafrost starts in 2033, and after 2041, there is no more frozen ground in the system. Under the low-emission climate scenario (RCP2.6), the degradation of permafrost starts around 2064, and the frozen layer is expected to thaw by 2074. The simulated rate of permafrost thaw is in accordance with global permafrost thaw models, and the complete disappearance of ice-rich and frozen ground by 2100 has been predicted for other regions in the world [51,52,53,54]. The simulated GWSR with the high-emission scenario (RCP8.5) is almost constant from 2020 to 2035. This is followed by a quick rise in the GWSR, which occurs in 2035 when the GWSR becomes more noticeable. In the low-emission scenario (RCP2.6), the GWSR increases almost linearly from 2020 to 2066, and a sudden increase occurs in 2066. In both the RCP2.6 and RCP8.5 scenarios, the simulated −1 °C contour line moved about 6 m down toward the base of the model, and the 0 °C contour line moved 6 m up toward the surface from 2020 to 2050 (Figure 8). The thermal state between these two contour lines can be considered as an indicator of permafrost, where partially frozen ground and ice patches can be present in the ground. Simulated changes indicate that permafrost thaw occurs both from the top and the base. The simulated thaw rate from the top and the base of around 10 cm/yr is at the upper boundary of the thaw rate range estimated by Buteau et al. [55] with a 1D heat conduction model. The inclusion of GW flow in the models of this study appears to be the reason for a higher thaw rate when compared to the results obtained with a 1D heat conduction model. Allard et al. [25] simulated the complete thaw of permafrost from the first 12 m of the ground near Berard River between 2022 and 2030 (depending on the location) based on RCP8.5. In Allard et al. [25], the thaw of permafrost at locations further away from the river that are located completely in bedrock occurs faster than those near the river in unconsolidated sedimentary materials [25]. In contrast, this study found a higher thaw rate near the river. The seasonal variation in permafrost due to climate change scenarios is simulated using 1D conceptual heat exchange and energy balance models of ground containing permafrost in Allard et al. [25], while the GW flow and convective heat transfer were not considered. In previous 1D models, the timing of thaw at different locations depends on the thermal conductivity of materials, which is higher for the bedrock compared to unconsolidated sedimentary materials. The inclusion of GW flow in 2D models means an increased GW flow near the river, which can accelerate the thaw rate. This could be a possible reason for the different thaw rate in this study compared to previous 1D models.
This work shows that permafrost thaw is expected in the next century around the Berard River, which would increase GW flow toward the river. This is projected to result in higher river flow during low-precipitation seasons due to an increase in base flow through the connection of deeper GW flow pathways to the river in the absence of permafrost [56]. This increase in the GW flow rate may have an impact on riverbed morphology and affect fish habitats and spawning sites within the river. An increase in GW seepage is expected to change the vertical temperature profile of the river as the GW temperature is lower than the river water temperature. The location of known thermal refuges in the river may change, and they are expected to become more abundant due to increased GW seepage. The use of thermal refuges and cooling zones produced by GW seepage during extreme events in summer has been documented before (e.g., [18,57]). A higher number of thermal refuges and an increased temperature gradient can be beneficial for the survival of the fish during extreme atmospheric events. Zones with GW seepage may become the only places where fish can survive in the future, since the average river water temperature can increase due to anticipated higher ATs in the future, based on climate scenarios [58,59]. Plans for a controlled flow and temperature during salmon spawning seasons, which were designed in previous decades on the basis of hydrological and SW studies, may no longer be as effective as they are today (e.g., [60]). Consequently, studies that include GW models under climate change scenarios are essential to provide guidelines to update management plans.
Although this study focused on two rivers in Quebec, the projected changes are consistent with larger-scale modeling studies that anticipate widespread permafrost degradation and increased GW-SW connectivity across the circumpolar north (e.g., [23,51]). Many high-latitude rivers underlain by permafrost are expected to experience similar non-linear increases in GW discharge as thawing progresses, fundamentally altering base flow regimes. Therefore, the site-specific simulations provide insights that are applicable to broader Arctic/subarctic river systems facing climate warming.

5. Conclusions

This study demonstrates that climate-induced permafrost thaw substantially alters groundwater–surface water interactions in northern environments. The results of site-specific hydrothermal modeling of two Quebec rivers—one in a permafrost-free zone and the other in a permafrost region—reveal a non-linear increase in groundwater discharge where frozen ground degrades. In the Berard River, groundwater seepage is projected to rise more than thirtyfold by 2100, coinciding with the complete disappearance of permafrost under high-emission scenarios. In contrast, the Sainte-Marguerite River, unaffected by permafrost, exhibits modest and linear increases in the simulated groundwater seepage to the river and the riverbed temperature.
The inclusion of advective heat transfer in the modeling framework proved essential for capturing the timing and magnitude of permafrost thaw, highlighting the limitations of conduction-only approaches. These findings underscore the importance of integrating groundwater flow and thermal dynamics in climate impact assessments, particularly in regions undergoing rapid cryospheric changes.
As groundwater becomes a dominant driver of river thermal regimes, its role in sustaining cold-water fish habitats will intensify. Management strategies must evolve to reflect this shift, prioritizing the identification and preservation of groundwater-fed thermal refuges. Future research should expand groundwater-related studies and monitoring efforts over several years and incorporate seasonal and spatial variability to refine predictions and support adaptive conservation planning across northern river systems.

Author Contributions

Conceptualization, M.F.; methodology, M.F.; formal analysis, M.F.; data curation, M.F.; writing—original draft preparation, M.F.; writing—review and editing, M.F., J.R. and R.M.; visualization, M.F. All authors have read and agreed to the published version of the manuscript.

Funding

This project was funded by Environment and Climate Change Canada’s Environmental Damages Fund (EDF-PQ-2017 J002). The authors also would like to acknowledge the financial support from the CREATE-TEDGIEER program, National Sciences and Engineering Research Council of Canada (NSERC), Grant number 498017-2017.

Data Availability Statement

The data are not publicly available since parts of the data were obtained from indigenous communities’ categories 1 and 2 lands of northern Quebec but are available from the corresponding author with the permission of the Northern Village Office and Landholding of Tasiujaq.

Conflicts of Interest

The authors declare no conflicts of interest.

Appendix A

Appendix A.1. Additional Equations

The inward heat flux for the top of 2D heat transfer models is calculated using the following equation:
Q n e t t = σ ε ( T a m b 4 T s 4 )
where Q n e t t   (M·L2·t−3) is the energy input over time, σ is the Stefan–Boltzmann constant (5.67 × 10⁻⁸ W·m−1·K−1), ε is the surface emissivity (−), T a m b (T) is the ambient temperature, and T s (T) is the surface temperature.

Appendix A.2. Additional Data

Table A1. Calibration results: the parameters represent average yearly values of the year 2020.
Case StudyParameterMeasuredSimulatedDifference (%)
Sainte-Marguerite RiverGround temperature (°C)5.24.9−4
GW head (MASL)113.6116.73
Riverbed temperature (°C)4.94.3−13
Riverbed seepage rate (m3/s)5.9 × 10−75.0 × 10−7−14
Berard RiverGround temperature (°C)1.11.0−11
GW head (MASL)15.413.2−14
Riverbed temperature (°C)−3.5−4.419
Riverbed seepage rate (m3/s)6.4 × 10−85.5 × 10−8−13
Note: Average values from multiple field measurement points located near the modeling cross-section were compared to a single point within the cross-section that best represented the field measurements. Please refer to Figure A4 and Figure A5 to see the field measurement and calibration points.
Table A2. Measurements of the hydraulic head and water temperature with level-loggers at the Sainte-Marguerite River study site.
LoggerP1P2P3P4R1R2
Average yearly hydraulic head (MASL)113.54113.66113.57113.38113.21113.22
Average yearly water temperature (°C)3.954.223.6410.317.5810.46
Table A3. Measurements of the hydraulic head and water temperature with level-loggers at the Berard River study site.
LoggerP1P2P3P4P5Side Channel (SC)Main River (MR)
Average yearly hydraulic head (MASL)15.1415.1915.3215.2214.8714.9715.17
Average yearly water temperature (°C)1.637.340.808.373.697.524.75
Table A4. Measurements of the riverbed seepage rate with installed seepage meters at the Sainte-Marguerite River study site.
Seepage MeterRiverbed Seepage Rate (m3/s)
S13.62 × 10−7
S23.59 × 10−7
S35.65 × 10−7
S43.97 × 10−7
S53.64 × 10−7
S68.52 × 10−7
S71.12 × 10−6
S87.55 × 10−7
Table A5. Measurements of the riverbed seepage rate with installed seepage meters at the Berard River study site.
Seepage MeterRiverbed Seepage Rate (m3/s)
S13.99 × 10−7
S24.77× 10−8
S31.06 × 10−7
OthersInconclusive results
Table A6. Measurements of the ground temperature at different depths with installed temperature sensors in the ground at the Sainte-Marguerite River study site.
Depth Below Ground Surface (cm)Average Yearly Ground Temperature (°C)
06.55
246.40
635.81
875.46
1315.03
Table A7. Measurements of the ground temperature at different depths with installed temperature sensors in the ground at the Berard River study site.
Depth Below Ground Surface (cm)Average Yearly Ground Temperature (°C)
90.79
250.84
450.80
720.80
1000.78
1290.76
1570.72

Appendix A.3. Additional Figures
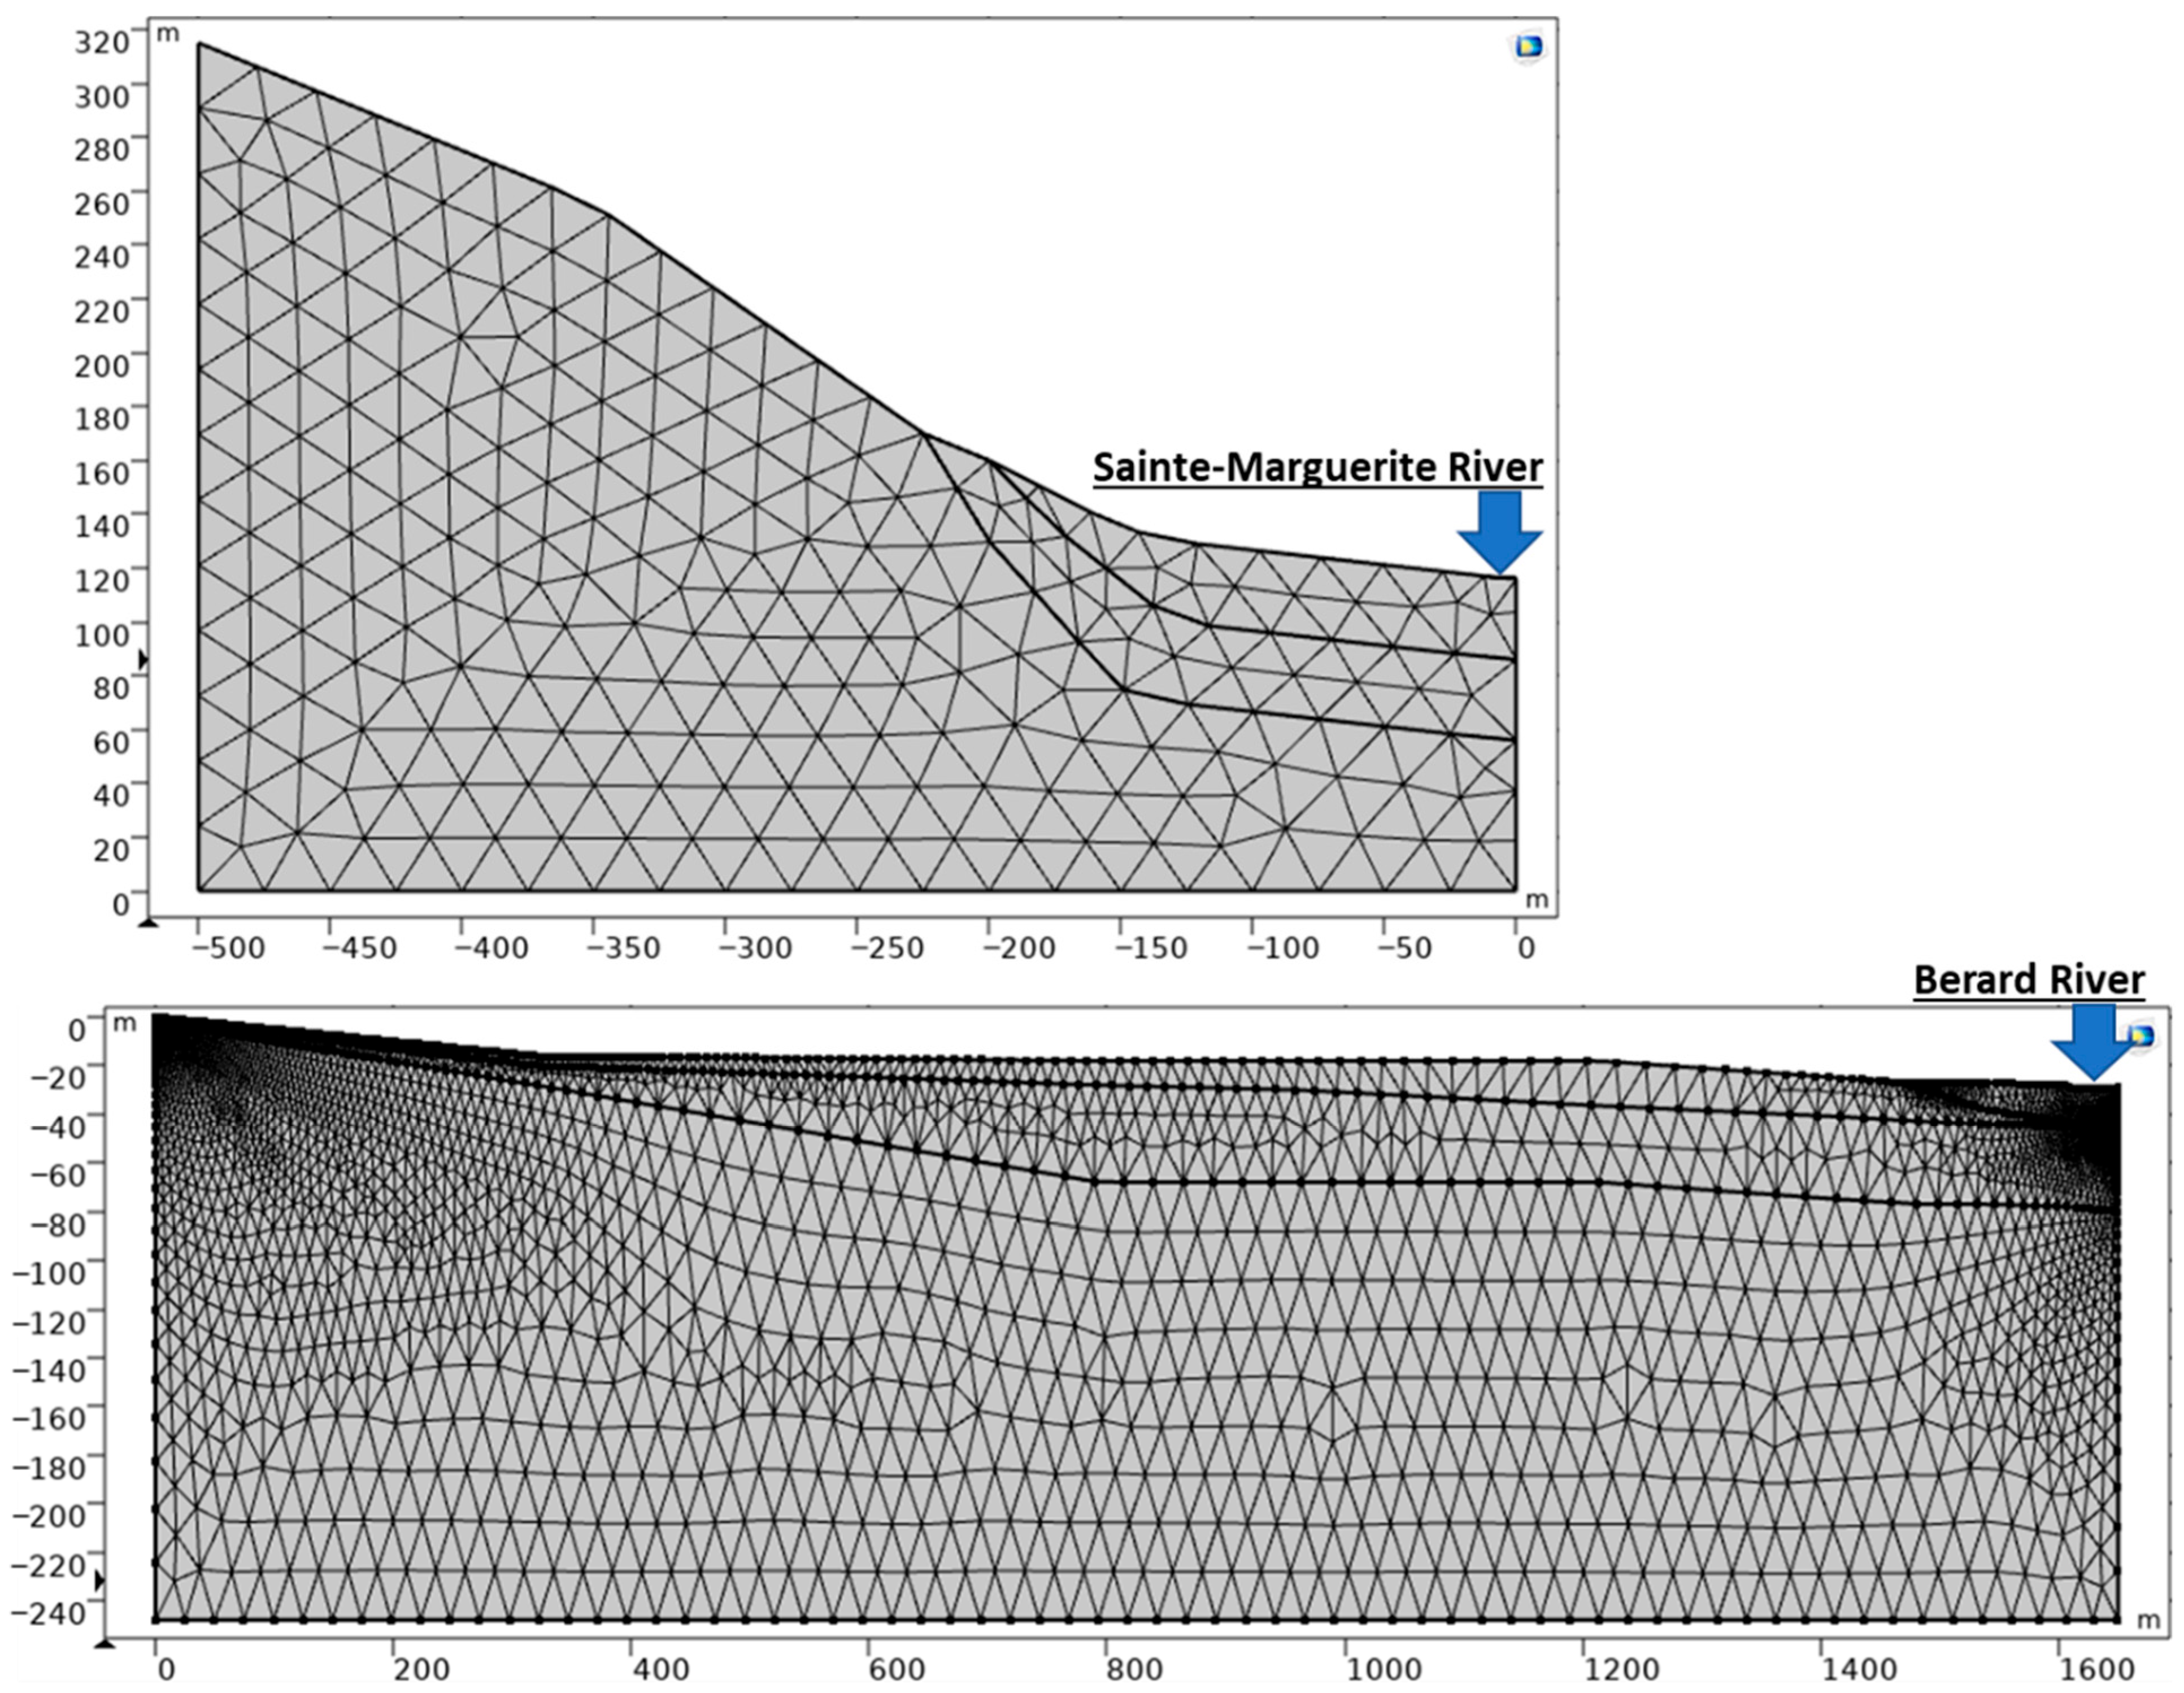
Figure A1. Detailed maps of the study site on the Sainte-Marguerite River in relation to important land features (A) and a more zoomed in view showing modeling cross-section (B).
Geosciences 15 00370 g0a1
Figure A2. Detailed maps of the study site on the Berard River in relation to important land features (A) and a more zoomed in view showing modeling cross-section (B).
Geosciences 15 00370 g0a2
Figure A3. Schematic cross-section view of the river showing the location of the installed instruments.
Geosciences 15 00370 g0a3
Figure A4. Location of field measurement points (A) and calibration points (B) of the Sainte-Marguerite River study site.
Geosciences 15 00370 g0a4
Figure A5. Location of field measurement points (A) and calibration points (B) of the Berard River study site.
Geosciences 15 00370 g0a5
Figure A6. Introduction of the ω factor describing the phase change.
Geosciences 15 00370 g0a6
Figure A7. Mesh of 2D models of the two study sites.
Geosciences 15 00370 g0a7
Figure A8. Simulated GW flow system of the Sainte-Marguerite study site.
Geosciences 15 00370 g0a8

References

  1. Brunke, M.; Gonser, T. The ecological significance of exchange processes between rivers and groundwater. Freshw. Biol. 1997, 37, 1–33. [Google Scholar] [CrossRef]
  2. Hayashi, M.; Rosenberry, D.O. Effects of ground water exchange on the hydrology and ecology of surface water. Ground Water 2002, 40, 309–316. [Google Scholar] [CrossRef] [PubMed]
  3. Spanoudaki, K.; Stamou, A.I.; Nanou-Giannarou, A. Development and verification of a 3-D integrated surface water-groundwater model. J. Hydrol. 2009, 375, 410–427. [Google Scholar] [CrossRef]
  4. Hancock, P.J. Human impacts on the stream-groundwater exchange zone. Environ. Manag. 2002, 29, 763–781. [Google Scholar] [CrossRef] [PubMed]
  5. Saha, G.C.; Li, J.; Thring, R.W.; Hirshfield, F.; Paul, S.S. Temporal dynamics of groundwater-surface water interaction under the effects of climate change: A case study in the Kiskatinaw River Watershed, Canada. J. Hydrol. 2017, 551, 440–452. [Google Scholar] [CrossRef]
  6. Havril, T.; Tóth, Á.; Molson, J.W.; Galsa, A.; Mádl-Szőnyi, J. Impacts of predicted climate change on groundwater flow systems: Can wetlands disappear due to recharge reduction? J. Hydrol. 2018, 563, 1169–1180. [Google Scholar] [CrossRef]
  7. Rossetto, R.; Barbagli, A.; De Filippis, G.; Marchina, C.; Vienken, T.; Mazzanti, G. Importance of the induced recharge term in riverbank filtration: Hydrodynamics, hydrochemical, and numerical modelling investigations. Hydrology 2020, 7, 96. [Google Scholar] [CrossRef]
  8. Lamontagne, S.; Leaney, F.W.; Herczeg, A.L. Groundwater-surface water interactions in a large semi-arid floodplain: Implications for salinity management. Hydrol. Process. 2005, 19, 3063–3080. [Google Scholar] [CrossRef]
  9. Hassan, S.M.T.; Lubczynski, M.W.; Niswonger, R.G.; Su, Z. Surface-groundwater interactions in hard rocks in Sardon Catchment of western Spain: An integrated modeling approach. J. Hydrol. 2014, 517, 390–410. [Google Scholar] [CrossRef]
  10. Tian, Y.; Zheng, Y.; Wu, B.; Wu, X.; Liu, J.; Zheng, C. Modeling surface water-groundwater interaction in arid and semi-arid regions with intensive agriculture. Environ. Model. Softw. 2015, 63, 170–184. [Google Scholar] [CrossRef]
  11. Floriancic, M.G.; Abhervé, R.; Bouchez, C.; Jimenez-Martinez, J.; Roques, C. Evidence of Groundwater Seepage and Mixing at the Vicinity of a Knickpoint in a Mountain Stream. Geophys. Res. Lett. 2024, 51, e2024GL111325. [Google Scholar] [CrossRef]
  12. Poesch, M.S.; Chavarie, L.; Chu, C.; Pandit, S.N.; Tonn, W. Climate Change Impacts on Freshwater Fishes: A Canadian Perspective. Fisheries 2016, 41, 385–391. [Google Scholar] [CrossRef]
  13. Jensen, A.J.; Johnsen, B.O.; Saksgard, L. Temperature requirements in Atlantic salmon (Salmo salar), brown trout (Salmon trutta), and Arctic char (Salvelinus alpinus) from hatching to initial feeding compared with geographic distribution. Can. J. Fish. Aquat. Sci. 1989, 46, 786–789. [Google Scholar] [CrossRef]
  14. Finstad, A.G.; Jonsson, B. Effect of incubation temperature on growth performance in Atlantic salmon. Mar. Ecol. Prog. Ser. 2012, 454, 75–82. [Google Scholar] [CrossRef]
  15. Nyanti, L.; Soo, C.L.; Ahmad-Tarmizi, N.N.; Abu-Rashid, N.N.K.; Ling, T.Y.; Sim, S.F.; Grinang, J.; Ganyai, T.; Lee, K.S.P. Effects of water temperature, dissolved oxygen and total suspended solids on juvenile barbonymus schwanenfeldii (Bleeker, 1854) and Oreochromis niloticus (Linnaeus, 1758). AACL Bioflux 2018, 11, 394–406. [Google Scholar]
  16. Lorenz, J.M.; Filer, J.H. Spawning Habitat and Redd Characteristics of Sockeye Salmon in the Glacial Taku River, British Columbia and Alaska. Trans. Am. Fish. Soc. 1989, 118, 495–502. [Google Scholar] [CrossRef]
  17. Geist, D.R.; Dauble, D.D. Redd site selection and spawning habitat use by fall chinook salmon: The importance of geomorphic features in large rivers. Environ. Manag. 1998, 22, 655–669. [Google Scholar] [CrossRef] [PubMed]
  18. Power, G.; Brown, R.S.; Imhof, J.G. Groundwater and fish—Insights from northern North America. Hydrol. Process. 1999, 13, 401–422. [Google Scholar] [CrossRef]
  19. Fakhari, M.; Raymond, J.; Martel, R.; Dugdale, S.J.; Bergeron, N. Identification of Thermal Refuges and Water Temperature Patterns in Salmonid-Bearing Subarctic Rivers of Northern Quebec. Geographies 2022, 2, 528–548. [Google Scholar] [CrossRef]
  20. Fakhari, M.; Raymond, J.; Martel, R.; Drolet, J.-P.; Dugdale, S.; Bergeron, N. Analysis of Large-Scale Groundwater-Driven Cooling Zones in Rivers Using Thermal Infrared Imagery and Radon Measurements. Water 2023, 15, 873. [Google Scholar] [CrossRef]
  21. Saltveit, S.J.; Brabrand, Å. Incubation, hatching and survival of eggs of Atlantic salmon (Salmo salar) in spawning redds influenced by groundwater. Limnologica 2013, 43, 325–331. [Google Scholar] [CrossRef]
  22. Caissie, D. The thermal regime of rivers: A review. Freshw. Biol. 2006, 51, 1389–1406. [Google Scholar] [CrossRef]
  23. Walvoord, M.A.; Voss, C.I.; Wellman, T.P. Influence of permafrost distribution on groundwater flow in the context of climate-driven permafrost thaw: Example from Yukon Flats Basin, Alaska, United States. Water Resour. Res. 2012, 48, 1–17. [Google Scholar] [CrossRef]
  24. Evans, S.G.; Ge, S. Contrasting hydrogeologic responses to warming in permafrost and seasonally frozen ground hillslopes. Geophys. Res. Lett. 2017, 44, 1803–1813. [Google Scholar] [CrossRef]
  25. Allard, M.; Chiasson, A.; St-amour, A.B.; Aubé-michaud, S.; Mathon-dufour, V.; Hérault, E.L.; Bilodeau, S.; Deslauriers, C. Caractérisation Géotechnique et Cartographie Améliorée Du Pergélisol Dans Les Communautés Nordiques Du Nunavik; Final Report; Centre D’études Nordiques, Université Laval: Québec, QC, Canada, 2020; 76p. [Google Scholar] [CrossRef]
  26. Perreault, J.; Fortier, R.; Molson, J.W. Numerical Modelling of Permafrost Dynamics under Climate Change and Evolving Ground Surface Conditions: Application to an Instrumented Permafrost Mound at Umiujaq, Nunavik (Québec), Canada. Ecoscience 2021, 28, 377–397. [Google Scholar] [CrossRef]
  27. Neilson, B.T.; Cardenas, M.B.; O’Connor, M.T.; Rasmussen, M.T.; King, T.V.; Kling, G.W. Groundwater Flow and Exchange Across the Land Surface Explain Carbon Export Patterns in Continuous Permafrost Watersheds. Geophys. Res. Lett. 2018, 45, 7596–7605. [Google Scholar] [CrossRef]
  28. Ingebritsen, S.E.; Sanford, W.E.; Neuzil, C.E. Groundwater in Geologic Processes; Cambridge University Press: Cambridge, UK, 1998; ISBN 052149608X. [Google Scholar]
  29. Raymond, J.; Therrien, R. Optimizing the design of a geothermal district heating and cooling system located at a flooded mine in Canada. Hydrogeol. J. 2014, 22, 217–231. [Google Scholar] [CrossRef]
  30. Kurylyk, B.L.; Hayashi, M.; Quinton, W.L.; McKenzie, J.M.; Voss, C.I. Influence of vertical and lateral heat transfer on permafrost thaw, peatland landscape transition, and groundwater flow. Water Resour. Res. 2016, 52, 1286–1305. [Google Scholar] [CrossRef]
  31. Cho, J.; Mostaghimi, S.; Kang, M.S. Development and application of a modeling approach for surface water and groundwater interaction. Agric. Water Manag. 2010, 97, 123–130. [Google Scholar] [CrossRef]
  32. Tian, W.; Li, X.; Cheng, G.D.; Wang, X.S.; Hu, B.X. Coupling a groundwater model with a land surface model to improve water and energy cycle simulation. Hydrol. Earth Syst. Sci. 2012, 16, 4707–4723. [Google Scholar] [CrossRef]
  33. Hunt, R.J.; Westenbroek, S.M.; Walker, J.F.; Selbig, W.R.; Regan, R.S.; Leaf, A.T.; Saad, D.A. Simulation of Climate Change Effects on Streamflow, Groundwater, and Stream Temperature Using GSFLOW and SNTEMP in the Black Earth Creek Watershed, Wisconsin; USGS: Reston, VA, USA, 2016.
  34. Smith, S.L.; Burgess, M.M. A Digital Database of Permafrost Thickness in Canada; Natural Resources Canada: Ottawa, ON, Canada, 2002. [Google Scholar]
  35. Lévesque, R.; Allard, M.; Seguin, M.K.; Pilon, J.-A. Données préliminaires sur la régime thermique du pergélisol dans quelques localités du Nunavik, Québec. In Proceedings of the Fifth Canadian Permafrost Conference, Nordicana no 54, Quebec City, QC, Canada, 5–8 June 1990; pp. 207–213. [Google Scholar]
  36. Gray, J.T.; Pilon, J.A.; Poitevin, J. Le pergélisol et la couche active dans la toundra forestière au sud de la baie aux Feuilles, Nouveau-Québec. Geogr. Phys. Quat. 1979, 33, 253–264. [Google Scholar] [CrossRef]
  37. ClimateData.ca Data Source: Environment and Climate Change Canada and (ClimateData.ca). Available online: https://climatedata.ca/maps/?var=hottest_day&th=tx_max&dataset=216&dataOpacity=100&labelOpacity=100&lat=57.55615&lng=-70.20264&zoom=6 (accessed on 1 June 2020).
  38. Mookerji, N.; Weng, Z.; Mazumder, A. Food partitioning between coexisting Atlantic salmon and brook trout in the Sainte-Marguerite River ecosystem, Quebec. J. Fish. Biol. 2004, 64, 680–694. [Google Scholar] [CrossRef]
  39. Mainguy, J.; Beaupré, L. Établissement D’un État de Référence Pour la Population D’omble Chevalier de la Rivière BÉRARD à Tasiujaq; Ministère des Forêts, de la Faune et des Parcs, Direction de L’expertise Sur la Faune Aquatique et Direction de la Gestion de la Faune du Nord-du-Québec: Québec, QC, Canada, 2019.
  40. SIGÉOM Surface Deposits Map. Available online: https://sigeom.mines.gouv.qc.ca/signet/classes/I1108_afchCarteIntr (accessed on 1 June 2020).
  41. Fakhari, M.; Raymond, J.; Martel, R.; Klepikova, M.; Bour, O. Complementarity of multiple in-situ techniques for spatiotemporal assessment of groundwater/surface-water exchanges. Hydrogeol. J. 2025, 33, 219–235. [Google Scholar] [CrossRef]
  42. COMSOL. COMSOL Multiphysics® Simulation Software. Available online: https://www.comsol.com/comsol-multiphysics (accessed on 1 June 2023).
  43. Chesnaux, R.; Lambert, M.; Walter, J.; Fillastre, U.; Hay, M.; Rouleau, A.; Daigneault, R.; Moisan, A.; Germaneau, D. Building a geodatabase for mapping hydrogeological features and 3D modeling of groundwater systems: Application to the Saguenay-Lac-St.-Jean region, Canada. Comput. Geosci. 2011, 37, 1870–1882. [Google Scholar] [CrossRef]
  44. Chesnaux, R. Using ArcHydro Groundwater for 3D modeling of quaternary deposits in the Saguenay-Lac-St.-Jean region. In Proceedings of the ESRI Canada User Conferences, San Diego, CA, USA, 11–15 July 2011. [Google Scholar]
  45. Comeau, F.A.; Raymond, J.; Malo, M.; Dezayes, C.; Carreau, M. Geothermal potential of Northern Québec: A regional assessment. Trans. Geotherm. Resour. Counc. 2017, 41, 1076–1094. [Google Scholar]
  46. Freeze, A.; Cherry, J. Groundwater; Prentice-Hall Inc.: Saddle River, NJ, USA, 1979; ISBN 0133653129. [Google Scholar]
  47. Dagher, E.E.; Su, G.; Nguyen, T.S. Verification of the Numerical Simulation of Permafrost Using COMSOL Multiphysics® Software. In Proceedings of the COMSOL Conference 2014, Boston, MA, USA, 8–10 October 2014; pp. 1–9. [Google Scholar]
  48. Hu, R.; Liu, Q.; Xing, Y. Case study of heat transfer during artificial ground freezing with groundwater flow. Water 2018, 10, 1322. [Google Scholar] [CrossRef]
  49. Osborne, P.E.; Alvares-Sanches, T. Quantifying how landscape composition and configuration affect urban land surface temperatures using machine learning and neutral landscapes. Comput. Environ. Urban Syst. 2019, 76, 80–90. [Google Scholar] [CrossRef]
  50. Yusuf, Y.A.; Pradhan, B.; Idrees, M.O. Spatio-temporal Assessment of Urban Heat Island Effects in Kuala Lumpur Metropolitan City Using Landsat Images. J. Indian Soc. Remote Sens. 2014, 42, 829–837. [Google Scholar] [CrossRef]
  51. Guo, D.; Wang, H. CMIP5 permafrost degradation projection: A comparison among different regions. J. Geophys. Res. Atmos. 2016, 121, 4449–4517. [Google Scholar] [CrossRef]
  52. Anisimov, O.; Reneva, S. Permafrost and changing climate: The Russian perspective. Ambio J. Hum. Environ. 2006, 35, 169–175. [Google Scholar] [CrossRef]
  53. Adiya, S.; Erdenebat, E. 21st century permafrost distribution under the scenario of RCP2.6 and RCP8.5 in Mongolia. Proc. Mong. Acad. Sci. 2021, 61, 9–14. [Google Scholar] [CrossRef]
  54. Koven, C.D.; Riley, W.J.; Stern, A. Analysis of permafrost thermal dynamics and response to climate change in the CMIP5 earth system models. J. Clim. 2013, 26, 1877–1900. [Google Scholar] [CrossRef]
  55. Buteau, S.; Fortier, R.; Delisle, G.; Allard, M. Numerical simulation of the impacts of climate warming on a permafrost mound. Permafr. Periglac. Process. 2004, 15, 41–57. [Google Scholar] [CrossRef]
  56. Frampton, A.; Painter, S.; Lyon, S.W.; Destouni, G. Non-isothermal, three-phase simulations of near-surface flows in a model permafrost system under seasonal variability and climate change. J. Hydrol. 2011, 403, 352–359. [Google Scholar] [CrossRef]
  57. Frechette, D.M.; Dugdale, S.J.; Dodson, J.J.; Bergeron, N.E. Understanding summertime thermal refuge use by adult Atlantic salmon using remote sensing, river temperature monitoring, and acoustic telemetry1. Can. J. Fish. Aquat. Sci. 2018, 75, 1999–2010. [Google Scholar] [CrossRef]
  58. Linnansaari, T.; O’Sullivan, A.M.; Breau, C.; Corey, E.M.; Collet, E.N.; Curry, R.A.; Cunjak, R.A. The Role of Cold-Water Thermal Refuges for Stream Salmonids in a Changing Climate—Experiences from Atlantic Canada. Fishes 2023, 8, 471. [Google Scholar] [CrossRef]
  59. Snyder, M.N.; Schumaker, N.H.; Dunham, J.B.; Ebersole, J.L.; Keefer, M.L.; Halama, J.; Comeleo, R.L.; Leinenbach, P.; Brookes, A.; Cope, B.; et al. Tough places and safe spaces: Can refuges save salmon from a warming climate? Ecosphere 2022, 13, e4265. [Google Scholar] [CrossRef] [PubMed]
  60. Oyinlola, M.A.; Khorsandi, M.; Penman, R.; Earhart, M.L.; Arsenault, R.; Brauner, C.J.; St-Hilaire, A. Hydrothermal impacts of water release on early life stages of white Sturgeon in the Nechako river (B.C. Canada). J. Therm. Biol. 2023, 53, 125–134. [Google Scholar] [CrossRef]
Figure 1. Location of study sites on permafrost distribution map of Quebec Province ((A), from Ref. [20]) and simplified cross-section view of study sites showing geological units of the Sainte-Marguerite River (B) and Berard River (C).
Geosciences 15 00370 g001
Figure 2. Schematization of the flow and heat transfer system in the models.
Geosciences 15 00370 g002
Figure 3. Expected ground temperature profile of the Berard River (based on data from Refs. [25,34,35,36]).
Geosciences 15 00370 g003
Figure 4. Boundary conditions of the flow (A) and heat transfer (B) models.
Geosciences 15 00370 g004
Figure 5. Anticipated average annual air temperature and total annual precipitation for the Sainte-Marguerite River/Sacré-Coeur ((A) and (B), respectively) and Berard River/Tasiujaq ((C) and (D), respectively), based on historical models and low- (RCP2.6), medium- (RCP4.5), and high- (RCP8.5) emission scenarios (based on Ref. [37]).
Geosciences 15 00370 g005
Figure 6. Example of sensitivity analysis results showing the effect of parameters on the simulated RBT of the Berard River.
Geosciences 15 00370 g006
Figure 7. Simulated riverbed temperature and riverbed groundwater seepage rate of the Sainte-Marguerite River ((A) and (B), respectively) and Berard River ((C) and (D), respectively) study sites based on RCP2.6 and RCP8.5 climate scenarios.
Geosciences 15 00370 g007
Figure 8. Cross-section view of the Berard River study site showing simulated groundwater flow lines (black) and ground temperature distribution at different time intervals under RCP8.5 and RCP2.6 scenarios.
Geosciences 15 00370 g008
Table 1. Calibrated model input values for the hydraulic properties of geological units in frozen and unfrozen conditions.
Geological UnitUnfrozen Hydraulic Conductivity (m·s−1)Frozen Hydraulic Conductivity (m·s−1)Porosity (−)
Alluvial1 × 10−41 × 10−70.25
Till1 × 10−71 × 10−100.35
Bedrock1 × 10−101 × 10−130.05
Note: An anisotropy factor of 0.1 for vertical hydraulic conductivity was considered (kv = 0.1 kh).
Table 2. Calibrated model input values for thermal properties of materials/geological units.
Material/Geological UnitThermal Conductivity (W·m−1·K−1)Heat Capacity (J·kg−1·K−1)Density (kg·m−3)
Alluvial (Solid)0.53001500
Till (Solid)15001300
Bedrock (Solid)210002500
Water0.642001000
Ice2.142100920
Table 3. Yearly average annual air temperature and total annual precipitation increase rates based on low- and high-carbon-emission climate scenarios for the selected rivers.
ScenarioRCP2.6RCP8.5
River AT (°C/yr) TP (mm/yr) AT (°C/yr) TP (mm/yr)
Sainte-Marguerite0.021.000.072.20
Berard0.030.600.091.60
Disclaimer/Publisher’s Note: The statements, opinions and data contained in all publications are solely those of the individual author(s) and contributor(s) and not of MDPI and/or the editor(s). MDPI and/or the editor(s) disclaim responsibility for any injury to people or property resulting from any ideas, methods, instructions or products referred to in the content.