Article

Short-Term Geomorphological Changes of the Sabato River (Southern Italy)

Department of Sciences and Technologies, University of Sannio, via F. De Sanctis s.n.c., 82100 Benevento, Italy
*
Author to whom correspondence should be addressed.
Geosciences 2025, 15(8), 308; https://doi.org/10.3390/geosciences15080308
Submission received: 7 June 2025 / Revised: 28 July 2025 / Accepted: 4 August 2025 / Published: 8 August 2025

Abstract

Short-term channel adjustments are a research topic of great relevance in the framework of fluvial geomorphology, but studies on this topic have been quite scarce in Southern Italy, at least since the 2010s, notwithstanding the fact that this area is strongly representative of a much wider morphoclimatic context, i.e., the Mediterranean area, which particularly suffers from the effects of current climate change. Currently, different interpretations still exist about the type and role of controlling factors, and a common morphoevolutionary trend is quite far from being defined; so, new case studies are needed. In this paper, the geomorphological changes experienced by the Sabato R. (Southern Italy) over a period of ~150 years were investigated. A reach-scale geomorphological analysis in a GIS environment of raster data, consisting of four topographic maps (from 1870, 1909, 1941 and 1955) and five sets of orthophotos (from 1998, 2004, 2008, 2011 and 2014), was carried out, integrated with field-surveyed data. Land-use changes, in-channel anthropic disturbances, floods and rainfall variations were selected as possible controlling factors. The study highlighted four morphoevolutionary phases of the studied river. Phase 1 (1870s–1910s) was characterized by a relative channel stability in terms of both mean width and pattern, while channel widening dominated during Phase 2 (1910s–1940s). In contrast, Phase 3 (1940s–1990s) was characterized by intense and diffuse narrowing. Finally, during Phase 4 (from the 1990s onward), an alternation in channel narrowing and flood-induced widening was detected. During all phases, changes in both channel pattern and riverbed elevation were less evident than those in channel width. Land-use changes and, later, floods, in addition to in-channel human disturbances at a local scale, were the main controlling factors. The obtained results have profound implications for rivers located outside Italy as well, as they provide new insights into the role played by the considered controlling factors in the geomorphological evolution of a typical Mediterranean river. Understanding this role is fundamental in regional-scale river management, hazard mitigation and environmental planning, as proved by the vast pre-existing scientific literature.

1. Introduction

In recent decades, rivers have experienced intense geomorphological changes that have been investigated worldwide [1,2,3,4,5,6]. In particular, a large number of papers focused on Italian rivers [7,8,9]. Unfortunately, rivers in Southern Italy have been less investigated compared with those in Northern and Central Italy, notwithstanding the fact that they are representative of a much wider morphoclimatic scenario, i.e., the Mediterranean area [3] and the literature is still relatively scarce [10,11,12,13,14,15]. Previous papers generally show that Italian rivers, at least from the 1950s onwards, underwent significant narrowing (i.e., a reduction in the planform distance between the riverbanks) and bed-level lowering (i.e., a decrease in the channel bottom altitude). In the 1990s, some channels have started to widen, i.e., to experience an increase in the planform distance between the riverbanks, and partially recovered their bed elevation, but this has not compensated for the effects of previous alterations.
The controlling factors of such adjustments are still widely debated. Some researchers think that the dominant factor is climate change [16,17,18,19]. Floods and, in particular, extreme floods change the morphological parameters of rivers in a remarkable way and in a very short time [20,21,22,23]. Floods induce widening of the active channel, aggradation of the riverbed and changes towards multi-thread or transitional channel patterns. Other researchers attribute the short-term variations mainly to anthropic disturbances, such as land-use changes at the basin scale, channelization, damming and/or extraction of sediments from the riverbed [24,25,26,27,28]. Land-use changes affect the rates of soil erosion on slopes and, consequently, the sediment supplied to the river. The latter, in turn, affects river sediment discharge, which is one of the key variables that control channel adjustments. Among the different land-use changes, afforestation and deforestation are of paramount importance, as the first reduces erosion on slopes and associated sediment supply to the river, while the second increases such supply [29]. Channelization reduces fluvial erosion of the riverbanks, riverbed or both, thus reducing sediment discharge. Furthermore, channelization prevents free lateral shifting of the active channel, which can affect both channel width and pattern [26]. River damming traps most of the sediment upstream from the dam, thus reducing sediment discharge downstream. This often induces riverbed degradation and active channel narrowing downstream from the dam [11,14,30]. Finally, extraction of sediments from the riverbed reduces sediment availability to the river and creates localized increases in riverbed slope gradient, which in turn increases flow velocity and erosion. As a result, riverbed degradation moves both upstream and downstream from the sediment extraction site [4,24,31].
This study is focused on the geomorphological changes experienced by a small river, i.e., the Sabato River, located in Southern Italy (Figure 1). We have carried out a reach-scale analysis aimed at investigating the geomorphological changes of the studied river over the last 150 years, with a final aim of understanding both its morphoevolutionary trajectory and the controlling factors. The obtained results will have broad-scale implications for future studies. In fact, many papers [10,32,33,34,35] have demonstrated that analyses of both the short-term channel adjustments and morphoevolutionary trajectory of a river provide useful insights into degradational and recovery phases, allowing for management actions at the regional scale to align with channel adjustment trends in efforts to sustain channel recovery, hazard mitigation and environmental planning, thus achieving the best possible conditions. In any case, the Sabato R. is a previously uninvestigated case study, and this study aims to provide new insights to define a morphoevolutionary trend at the regional scale.

2. Materials and Methods

2.1. Study Area

The Sabato R. basin is located in Southern Italy, more precisely in the Campania region, flowing through the Avellino and Benevento provinces. The Sabato R. is the main left tributary of the Calore R. The basin has an area of 401.54 km2 and is located between latitudes 40°46′ N and 41°08′ N and longitudes 14°45′ E and 14°59′ E. The river rises at Accellica Mt. and ends at the confluence into the Calore R. near Benevento (Figure 1a).
The climate in the study area is sub-continental, with temperate–humid winters and dry summers. The average annual temperature ranges between 14 °C and 17 °C. Annual rainfall ranges between 956 mm and 1340 mm, with a major intensity in the months of November and December and a minor intensity in June, July and August.
The geological substratum consists of Upper Cretaceous-aged limestone deposits that mainly outcrop in the upper river basin, on which Miocene- and Pliocene-aged terrigenous deposits (Tufo-Altavilla Units) are tectonically superimposed. On this pre-Quaternary and tectonically deformed substratum, Quaternary-aged deposits of volcanic and alluvial origin unconformably overlie [36,37,38].

2.2. Data Source and Methodology

For the geomorphological analysis, the following materials were used (Table 1): (i) 1:50,000-scale historical topographic maps from 1870, 1909 and 1941, provided by IGMI (Italian Geographic Military Institute), which were scanned in *.tif format; (ii) 1:25,000-scale topographic maps, “serie 25” from 1955, provided by IGMI in *.ecw format; and, finally, (iii) digital orthophotos from 1998, 2004, 2008, 2011 and 2014, provided by Campania Region authority in *.tif format, at a scale ranging from 1:13,000 (1998) to 1:5000. All the materials were geo-referenced, by using Global Mapper 7.1 software, in UTM WGS84 coordinate system, Fuse 33N.
Errors associated with channel width measurement were calculated by summing two independent errors. The first one is associated with bank-line digitization. It depends on map scale and orthophoto pixel dimensions. It was calculated by multiplying pixel resolution by the mean of the maximum number between repeat left and right bank-line delineations. The second error is related to distortions of orthophotos. ArcGIS 10.3 software provided root mean square errors (RMSEs). The results are reported in Table 1.
The following step was digitizing the Sabato R. active channels at different dates by using QGIS 3.34.8 software. The active channels were then subdivided into analyzed and not-analyzed reaches (Figure 1b). In particular, not-analyzed reaches were excluded from the analysis, due to the impossibility of a correct digitation, for one or more of the following causes: (i) they were too narrow to be reliably represented on topographic maps; (ii) on the orthophotos, the riverbanks were largely or totally hidden by a dense arboreal riparian vegetation; (iii) they flowed directly on bedrock; (iv) they were artificially channelized.
The analyzed Sabato R. reaches were then further subdivided according to the IDRAIM method [41], which allows identifying reaches that are homogeneous from both confinement and morphological conditions, also taking into account the presence of hydrological discontinuities (i.e., confluences and dams). In particular, 15 reaches were defined and analyzed (Figure 1b). For each analyzed reach at different dates, the centerline, valley axis and fluvial bars were digitized in a GIS environment.
As controlling factors, hydrological data (i.e., rainfall and hydrometric data), land-use data and human disturbances were considered and analyzed.
Mean channel width was calculated, according to Surian et al. [42], by dividing the active channel area by the centerline length of each reach. Sinuosity was calculated according to Schumm [43] by dividing the centerline length by the valley axis length. Channel pattern was classified according to Rinaldi [44]. The channel pattern was assessed at both the river and reach scales. In the first case, the spatial distribution along the Sabato R. of the detected channel patterns was expressed as a percentage of the total river length characterized by a given channel pattern. In the second case, the dominant channel pattern within each reach was assessed.
Hydrological data were provided by Ministero LL.PP. [45] and Centro Funzionale Multirischi della Protezione Civile, Regione Campania [46]. For hydrometric data, due to some discrepancies between the data sources, some hydrometric data were analyzed and presented separately. In particular, according to Magliulo et al. [30], the minimum annual hydrometric heights were used for assessing changes in riverbed height. In particular, Magliulo et al. [30] have demonstrated that in rivers similar to the Sabato R., which are characterized by an almost total absence of flowing water during the dry season, the minimum annual hydrometric height is a good proxy of the riverbed elevation, with an error of few decimeters that, in any case, marginally affects the general trend. Thus, the latter can be usefully reconstructed and analyzed. To this end, in this study, the variation in the minimum annual hydrometric height measured at the Chianche stream gauge (Figure 1a) was used to infer variation trends in riverbed elevation. Similarly, maximum annual hydrometric height data were used to assess both the frequency and intensity of floods. Finally, with the aim of investigating variations in rainfall, the most complete rainfall data series were selected. They were collected at the Avellino, Benevento, Serino and Altavilla Irpina rain-gauge stations [45,46]. Mean annual rainfall was calculated for each station and the whole Sabato R. basin.
To assess land-use changes at the basin scale, three land-use maps were produced in a GIS environment. The first map, from 1960, was digitized in a GIS environment from the Map of the Agricultural Use of Soils at 1:200,000 scale, produced by the National Research Council and published by Touring Club [47]. The second and the third maps, from 1990 and 2012, respectively, were produced from Corine Land Cover data at a 1:100,000 nominal scale [48,49].
Finally, human disturbances such as sediment extraction sites, weirs, bridges and riverbank protections were mapped and dated through topographic maps and aerial photo interpretations.

3. Results

In this section, all the results we obtained from the work performed in order to investigate the short-term geomorphological changes of the Sabato R. from 1870 to 2014 will be presented. Namely, we analyzed confinement conditions; changes in mean active channel width; channel morphology; and, as controlling factors, changes in land-use at the basin scale, in-channel human disturbances, variations in rainfall and floods.

3.1. Geomorphological Analysis of the Sabato R. Channel

3.1.1. Confinement

The total length of the Sabato R. is about 50 km, and the analyzed reaches accounted for ~50% of the total river length. The subdivision of the Sabato R. into reaches was primarily based on the different confinement conditions, which were determined according to the IDRAIM method [41]. More precisely, the confinement conditions of a river reach were determined based on two parameters, i.e., Confinement Degree and Confinement Index, which allow determining the Confinement Class of the reach. The results are reported in Table 2. The analyzed channel of the Sabato R. fell within the “unconfined” or “partly confined” confinement classes. In particular, the river is partly confined in 52% of the analyzed length and unconfined in the remaining 48%.

3.1.2. Changes in Mean Active Channel Width

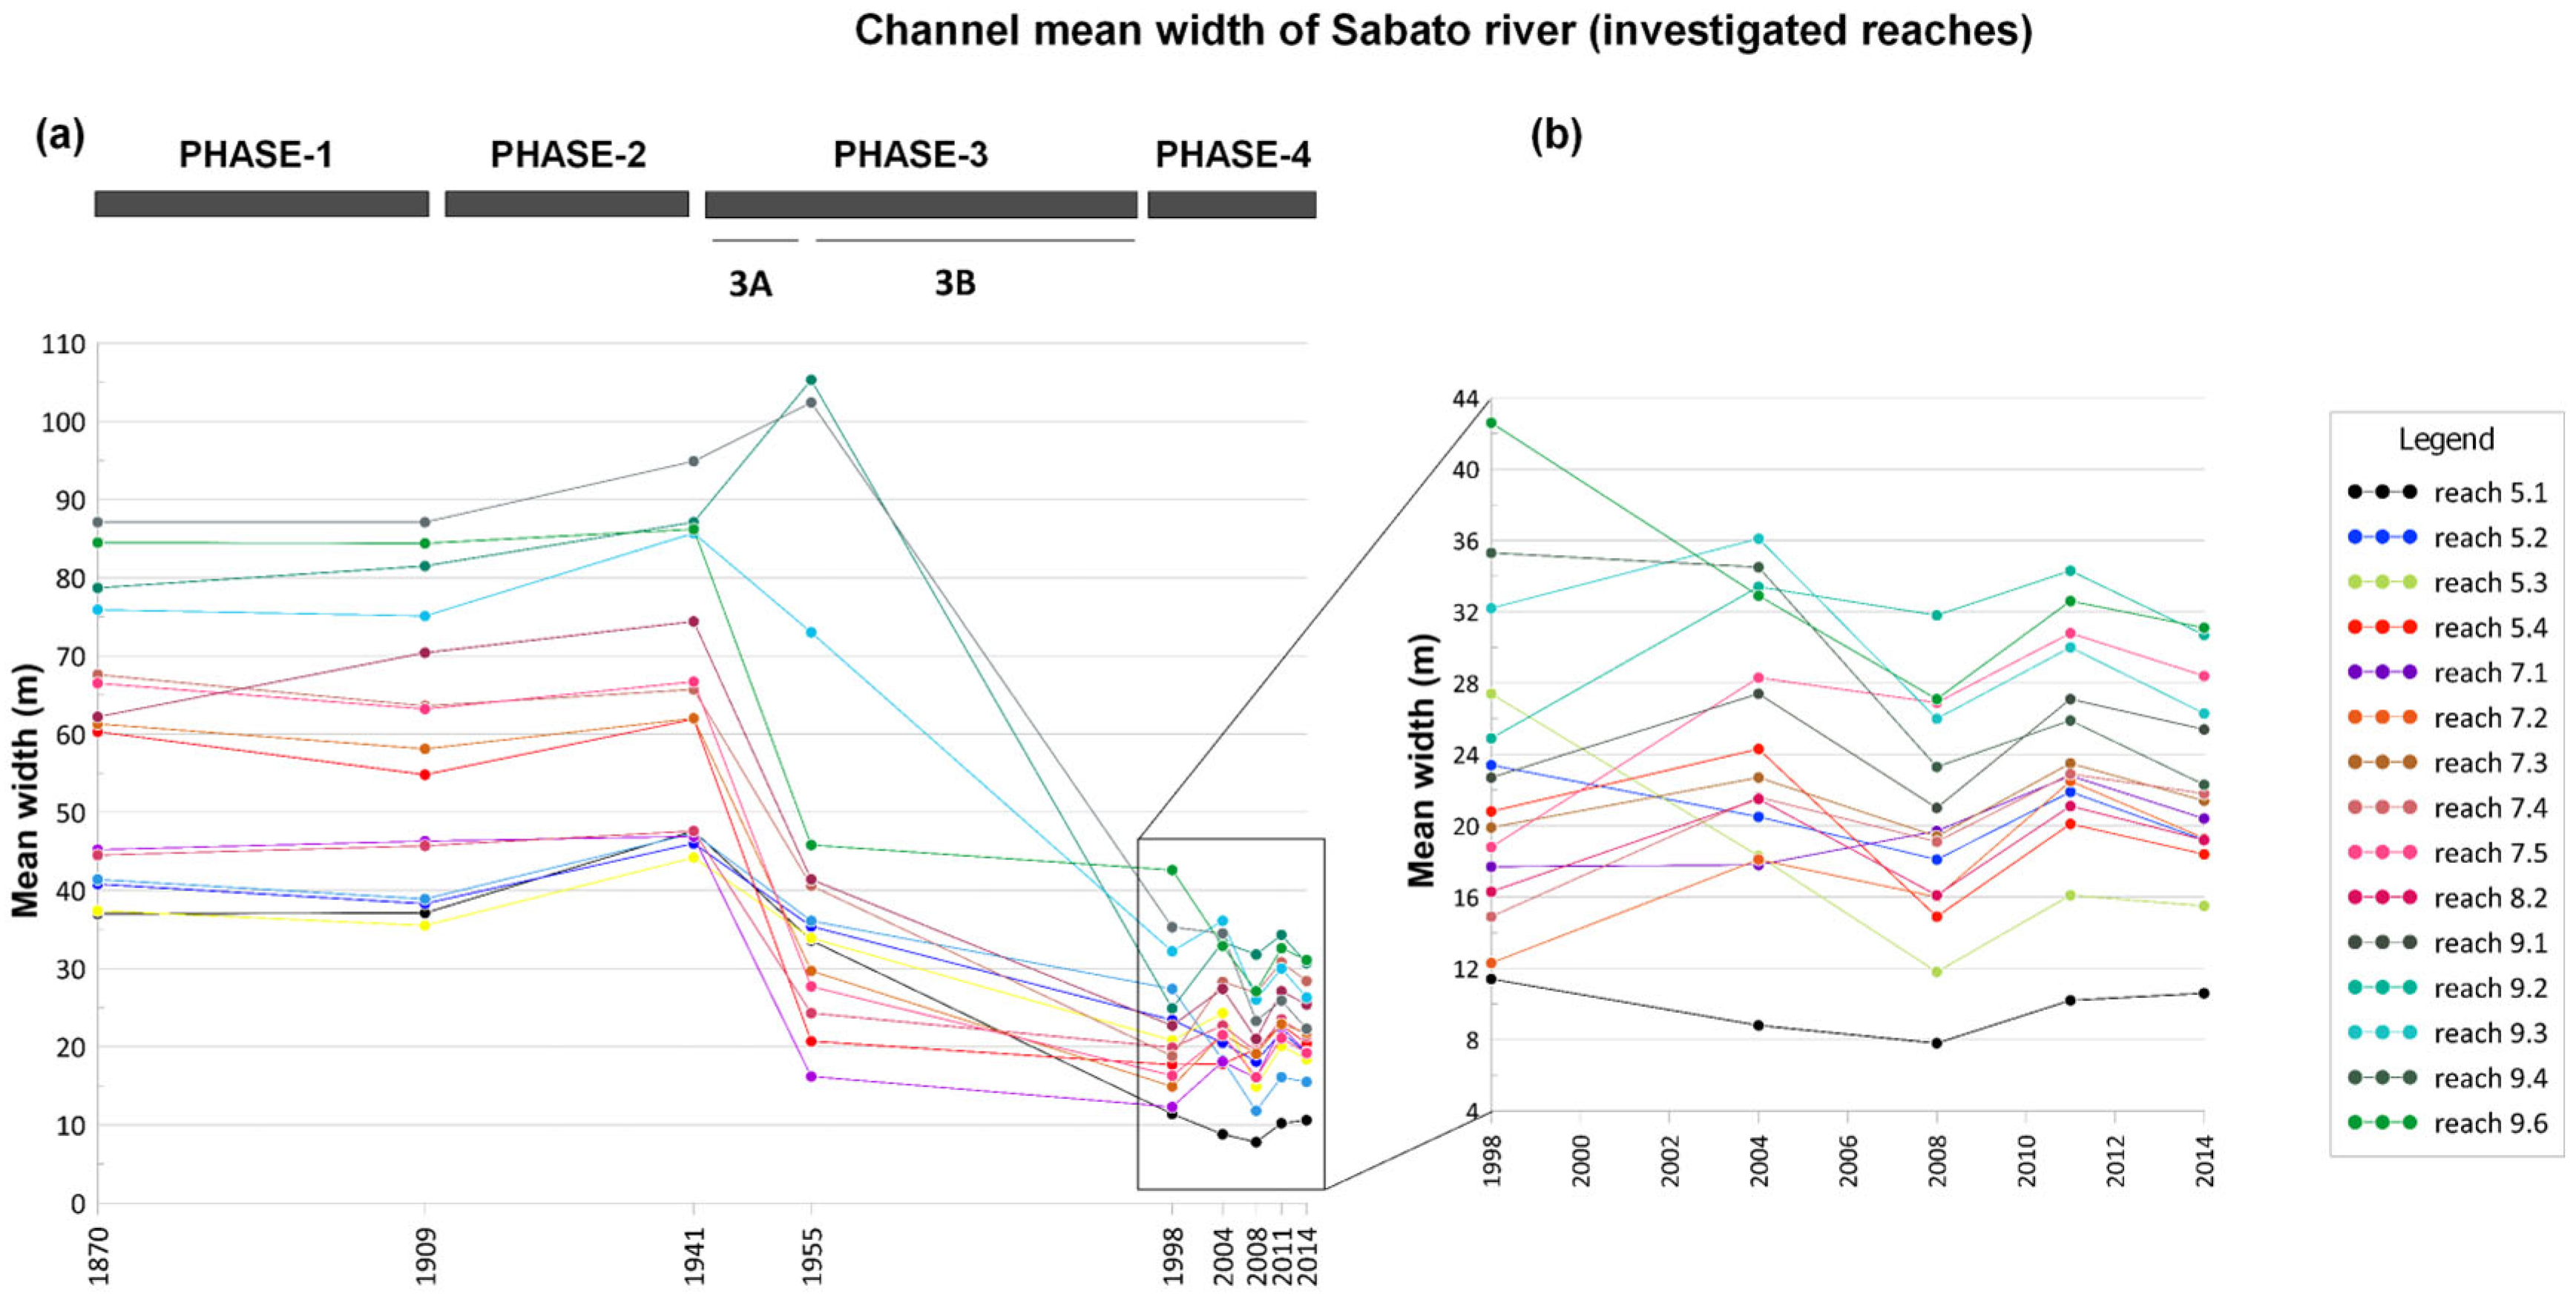
Figure 2 shows the main trends in mean active channel width variations. Four main phases can be observed and recognized.
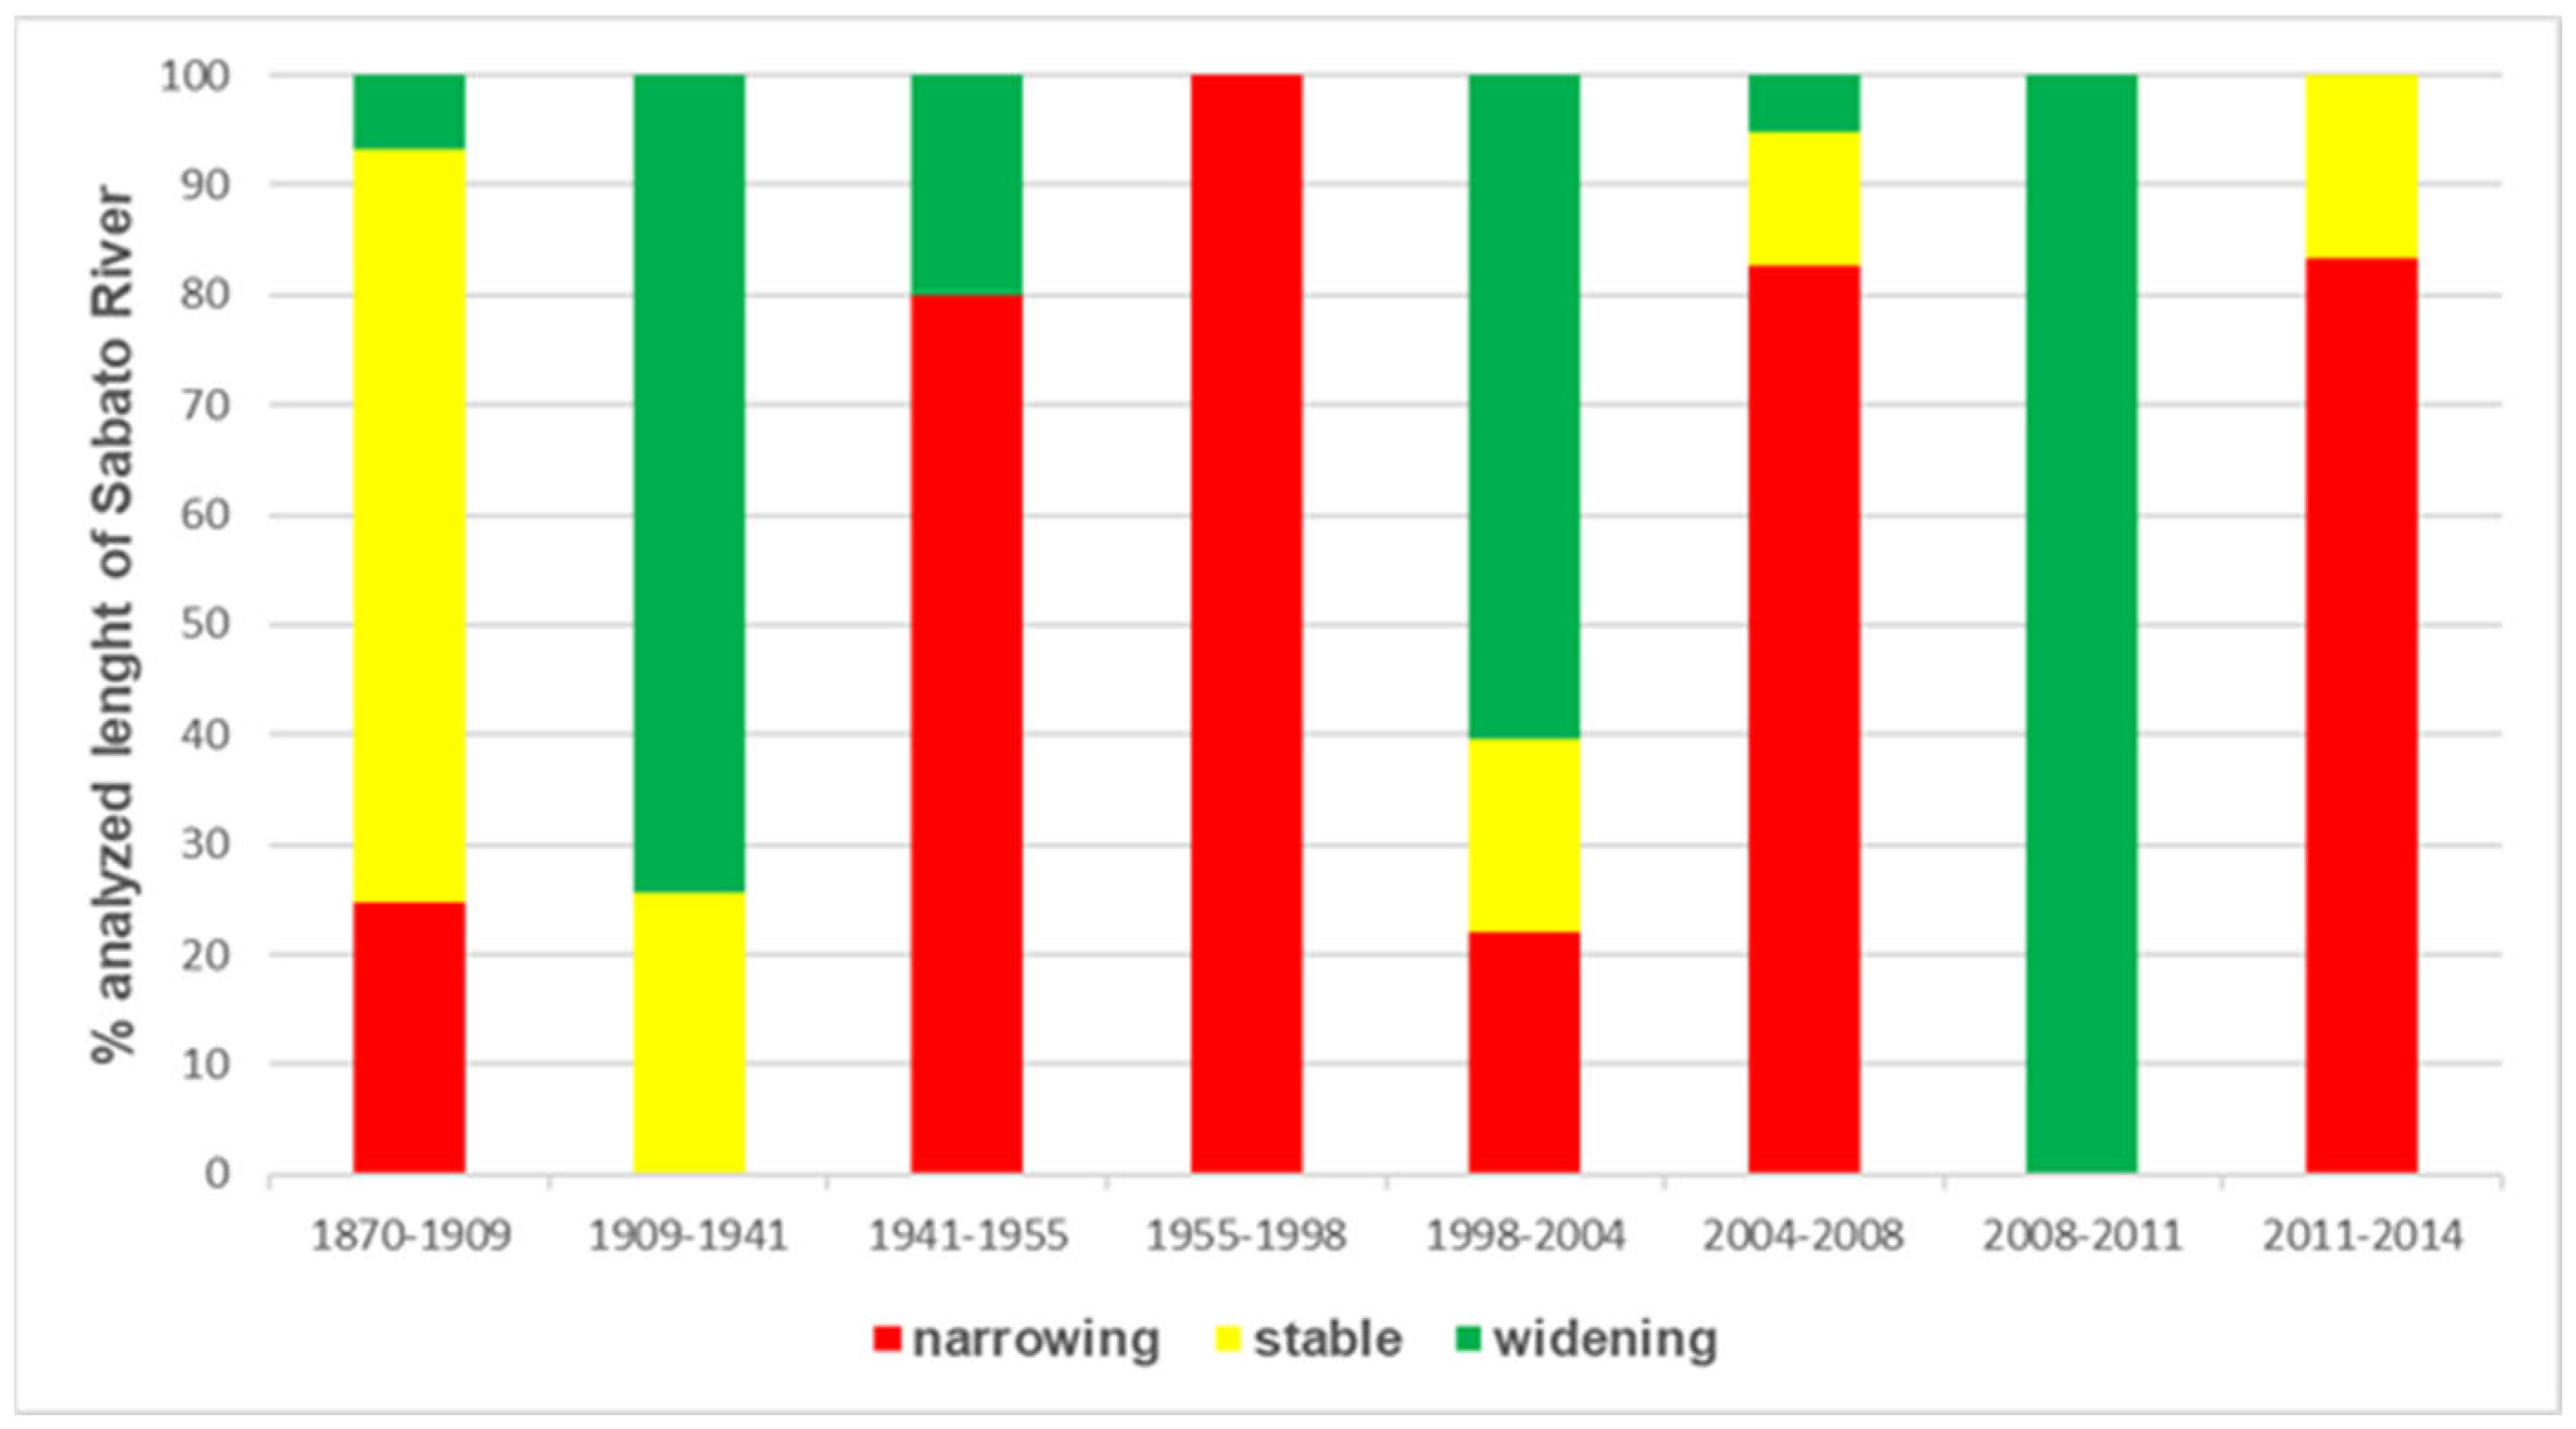
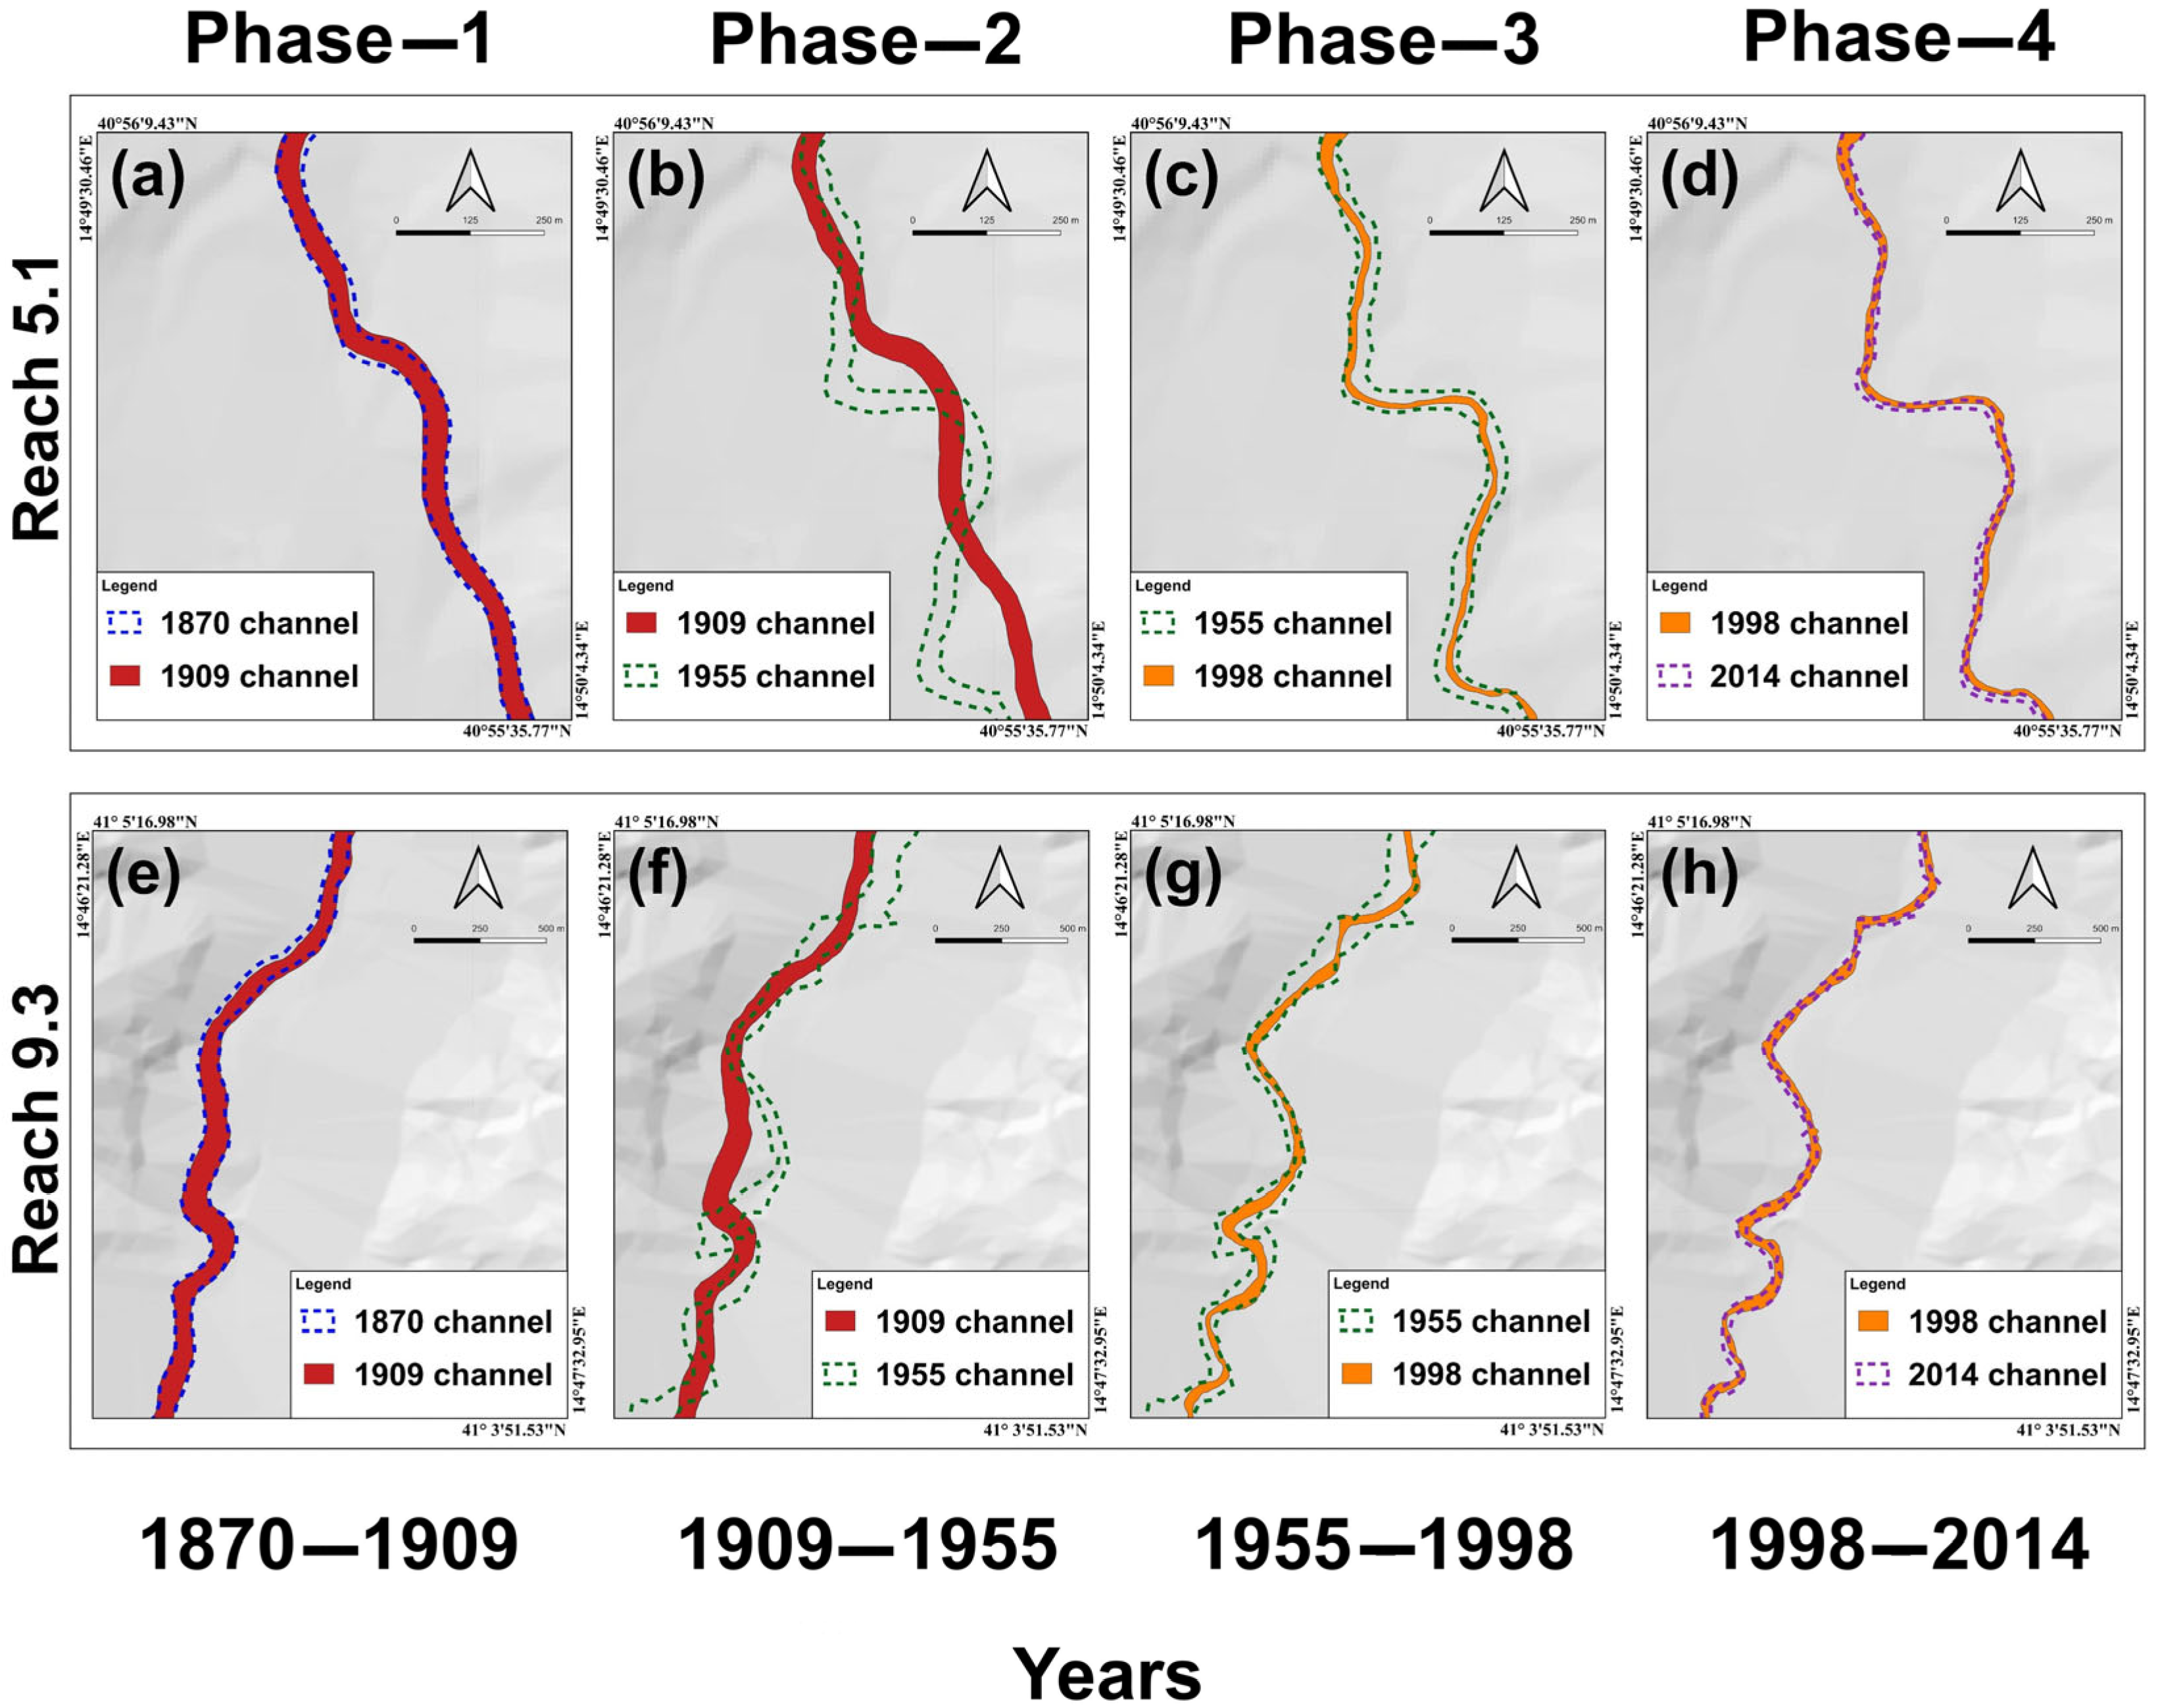
Between 1870 and 1909, the river showed a dominant stability. When the length of each reach is expressed as a percentage of the total analyzed length, it can be observed that ~70% of the analyzed Sabato R. remained stable, while ~25% experienced narrowing (Figure 3). Table 3 shows that the latter was negligible, ranging from 0.02 and −0.14 m/year, with a mean value of −0.07 m/year. Examples of the detected channel width changes that have occurred during this phase are reported in Figure 4a,e. Hereinafter, we will refer to this phase as Phase 1.
Between 1909 and 1941, channel widening was the dominant process (Figure 2 and Figure 4b,f), affecting ~75% of the analyzed river length (Figure 3), even if the mean annual rates were quite low (i.e., 0.17 m/year), ranging from 0.02 m/year to 0.33 m/year (Table 3). Narrowing was absent, while ~25% of the analyzed river remained stable from the standpoint of channel width (Figure 3). This phase will be hereinafter referred to as Phase 2.
In the period 1941–1998, narrowing was clearly the dominant process (Figure 2 and Figure 4c,g). This phase will hereinafter be referred to as Phase 3. Based on the results reported in Figure 3 and Table 3, it is possible to further subdivide this phase into two sub-phases. Sub-phase 3A occurred between 1941 and 1955. During this sub-phase, notwithstanding the large dominance of narrowing, which affected ~80% of the analyzed river (Figure 3) at very high rates (−1.78 m/year, with a peak of −2.95 m/year; Table 3), widening was still present in some reaches (Figure 3) at significant rates (i.e., 0.92 m/year; Table 3). Differently, during Sub-phase 3B, widening totally disappeared (Figure 3). Narrowing affected the whole analyzed portion of the Sabato R. (Figure 3), even if at lower rates compared with Sub-phase 3A (i.e., 0.5 m/year, with a peak of 1.87 m/year; Table 3).
The last phase, hereinafter defined as Phase 4, occurred approximately from 1998 onwards (Figure 2). This phase can be described as a phase of great instability in mean channel width, consisting of short periods of dominant narrowing interrupted by short periods of dominant or total widening (Figure 3). Both narrowing and widening were quite intense. In particular, narrowing ranged from −0.76 and −1.24 m/year, with a peak of −2.80 m/year, while widening ranged from 0.14 and 1.40 m/year, with a peak of 2.19 m/year (Table 3). In general, however, the changes in mean active channel width were quite negligible (Figure 4d,h).

3.1.3. Channel Pattern

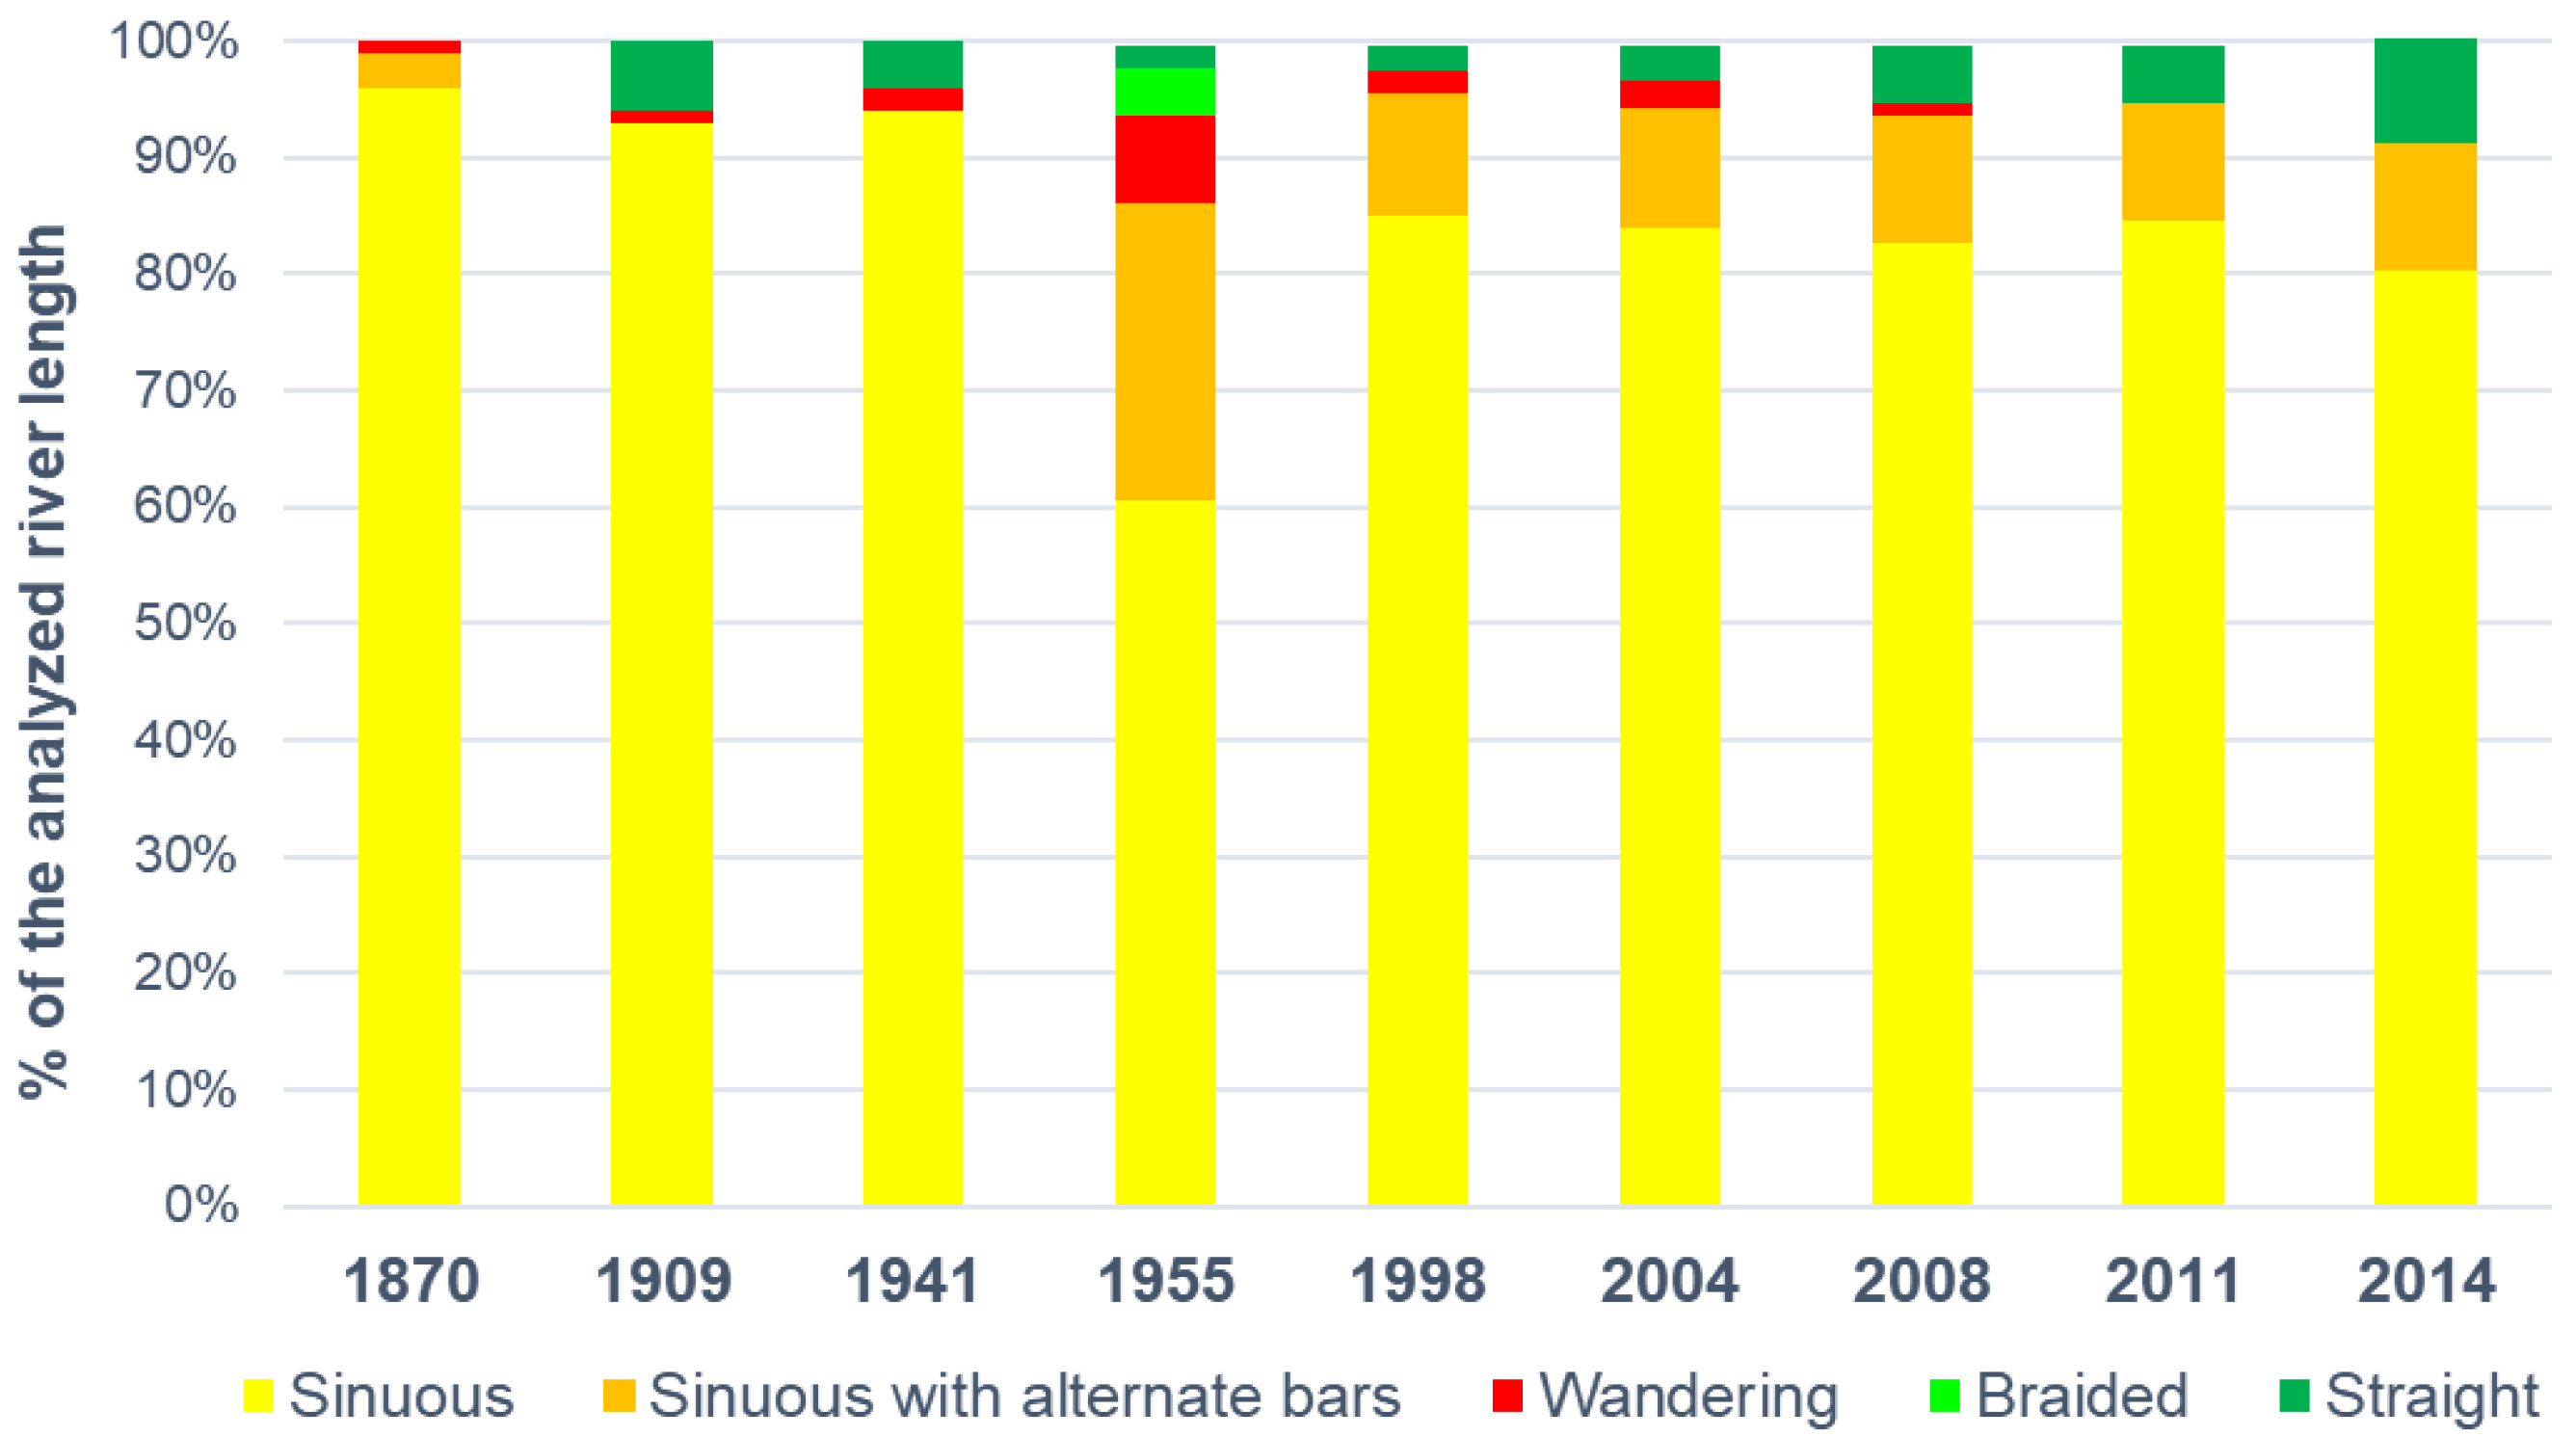
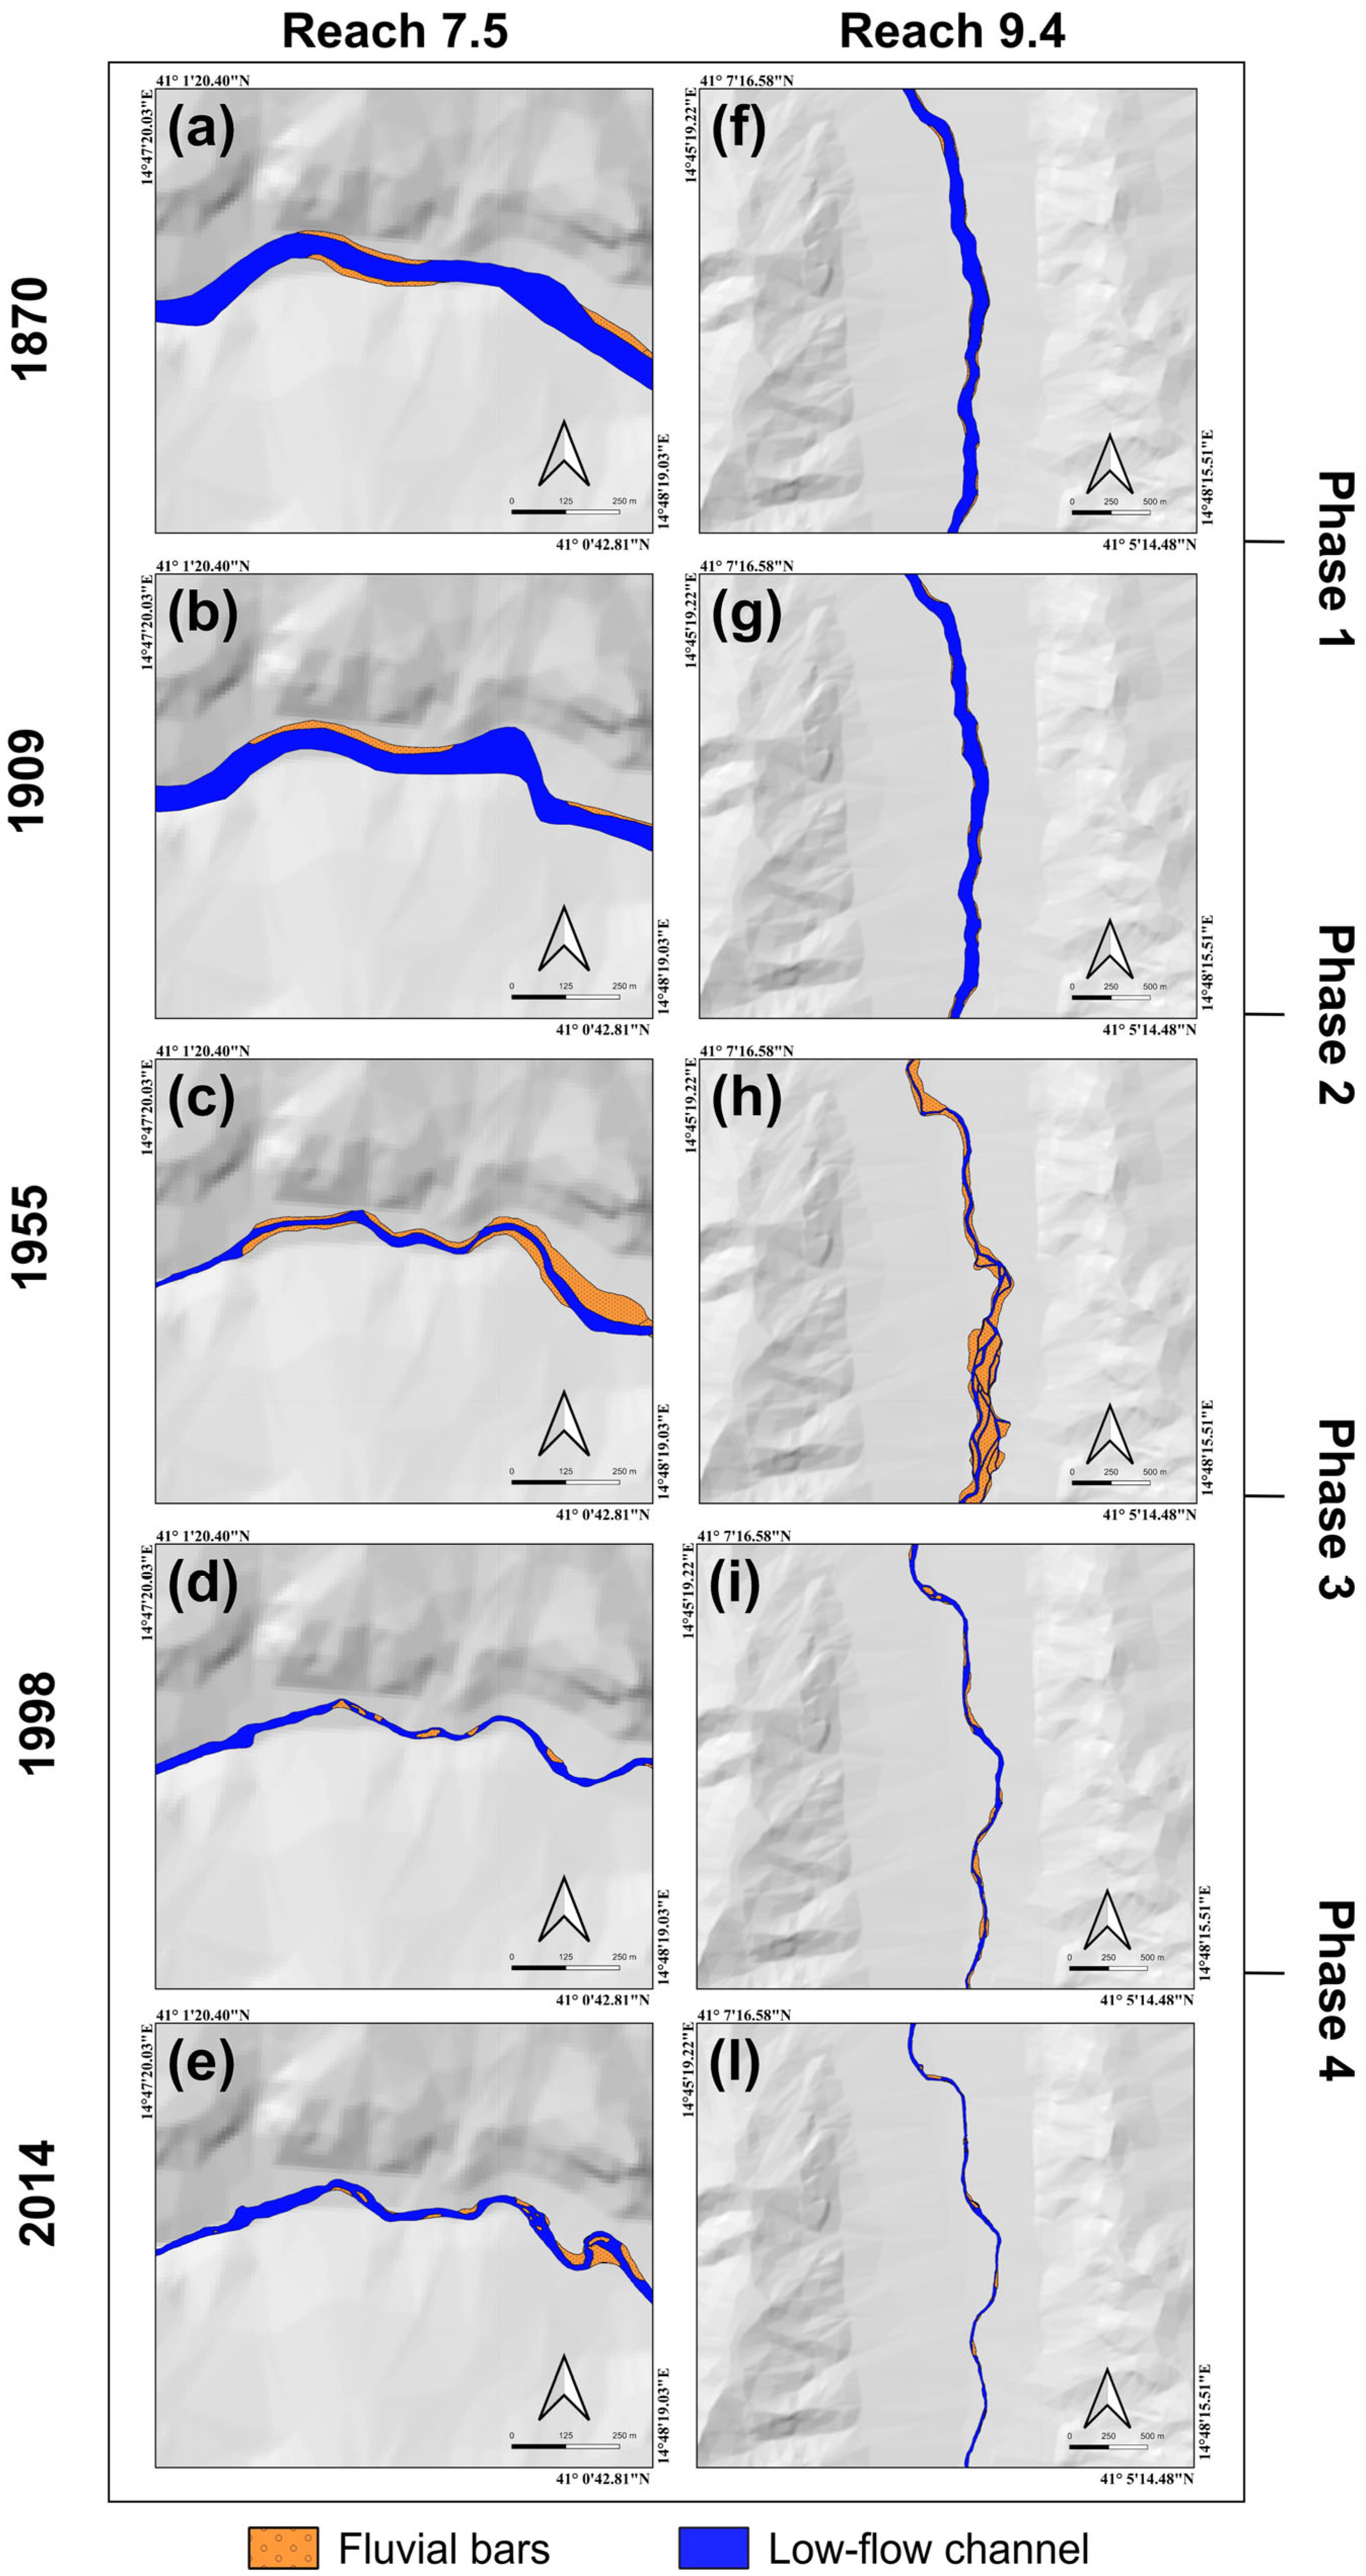
The distribution of the different channel patterns, defined according to Rinaldi [44], in the entire Sabato R. in the investigated time span is shown in Figure 5. The Sabato R. always showed a strikingly dominant sinuous channel pattern in all the investigated years (Figure 5). Subordinately, sinuous with alternate bars pattern was also present, especially in 1955, when it characterized ~25% of the total river length. All the other patterns accounted for negligible percentages of the total river length. In particular, the straight pattern was constantly present in all the considered years, except in 1870. Wandering morphology totally disappeared from 2011 onwards.
Table 4 shows that, at the reach scale, all the occurring channel patterns were constantly subordinate to the sinuous pattern, occupying negligible portions of each reach. The few exceptions were Reach 5.2 in 1870 and Reaches 7.5, 9.2 and 9.3 in 1955, in which the sinuous with alternate bars pattern was dominant, and Reach 9.4 in 1955, in which the wandering pattern prevailed.
Some of the detected changes in channel pattern in some selected reaches, representative of the entire Sabato River, are graphically reported in Figure 6.

3.1.4. Riverbed Elevation Changes

Field-surveyed topographic data are unquestionably the most reliable tool for detecting and measuring past processes of river incision. Unfortunately, such data were not available for this study. However, as reported in detail in Section 2.2, Magliulo et al. [30] have demonstrated that, in rivers similar to the Sabato R., the minimum annual hydrometric height is a good proxy of the riverbed elevation. In this study, the variation in the minimum annual hydrometric height measured at the Chianche stream gauge was used to infer variation trends in riverbed elevation. Results are reported in Figure 7. As we have stated in Section 2.2, due to some uncertainties in the elevation of the hydrometric zero, we preferred to maintain the data provided by Ministero LL.PP. [45], discontinuously covering the period 1967–1994 (Figure 7a), separate from those provided by Centro Funzionale Multirischi della Protezione Civile [46], continuously covering the period 2000–2014 (Figure 7b).
In the period 1967–1994, which entirely falls within Sub-phase 3B (see Section 3.1.2), a clear albeit limited riverbed lowering of ~50 cm seemed to emerge. This incision was interrupted by several aggradation episodes, after which riverbed incision often sharply reoccurred (e.g., in the period 1984–1994; Figure 7a).
In the period 2000–2014, which entirely falls within Phase 4 (Section 3.1.2), riverbed elevation underwent fluctuations (Figure 7b), describing a trend very similar to that of mean channel width (Section 3.1.2).
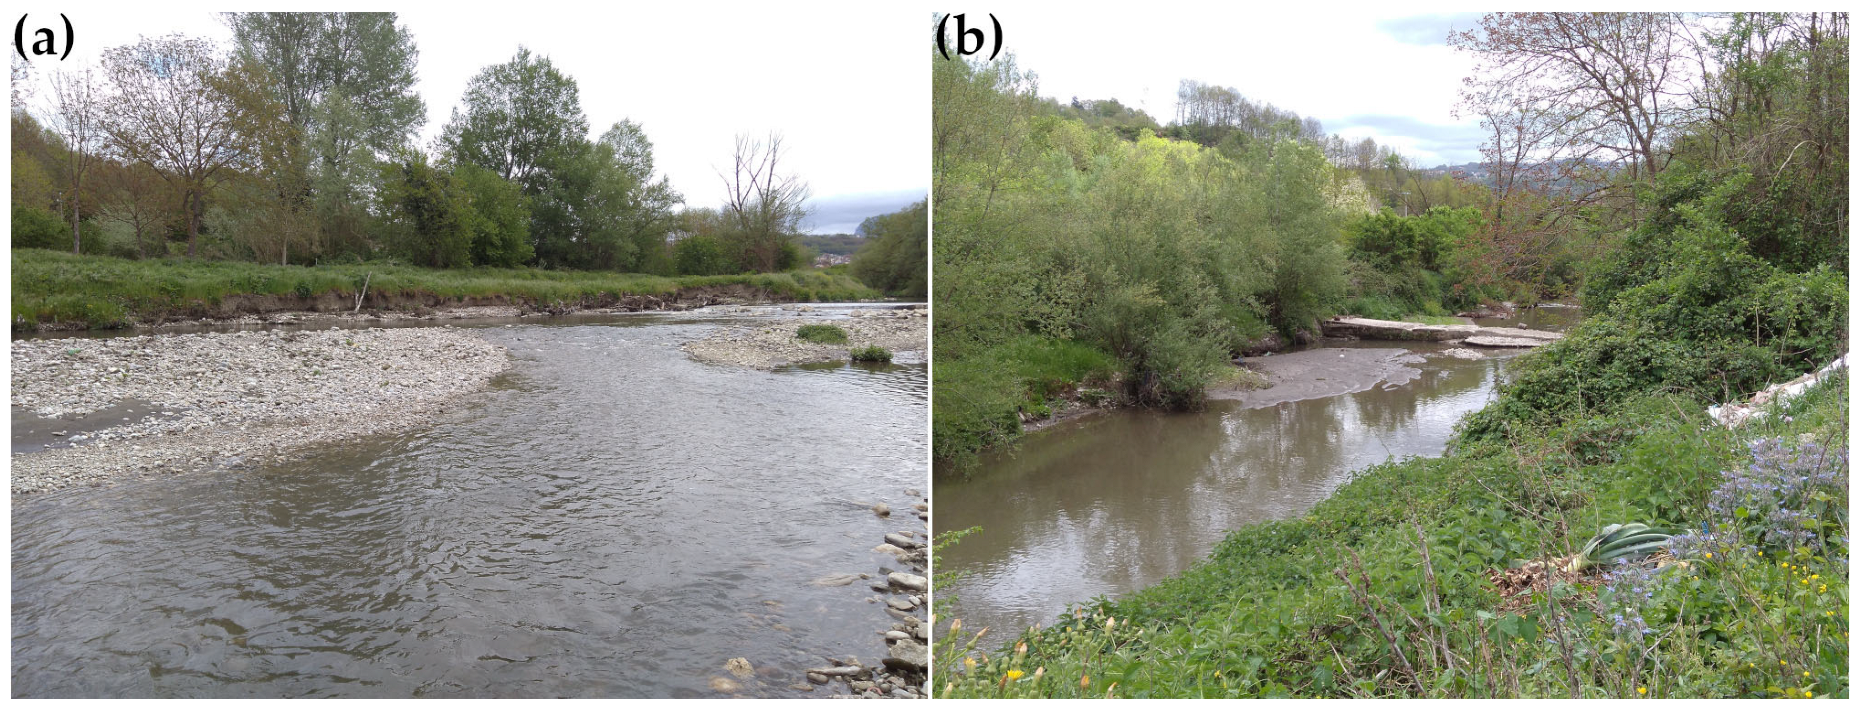
The detected phases of riverbed degradation were confirmed by abundant field evidence, such as remnants of terraced recent floodplains (Figure 8a) and exhumation of check dams, currently damaged by undermining processes (Figure 8b).

3.2. Controlling Factors

3.2.1. Land-Use Changes at the Basin Scale

It is widely accepted that land-use changes at the basin scale affect the type and intensity of erosion processes occurring on the slopes; these processes influence the amount of sediment delivered to the rivers, increasing or decreasing the sediment supply that, along with the liquid discharge, controls the morphological features of a channel and affects its changes over time [3,14,28,29,30].
To assess the role played by land-use changes on the channel adjustments experienced by the Sabato R., both an analysis of the pre-existing literature and the production of land-use maps were carried out.
Prior to the 1960s, no literature data specifically dealing with land-use changes in the Sabato R. basin existed. However, several papers report that, at the regional scale, diffuse and intense deforestation occurred in Southern Italy from the last decades of the 19th century to the 1930s [11,29]. Deforestation gradually decreased from the 1930s to the 1950s, and forest expansion, due to natural reforestation and reforestation measures, started to occur locally [11].
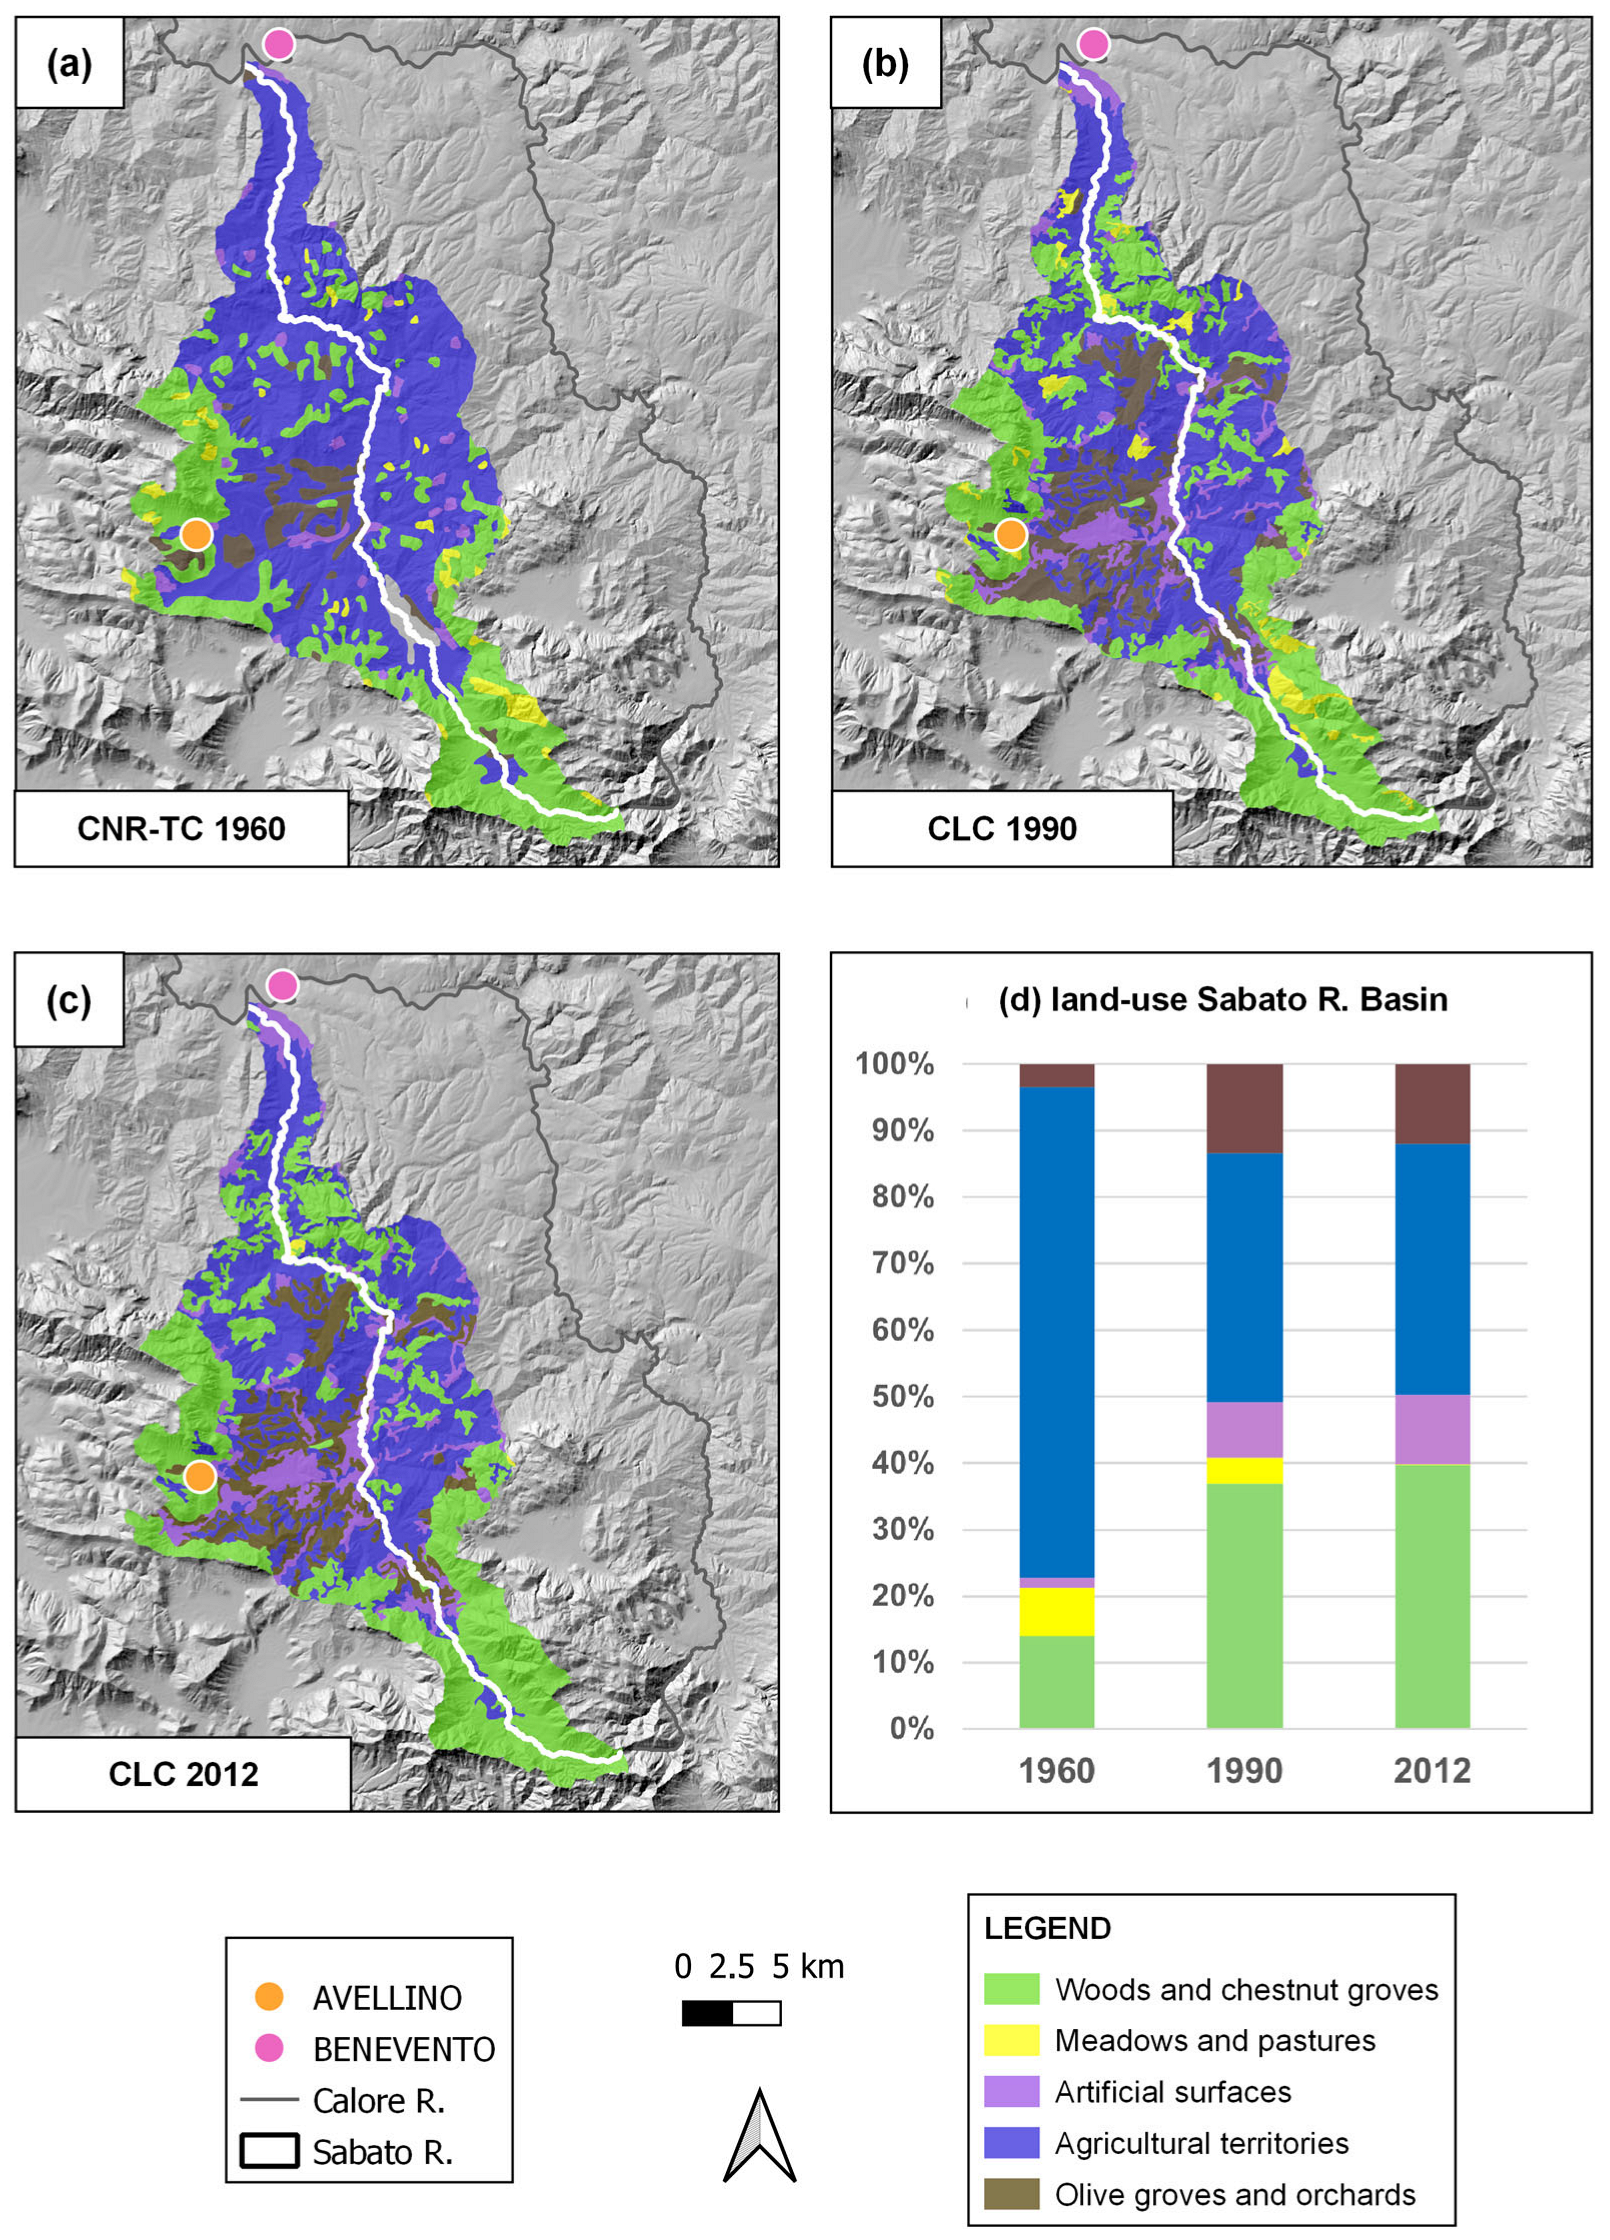
For the period from the 1960s to the 2010s, we produced three specific land-use maps for the Sabato R. basin by analyzing and processing data from CNR-TC 1960 Map [47] and the CLC data from 1990 and 2012 [48,49]. The results are reported in Figure 9. In particular, Figure 9d shows that woods and chestnut groves sharply increased from 1960 to 2012 (from ~14% to ~40% of the basin area), especially in the lower Sabato R. basin, particularly on its eastern side (Figure 9a–c). Similarly, artificial surfaces (from 2% to 10%) and olive groves and orchards (from 3% to 12%) also increased. In the same period, agricultural territories decreased from 74% of the total basin area in 1960 to 38% in 2012. Meadows and pastures accounted for ~7% of the basin area in 1960 and almost totally disappeared by 2012. Most of the land-use changes occurred between 1960 and 1990, rather than in the period 1990–2012 (Figure 9d).

3.2.2. Other Human Disturbances

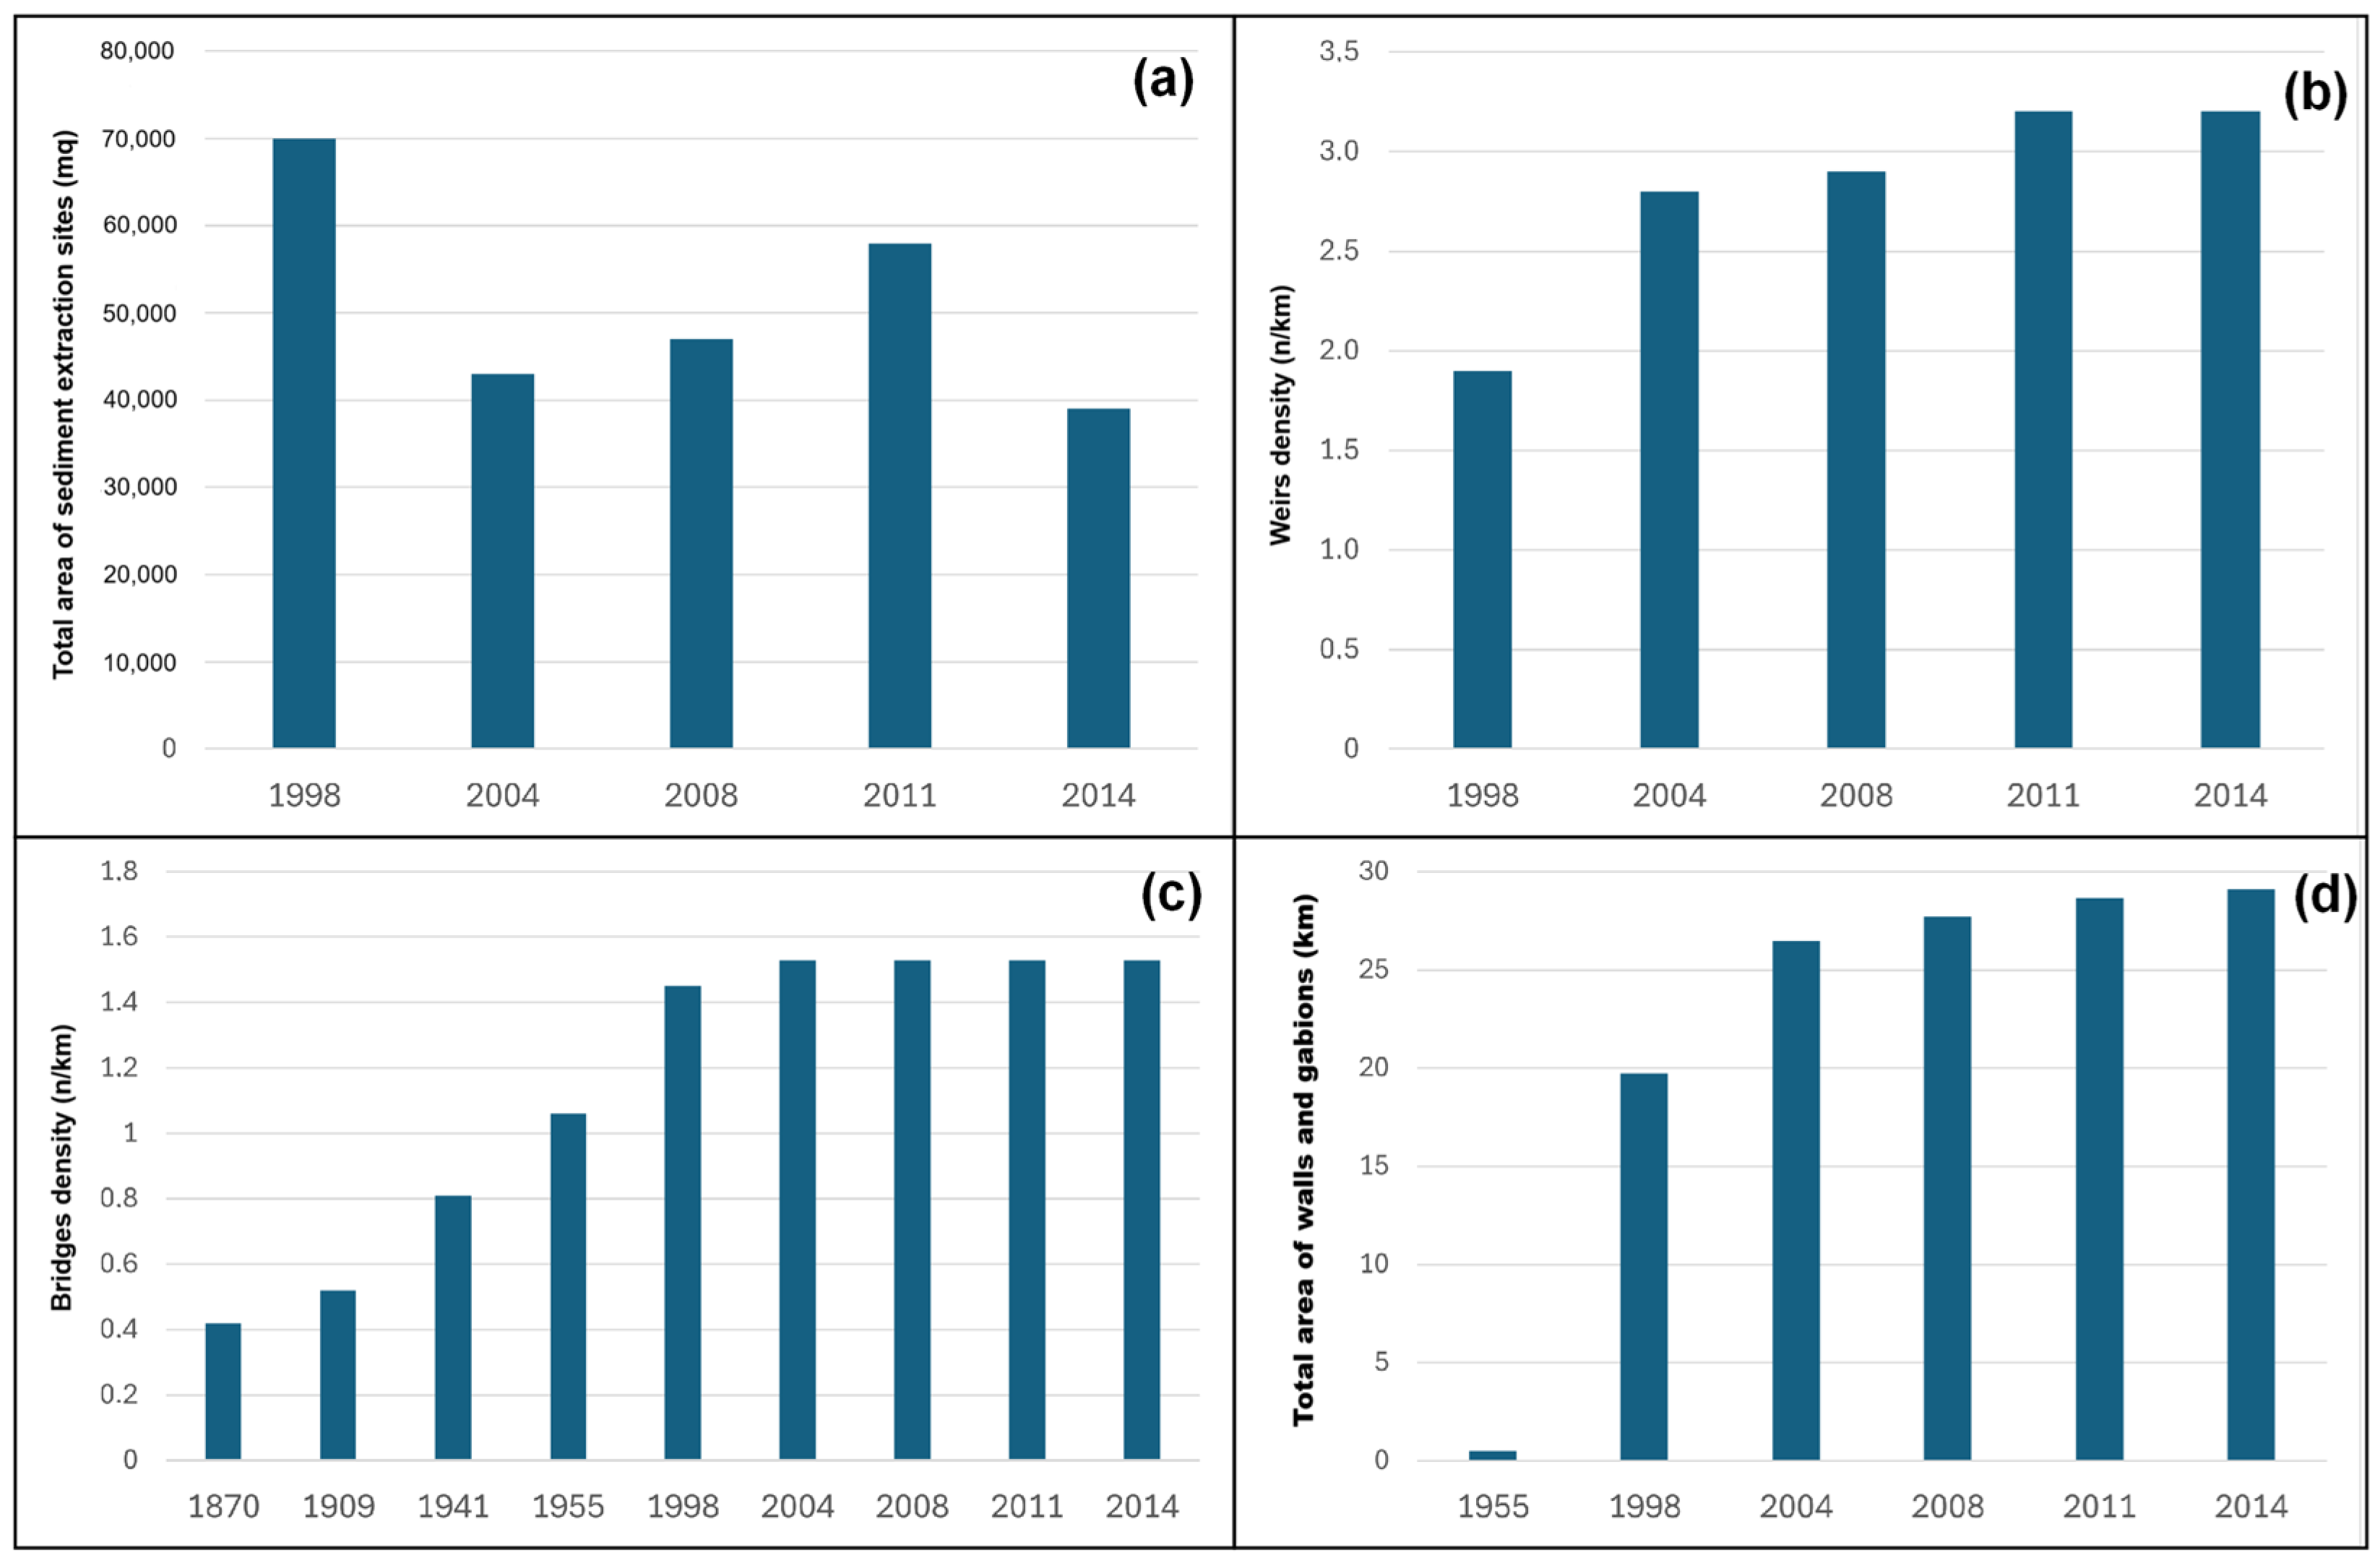
Several in-channel anthropic disturbances were detected and analyzed along the Sabato R. The main disturbances were sediment extraction, weirs, bridges with in-channel piles and riverbank protection. The results are reported in Figure 10.
It was demonstrated that sediment extraction from the riverbed greatly promotes channel incision [24,31]. Fortunately, in Italy, it was forbidden by law since the 1990s. Aerial photos interpretation allowed us to detect three sediment extraction sites along the Sabato R. For all the detected sites, it was not possible to determine precisely when the sediment extraction started. However, all the sites were not present on the aerial photos by IGMI from 1954 [51], while they were clearly observable on the orthophotos from 1988 available at the Geoportale Nazionale website [52]. Thus, extraction activities surely started at some moment between the late 1950s and the 1980s.
The first sediment extraction site was located at the confluence of the Sabato R. into the Calore R., in Reach 9.6. On the orthophotos from 1988 [52], clear evidence of in-channel sediment extraction was detected (i.e., anomalous in-channel accumulations of loose sediments in proximity of the site; “fresh”, un-vegetated artificial pathways connecting the site with the channel with tracks of heavy machinery; and so on). Sediment extraction in this site ceased between 1994 and 2000, and the site is currently inactive. The second extraction site is located in Reach 9.3. The site is currently active, and unfortunately, ongoing unlawful sediment extraction from the riverbed cannot be fully excluded. Finally, the third extraction site is located in Reach 8.2. Like the previous one, the site is currently active, but, differently, no evidence of current in-channel extraction of sediments was observed. According to the GIS analysis of the orthophotos we used (Table 1), at least in the period 1998–2014, the sites experienced areal variations in the surrounding alluvial plain, possibly reflecting periods of different intensity in their degree of activity (Figure 10a).
The analysis of weirs frequency was carried out for the period 1998–2014 only, as these structures, due to their small dimensions, were not reported on topographic maps and were not clearly identifiable on 1:34,000-scale IGMI aerial photos from 1954 [51]. The weir frequency along the Sabato R. was expressed as weir density (i.e., number of weirs per km), and the results are reported in Figure 10b. The results indicated a significant and progressive increase in weirs frequency between 1998 and 2014, with values ranging from 1.9 to 3.2 weirs per kilometer. The total number of weirs increased from 91 in 1998 to 152 in 2014.
The density of bridges (Figure 10c) was calculated for the entire analyzed time span (i.e., 1870–2014), as these infrastructures were easily identifiable on all the material we used. The density of bridges at different dates was obtained by dividing the number of bridges by the centerline length. The density value was 0.42 bridges/km in 1870, then slightly and gradually increased to 1.53 bridges/km in 2004 and, finally, remained constant in the following ten years.
Finally, we analyzed the total length of walls and gabions artificially protecting the Sabato R. banks in the period 1955–2014. The results are reported in Figure 10d and show a sharp increase in artificial confinement between 1955, when the total length of riverbank protections was less than 1 km, and 1998, when this length increased to ~20 km. This value further increased to ~27 km in 2004 and to ~29 km in 2014. Worth noting is the fact that the entire river segment that crosses the urban settlement of Atripalda (Figure 1a) was artificially straightened and channelized concurrently with urban expansion since the last decades of the 19th century.

3.3. Hydrological Data

The hydrological data we analyzed in this study are rainfall and maximum annual hydrometric height (Hmax). Given the unavailability of flow discharge data, the latter were the best available proxy for reconstructing the flood events experienced by the Sabato R. On the other hand, rainfall data contributed to inferring the intensity of erosion on slopes, which, in turn, controls the sediment supply to the rivers and the associated geomorphological changes.
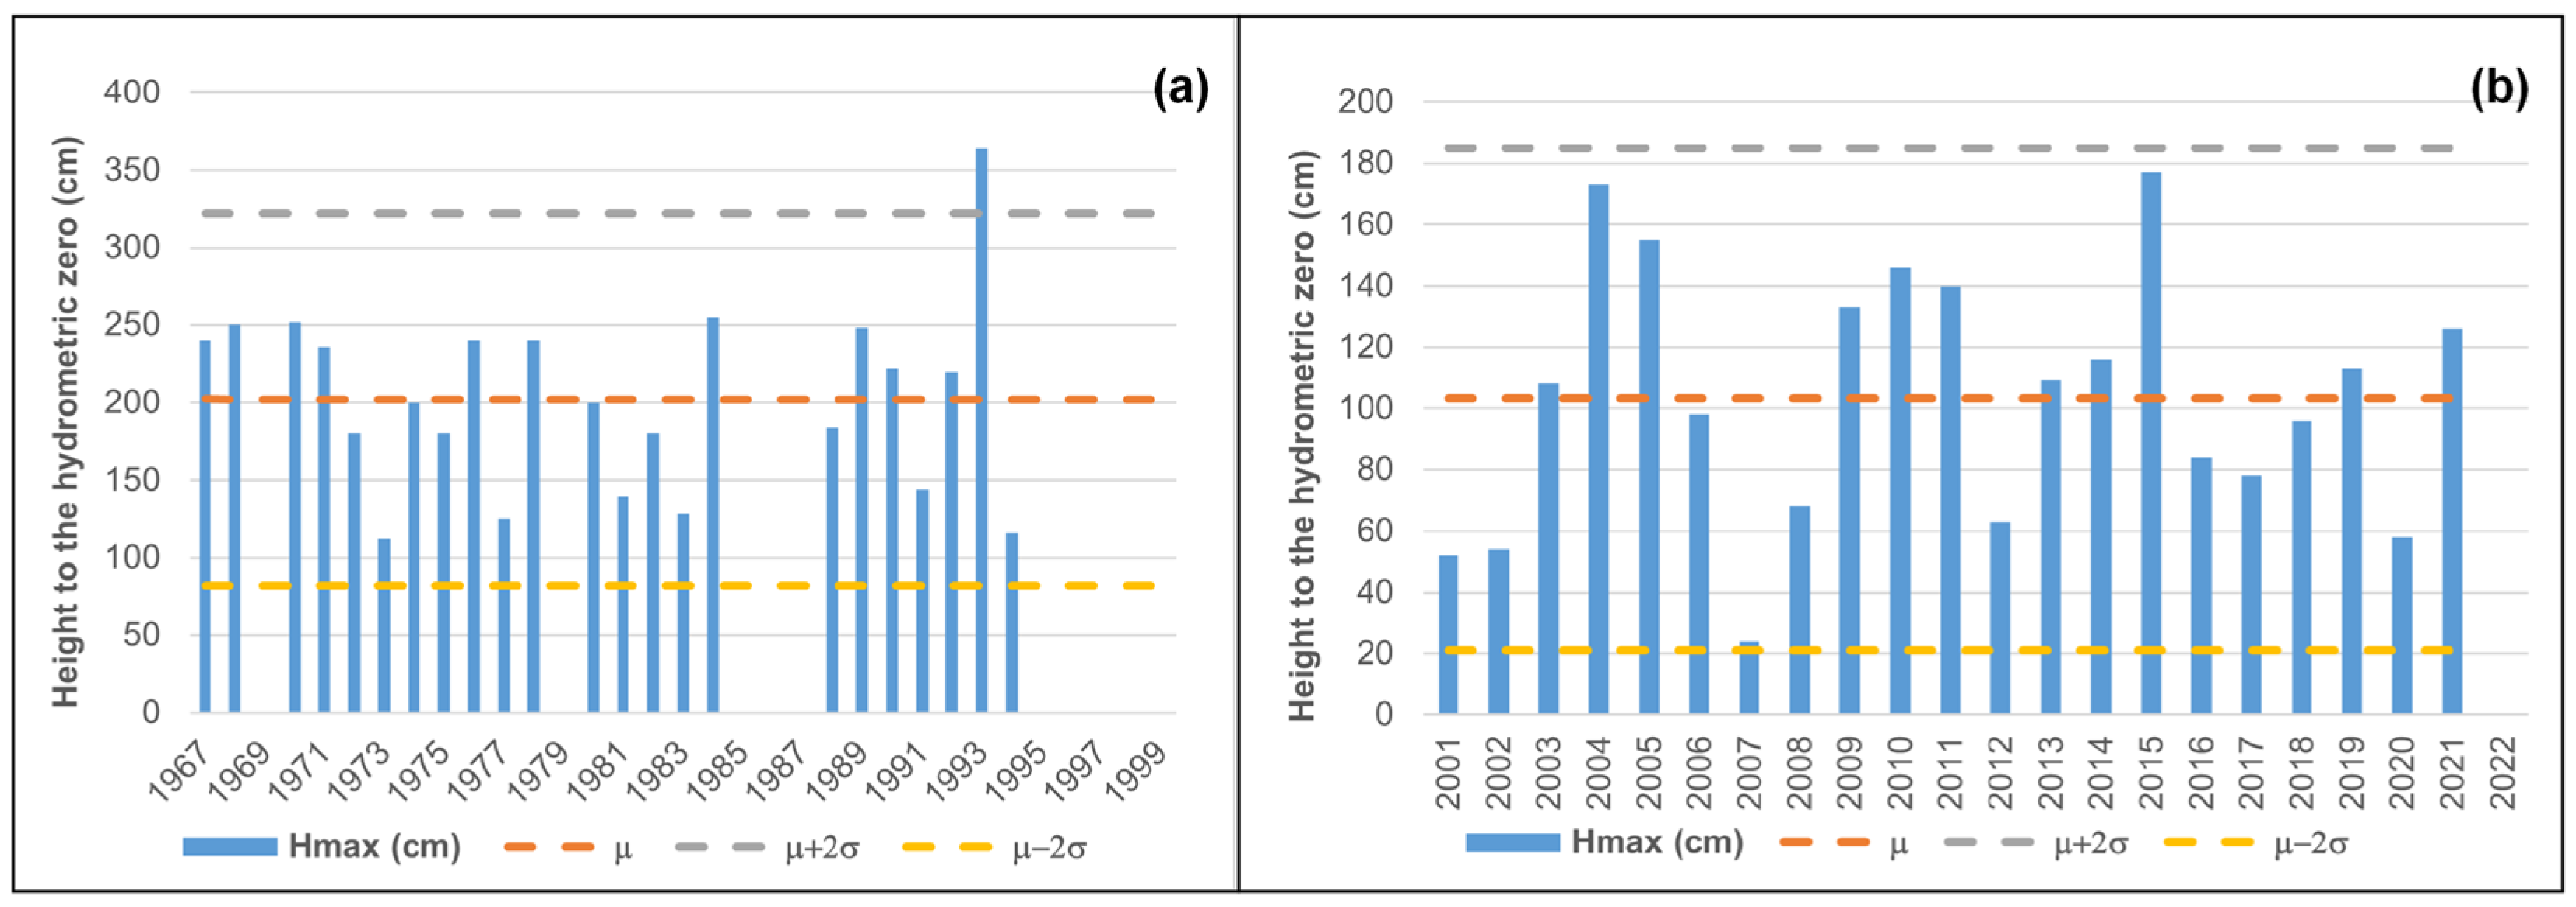
Along the Sabato R., two stream-gauge stations are present: Atripalda and Chianche (Figure 1a). The series from the Atripalda stream gauge were not considered in this study as they are extremely short and incomplete. Differently, the series from the Chianche stream-gauge station are relatively longer, as they cover the period 1967–1994, with only five years without measurements. These data were published by Ministero LL.PP. [45] and are reported in Figure 11a. During this period, which entirely falls within Phase 3b (see Section 3.1.2), a single extreme flood event occurred in 1993 (Figure 11a). It can also be noted that 23 out of 33 measurements (i.e., 70%) were higher than μ.
Measurements at the Chianche stream-gauge station stopped in 1994, and no further measurements were carried out since 2000. After 2000, measurements reprised and were collected and published by Centro Funzionale Multirischi della Protezione Civile, Regione Campania [46]. Unfortunately, they are not linked to the older data as the hydrometric zero altitude a.s.l., the location of the stream-gauge station and, finally, the measurements techniques changed. Thus, we decided to separate them from the older data. The results are reported in Figure 11b and entirely cover the period 2000–2014, which falls within Phase 4 (see Section 3.1.2). For the sake of completeness, data from 2014 to 2021 are also reported. It can be observed that, during Phase 4, no extreme events occurred (Figure 11b). It was also observed that in 11 out of the 22 considered years (i.e., in 50% of the considered years), Hmax was higher than μ.
As far as rainfall is concerned, data availability began in 1918 (Table 5). Thus, available data allowed us to characterize three of the four morpho-evolutionary phases of the Sabato R. in terms of rainfall. Table 5 shows that the aforementioned phases were very similar from a rainfall point of view, with an average annual total rainfall always hovering around 1100 mm/year.

4. Discussion

The reach-scale analysis we used in this study proved to be fundamental for data production. Differently from the analysis at the river scale, the reach-scale analysis allowed us to define the geomorphological changes of the investigated river more precisely and assess their spatial homogeneity throughout the entire Sabato R., thus better discriminating and/or highlighting the role of local factors as opposed to basin-scale factors. For the Sabato R, in particular, this type of analysis was fundamental due to the strong influence of human disturbances on geomorphological changes (Section 3.2.1 and Section 3.2.2). For the sake of readability, the detected changes will be discussed below according to the morphoevolutionary phases described in Section 3.1.2. The produced data have also allowed reconstructing the morphoevolutionary trajectory of the Sabato R., which is shown in Figure 12.

4.1. Phase 1 (~1870–1909)

This first phase was characterized by an almost total lack of data dealing with controlling factors at both the basin and river scales for the Sabato R.; thus, the detected geomorphological changes were harder to discuss than those observed in the following morphoevolutionary phases.
During Phase 1, the Sabato R. mean active channel width remained substantially unchanged (Figure 2, Figure 3 and Figure 4a,e), and the sinuous channel morphology remained strikingly dominant (Figure 5 and Figure 6a,b,f,g). These data are in good accordance with what was observed by Scorpio et al. [11] in other rivers of Southern Italy, as these authors found an absence of common trends in channel width changes and modest river pattern variations.
As regards the controlling factors, as stated above, no data focusing on the Sabato R. basin or dealing with in-channel human disturbances exist in the literature. At the regional scale, several papers [29,53] report that diffuse deforestation affected Southern Italy from the last decades of the 19th century to the 1930s, in the framework of a humid climate with extreme rainfall events and an increase in frequency of floods [54,55]. These environmental conditions are coherent with an increase in erosion on slopes and associated increases in sediment supply to the rivers. Generally, such conditions induce river widening and increases in braided and/or transitional channel morphologies [29]. Because these changes were not observed in the Sabato R., assuming a constant climate at the regional scale, it is possible that deforestation did not affect, or affected at a lesser extent compared to other basins, the Sabato R. basin during this phase. However, this is unquestionably an open problem that will be investigated in future studies.

4.2. Phase 2 (~1909–1941)

During this phase, the Sabato R. underwent a diffuse widening for almost its entire length (Figure 2, Figure 3 and Figure 4b,f), with few and localized changes in channel pattern (Figure 5 and Figure 6b,c,g,h). This is consistent with the findings by Scorpio et al. [11] and Scorpio and Piégay [29] for other Italian rivers. Even if no flow discharge and/or hydrometric data exist for Phase 2, floods could have been the main cause of the detected channel widening. In fact, as reported in the literature [54,55], at least until the 1930s, the climate in Southern Italy was particularly humid with extreme events, and the frequency of floods was high. The ability of floods to cause significant widening in river channels has long been recognized [20,21,22]. On the other hand, similarly to the previous phase, the absence of significant changes in channel morphology suggests no significant changes in sediment supply from the slopes to the Sabato R., notwithstanding the humid climate. This could be explained by the absent or low deforestation at the basin scale during this phase, suggesting, as in the previous phase, that the diffuse removal of forests that affected most of Southern Italy from the end of the 19th century to the 1930s [29,53] might not have occurred in the Sabato R. basin. In fact, if deforestation had occurred, given the climatic features of Phase 2, significant increases in sediment supply to the river and associated increases in braided and/or transitional channel morphologies would have been expected.

4.3. Phase 3 (~1941–1998)

This third phase is characterized by the total or strongly dominant narrowing of the Sabato R. active channel. However, as will be detailed later, it is reasonable to further divide this phase into two sub-phases (3A and 3B), based on both the different homogeneity of the narrowing along the Sabato R. (Figure 3) and the different rates of average annual narrowing (Table 3).

4.3.1. Sub-Phase 3A (~1941–1955)

During Sub-phase 3A (~1941–1955) a diffuse narrowing affected the active channel of the Sabato R. (Figure 2, Figure 3 and Figure 4c,g) at very high mean annual rates (Table 3). This narrowing was nearly total, as ~80% of the river underwent this process. This suggests a control at the basin scale. A central role in this sense could have been played by the afforestation that, since the 1930s, affected many sub-basins of Southern Italy [29,53]. Because, as stated in the previous sections, our data suggest that the Sabato R. basin probably did not experience the previous phase of deforestation (i.e., the one that occurred between the last decades of the 19th century and the 1930s), the “new” forests were probably added to the older ones, increasing the areal protection of slopes against erosion. In this framework, a reduced sediment supply to the river is expected, which could, in turn, explain the narrowing observed during this sub-phase.
However, the reaches of the Sabato R. crossing the town of Benevento (i.e., Reaches 9.3, 9.4, and 9.6) experienced a completely contrasting evolutionary trend, characterized by significant widening (Figure 2 and Figure 3; Table 3) and an increase in transitional (i.e., wandering and sinuous with alternated bars; Figure 5) and even braided patterns (Figure 6d). This framework is coherent with an increase in sediment supply to the river from the surrounding slopes [44]. To explain this discrepancy, it should be mentioned that, in the period 1941–1955, the town of Benevento was first heavily bombed during the Second World War and, then, rapidly rebuilt [56]. The bombing produced large volumes of debris, while the following reconstruction was characterized by large earthmoving. In both cases, huge volumes of loose materials were available to be removed by runoff and, then, supplied to the river, widening the active channel and promoting the development of transitional channel morphologies [57]. Thus, the channel adjustments experienced by the Sabato River during this sub-phase showed a clear difference between the “urban” reaches and the remaining Sabato R.: while afforestation favored channel narrowing in most of the river, the increased sediment supply in urban reaches, due to war-related and post-war anthropogenic events, resulted in totally different geomorphological behaviors.

4.3.2. Sub-Phase 3B (~1955–1998)

During Sub-phase 3B (1955–1998), the narrowing of the Sabato River was slower compared with the previous sub-phase (0.50 m/year compared to 1.78 m/year; Table 3), but affected the entire channel without exceptions (Figure 2, Figure 3 and Figure 4c,g). This last result strongly suggested a dominant control at the basin scale of these channel adjustments. In particular, the percentage of the basin area covered by forests almost tripled between 1960 and 1990, while the percentage of the basin area consisting of artificial surfaces increased by five times (Figure 9). In particular, the completion of the Rione Libertà district in Benevento during Sub-phase 3B led to the impervious cover of those areas that, during Sub-phase 3A, supplied large amounts of sediment to the “urban” reaches of the Sabato R. (see Section 4.3.1). According to a vast body of literature [7,8,11,29,57], these land-use changes likely significantly reduced sediment supply to the river, promoting the detected narrowing (Figure 2, Figure 3 and Figure 4c,g), incision (Figure 7a) and development of a sinuous channel pattern (Figure 6c,d,h,i; Table 4). Differently, rainfall variations did not appear to have a significant impact, as the mean annual value remained almost unchanged compared to Sub-phase 3A (Table 5).
On this control at the basin scale, human disturbances that favored narrowing and incision were dramatically superimposed at the reach scale (Figure 10). In fact, this sub-phase was characterized by the construction of the majority of the in-channel hydraulic structures along the Sabato R. In particular, it is well known that weirs, whose density along the Sabato R. doubled during Sub-phase 3b (Figure 10b), trap sediment upstream, promoting incision and narrowing downstream, thus contributing to these processes along the river [58]. Additionally, during this period, sites that extracted sediments from the riverbed were fully active, as they were only outlawed in the late 1990s. A vast body of literature [24,31] has proved their central role in causing narrowing and incision at the local scale. Finally, Sub-phase 3B saw the artificial channelization of some Sabato R. segments and the construction of most riverbank protection structures, further reducing sediment supply due to riverbed and bank erosion.
The fluvial processes (i.e., intense and diffuse narrowing, incision and changes towards single-thread channel patterns) that characterized the entire morphoevolutionary Phase 3 of the Sabato R. are in good accordance with what has been observed, in the same period, in other rivers located in Southern Italy [10,11,12,13,14,15,23], in the central and northern part of the Italian peninsula [7,8,9], in Europe [1,2,6,17,26] and even in other continents [4,5]. The central role played by afforestation coupled with in-channel anthropogenic disturbances in the Sabato R. geomorphological changes during this phase is absolutely coherent with the findings of many authors [2,3,12,13,14,28,29,30].

4.4. Phase 4 (~1998–2014)

Data about Phase 4 allowed us to analyze the channel adjustments of the Sabato R. with a higher temporal resolution. This phase was characterized by alternating narrowing and widening over short periods (Figure 2 and Figure 3; Table 3). Similarly, high-frequency alternating episodes of incision and aggradation were detected (Figure 7b). Conversely, channel patterns remained almost unchanged, with a striking predominance of sinuous morphologies (Figure 5 and Figure 6d,e,i,l; Table 4), which are in good agreement with reduced sediment supply from slopes that are now densely covered by forests, which occupy more than one-third of the basin area, and are sealed by impervious cover in 10% of their extension (Figure 9d). The incision and narrowing promoted by this reduced sediment supply were increased by the construction of new in-channel hydraulic structures such as weirs, even if at lower rates compared with the previous sub-phase (Figure 10b), and, possibly, by unlawful sediment extraction from the riverbed. This phase of narrowing/incision was interrupted by flood-induced episodes of widening/aggradation (Figure 3). In the literature, the capacity of extreme floods in inducing channel widening and changes to multi-thread channel patterns is well documented [20,21,22,30]. However, it is worth noting that no extreme floods occurred during Phase 4, but several floods higher than the long-term average (μ) have been detected (Figure 11b). This means that, in a small river, as the Sabato R. currently is, even non-extreme floods are capable of significantly changing the channel features. This is the case of the three floods that occurred in 2009, 2010 and 2011 (Figure 11b), all of them higher than μ, but not extreme (i.e., not exceeding μ+2σ). These three floods induced a significant widening of the entire river (Figure 3) with associated riverbed aggradation (Figure 7b) in the period 2008–2011.

5. Conclusions

This study allowed us to reconstruct the channel adjustments of the Sabato R. over 150 years, providing new data aimed at both defining similarities and differences in the morphoevolutionary trends of rivers in Southern Italy and highlighting the role played by natural and anthropogenic controlling factors. The obtained results will allow river management, hazard mitigation and environmental planning, according to a vast body of pre-existing scientific literature. A reach-scale analysis in a GIS environment proved to be a powerful tool for better defining morphoevolutionary phases, as it allows both an assessment of the homogeneity of channel adjustments throughout the river and a better separation of the role played by local controlling factors from those acting at the basin scale. The lack of land-use, hydrological and anthropogenic disturbance data at older dates still remains the hardest problem for the precise definition of the causes of the older morphoevolutionary phases and, more generally, for their discussion and interpretation.
The four morphoevolutionary phases that we have detected for the Sabato R. are in good accordance with those defined for other rivers in Southern Italy and, more generally, in the Mediterranean area. Land-use changes resulted in being the main controlling factor acting at a basin scale, while in-channel human disturbances mainly acted at the local scale. Finally, in recent years, floods higher than the long-term average, even when not extreme, proved to be the most effective controlling factor,.

Author Contributions

Conceptualization, P.M.; methodology, P.M.; software, E.G.D. and F.M.; validation, F.M., F.A., E.G.D., F.R. and P.M.; formal analysis, F.M., F.A., E.G.D. and P.M.; investigation, F.M.; resources, P.M.; data curation, F.M., F.A. and E.G.D.; writing—original draft preparation, F.M.; writing—review and editing, P.M. and F.R.; visualization, F.M., E.G.D. and P.M.; supervision, P.M.; project administration, P.M. and F.R.; funding acquisition, P.M. All authors have read and agreed to the published version of the manuscript.

Funding

This research was funded by Università degli Studi del Sannio, FRA 2019 (Responsible: Paolo Magliulo).

Conflicts of Interest

The authors declare no conflicts of interest.

References

  1. Winterbottom, S.J. Medium and short-term channel planform changes on the Rivers Tay and Tummel, Scotland. Geomorphology 2000, 34, 195–208. [Google Scholar] [CrossRef]
  2. Liébault, F.; Piégay, H. Causes of twentieth century channel narrowing in mountain and Piedmont rivers of southeastern France. Earth Surf. Process. Landf. 2002, 27, 425–444. [Google Scholar] [CrossRef]
  3. Hooke, J.M. Human impacts on fluvial systems in the Mediterranean region. Geomorphology 2006, 79, 311–335. [Google Scholar] [CrossRef]
  4. Yao, Z.; Xiao, J.; Jia, X. Planform channel dynamics along the Ningxia-Inner Mongolia reaches of the Yellow river from 1958 to 2008: Analysis using Landsat images and topographic maps. Environ. Earth Sci. 2012, 70, 97–106. [Google Scholar] [CrossRef]
  5. Heitmuller, F.T. Channel adjustments to historical disturbances along the lower Brazos and Sabine River, south-central USA. Geomorphology 2014, 204, 382–398. [Google Scholar] [CrossRef]
  6. Rădoane, M.; Obreja, F.; Cristea, I.; Mihailă, D. Changes in the channel-bed level of the eastern Carpathian rivers: Climatic vs. human control over the last 50 years. Geomorphology 2013, 193, 91–111. [Google Scholar] [CrossRef]
  7. Surian, N.; Rinaldi, M. Morphological response to river engineering and management in alluvial channels in Italy. Geomorphology 2003, 50, 307–326. [Google Scholar] [CrossRef]
  8. Surian, N.; Rinaldi, M.; Pellegrini, L.; Audisio, C.; Maraga, F.; Teruggi, L.; Turitto, O.; Ziliani, L. Channel adjustments in northern and central Italy over the last 200 years. In Management and Restoration of the Fluvial Systems with Broad Historical Changes and Human Impacts; James, L.A., Rathburn, S.L., Whittecar, G.R., Eds.; Geological Society of America: Boulder, CO, USA, 2009; Special Paper 451; pp. 83–95. [Google Scholar] [CrossRef]
  9. Marchese, E.; Scorpio, V.; Fuller, I.; McColl, S.; Comiti, F. Morphological changes in Alpine rivers following the end of the Little Ice Age. Geomorphology 2017, 295, 811–826. [Google Scholar] [CrossRef]
  10. Magliulo, P.; Valente, A.; Cartojan, E. Recent morphological changes of the middle and lower Calore river (Campania, Southern Italy). Environ. Earth Sci. 2013, 70, 2785–2805. [Google Scholar] [CrossRef]
  11. Scorpio, V.; Aucelli, P.P.C.; Giano, I.; Pisano, L.; Robustelli, G.; Rosskopf, C.M.; Schiattarella, M. River channel adjustment in Southern Italy over the past 150 years and implications for channel recovery. Geomorphology 2015, 251, 77–90. [Google Scholar] [CrossRef]
  12. Magliulo, P.; Cusano, A. Geomorphology of the lower Calore River Alluvial Plain (Southern Italy). J. Maps 2016, 5, 1119–1127. [Google Scholar] [CrossRef]
  13. Magliulo, P.; Bozzi, F.; Pignone, M. Assessing the planform changes of the Tammaro River (southern Italy) from 1870 to 1955 using a GIS-aided historical map analysis. Environ. Earth Sci. 2016, 75, 355. [Google Scholar] [CrossRef]
  14. Scorpio, V.; Rosskopf, C.M. Channel adjustments in a Mediterranean river over the last 150 years in the context of anthropic and natural controls. Geomorphology 2016, 275, 90–104. [Google Scholar] [CrossRef]
  15. de Musso, N.M.; Capolongo, D.; Caldara, M.; Surian, N.; Pennetta, L. Channel changes and controlling factors over the past 150 years in the Basento River (Southern Italy). Water 2020, 12, 307. [Google Scholar] [CrossRef]
  16. Knox, J.C. Large increases in flood magnitude in response to modest changes in climate. Nature 1993, 361, 430–432. [Google Scholar] [CrossRef]
  17. Kiss, T.; Blanka, V. River channel response to climate- and human-induced hydrological changes: Case study on the meandering Hernád River, Hungary. Geomorphology 2012, 175–176, 115–125. [Google Scholar] [CrossRef]
  18. Lespinas, F.; Ludwig, W.; Heussner, S. Hydrological and climatic uncertainties associated with modeling the impact of climate change on water resources of small Mediterranean coastal rivers. J. Hydrol. 2014, 511, 403–422. [Google Scholar] [CrossRef]
  19. Cienciala, P.; Pasternack, G.B. Floodplain inundation response to climate, valley form, and flow regulation on a gravel-bed river in a Mediterranean-climate region. Geomorphology 2017, 282, 1–17. [Google Scholar] [CrossRef]
  20. Nardi, L.; Rinaldi, M. Spatio-temporal patterns of channel changes in response to a major flood event: The case of the Magra River (central–northern Italy). Earth Surf. Process. Land. 2015, 40, 326–339. [Google Scholar] [CrossRef]
  21. Righini, M.; Surian, N.; Wohl, E.; Marchi, L.; Comiti, F.; Amponsah, W.; Borga, M. Geomorphic response to an extreme flood in two Mediterranean rivers (northeastern Sardinia, Italy): Analysis of controlling factors. Geomorphology 2017, 290, 184–199. [Google Scholar] [CrossRef]
  22. Surian, N.; Righini, M.; Lucía, A.; Nardi, L.; Amponsah, W.; Benvenuti, M.; Borga, M.; Cavalli, M.; Comiti, F.; Marchi, L.; et al. Channel response to extreme floods: Insights on controlling factors from six mountain rivers in northern Apennines Italy. Geomorphology 2016, 272, 78–91. [Google Scholar] [CrossRef]
  23. Magliulo, P.; Valente, A. GIS-based geomorphological map of the Calore River flood plain near Benevento (Southern Italy) overflooded by the 15th October 2015 event. Water 2020, 12, 148. [Google Scholar] [CrossRef]
  24. Kondolf, G.M. Geomorphic and environmental effects of instream gravel mining. Landsc. Urban Plan. 1994, 28, 225–243. [Google Scholar] [CrossRef]
  25. Calle, M.; Alho, P.; Benito, G. Channel dynamics and geomorphic resilience in an ephemeral Mediterranean river affected by gravel mining. Geomorphology 2017, 285, 333–346. [Google Scholar] [CrossRef]
  26. Brookes, A.; Gregory, K.J. An assessment of river channelization in England and Wales. Sci. Total Environ. 1983, 27, 97–111. [Google Scholar] [CrossRef]
  27. Fortugno, D.; Boix-Fayos, C.; Bombino, G.; Denisi, P.; Quiñonero Rubio, J.M.; Tamburino, V.; Zema, D.A. Adjustments in channel morphology due to land-use changes and check dam installation in mountain torrents of Calabria (southern Italy). Earth Surf. Process. Landf. 2017, 42, 2469–2483. [Google Scholar] [CrossRef]
  28. Boix-Fayos, C.; Barbera, G.G.; Lopez-Bermudez, F.; Castillo, V.M. Effects of check dams, reforestation and land-use changes on river channel morphology: Case study of the Rogativa catchment (Murcia Spain). Geomorphology 2007, 91, 103–123. [Google Scholar] [CrossRef]
  29. Scorpio, V.; Piégay, H. Is afforestation a driver of change in Italian rivers within the Anthropocene era? Catena 2021, 198, 105031. [Google Scholar] [CrossRef]
  30. Magliulo, P.; Bozzi, F.; Leone, G.; Fiorillo, F.; Leone, N.; Russo, F.; Valente, A. Channel Adjustments over 140 years in response to extreme floods and land use change, Tammaro River, southern Italy. Geomorphology 2021, 383, 18. [Google Scholar] [CrossRef]
  31. Rinaldi, M.; Wyżga, B.; Surian, N. Sediment mining in alluvial channels: Physical effects and management perspectives. River Res. Appl. 2005, 21, 805–828. [Google Scholar] [CrossRef]
  32. Brierley, G.J.; Fryirs, K.A. Geomorphology and River Management. Applications of the River Styles Framework; Blackwell: Oxford, UK, 2005; 398p. [Google Scholar]
  33. Brierley, G.J.; Fryirs, K.A.; Boulton, A.; Cullum, C. Working with change: The importance of evolutionary perspectives in framing the trajectory of river adjustment. In River Futures. An Integrative Scientific Approach to River Repair; Brierley, G.J., Fryirs, K.A., Eds.; Island Press: Washington, DC, USA, 2008; pp. 65–84. [Google Scholar]
  34. Dufour, S.; Piegay, H. From the myth of a lost paradise to targeted river restoration: Forget natural references and focus on human benefits. River Res. Appl. 2009, 24, 568–581. [Google Scholar] [CrossRef]
  35. Rinaldi, M.; Surian, N.; Comiti, F.; Bussettini, M. A method for the assessment and analysis of the hydromorphological condition of Italian streams: The Morphological Quality Index (MQI). Geomorphology 2013, 180–181, 96–108. [Google Scholar] [CrossRef]
  36. Rinaldi, M.; Teruggi, L.B.; Simoncini, C.; Nardi, L. Dinamica recente ed attuale di alvei fluviali: Alcuni casi studio appenninici (Italia centro–settentrionale). Alp. Mediterr. Quat. 2008, 21, 291–308. [Google Scholar]
  37. Magliulo, P. Quaternary deposits and geomorphological evolution of the Telesina Valley (Southern Apennines). Geogr. Fis. Dinam. Quat. 2005, 28, 125–146. [Google Scholar]
  38. Bonardi, G.; D’Argenio, B.; Perrone, V. Geological map of Southern Apennines. Mem. Soc. Geol. It. 1988, 41. [Google Scholar]
  39. Slama, C.C.; Henriksen, S.W.; Theurer, C. Manual of Photogrammetry, 4th ed.; American Society of Photogrammetry: Falls Church, VI, USA, 1980; p. 1056. [Google Scholar]
  40. Taylor, J.R. An Introduction to Error Analysis; University Science Books: Sausalito, CA, USA, 1982; 327p. [Google Scholar]
  41. Rinaldi, M.; Surian, N.; Comiti, F.; Bussettini, M. A methodological framework for hydromorphological assessment, analysis and monitoring (IDRAIM) aimed at promoting integrated river management. Geomorphology 2015, 251, 122–136. [Google Scholar] [CrossRef]
  42. Surian, N.; Ziliani, L.; Cibien, L.; Cisotto, A.; Baruffi, F. Variazioni morfologiche degli alvei dei principali corsi d’acqua veneto-friuliani negli ultimi 200 anni. Alp. Mediterr. Quat. 2008, 21, 233–340. [Google Scholar]
  43. Schumm, S.A. A Tentative Classification of Fluvial River Channels; US Geological Survey Circular; United States Department of the Interior: Washington, DC, USA, 1963; p. 477. [Google Scholar]
  44. Rinaldi, M. Recent channel adjustments in alluvial rivers of Tuscany, Central Italy. Earth Surf. Process. Landf. 2003, 6, 507–608. [Google Scholar] [CrossRef]
  45. Ministero LL.PP. Annali Idrologici. Servizio Idrografico e Mareografico di Napoli, 1921–1999. Available online: https://centrofunzionale.regione.campania.it/#/pages/documenti/annali (accessed on 25 May 2005).
  46. Centro Funzionale Multirischi della Protezione Civile, Regione Campania. Available online: https://centrofunzionale.regione.campania.it/ (accessed on 25 May 2005).
  47. National Research Council (CNR)—Direzione Generale del Catasto. Carta Dell’utilizzazione del Suolo in Italia Alla Scala 1:200,000; Touring Club: Milan, Italy, 1960. [Google Scholar]
  48. Copernicus—Land Monitoring Service. Available online: https://land.copernicus.eu/pan-european/corine-land-cover/clc-1990 (accessed on 25 May 2025).
  49. Copernicus—Land Monitoring Service. Available online: https://land.copernicus.eu/pan-european/corine-land-cover/clc2012 (accessed on 25 May 2025).
  50. Magliulo, P.; Cusano, A.; Sessa, S.; Beatrice, M.; Russo, F. Multidecadal land-use changes and implications on soil protection in the Calore River Basin landscape (Southern Italy). Geosciences 2022, 12, 156. [Google Scholar] [CrossRef]
  51. IGMI. Available online: https://www.igmi.org/it/geoprodotti/foto-aeree/1954 (accessed on 25 May 2025).
  52. Geoportale Nazionale. Available online: http://www.pcn.minambiente.it/viewer/ (accessed on 25 May 2025).
  53. Diodato, N.; Santoni, G.; Cevasco, A.; Fiorillo, F.; Bellocchi, G. Damaging hydrological events during the exiting of the Little Ice Age in the highland area of Southern Italy. Int. J. Hydrol. Sci. Technol. 2021, 11, 136–165. [Google Scholar] [CrossRef]
  54. Brunetti, M.; Maugeri, M.; Monti, F.; Nanni, T. Changes in daily precipitation frequency and distribution in Italy over the last 120 years. J. Geophys. Res. Atmospheres 2004, 109, D05102. [Google Scholar] [CrossRef]
  55. Diodato, N. Climatic fluctuations in southern Italy since the 17th century: Reconstruction with precipitation records at Benevento. Climatic Change 2007, 80, 411–431. [Google Scholar] [CrossRef]
  56. Cresta, A. Le trasformazioni urbano-rurali del territorio beneventano attraverso le fonti cartografiche. In Agricoltura e Territorio. Alle Radici dello Sviluppo Agricolo nel Sannio; Ferrandino, V., Ed.; Franco Angeli Publisher: Milan, Italy, 2010; pp. 93–120. [Google Scholar]
  57. Keller, E.A. Introduction to Environmental Geology, 5th ed.; Prentice Hall: New York, NY, USA, 2012; 705p. [Google Scholar]
  58. Schumm, S.A. River Adjustment to Altered Hydrologic Regimen, Murrumbidgee River and Paleochannels, Australia; U.S. Government Printing Office: Washington, DC, USA, 1968; 65p. [Google Scholar]
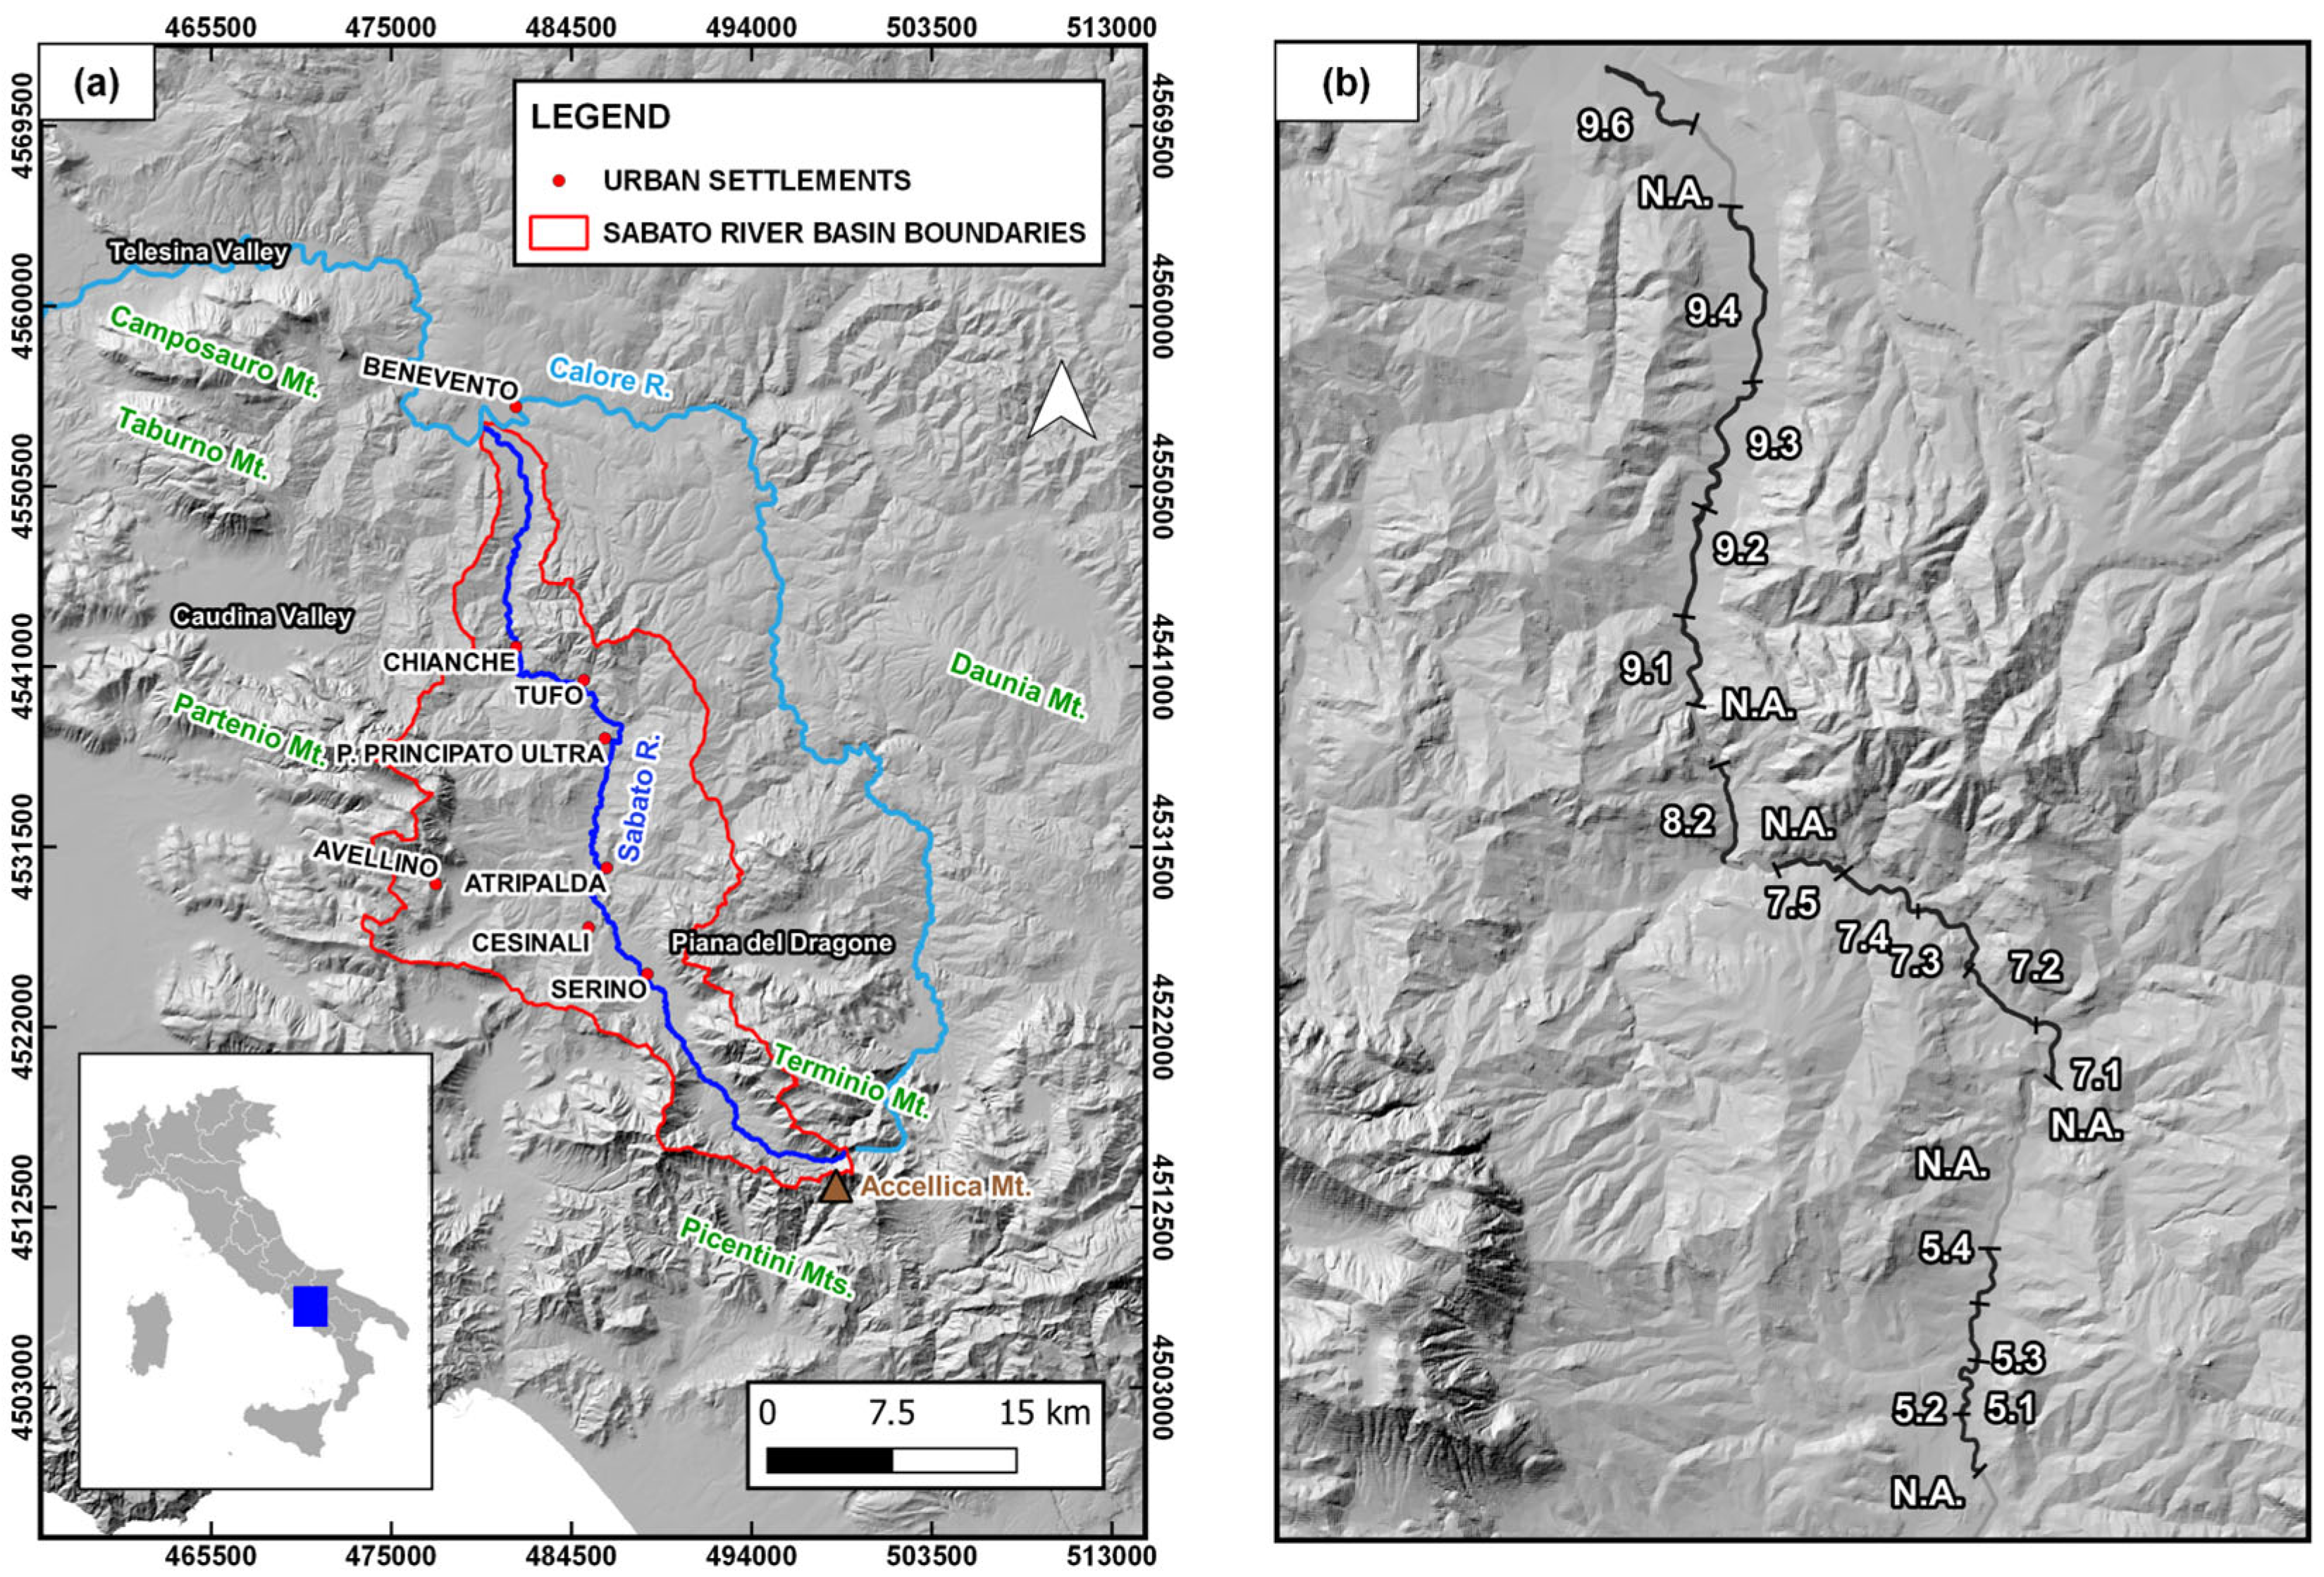
Figure 1. (a) Location map of the Sabato River basin; (b) location of the river reaches. Values in (b) indicate the labels of the river reaches in which the Sabato R. was subdivided for the following geomorphological analysis (See Section 2 and Section 3 for details). N.A.: not analyzed.
Geosciences 15 00308 g001
Figure 2. (a) Trends in mean active channel width changes of the Sabato R. in the investigated period. For the sake of readability, the trends in the period 1998–2014 (Phase 4 in Figure 2a) are reported in (b).
Geosciences 15 00308 g002
Figure 3. Percentage of the Sabato R. analyzed length affected by narrowing, stability and widening in the investigated periods.
Geosciences 15 00308 g003
Figure 4. Geomorphological sketches of some selected Sabato R. reaches representative of the entire river trend, showing changes in mean active channel width during the four detected morphoevolutionary phases. (a) Reach 5.1, comparisons between active channels from 1870 and 1909; (b) Reach 5.1, comparisons between active channels from 1909 and 1955; (c) Reach 5.1, comparisons between active channels from 1955 and 1998; (d) Reach 5.1, comparisons between active channels from 1998 and 2014; (e) Reach 9.3, comparisons between active channels from 1870 and 1909; (f) Reach 9.3, comparisons between active channels from 1909 and 1955; (g) Reach 9.3, comparisons between active channels from 1955 and 1998; (h) Reach 9.3, comparisons between active channels from 1998 and 2014.
Geosciences 15 00308 g004
Figure 5. Distribution of the different channel patterns in the entire Sabato R. in the investigated period.
Geosciences 15 00308 g005
Figure 6. Geomorphological sketches showing the channel pattern changes in two selected Sabato R. reaches, representative of the entire river, in the detected morphoevolutionary phases. (a) Channel pattern of Reach 7.5 in 1870; (b) channel pattern of Reach 7.5 in 1909; (c) channel pattern of Reach 7.5 in 1955; (d) channel pattern of Reach 7.5 in 1998; (e) channel pattern of Reach 7.5 in 2014; (f) channel pattern of Reach 9.4 in 1870; (g) channel pattern of Reach 9.4 in 1909; (h) channel pattern of Reach 9.4 in 1955; (i) channel pattern of Reach 9.4 in 1998; (l) channel pattern of Reach 9.4 in 2014.
Geosciences 15 00308 g006
Figure 7. Trends in minimum annual hydrometric heights. (a) Period 1967–1994 (source: Ministero LL.PP. [45]); (b) period 2000–2014 (source: Centro Funzionale Multirischi della Protezione Civile, Regione Campania [46]).
Geosciences 15 00308 g007
Figure 8. Field evidence of riverbed degradation. (a) remnant of recent terraced floodplain, bordered downslope by a steep fluvial erosional scarp; (b) exhumed weir, damaged by undermining processes.
Geosciences 15 00308 g008
Figure 9. Land-use maps of the Sabato R. basin: (a) 1960; (b) 1990; (c) 2012; (d) percentage of the Sabato R. basin occupied by the different land-use classes at the considered dates. Land-use classes are according to Magliulo et al. [50].
Geosciences 15 00308 g009
Figure 10. (a) Variation in sediment extraction sites area in the Sabato R. alluvial plain; (b) variations in the weir density and (c) bridge density along the Sabato R.; (d) total length of artificial riverbank protections.
Geosciences 15 00308 g010
Figure 11. Distribution of floods, expressed as maximum annual hydrometric heights. (a) Period 1967–1994 (source: Ministero LL.PP. [45]); (b) period 2000–2014 (source: Centro Funzionale Multirischi della Protezione Civile, Regione Campania [46]). Legend: μ: mean; σ: standard deviation.
Geosciences 15 00308 g011
Figure 12. Morphoevolutionary trajectory of the Sabato R. and controlling factors in the investigated time span. Classes are qualitatively defined, based on the quantitative values reported in Table 3, Table 4 and Table 5 and Figure 5, Figure 7, Figure 9d, Figure 10 and Figure 11.
Geosciences 15 00308 g012
Table 1. Main features of the used materials. Legend: R: raster; HM: historical topographic map; TM: more recent topographic map; O: orthophotos; IGMI: Italian Geographic Military Institute; CRA: Campania Region Authority. Positional errors were calculated according to Slama et al. [39] and Taylor [40].
Data FormatYearTypeProviderScalePixel Size (m)Positional Error (m)
R1870HMIGMI1:50,0005.433
R1909HMIGMI1:50,0004.230
R1941HMIGMI1:50,0004.029
R1955TMIGMI1:25,0002.315
R1998OCRA1:13,0002.02
R2004OCRA1:50000.2-
R2008OCRA1:50000.5-
R2011OCRA1:50000.2-
R2014OCRA1:50000.2-
Table 2. Confinement conditions of the analyzed reaches of the Sabato R. Legend: CD: Confinement Degree; CI: Confinement Index; CC: Confinement Class.
ReachLength (m)CD (%)CICC
5.112558.523.9Unconfined
5.2139115.08.1Partly confined
5.31040-26.0Unconfined
5.4110649.913.1Partly confined
7.11314-20.2Unconfined
7.214894.115.5Unconfined
7.3181750.06.0Partly confined
7.4166527.79.8Partly confined
7.5129632.96.5Partly confined
8.2179646.64.7Partly confined
9.1175227.47.1Partly confined
9.21897-16.6Unconfined
9.32841-22.2Unconfined
9.43248-37.9Unconfined
9.6203746.517.5Partly confined
Table 3. Mean annual variations in mean channel width of the Sabato R. in the considered periods. In brackets, the number of the reach is reported.
Mean Annual Narrowing (m/year)
1870–19091909–19411941–19551955–19981998–20042004–20082008–20112011–2014
Mean−0.07-−1.78−0.50−0.84−1.24-−0.76
Max−0.14 (7.1)-−2.95 (7.1)−1.87 (9.2)−1.62 (9.6)−2.80 (9.4)-−1.25 (9.3)
Min−0.02 (9.3)-−0.73 (5.4)−0.07 (7.1)−0.13 (9.4)−0.25 (5.1)-−0.20 (5.3)
Mean Annual Widening (m/year)
Mean0.050.170.92-0.840.481.400.14
Max0.21 (9.1)0.33 (5.1)1.30 (9.2)-1.57 (7.5)0.48 (7.1)2.19 (7.2)0.14 (5.1)
Min0.001 (9.4)0.02 (7.2)0.54 (9.4)-0.01 (7.1)0.48 (7.1)0.79 (5.1)0.14 (5.1)
Table 4. Dominant channel patterns in the Sabato R. reaches in the investigated period. Legend: S: sinuous; St: straight; Sab: sinuous with alternate bars; W: wandering.
ReachYear
187019091941195519982004200820112014
5.1SSSSSSSSS
5.2SabSSSSSSSS
5.3SSSSSSSSS
5.4SStSSSSSSS
7.1SSSSSSSSS
7.2SSSSSSSSS
7.3SSSSSSSSS
7.4SSSSSSSSS
7.5SSSSabSSSSS
8.2SSSSSSSSS
9.1SSSSSSSSS
9.2SSSSabSSSSS
9.3SSSSabSSSSS
9.4SSSWSSSSS
9.5SSSSSSSSS
Table 5. Rainfall features of the morphoevolutionary phases of the Sabato R.
μ of the Total Annual Rainfall (mm)No. of Years > μ% of Years > μVariation (%)
Phase 1 (1870–1909)No data---
Phase 2 (1909–1941)1109.21458-
Phase 3 (1941–1998)1109.930530.06
Phase 4 (1998–2014)1054.0850-
Disclaimer/Publisher’s Note: The statements, opinions and data contained in all publications are solely those of the individual author(s) and contributor(s) and not of MDPI and/or the editor(s). MDPI and/or the editor(s) disclaim responsibility for any injury to people or property resulting from any ideas, methods, instructions or products referred to in the content.