Abstract
The Devonian–Permian succession of the Tasbulak Trough in the Shu–Sarysu Basin contains confirmed gas shows (wells 462, 1-P Izykyr, 1-P Sokyr-Tobe, and 1-P Kamenistaya) and a sedimentary cover exceeding 5500 m but still lacks a unified 3D structural interpretation capable of explaining the distribution of gas-prone intervals. This study addresses this gap by digitizing and integrating legacy well and 2D seismic datasets to construct horizon-consistent three-dimensional structural surfaces for eight target horizons. The resulting model reveals a low-deformation structural framework dominated by a previously undocumented element—the Central Tasbulak Ridge—which exerts first-order control on fault segmentation, trap geometry, and gas preservation. Structural surfaces were synthesized with stratigraphic intervals to define reservoir–seal–trap relationships, highlighting the late Visean–early Serpukhovian carbonate subformation as the primary target interval. Building on these relationships, a prospect evaluation matrix was developed to classify structural, stratigraphic (including intraformational), and combination trap types together with their corresponding sealing units. The results demonstrate long-term tectonic stability, multi-level evaporitic seals, and inheritance-guided trap evolution, providing a reference framework for assessing gas prospectivity in data-limited intracratonic basins and advancing understanding of petroleum-system architecture in stable continental settings.
1. Introduction
The Tasbulak Trough in the northern Shu–Sarysu Basin is an under-explored Paleozoic structure that hosts multiple documented gas shows yet still lacks a coherent 3D structural interpretation capable of explaining their distribution. Growing regional interest in lower-emission energy sources [1] adds environmental relevance to clarifying the geological controls on gas-prone Paleozoic intervals. Although exploration during the 1960s–1990s established the presence of mature source rocks, persistent evaporitic seals, and favorable burial conditions, inconsistent seismic quality, sparse well control, and fragmented legacy datasets prevented construction of a unified structural framework. As a result, the internal architecture of the DPS, its inherited segmentation, and the mechanisms governing structural development remain poorly constrained. Previous basin-scale assessment of the Shu–Sarysu Basin demonstrated that the DPS of the Tasbulak Trough is among its most prospective gas-bearing intervals, underscoring the need for an integrated structural analysis [2,3].
Regionally, the trough is bounded by major basement-controlled lineaments such as the Zhalair–Naiman and Kokshetau–Zhezkazgan structural corridors [4,5,6]. Similar foreland-type and intracratonic basins worldwide demonstrate that long-lived inherited fabrics exert first-order control on depocenter arrangement, uplift development, fault reactivation, and petroleum-system evolution. Over the past two decades, international studies from the Po Plain–Southern Alps, the Jaca Basin, the Central European Basin System, and the Zagros foreland have shown that tectono-stratigraphic inheritance—from early rifting to later inversion—strongly influences reservoir partitioning and seal continuity [7,8,9,10,11,12,13]. The Tasbulak Trough, shaped by Devonian rifting and later modified by Carboniferous subsidence and selective Hercynian inversion, provides an excellent natural setting for evaluating these processes in a low-deformation continental interior.
The primary scientific challenge concerns the reliability of structural reconstructions in data-limited basins dominated by analog seismic records and uneven subsurface coverage—a problem that has become increasingly prominent in international basin-analysis studies.
Despite favorable geological indicators—including mature source rocks, regionally persistent evaporitic seals, and confirmed gas shows—the Tasbulak Trough remains insufficiently resolved due to the heterogeneous and analog nature of its subsurface database. Crucially, no unified 3D structural framework has ever been constructed for this trough. Available information is limited to archival 2D seismic profiles of variable quality and restricted well control, which historically prevented establishing a consistent horizon-to-horizon interpretation [14,15,16,17,18,19]. This data limitation created the central knowledge gap: the internal geometry, fault segmentation, and reservoir–trap–seal configuration of the DPS remained unresolved. The present study addresses this gap by providing the first fully integrated 3D structural model derived from complete digitization and reconciliation of all available legacy datasets.
Previous regional syntheses—including the author’s earlier basin-scale assessment of the Shu–Sarysu Basin, which identified the DPS of the Tasbulak Trough as the most prospective interval for gas exploration—highlighted the need for detailed structural reconstruction but did not attempt a unified 3D interpretation. International studies over the past two decades have shown that integrating heterogeneous datasets, even under limited data conditions, can yield reliable structural models capable of clarifying inheritance-driven basin architecture.
Building on this foundation, the present work reconstructs key structural surfaces across the Devonian–Permian interval, identifies long-lived structural elements, and evaluates how inherited ridges, low-throw faults, and mechanically contrasted stratigraphic intervals govern trap formation and gas preservation. The analysis is organized into three stratigraphic tiers representing distinct tectono-stratigraphic regimes and reservoir–seal–trap configurations.
The objectives are to: reconstruct key structural surfaces from Devonian to Permian with consistent horizon-to-horizon geometry (1); identify long-lived structural elements and evaluate their inheritance-driven behavior (2); delineate reservoir–trap–seal relationships across stratigraphic tiers (3); and clarify the implications of these patterns for gas accumulation and preservation in a low-deformation intracratonic setting (4).
This integrated framework establishes the Tasbulak Trough as a reference example for understanding inheritance-driven basin architecture and provides a transferable methodology for structurally and data-limited basins where reliable 3D interpretation remains challenging.
2. Geological Setting
2.1. Regional and Structural Framework
The Tasbulak Trough occupies the northeastern part of the Shu–Sarysu Basin, a large NW-trending Paleozoic structural system of troughs and uplifts extending across southern and central Kazakhstan (Figure 1a). The northern sector of the basin includes two major structural depressions—the Kokpansor (northwestern segment) and Tasbulak troughs—separated by the Betpakdala–Tasty uplift zone [20,21,22]. These structures exhibit comparable orientation, lithostratigraphic framework, and tectonic history.
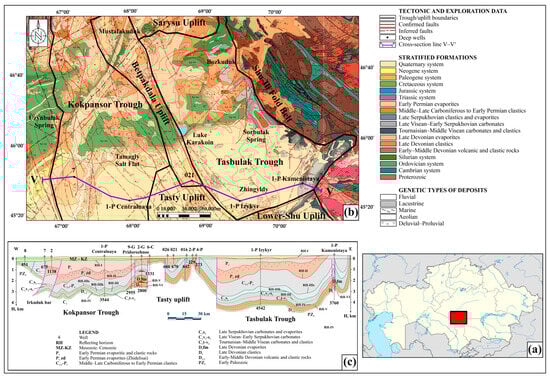
Figure 1.
Location of the (a) northern Shu–Sarysu Basin within Kazakhstan, (b) geological map showing the Tasbulak and Kokpansor troughs, and (c) regional cross-section illustrating the structural framework (compiled and modified after [2,16]). Black frame with red fill (panel (a))—location of the northern Shu–Sarysu Basin within Kazakhstan; Black solid lines—Trough/uplift boundaries; Red solid lines—Confirmed faults; Red dashed lines—Inferred faults; Black circles—Deep wells; Purple line—Cross-section line V–V′.
The Tasbulak Trough trends NW and exhibits an asymmetric, nearly rectangular shape about 200 × 100 km in size (see Figure 1b). The eastern boundary is defined by the Zhalair–Naiman right-lateral fault zone separating it from the Shu–Ili fold-and-thrust belt, whereas the western margin is bounded by the Kokshetau–Zhezkazgan right-lateral fault system associated with the Tasty Uplift. The fault zones display NW and near-meridional orientations, with displacements of 100–200 km. To the north, the trough is bounded by the Sarysu Uplift and to the south by the Lower Shu Uplift, resulting in an asymmetric configuration with overall subsidence from northeast to southwest, from marginal outcrops to depths of 5000–5500 m in the central depocenters. Internally, the trough is characterized by a series of elongated structural highs, gentle anticlines, and broad depressions. The Zhaldybai Ridge forms the eastern structural flank, whereas the Koskuduk and Byurtusken depressions represent the principal depocenters [23,24,25].
2.2. Lythostratigraphic Characteristics
The northern Shu–Sarysu Basin comprises a crystalline Proterozoic–early Paleozoic basement overlain by a DPS and a thin Mesozoic–Cenozoic cover [26,27,28,29,30,31].
The crystalline basement consists of deformed Proterozoic–early Paleozoic metamorphic and igneous rocks forming a block-fault mosaic. Well 1-P Izykyr encountered late Ordovician granodiorite at ~4477 m. On seismic sections, the basement shows chaotic reflections, with its top corresponding to Reflecting Horizon VII.
The Devonian–Permian Succession (DPS) unconformably overlies the basement, thickening to 4–5 km in central depocenters and thinning toward marginal uplifts. These variations reflect long-term differential subsidence and early structural segmentation of the trough.
The early–middle Devonian volcaniclastic unit rests directly on the basement but is not examined in this study due to its limited hydrocarbon prospectivity and the weak seismic expression of its boundaries.
Excluding this interval, the DPS comprises three regionally consistent lithostratigraphic formations (Table 1), subdivided into seven subformations that reflect major depositional transitions and correspond to the eight target reflecting horizons (RH-I to RH-VI) interpreted in this work [2,3,4,5,6,7,8,9,10,11,12,13].

Table 1.
Generalized geological–stratigraphic framework of the Devonian–Permian succession, Tasbulak Trough [2,3,4,5,6,7,8,9,10,11,12,13]. RH—reflecting horizon.
The Mesozoic–Cenozoic sedimentary cover unconformably overlies the DPS and consists of continental and lagoonal sandstones, clays, siltstones, and conglomerates 250–300 m thick. These deposits are beyond the scope of the present study [2,19].
2.3. Tectonic Evolution of the Devonian–Permian Succession
Tectonic development of northern Shu–Sarysu Basin from the late Paleozoic onward involved a sequence of rifting, subsidence, platform growth, and mild inversion that shaped overall basin architecture. Within this broad framework, the DPS of the Tasbulak Trough reflects three major evolutionary stages corresponding to the lithostratigraphic formations summarized in Table 1.
Late Devonian rifting and evaporitic basin formation established fault-controlled depressions and structurally segmented blocks inherited from basement anisotropies. Differential subsidence created localized depocenters that accommodated clastic and evaporitic deposition (RH-V/VI and RH-IV/V). Syn-rift structures produced contrasts in thickness and facies across adjacent blocks, marking the onset of long-lived structural segmentation observed through the upper Paleozoic succession.
Early Carboniferous marine transgression and carbonate–siliciclastic platform development led to the establishment of a laterally extensive mixed carbonate–clastic system (RH-III/IV, RH-IIIk/III, RH-IIIs/IIIk). Sedimentation occurred under relatively stable tectonic conditions, although inherited fault blocks continued to influence depositional gradients, platform geometry, and facies transitions. Carbonate buildup development during late Visean–early Serpukhovian time was commonly localized along structurally elevated zones formed during earlier rifting.
Middle–late Carboniferous to early Permian continental deposition and mild Hercynian inversion resulted in gradual modification rather than restructuring of earlier basin architecture. Regional subsidence was accompanied by low-magnitude block adjustments, gentle drape folding, and localized uplift along pre-existing discontinuities. Evaporitic intervals of Serpukhovian and early Permian age (RH-IIIs/IIIk and RH-I/II) accumulated across wide areas, producing mechanically strong, laterally extensive successions. Halokinetic movement associated with Devonian and early Permian salts contributed to subtle deformation patterns across certain structural blocks.
Collectively, these tectonic stages produced the stratigraphic and structural framework that characterizes the DPS of the Tasbulak Trough. This framework reflects long-lived structural segmentation inherited from late Devonian rifting, modified during early Carboniferous platform development, and preserved through mild Hercynian inversion. It provides essential geological context for the subsequent interpretation of sedimentation patterns and upper Paleozoic structural configuration.
3. Materials and Methods
This study relies on archival geological and geophysical datasets from the Tasbulak Trough, northern Shu–Sarysu Basin, including analog seismic profiles and limited well logs obtained from Kazgeoinform [12,23]. All materials were digitized and integrated into a unified Petrel 2021.3 (Schlumberger, Houston, TX, USA) environment to enable the first horizon-consistent 3D structural reconstruction of the DPS under sparse data conditions.
This workflow provided the basis for reconstructing the internal architecture of the Tasbulak Trough and evaluating its petroleum-system configuration despite limited, heterogeneous archival subsurface data, and consisted of five steps:
- Data digitization and integration.
Analog seismic records, stratigraphic markers, and log curves were scanned, georeferenced, and standardized for Petrel. Quality control ensured coordinate consistency and reliable well–seismic ties.
- 2.
- Stratigraphic calibration and correlation.
A reference lithostratigraphic model was established using Well 1-P Izykyr. Key horizons were calibrated and correlated across the seismic grid following regional stratigraphic criteria.
- 3.
- Seismic interpretation and fault mapping.
Reflecting horizons RH-VI to RH-I were interpreted on fifteen 2D profiles using well control and a calibrated time–depth function. Faults were delineated based on reflector terminations and offsets, with qualitative use of seismic attributes to verify subtle discontinuities. Qualitative seismic-attribute cues, including coherence and semblance, were visually assessed to support identification of subtle reflector disruptions.
- 4.
- 3D surface construction and validation.
Correlated reflectors and interpreted faults were integrated into 3D surfaces in both time and depth domains. Horizon-to-horizon consistency was ensured through iterative geological plausibility checks. Geological reconciliation was performed through an expert-driven iterative loop in which horizon interpretations were cross-checked against well tops, phase continuity, and stratigraphic order; quantitative misfit measures were not applied due to limitations of archival data.
- 5.
- Reservoir–seal–trap system integration and analysis.
Structural surfaces were synthesized with stratigraphic intervals to define reservoir–seal–trap architecture and assess inheritance-controlled controls on trap formation and gas preservation.
4. Results
4.1. Digitization and Integration of Legacy Geological and Geophysical Data into a Petrel
Archival well and seismic datasets for the Tasbulak Trough were digitized, quality-checked, and integrated into a unified Petrel project environment referenced to WGS 84. The integrated database includes six deep parametric wells with stratigraphic picks, full suites of well logs for three reference wells, an average velocity chart and time-depth function derived from Well 1-P Izykyr, and a georeferenced network of fifteen 2D CDP seismic profiles (~679 line-km) [31,32,33]. All scanned materials were processed through standardized digitization workflows and verified for coordinate accuracy, stratigraphic consistency, and compatibility with Petrel formats.
These datasets provided the foundation for subsequent stratigraphic calibration and seismic interpretation (Figure 2).

Figure 2.
Integrated dataset for the Tasbulak Trough, including (a) deep parametric wells with stratigraphic tops, (b) vectorized 2D CDP profile along line 245, (c) digitized well logs, (d) time–depth function, and (e) deep wells and seismic coverage map. Black line—trough boundary; Black circles—deep parametric wells; RH—reflecting horizon; Various colored circles: P1Salt top–top of the early Permian evaporite subformation, P1Salt base–base of the early Permian evaporite subformation, C2–3 base–base of the middle–late Carboniferous, C1s2 base–base of the late Serpukhovian, C1v3 base—base of the late Visean, C1v2 base—base of the middle Visean, C1v1—base of the early Visean; C1t base—base of the Tournaisian, D3Salt base—base of the late Devonian evaporite subformation, D3 base—base of the late Devonian, PZ1–2—top of the early–middle Paleozoic basement; Logs: RES—resistivity, expressed in Ω·m; CALI—caliper, expressed in centimeters; GR—gamma-ray log, given in microroentgens per hour (µR h−1) on the original Soviet scale (conversion to API units, gAPI, was not possible without calibration); NGT–neutron-gamma ray (NGK-60), expressed in counts per minute (cpm) with an additional scale of 6000 cpm = 1 unit (conversion to porosity units was not possible due to missing calibration and core data).
4.2. Lithological–Stratigraphic Calibration, Inter-Well Correlation, and Seismic Reconciliation
This section presents the integrated results of lithological–stratigraphic calibration and correlation that established a consistent geological and geophysical framework for the DPS of the Tasbulak Trough.
The workflow comprised three stages, described below.
4.2.1. Construction of a Reference Stratigraphic Model
Average-velocity chart, lithological logs, and well documentation for Well 1-P Izykyr formed the basis for defining stratigraphic markers and subdividing the early Carboniferous carbonate–clastic succession.
The analyzed interval (Tournaisian–Serpukhovian) rests unconformably on late Devonian clastic–evaporite rocks.
Wireline logs (GR, NGT, RES, CALI) were integrated with drilling data to identify lithological transitions:
- Gamma-ray (GR) readings ≤10 µR/h indicate pure limestones; local peaks mark clayey or anhydrite interbeds.
- Neutron-gamma (NGT) 3–5 units (≈18,000–30,000 cpm) typify dense, low-porosity carbonates, whereas low readings (~1 unit) correspond to cavernous or porous dolomites.
- Resistivity (RES) varies from ≤100 Ω·m in clay-rich clastics to 1000–1300 Ω·m in dense carbonates, sharply contrasting against a low gamma background.
- Caliper (CALI) deviations 250–400 mm mark local cavities and reef-related textures.
Integration of well-log characteristics, drilling data, and the time–depth velocity function enabled identification of lithostratigraphic intervals within the early Carboniferous formation (Table 2).
Table 2.
Lithological–stratigraphic subdivision of the early Carboniferous carbonate–clastic formation in Well 1-P Izykyr. C1s2—late Serpukhovian; C1v3-s1—late Visean to early Serpukhovian; C1v2—middle Visean; C1t-v1—Tournaisian to early Visean; RES—resistivity; CALI—caliper; GR—gamma-ray log; NGT—neutron-gamma ray (NGK-60); RH—reflecting horizon.
The stratigraphic boundaries derived from the time–depth function match well-log markers and official well records within 1–5 m, confirming high data reliability.
The 1-P Izykyr reference model thus provides a robust basis for correlation across the Tasbulak Trough and supports integration of drilling and geophysical data with seismic interpretation.
4.2.2. Inter-Well Correlation of Stratigraphic Horizons
Using 1-P Izykyr as the reference, lithological–stratigraphic correlation was performed along the 1-P Izykyr—1-P S Izykyr—1-P Zhatyktau line (Figure 3).
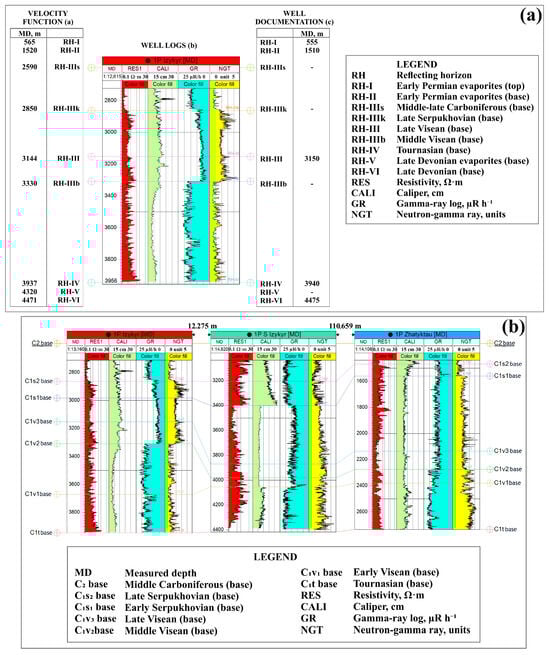
Figure 3.
Reference (a) stratigraphic model of Well 1-P Izykyr, integrating velocity-function data and log-derived lithologies, and (b) inter-well lithological–stratigraphic correlation along the 1-P Izykyr—1-P S Izykyr—1-P Zhatyktau transect, showing the continuity of key Carboniferous intervals. MD—measured depth; RH—reflecting horizon; C2 base–base of the middle Carboniferous, C1s2 base–base of the late Serpukhovian, C1v3 base–base of the late Visean, C1v2 base–base of the middle Visean, C1v1–base of the early Visean; C1t base–base of the Tournaisian; RES–resistivity; CALI–caliper; GR–gamma-ray log; NGT–neutron-gamma ray (NGK-60).
Key boundaries include Tournaisian (C1t), Visean (C1v1–3), and Serpukhovian (C1s1–2) substages. Characteristic log patterns are reproduced laterally with depth differences ≤ 5 m, demonstrating high electrofacies correlation quality (Table 3), consistent with results reported in comparable regional studies [34,35,36,37,38]. Incomplete log coverage was supplemented by well records and a velocity tie.
Table 3.
Correlation summary for the early Carboniferous carbonate–clastic formation. C2–3–middle to late Carboniferous; other abbreviations are in Table 2.
The correlated intervals demonstrate lateral continuity and thickness variation consistent with a transgressive depositional regime.
This integrated framework ensures consistent stratigraphic reference for seismic interpretation and subsequent 3D modeling.
4.2.3. Reconciliation of Well and Seismic Data
To tie depth-domain stratigraphy to seismic reflections, phase axes were calibrated using mean velocities from the 1-P Izykyr time–depth function. The reconciliation involved iterative refinement of reflector picks through correlation of well logs, lithological markers, and seismic sections across six deep wells.
This procedure achieved high consistency between stratigraphic and seismic boundaries, with depth–time discrepancies of only a few milliseconds. The calibrated average velocities provided precise control for depth conversion of reflecting horizons RH-I to RH-VI.
Results of the stratigraphic–seismic tie for the reference well 1-P Izykyr are presented in Table 4.
Table 4.
Results of stratigraphic–seismic tie for the reference Well 1-P Izykyr. Abbreviations are in Figure 2.
The stratigraphic–seismic tie confirms the reliability of the integrated calibration and establishes a robust basis for subsequent seismic interpretation and mapping of reflecting horizons and fault discontinuities.
This framework ensures consistent depth–time correlation across the dataset and supports structural reconstruction of the DPS in the following sections.
4.3. Seismic Interpretation and Fault Framework
This section presents the results of seismic correlation and structural interpretation that define the internal configuration of the Tasbulak Trough. The analysis focused on establishing a consistent framework of reflecting horizons (RH-I to RH-VI) and identifying fault discontinuities controlling their geometry. The results refine the regional seismic stratigraphy and reveal structural segmentation that had not been recognized in earlier works.
4.3.1. Correlation of Key Reflecting Horizons Across Profile
Building on the stratigraphic–seismic calibration (Section 4.2), fifteen 2D CDP time-migrated sections were analyzed to correlate key reflecting horizons (RHs) tied to the reference well 1-P Izykyr. Manual interpretation was necessary due to variable scan quality and inconsistent splicing of legacy profiles. Stratigraphic markers were transferred into the seismic domain using the time–depth velocity function, allowing consistent tracing of continuous reflections from trace to trace (Figure 4).
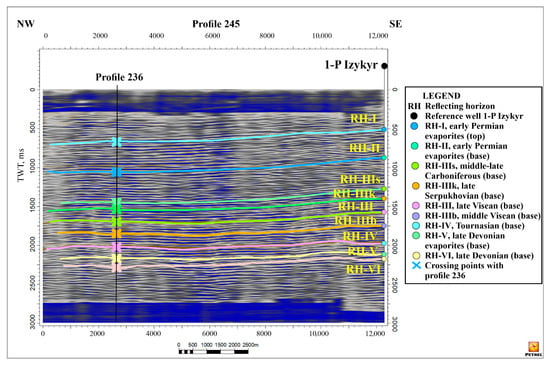
Figure 4.
Seismic time section along Profile 245 showing the interpreted reflecting horizons (RH-I to RH-VI) tied to stratigraphic markers from the reference well 1-P Izykyr, with horizon continuity, terminations, and characteristic reflection patterns used to guide correlation in the time domain. Colored picks indicate horizon tops and bases, with crossing points from Profile 236 shown for correlation. Abbreviations are in Figure 2.
The correlated reflections exhibit two-way travel times up to 2.4 s, corresponding to burial depths of 4.4–5.2 km. The DPS displays coherent, moderately continuous reflections, whereas the thin Mesozoic–Cenozoic cover remains largely transparent due to high-amplitude noise and attenuation. The most reliable markers include RH-IV, RH-IIIb, RH-III, RH-IIIk, and RH-IIIs; the early Permian evaporitic horizons RH-II and RH-I are also confidently identified despite local noise. In contrast, RH-V and RH-VI show weaker continuity and lower signal-to-noise ratios, reflecting irregular lithological contrasts and structural disturbance within the pre-Carboniferous basement.
Wavefield analysis reveals a systematic upward transition from discontinuous, low-frequency (≈20 Hz) reflections within the late Devonian clastic–evaporite sequence to more continuous, high-frequency (30–40 Hz) reflections in the early Carboniferous carbonate–clastic succession. Local onlap and thickening patterns beneath RH-IV and RH-V indicate syndepositional salt movement and differential subsidence. Regional synthesis of all profiles demonstrates consistent eastward thickening of the late Devonian and Carboniferous packages, reflecting progressive subsidence and asymmetry of the trough axis.
Among the mapped reflectors:
- RH-VI (base of the late Devonian clastic subformation) marks the lower boundary of the pre-salt clastic subformation that overlies the early Paleozoic volcanogenic–sedimentary unit resting on the crystalline basement. The reflector shows moderate continuity, low-frequency, high-amplitude responses, and irregular geometry, reflecting heterogeneous deposition during the initial subsidence phase of the Tasbulak Trough.
- RH-V (base of the late Devonian evaporite–clastic formation) records the transition from dominantly clastic infill to conditions favorable for evaporite accumulation. Its patchy continuity and subdued amplitudes indicate lateral facies variability and early halokinetic disturbance within the developing depocenter.
- RH-IV (top of the late Devonian clastic–evaporite formation) represents a regional surface separating Devonian evaporitic–clastic deposits from overlying Carboniferous carbonate–clastic formation, marking a pronounced change in basin-fill style and tectono-sedimentary regime.
- RH-IIIb and RH-III delineate the lower carbonate intervals of the early Carboniferous formation. Their lateral facies variability reflects transitions from platformal carbonates to mixed carbonate–clastic facies along trough flanks.
- RH-IIIk (top of the late Visean–early Serpukhovian carbonates) is the most persistent high-frequency horizon traceable throughout the trough and serves as the principal regional marker for early Carboniferous correlation.
- RH-IIIs (base of the middle–late Carboniferous clastic subformation) marks the onset of a regressive continental clastic stage that unconformably overlies the carbonate subformatio.
- RH-II and RH-I (base and top of the early Permian evaporite subformation) define a regionally extensive sealing unit capping the DPS and isolating underlying reservoir-prone intervals.
Overall, these reflectors define a coherent vertical succession from the earlier-Paleozoic volcanogenic–sedimentary strata to the late Devonian–Permian sedimentary cover comprising multiple evaporitic and clastic–carbonate intervals. The results highlight systematic contrasts in reflector continuity between Devonian and Permian units, delineating structural gradients aligned with known tectonic boundaries. This refined stratigraphic–structural framework records progressive basin subsidence, halokinetic readjustment, and the development of regional sealing sequences. It reveals the interaction of depositional and tectonic processes that governed trap configuration and gas preservation within the DPS and related petroleum systems of the Tasbulak Trough. Their consistent correlation across fifteen 2D profiles is in agreement with observations from comparable regional studies [39,40,41,42,43] and confirms the reliability of seismic–stratigraphic integration and establishes a robust basis for interpreting the fault framework and reconstructing 3D structural surfaces in the following section (Figure 5).
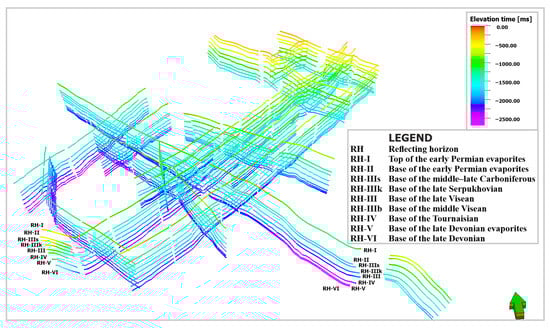
Figure 5.
Three-dimensional visualization of the interpreted reflecting horizons (RH-I to RH-VI) illustrating their spatial geometry, structural continuity, and relative two-way-travel-time elevations across the Devonian–Permian succession. Colors correspond to elevation-time values used for horizon mapping. Abbreviations are in Figure 2.
4.3.2. Fault Interpretation and Structural Segmentation
Horizon correlation and fault tracing were conducted as an iterative process in which refinement of horizons guided adjustment of fault planes and vice versa. Interpretation integrated seismic evidence—offsets, reflector terminations, and amplitude disturbances—with geological and paleogeographic constraints to ensure structural consistency across all interpreted profiles.
In addition to visual examination of structural discontinuities, seismic attributes such as coherence and semblance were qualitatively assessed to enhance the recognition of fault traces and verify their lateral continuity. This attribute-based inspection supported the delineation of subtle discontinuities that might otherwise remain ambiguous on legacy analog profiles.
The fault network, primarily detected in the central and western parts of the southern Tasbulak Trough, consists of numerous previously unresolved small-displacement faults (Figure 6). These faults exhibit typical offsets of several meters to about 50 m, locally reaching 80–250 m, and display upward attenuation within the DPS. Their recognition provides a higher-resolution understanding of deformation within the trough than was available from earlier regional interpretations.
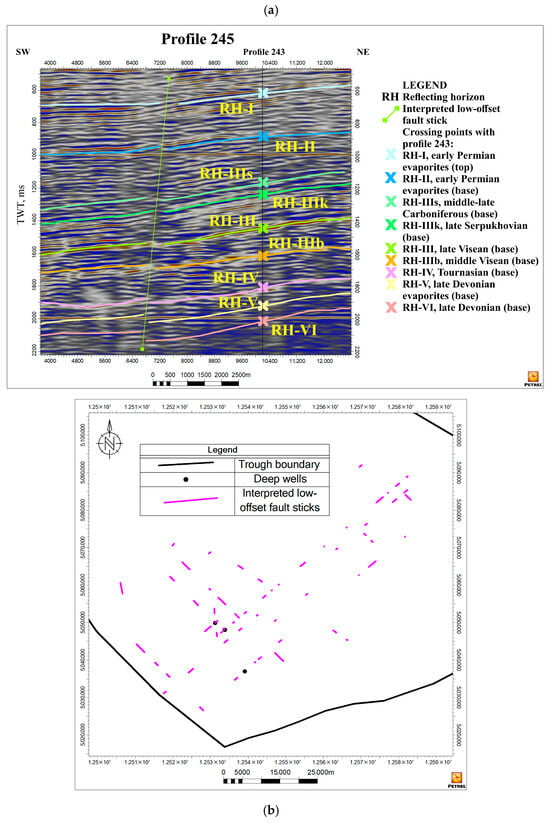
Figure 6.
Fault architecture of the southern Tasbulak Trough showing (a) low-offset faults interpreted on the seismic time section along Profile 235 from reflector terminations and subtle offsets, and (b) the map-view distribution of small-displacement fault sticks derived from this interpretation. Pink lines—interpreted faults. Other abbreviations are in Figure 2.
The mapped faults form en echelon patterns and gently curved reflector-termination zones, indicating syndepositional reactivation of inherited basement structures. Variations in seismic amplitude and waveform within these zones reflect velocity heterogeneities linked to fault-controlled facies changes. Most faults strike northwest–southeast and northeast–southwest, corresponding to the orientations of regional tectonic zones that bound the Tasbulak Trough. Locally, cross-cutting relationships between differently oriented fault sets imply multi-phase deformation and partial rejuvenation during Carboniferous–Permian basin evolution.
The newly delineated low-offset fault network significantly refines the structural interpretation of the Tasbulak Trough. It reveals subtle segmentation of the trough floor into discrete blocks and flexures that influenced the development of local depocenters and controlled trap configuration within the overlying DPS.
4.4. 3D Structural Surfaces
This section summarizes the results of constructing consistent 3D structural surfaces for eight target horizons (RH-VI to RH-I) of the DPS in the Tasbulak Trough. The surfaces were generated in Petrel through integration of correlated seismic horizons, well tops, and fault data derived from previous interpretation stages.
Time-structure surfaces were first interpolated in the seismic domain using the correlated reflectors from fifteen 2D CDP profiles and stratigraphic markers from six deep parametric wells. The grid resolution of 50 × 50 m ensured adequate spatial detail across the narrow trough geometry. Lateral limits of interpolation were constrained by digitized geological boundaries of the Tasbulak Trough, while faults from the interpreted seismic sections were incorporated directly into the gridding process.
Conversion from the time to the depth domain employed average velocity functions calibrated at the reference well 1-P Izykyr. Incorporation of velocity control and fault geometry reduced extrapolation errors and improved consistency between stratigraphic and structural data. Several deterministic gridding and smoothing algorithms were tested to optimize surface fit. Cross-checks against well tops confirmed stratigraphic coherence and minimized residual misfit across horizons.
The resulting 3D depth surfaces form a coherent structural framework for the DPS, linking the correlated reflecting horizons RH-VI to RH-I into a single geometrically consistent model (Figure 7).

Figure 7.
Three-dimensional composite structural surfaces of the Devonian–Permian succession (RH-I to RH-VI), illustrating the relative time-domain geometry, structural continuity, and large-scale configuration of the interpreted reflecting horizons across the Tasbulak Trough. Abbreviations are in Figure 2.
To represent depth variations and regional structural gradients, each horizon was subsequently transformed into structural contour (isohypse) maps (Figure 8, Figure 9 and Figure 10). These maps provide a coherent three-tiered representation of the Devonian–Permian architecture of the Tasbulak Trough. Together they establish the structural framework for the subsequent integrated reservoir–seal–trap analysis, which involves a comprehensive morphotectonic interpretation and assessment of structural controls on trap formation and gas preservation.

Figure 8.
Structural contour maps of the middle–late Carboniferous to early Permian clastic–evaporite formation showing (a) the RH-I surface, representing the top of the early Permian evaporite subformation, and (b) the RH-II surface, representing the lower boundary of the early Permian evaporite subformation. White dashed lines–ridges; Black shapes with red outlines–third-order local structures; other abbreviations are in Figure 1.
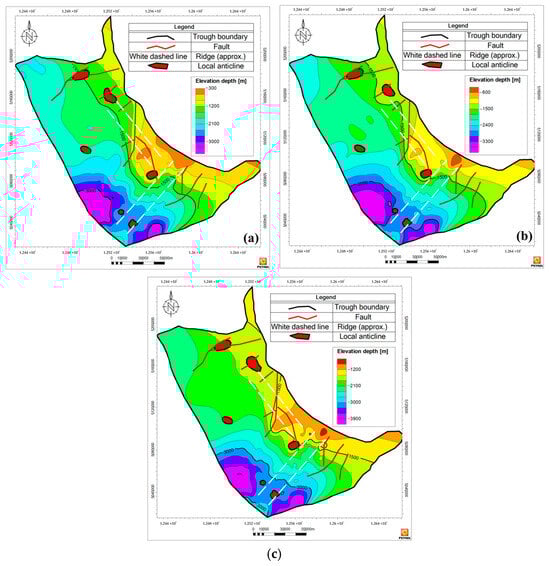
Figure 9.
Structural contour maps of the early Carboniferous carbonate–clastic formation showing (a) the RH-IIIs surface, representing the top of the late Serpukhovian clastic–sulfate subformation, (b) the RH-IIIk surface, marking the top of the late Visean to early Serpukhovian carbonate subformation, and (c) the RH-III surface, corresponding to the lower boundary of the late Visean to early Serpukhovian carbonate subformation. Abbreviations are in Figure 8.

Figure 10.
Structural contour maps of the Devonian clastic–evaporite formation showing (a) the RH-IV surface, representing the top of the late Devonian evaporite subformation, (b) the RH-V surface, marking the lower boundary of the late Devonian evaporite subformation, and (c) the RH-VI surface, corresponding to the base of the late Devonian clastic subformation. Abbreviations are in Figure 8.
4.5. Reservoir-Seal−Trap Configuration and Implications for Gas Preservation
This section interprets the Devonian–Permian structural framework of the Tasbulak Trough reconstructed from 3D surfaces and structural contour maps. The analysis integrates morphological, tectonic, and stratigraphic evidence to characterize the spatial configuration of reservoir, seal, and trap elements within the trough.
Interpretation proceeds formation by formation, following the stratigraphic architecture of the DPS, including the middle–late Carboniferous to early Permian clastic–evaporite formation (RH-I and RH-II), the early Carboniferous carbonate–clastic formation (RH-IIIs to RH-III), and the Devonian clastic–evaporite formation (RH-IV to RH-VI).
For each formation, results are synthesized through an integrated morphotectonic approach that combines analysis of structural configuration, evaluation of tectonic segmentation, and assessment of reservoir–seal–trap relationships controlling gas accumulation and preservation within the DPS.
4.5.1. Middle–Late Carboniferous to Early Permian Clastic–Evaporite Formation (RH-I, RH-II)
This interval represents the uppermost part of the DPS, reflecting the final phase of subsidence and the transition to an arid evaporitic environment. Structurally and stratigraphically, it defines the principal sealing and sub-evaporitic reservoir system within the Tasbulak Trough.
Quantitative parameters derived from depth conversion and contour mapping provide a basis for interpreting the geometry and tectonic segmentation of the Devonian–Permian structural framework (Table 5). These metrics reveal systematic deepening and increasing fault amplitude toward older horizons, reflecting progressive southwestward subsidence and gradual intensification of disjunctive deformation within the trough.
Table 5.
Depth gradients of structural surfaces of the Devonian–Permian target horizons within the trough. Abbreviations are in Figure 2.
The summarized parameters demonstrate consistent southwestward deepening, thickening of sedimentary successions, and a gradual increase in fault amplitudes downsection. These quantitative patterns constrain subsequent morphotectonic interpretation and form the analytical basis for assessing reservoir–seal–trap configuration across the DPS.
- Structural configuration
The RH-I and RH-II surfaces exhibit a consistent asymmetric geometry with progressive southwestward deepening (Figure 8). The main depocenter corresponds to the Byurtusken depression (≈44–50 × 27–30 km), while the Zhaldybai Ridge (≈70 × 16–17 km; amplitude 110–140 m) and the Central Tasbulak Ridge (≈90 × 20–23 km; amplitude 140–150 m) delineate inherited uplifts in the northeastern and central sectors. Absolute depths range from about −655 m along the northeastern flank to approximately −3370 m within the Byurtusken and Koscuduk depocenters. Depth gradients vary from 5 to 22 m km−1, and local anticlines such as Izykyr (≈8 × 6 km; amplitude ≈ 90–100 m) and Karakoin (≈10 × 6 km; amplitude 160–215 m) define subtle closures superimposed on the regional monocline. Comparison with deeper horizons indicates a consistent trend of ridge enlargement and depression narrowing, reflecting long-lived structural focusing throughout the DPS. These morphotectonic features reflect stable sediment accumulation under weak tectonic influence during the late Paleozoic.
- Tectonic Interpretation
Faults are concentrated along the flanks of major ridges, trending mainly northeast–southwest and north–south. Vertical displacements rarely exceed 50–100 m, confirming low post-depositional deformation. The persistence of fault patterns through younger horizons demonstrates tectonic inheritance and mechanical stability of the trough during early Permian time.
- Reservoir–seal–trap relationships
The sub-evaporitic clastic succession forms the main reservoir zone, while the overlying early Permian evaporite subformation acts as a regionally continuous and highly efficient seal. Gas accumulation is expected within gentle anticlines and fault-bounded closures along the Zhaldybai and Central Tasbulak ridges, as well as within stratigraphic and combination traps along the flanks of the Byurtusken and Koscuduk depocenters, where clastic units thin out. The evaporite caprock ensures long-term retention of hydrocarbons and defines the upper sealing element of the Devonian–Permian petroleum systems in the Tasbulak Trough.
The spatial configuration of the RH-I and RH-II surfaces demonstrates a coherent asymmetric framework dominated by stable subsidence and inherited structural segmentation. These upper horizons record the final phase of trough infill and the establishment of a regional evaporitic seal, which ensured long-term hydrocarbon preservation within sub-evaporitic reservoirs.
Overall, the middle Carboniferous to early Permian clastic–evaporite formation reveals a stable structural framework with limited post-depositional deformation. Persistent ridges and gentle anticlines demonstrate tectonic inheritance, while the sub-evaporitic clastic reservoirs capped by thick evaporites define an efficient reservoir–seal–trap system that ensured long-term gas preservation within the Tasbulak Trough.
4.5.2. Early Carboniferous Carbonate–Clastic Formation (RH-IIIs–RH-IIIk–RH-III)
This interval represents the middle part of the DPS and records the transition from marine carbonate to continental clastic deposition throughout the early Carboniferous (Tournaisian–Serpukhovian). The analyzed reflecting horizons RH-III, RH-IIIk, and RH-IIIs outline the carbonate–clastic formation that integrates productive carbonate intervals, sealing sulfate–clastic units, and organic-rich source facies. Structurally and stratigraphically, this interval forms a key reservoir–seal–source system that governed gas accumulation and preservation within the Tasbulak Trough.
- Structural Configuration
The RH-III to RH-IIIs interval preserves the asymmetric architecture of the trough, with systematic southwestward deepening and persistence of structural elements inherited from upper horizons (Figure 9). Absolute depths range from −323 m along the northeastern flank to −4680 m within the main depocenters, and mean depth gradients reach 19–33 m km−1 (Table 5). The Zhaldybai Ridge (≈70 × 16–17 km; amplitude 110–140 m) and the Central Tasbulak Ridge (≈90 × 20–23 km; amplitude 140–150 m) form the dominant structural highs, whereas the Byurtusken (≈44–50 × 27–30 km) and Koscuduk depressions (≈8–10 × 28–32 km) represent the principal zones of subsidence. Local anticlines, including Izykyr (≈8 × 6 km; amplitude ≈ 90–100 m), S Izykyr (≈7 × 5 km; amplitude ≈ 80–90 m), and Zhaman Aibat (≈10 × 7 km; amplitude ≈ 100–120 m), occur along inherited fault zones, reaffirming the stability and continuity of the structural framework throughout the early Carboniferous. A comparison with deeper horizons indicates that the general tendency toward enlargement of ridge structures and contraction of depression areas persists, reflecting long-lived tectonic segmentation of the trough.
- Tectonic Interpretation
Faulting is more pronounced than in the upper horizons, with vertical displacements up to 150 m (Table 5). Faults trending northeast–southwest and sub-meridionally control ridge geometry and block segmentation of the trough. Their recurrence through successive horizons reflects tectonic inheritance rather than renewed deformation. The structural pattern indicates stable subsidence with mild differential movement along basement lineaments, maintaining the continuity of the Devonian–Carboniferous tectonic regime.
- Reservoir–seal–trap relationships
RH-IIIs defines the top of the late Serpukhovian clastic–sulfate subformation, whose tight, low-permeability lithologies do not provide reservoir quality. Instead, it forms a regional seal above the productive late Visean–early Serpukhovian carbonate subformation. RH-IIIk corresponds to the top of a carbonate unit favorable for potential reefal buildup. Mapped morphologic anomalies near S Izykyr indicate possible zones of enhanced porosity or ancient reef growth. RH-III marks the top of the Tournaisian–early Visean clastic–carbonate subformation that includes organic-rich marine facies and lacustrine–paludal coaly beds recognized as the principal petroleum source rock of the Shu–Sarysu Basin. Within this interval, unconventional self-sourced accumulations may occur where generation, migration, and storage take place within the same lithologic package.
Regionally, the carbonate–clastic formation integrates source, reservoir, and seal elements into a unified petroleum system. Structural traps are associated with gentle anticlines along the Zhaldybai and Central Tasbulak ridges, whereas stratigraphic and combination traps are expected along the flanks of the Byurtusken and Koscuduk depressions, where facies pinch-outs occur. The overlying sulfate–clastic unit ensures regional sealing continuity, defining one of the most promising intervals for gas retention within the DPS.
Taken together, the early Carboniferous carbonate–clastic formation records a stable, differentiated structural regime with moderate faulting and persistent ridges. Carbonate buildups within this interval provide favorable reservoir conditions, overlain by clastic–sulfate seals, while underlying organic-rich facies act as principal source rocks. Together they form an integrated reservoir–seal–trap system characteristic of the key evolutionary stage of the Tasbulak Trough.
4.5.3. Devonian Clastic–Evaporite Formation (RH-IV–RH-V–RH-VI)
The lower part of the DPS captures the earliest phase of sedimentary infill within the Tasbulak Trough after deposition of the early Paleozoic volcanogenic–sedimentary unit. It encompasses the late Devonian clastic and evaporitic cycles that preceded the Carboniferous marine transgression and established the initial basin geometry. The structural configuration and lithologic variability of this interval reveal the formative stage of the trough’s tectonic segmentation and the emergence of the first sealing and reservoir systems.
- Structural Configuration
Surfaces RH-IV to RH-VI outline a pronounced asymmetric basin, deepening southwestward toward the Byurtusken and Koscuduk depressions (Figure 10). Absolute depths vary from about −1800 m on the northeastern flank to over −5200 m in the southern depocenters. Depth gradients increase downward from 21 to 40 m km−1, and fault throws reach 200–250 m (Table 5). The Zhaldybai Ridge delineates the northeastern structural boundary of the trough, whereas the Central Tasbulak Ridge (≈90 × 25–28 km; amplitude 170–180 m) forms a broad intra-trough uplift occupying the central part of its southern sector. The Kamenistaya anticline (≈15 × 9 km; amplitude ≈ 210 m) constitutes a prominent local high along the southeastern flank. Famennian evaporites, confined mainly to the southern part of the trough, accumulated under restricted hydrodynamic conditions and differential subsidence, marking the onset of the persistent asymmetry that characterizes the DPS. Ridge broadening and depression contraction become more pronounced downward, indicating that the basin’s structural segmentation was already established during Devonian time.
- Tectonic Interpretation
The Devonian interval records progressive intensification of faulting with depth. Faults along RH-IV exhibit throws of 100–200 m and are concentrated near ridge flanks and marginal zones. At RH-V, offsets increase to 150–250 m, reflecting late Devonian reactivation of basement discontinuities and block displacements within the trough interior. The RH-VI level shows the most pronounced deformation, with subparallel strike-slip and reverse-fault systems along the margins. Despite localized segmentation, the overall basin geometry remained coherent, and the asymmetric configuration established during the Devonian persisted through later tectonic stages. These features demonstrate that the essential structural framework of the Tasbulak Trough was already defined during early basin evolution.
- Reservoir–seal–trap relationships
The lower clastic strata (RH-V–RH-VI) contain permeable intervals that favor stratigraphic and structural trapping, particularly along ridge flanks and at facies transitions toward the Byurtusken and Koscuduk depressions. The Kamenistaya anticline represents a characteristic structural closure, while additional traps are predicted at stratigraphic pinch-outs. The overlying Famennian evaporite sequence (RH-V–RH-IV) forms a thick but internally heterogeneous seal comprising halite, anhydrite, and interbedded clastic–carbonate layers. Intersalt zones with recorded brine and gas shows (Kamenistaya, Pridorozhnoe) confirm localized fluid migration and entrapment. Although lithologically variable, the Famennian evaporitic strata maintain lateral continuity across the southern half of the Tasbulak Trough.
Overall, the Devonian clastic–evaporite formation reflects an evolutionary stage marked by progressive tectonic segmentation and stabilization of subregional ridges. Porous clastic and intersalt layers offer reservoir potential, whereas the Famennian evaporites constitute a regionally extensive sealing sequence. Together, these elements formed the first stable reservoir–seal–trap framework that later governed hydrocarbon generation and preservation across the Tasbulak Trough.
5. Discussion
The 3D reconstruction of the DPS provides the first integrated structural interpretation of the Tasbulak Trough based on digitized archival seismic and limited well data. Despite sparse coverage and the analog nature of the dataset, the structural framework is coherent across eight horizons and reveals long-term stratigraphic inheritance, persistent segmentation, and systematic reservoir–trap–seal organization. These features clarify the tectonostratigraphic evolution of the trough and its significance for gas accumulation and preservation.
5.1. Overview of Key Findings and Structural Modeling Reliability
This study presents the first horizon-consistent 3D reconstruction of the DPS in the Tasbulak Trough using digitized legacy seismic and restricted well control. Despite the limitations inherent to analog seismograms and sparse subsurface constraints, the resulting structural surfaces show stable geometry across horizons. Comparable robustness has been demonstrated in reconstructions of other data-scarce basins, including the Zagros interior basins [44,45], the Gulf of Suez [46,47,48,49], Mediterranean foreland depressions [50,51], the Polish Lowlands [24], and the Val d’Agri Basin [26]. Recent studies confirm that horizon-based integration of heterogeneous datasets can yield reliable 3D models even under uneven data quality [52].
The reconstructed architecture indicates long-term stratigraphic and tectonic inheritance, consistent with established interpretations from the Po Basin and Apenninic foredeep [49,50], where inherited highs influence deformation and trap architecture. A similar pattern is observed here, with the Central Tasbulak Ridge identified for the first time as a long-lived structural high directing the distribution of structural and combination traps. Comparable inheritance-driven compartmentalization is known from the Gulf of Suez [47,48].
A subtle, regionally coherent low-throw fault network further supports persistent structural segmentation. Similar networks are reported from stable-platform basins of Eastern Europe [52], North Africa [53], and South China [54,55]. The spatial organization of traps follows regionally persistent evaporite and sulfate–clastic seals, consistent with other evaporite-bearing petroleum systems such as South Pars–North Dome [56,57] and the Precaspian Basin [58,59].
The modeled surfaces align with regional geological syntheses, national maps [6,16], atlases and monographs [5,15,19], and basin-scale studies [2,8,13,14,21], confirming their geological plausibility. Parallels with international 3D modeling workflows in data-limited basins [60,61,62] reinforce the reliability of the reconstruction.
5.2. Structural Inheritance and Newly Identified Tectonic Elements
The Tasbulak Trough is organized within a rigid inherited framework defined by the Zhalair–Naiman transpressional zone to the east, the Kokshetau–Zhezkazgan strike-slip system to the west, and the Sarysu and Lower Shu uplifts to the north and south (Figure 1b). This setting controls the NW trend, asymmetry, and depocenters located in the Koscuduk and Byurtusken depressions, consistent with inheritance-driven basin organization in asymmetric foreland and intracratonic systems. The framework remains consistent with earlier regional schemes [5,6,9,16,17,19].
Stratigraphic surfaces from Devonian to Permian are conformable and laterally continuous, indicating long-term tectonic stability. Two inheritance-driven highs—the Zhaldybai Ridge and the newly identified Central Tasbulak Ridge—persist through all horizons. The Central Tasbulak Ridge is a previously unmapped structural high whose behavior parallels basement-controlled ridges in the Jaca Basin [63,64]. The increase in fault throw with depth and the consistent NE–SW structural grain, correspond to the Devonian rift fabric reactivated during Hercynian inversion, demonstrating that the geometry of the ridge and associated anticlines reflects selective inversion of extensional blocks outlined in Section 2.3. Selective reactivation of Devonian extensional fabrics during Hercynian compression produced gentle anticlines and consistent NE–SW fault orientations, mirroring inheritance-guided inversion in the Southern Alps and Po Plain [49,51].
The trough hosts a low-throw fault network (<50 m near the top, increasing to 100–250 m downward), reflecting long-term inheritance rooted in Devonian rifting. Comparable vertical throw gradients are reported from the Amu Darya Basin [34,35] and the Permian Basin [36,37]. Contrasts with the adjacent Kokpansor Trough—characterized by >300–500 m throws and higher fault density—underscore the relative structural stability of the Tasbulak domain, while acknowledging data limitations in the north.
Faults along the Zhaldybai and Central Tasbulak ridges act as mechanical templates that guided uplift, segmented the trough, and localized anticlines and closures. Comparable inheritance-driven segmentation is well established in foreland and inverted basins [49,51].
Overall, the identification of the Central Tasbulak Ridge and its associated fault system demonstrates a durable inheritance-controlled architecture that shaped basin segmentation, deformation pathways, and the structural configuration conducive to trap formation.
5.3. Reservoir–Trap–Seal Relationships and Implications for Gas Preservation
The Tasbulak Trough hosts a full spectrum of trap types—structural, stratigraphic (including intraformational subtypes), and combination traps—summarized in the reservoir–trap–seal matrix (Table 6). The carbonate subformation (RH-IIIk/III) stands out as the most prospective interval, where reef buildups and facies mosaics create high-quality reservoirs, consistent with carbonate systems such as the Sarvak Formation in the Zagros Basin [63,65]. Comparable reservoir–seal configurations have been reported in the Po Plain and Southern Alps, where inherited highs-controlled carbonate facies distribution [49,51].
Table 6.
Priority Evaluation Matrix for Reservoir–Trap–Seal Systems. Abbreviations are in Figure 2.
Additional reservoirs occur within the middle–late Carboniferous to early Permian clastic subformations (RH-II/IIIs) and the late Devonian clastic subformation (RH-V/VI). Hydrocarbon accumulation is also possible within permeable interbeds of the Famennian evaporite subformation (RH-IV/V) represents another reservoir type, supported by documented shows in wells 1-P Sokyr-Tobe and 1-P Kamenistaya and consistent with intersalt reservoir behavior reported for other evaporite-bearing basins of Central Asia and Eastern Europe. In the northern sector, where the Famennian evaporite seal thins or is locally absent, trap integrity decreases and prospectivity shifts toward early Carboniferous carbonates and middle–late Carboniferous clastics. The Tournaisian–middle Visean interval (RH-III/IV) may host self-sourced intraformational plays, whereas the early–middle Devonian volcanogenic sequence beneath RH-VI remains the least promising reservoir candidate.
Trap architecture follows the inherited structural segmentation: structural traps develop along ridges, stratigraphic traps at facies transitions, and combination traps along depression margins. Analogous inheritance-guided trapping patterns occur in the Po Plain and Adriatic region [49], the North Sea, and the Central European Basin System [40].
Three persistent regional seals—the Famennian evaporite (RH-IV/V), the late Serpukhovian sulfate–clastic (RH-IIIs/IIIk), and the early Permian evaporite (RH-I/II)—ensure effective containment. The maximum mapped fault throws (≤250 m) are significantly lower than the average thickness of the main evaporite and sulfate seal formations (>450 m), demonstrating that displacement magnitudes are insufficient to breach these seals even under inversion-related reactivation. Persistent reflectors and lack of major truncation further support effective sealing [38], as observed in the Po Plain and Southern Alps [49].
The detailed delineation of reservoir–trap–seal coupling zones (Table 6), particularly along the Central Tasbulak Ridge, provides a coherent framework for identifying priority intervals, estimating trap integrity, and constraining exploration risk. These patterns align with successful preservation mechanisms in analogous intracratonic systems such as the Polish Permian Basin [39].
5.4. Regional and Global Implications for Inheritance-Driven Basin Architecture
The structural behavior of the Tasbulak Trough contributes to a refined tectono-stratigraphic understanding of inheritance-driven evolution in foreland-type and intracratonic basins. The long-lived mechanical framework—established by Devonian rifting and modified by Carboniferous subsidence and Permian inversion—controlled depocenter orientation, structural highs, and the preservation of reservoir–trap–seal configurations. This pattern accords with classical models of basin evolution in mechanically segmented continental interiors, where basement anisotropies exert first-order control on deformation and stratigraphic architecture.
Comparable inheritance-governed architectures are documented in the Po Plain–Southern Alps, the Jaca Basin, and the Zagros foreland [41,45,64]. The Central Tasbulak Ridge exemplifies a similar inheritance-driven structural high, whose segmentation and mechanical strength influenced anticline geometry, reservoir distribution, and long-term trap stability.
The trough also demonstrates the broader significance of subtle low-throw fault networks in stable cratonic domains. Although displacements are small, their cumulative effect creates predictable segmentation and reinforces regional seals—a style comparable to the Amu Darya Basin, the Polish Permian Basin, and the Central European Basin System [27,34,39].
The persistence and thickness of evaporitic seal formations in the Tasbulak succession align with sealing behavior in the Hormuz and Gachsaran formations of the Middle East and the Occitanian evaporites of southern Europe [56,58,59], where thick ductile units remained effective across multiple deformation phases.
Taken together, the Tasbulak Trough provides a well-constrained example of how inherited structural fabrics, mechanically contrasted stratigraphic intervals, and evaporite-dominated seals interact to govern the long-term evolution of petroleum systems in low-deformation continental interiors. The resulting structural model offers a transferable framework for predicting reservoir distribution, trap formation, and seal continuity in other data-limited basins characterized by early rift inheritance and regionally persistent evaporites.
5.5. Limitations and Outlook
Despite overall coherence, key uncertainties remain due to sparse subsurface coverage. Well control is extremely limited: only three wells contain wireline logs, and no continuous core exists for lithologic calibration. Seismic coverage is uneven and concentrated in the southern half of the trough. Under these conditions, confidence in mapped closures (e.g., Izykyr anticline) is moderate, with vertical uncertainty of ±30–60 m and lateral uncertainty of 100–200 m, consistent with regional-scale 2D interpretations in other intracontinental basins. With a well density of only ~0.3 wells per 1000 km2 and seismic coverage of 3–4 line-km per 100 km2, closure confidence is inherently limited, and small-scale structures with <100 m relief may remain unresolved. Such uncertainty also constrains predictions of the lateral continuity of stratigraphic traps, particularly along depression margins where seismic lines are most widely spaced.
Further uncertainty arises from facies heterogeneity in key reservoir intervals (RH-IIIk/III, RH-II/IIIs, RH-V/VI), local erosion or thinning of sealing units (RH-IV/V), and fault-related juxtaposition risks. These risks increase with depth, where greater fault throws elevate the probability of reservoir–seal misalignment. Together, these factors affect predictions of reservoir continuity, trap integrity, and seal performance.
Future work should prioritize new deep wells with full logging suites and targeted coring, together with modern high-resolution seismic acquisition, particularly in the northern sector. Advanced attribute analysis, coherence and curvature imaging, and AI-assisted structural interpretation will improve fault delineation and facies mapping. Geomechanical and geostatistical modeling may further refine trap integrity and seal continuity. A denser seismic grid (≥8–10 line-km/100 km2) and at least two fully cored reference wells would significantly reduce structural and stratigraphic uncertainty, improving validation of modeled trap geometries. The present model provides a robust first-order framework, but higher-resolution data are essential for reducing exploration risk and improving predictability.
6. Conclusions
Three-dimensional structural surfaces for eight Devonian–Permian horizons were reconstructed using digitized archival seismic and limited well control, yielding the first horizon-consistent 3D model of the Tasbulak Trough. Despite sparse subsurface data, the structural framework is internally coherent and captures the inherited architecture governing trap formation and preservation.
The key new findings are:
- Identification of long-lived structural inheritance, including two persistent ridges and the previously undescribed Central Tasbulak Ridge that organizes basin segmentation from Devonian to Permian.
- Delineation of a vertically coherent low-throw fault network (<50 m in upper intervals, increasing to 100–250 m downward), indicating limited deformation and sustained seal integrity.
- First unified, horizon-consistent 3D structural reconstruction of the Devonian–Permian succession in the Tasbulak Trough, demonstrating that reliable structural modeling is achievable even under sparse, heterogeneous archival datasets.
- Definition of the reservoir–trap–seal matrix, integrating structural, stratigraphic (including intraformational), and combination trap types with their corresponding seal units; the late Visean–early Serpukhovian carbonate subformation is identified as the primary target interval.
- Demonstration that inheritance-driven segmentation, stratigraphic contrasts, and regionally persistent seals jointly control trap evolution and gas preservation, establishing the Tasbulak Trough as a reference model for inheritance-controlled basin architecture and a transferable framework for assessing gas prospectivity in data-limited Paleozoic basins.
Author Contributions
Conceptualization, A.Z.; methodology, A.Z. and A.A.; formal analysis, A.Z.; investigation, A.Z. and A.A.; resources, A.Z.; data curation, A.Z.; writing—original draft preparation, A.Z.; writing—review and editing, A.Z. and A.A.; visualization, A.Z.; supervision, A.Z.; project administration, A.Z.; funding acquisition, A.Z. All authors have read and agreed to the published version of the manuscript.
Funding
This research has been funded by the Science Committee of the Ministry of Science and Higher Education of the Republic of Kazakhstan (Grant No. AP19175313).
Data Availability Statement
The data supporting this study were obtained from the Republican Center for Geological Information Kazgeoinform and are not publicly available due to institutional restrictions. Data derived from these sources are available from the corresponding author upon reasonable request and in compliance with data confidentiality policies.
Acknowledgments
The authors thank the Republican Center for Geological Information Kazgeoinform for providing access to seismic and well data from the Tasbulak Trough.
Conflicts of Interest
The authors declare no conflicts of interest.
Abbreviations
The following abbreviations are used in this manuscript:
| DPS | Devonian–Permian Succession |
| CDP | Common-depth-point |
| GR | Gamma-ray |
| NGT | Neutron-gamma ray |
| RES | Resistivity |
| CALI | Caliper |
| RH | Reflecting horizon |
References
- International Energy Agency (IEA). World Energy Outlook 2023; IEA: Paris, France, 2023; Available online: https://www.iea.org/reports/world-energy-outlook-2023 (accessed on 26 November 2025).
- Zhumagulov, A.; Abetov, A.; Manzari, M.T.; Ismailova, J. Petroleum Systems of the Shu-Sarysu Basin, Kazakhstan: A Review of Devonian–Permian Gas Potential. Geosciences 2025, 15, 232. [Google Scholar] [CrossRef]
- Tleubergenova, A.; Portnov, V.; Karpenko, O.; Maussymbayeva, A.; Madisheva, R. Prospects for the Detection of Structures with Hydrocarbon Deposits along the Geotraverse in the Shu-Sarysu Sedimentary Basin. Nauk. Visnyk Natsionalnoho Hirnychoho Universytetu 2023, 5, 27–33. [Google Scholar] [CrossRef]
- Windley, B.F.; Alexeiev, D.; Xiao, W.; Kröner, A.; Badarch, G. Tectonic Models for Accretion of the Central Asian Orogenic Belt. J. Geol. Soc. Lond. 2007, 164, 31–47. [Google Scholar] [CrossRef]
- Bykadorov, V.A.; Fedorenko, O.A.; Miletenko, N.V. Atlas of Lithological-Paleogeographic, Structural, Palinspastic and Geoecological Maps of Central Eurasia; YUGGEO: Almaty, Kazakhstan, 2002. [Google Scholar]
- Smirnov, A.V.; Korobkin, V.V. Tectonic Map of Kazakhstan at Scale 1:1,000,000 (Principles, Legend, Geological Structures). Izv. NAS RK Geol. Ser. 2003, 2, 77–89. [Google Scholar]
- Korobkin, V.V.; Tulemissova, Z.S. Deep Structure and Geodynamic Conditions of Sedimentary Basin Formation in Southern Kazakhstan (Shu-Sarysu, Pre-Balkhash, Ili). Geol. Okhr. Nedr KazGeo 2018, 3, 24–34. [Google Scholar]
- Zhumagulov, A.S.; Ismailova, J.A. Geological and Geophysical Studies and Exploratory Drilling of Paleozoic Sediments in the Tasbulak Graben. Neft Gaz 2023, 6, 32–42. [Google Scholar] [CrossRef]
- Tleubergenova, A.; Umirova, G.; Maussymbayeva, A.; Portnov, V. Comprehensive Analysis of Magnetic and Gravity Data Based on Volumetric Gravity-Magnetic Modeling along the Geotraverse in the Shu-Sarysu Sedimentary Basin. Visnyk Taras Shevchenko Natl. Univ. Kyiv Geol. 2023, 3, 31–38. [Google Scholar] [CrossRef]
- Tleubergenova, A.; Umirova, G.; Karpenko, O. Geoelectrical Model of the Earth’s Crust Along the Shu-Sarysu Geotraverse According to Magnetotelluric Soundings. Nauk. Visn. Nats. Hirn. Univ. 2023, 3, 18–25. [Google Scholar] [CrossRef]
- Zhang, K.; Pang, X.; Zhao, Z.; Shao, X.; Zhang, X.; Li, W.; Wang, K. Pore Structure and Fractal Analysis of Early Carboniferous Carbonate Reservoirs in the Marsel Area, Shu-Sarysu Basin. Mar. Pet. Geol. 2018, 93, 451–467. [Google Scholar] [CrossRef]
- Alikhanov, T.A.; Petlenko, O.V.; Kurmanov, S.K. Seismic Survey (CDP) in the Tasbulak Trough of the Shu–Sarysu Depression, 1991–1993; Report of the Tesbulak Party 10/91–93; JSC Almatygeofizika: Almaty, Kazakhstan, 1994; pp. 58–67, (Unpublished, Archive of RCGI “Kazgeoinform”). [Google Scholar]
- Zhumagulov, A.S.; Ismailova, J.A. Stratigraphy and Lithology of the Paleozoic Deposits in the Tasbulak Graben, Shu-Sarysu Basin. Neft i Gaz 2023, 5, 6–16. [Google Scholar] [CrossRef]
- Zhumagulov, A.S.; Manzari, M.T.; Issayev, S.A. Petroleum Plays and Prospectivity of the Shu-Sarysu Basin. News NAS RK Ser. Geol. Tech. Sci. 2022, 6, 261–275. [Google Scholar] [CrossRef]
- Akchulakov, U.; Zholtaev, G.G.; Kuandykov, B.M.; Iskaziev, K. Atlas of Oil and Gas Bearing and Prospective Sedimentary Basins of the Republic of Kazakhstan; KazMunayGas: Astana, Kazakhstan, 2014; p. 97. [Google Scholar]
- Bekzhanov, G.R. (Ed.) Geological Map of Kazakhstan, Scale 1:1,000,000; Committee of Geology and Subsoil Use: Almaty, Kazakhstan, 1996. [Google Scholar]
- Bulekbayev, Z.E.; Vocalevskyi, E.S.; Eskuzhiev, B.A.; Kamalov, S.M.; Korostyshevskyi, M.N.; Kuandykov, B.M.; Kuantaev, N.E.; Marchenko, O.N.; Matloshinsky, N.G.; Nazhmetdinov, A.S.; et al. Oil & Gas Fields of Kazakhstan; Information Presentation Center: Almaty, Kazakhstan, 1996; pp. 305–321. [Google Scholar]
- Wang, Y.; Lin, C.; Sun, Y.; Liu, J.; Li, H.; He, H.; Wang, Q.; Ji, M.; Zhang, M.; Zhao, B.; et al. Depositional Sequences and Microfacies of Early Carboniferous Strata in the Marsel Block. Carbonates Evaporites 2020, 35, 43. [Google Scholar] [CrossRef]
- Daukeev, S.Z.; Votsalevskiy, E.S.; Uzhkenov, B.S. Deep Structure and Mineral Resources of Kazakhstan; Oil and Gas: Almaty, Kazakhstan, 2002; pp. 201–215. [Google Scholar]
- Kurmanbayev, R.; Shmanov, A.; Zhaksylyk, E.; Duisembayev, A. Tectonic Zoning and Hydrocarbon Prospectivity of the Chu–Sarysu Basin. Geol. Subsurf. Resour. Kazakhstan 2022, 4, 45–58. [Google Scholar]
- Zhumagulov, A.S.; Manzari, M.T.; Kezembayeva, G.B.; Nurmakova, S.M.; Mukanov, D.B. Tectonic Evolution and Hydrocarbon Accumulation of the Shu-Sarysu Basin. News NAS RK Ser. Geol. Tech. Sci. 2022, 5, 289–305. [Google Scholar] [CrossRef]
- Zhang, M.; Lin, C.; Sun, Y.; Liu, J.; Li, H.; Wang, Q.; Wang, Y. Sequence Framework, Depositional Evolution and Controlling Processes of the Early Carboniferous Carbonate System, Chu–Sarysu Basin, Southern Kazakhstan. Mar. Pet. Geol. 2020, 111, 544–556. [Google Scholar] [CrossRef]
- Zhumagulov, A.S. Geological Structure and Prospects for Oil and Gas Content of the Middle-Upper Paleozoic Deposits of the Tasbulak Trough Based on Geological and Geophysical Data. Ph.D. Thesis, Satbayev University, Almaty, Kazakhstan, 2024. [Google Scholar]
- Wójcik, K.; Zacharski, J.; Łojek, M.; Wróblewska, S.; Kiersnowski, H.; Waśkiewicz, K.; Wójcicki, A.; Laskowicz, R.; Sobień, K.; Peryt, T.; et al. New Opportunities for Oil and Gas Exploration in Poland—A Review. Energies 2022, 15, 1739. [Google Scholar] [CrossRef]
- Klett, T.R. Total petroleum systems of the Grand Erg/Ahnet Province, Algeria and Morocco; the Tanezzuft-Timimoun, Tanezzuft-Ahnet, Tanezzuft-Sbaa, Tanezzuft-Mouydir, Tanezzuft-Benoud, and Tanezzuft-Béchar/Abadla. U.S. Geol. Surv. Bull. 2000, 2202-B. [Google Scholar] [CrossRef]
- Morandi, S.; Ceragioli, E. Integrated interpretation of seismic and resistivity images across the “Val d’Agri” graben (Italy). Ann. Geophys. 2002, 45, 259–271. [Google Scholar] [CrossRef]
- Scheck-Wenderoth, M.; Cacace, M.; Hoffmann, M. Integration of geological and geophysical data for 3D modeling. Int. J. Earth Sci. 2014, 103, 235–256. [Google Scholar]
- Kosović, I.; Matoš, B.; Pavičić, I.; Pola, M.; Mileusnić, M.; Pavić, M.; Borović, S. Geological modeling of a tectonically controlled hydrothermal system in the southwestern part of the Pannonian basin (Croatia). Front. Earth Sci. 2024, 12, 1401935. [Google Scholar] [CrossRef]
- Lin, B.; Zhou, L.; Lv, G.; Zhu, A. 3D Geological Modelling Based on 2D Geological Map. Ann. GIS 2017, 23, 117–129. [Google Scholar] [CrossRef]
- Mejía Benavides Höglund, N. Digitization and Interpretation of Vintage 2D Seismic Reflection Data from Hanö Bay, Sweden. Ph.D. Thesis, Lund University, Lund, Sweden, 2016. Available online: https://lup.lub.lu.se/student-papers/record/8888564 (accessed on 26 November 2025).
- Institute of Geoinformation Technologies. GeoOffice Solver: User Manual. Available online: https://geoofficesolver2022.turbo.site (accessed on 26 November 2025).
- TNO-GSN (Geological Survey of The Netherlands). Digitizing and Reprocessing Seismic Archive Data of the Geological Survey of the Netherlands for Offshore Wind Farms. TNO Report R10785. 2022. Available online: https://offshorewind.rvo.nl/file/download/19164c0f-2385-4405-ad72-15525353dee9/r10785-digitizing-and-reprocessing-seismic-archive-data-of-the-geological-survey-of-the-netherlands-for-offshore-windfarms.pdf (accessed on 26 November 2025).
- Gerasimov, A.N. Vector SGY, version 3.6; AquaSoft; Aquarius Software: Kostroma, Russia, 2023. Available online: http://aqua-soft.ru/vsgy.php (accessed on 26 November 2025).
- Ulmishek, G.F. Petroleum Geology and Resources of the Amu-Darya Basin, Turkmenistan, Uzbekistan, Afghanistan, and Iran. U.S. Geological Survey Bulletin 2201-H; 2004. Available online: https://pubs.usgs.gov/bul/2201/H/pdf/B2201H_508.pdf (accessed on 26 November 2025).
- Brunet, M.-F.; Sobel, E.R.; McCann, T. Geological Evolution of Central Asian Basins and the Western Tien Shan Range; Special Publications; Geological Society: London, UK, 2017; Volume 427. [Google Scholar] [CrossRef]
- Waite, L.E. Review of Anatomy of a Paleozoic Basin: The Permian Basin, USA, Volumes 1 and 2. Int. Geol. Rev. 2021, 63, 1559–1560. [Google Scholar] [CrossRef]
- Hills, J.M. Tectonics of Western Permian Basin. AAPG Bull. 1981, 65, 762. [Google Scholar] [CrossRef]
- Liu, S.; Yang, Y.; Deng, B.; Zhong, Y.; Wen, L.; Sun, W.; Li, Z.; Jansa, L.; Li, J.; Song, J.; et al. Tectonic evolution of the Sichuan Basin, Southwest China. Earth Sci. Rev. 2021, 213, 103470. [Google Scholar] [CrossRef]
- Wójcik, K.; Pietsch, K.; Mazur, S. Multiscale Subsurface Structural Study—Insights from the Polish Part of the Southern Permian Basin. J. Struct. Geol. 2025, 188, 105568. [Google Scholar] [CrossRef]
- Phillips, T.B.; Magee, C.; Jackson, C.A.-L.; Bell, R.E. Determining the Three-Dimensional Geometry of a Dike Swarm and Its Impact on Later Rift Geometry Using Seismic Reflection Data. Geology 2018, 46, 119–122. [Google Scholar] [CrossRef]
- Koyi, H.; Petersen, K. Influence of Basement Faults on the Development of Salt Structures in the Danish Basin. Mar. Pet. Geol. 1993, 10, 82–94. [Google Scholar] [CrossRef]
- He, X.; Guo, G.; Tang, Q.; Wu, G.; Xu, W.; Ma, B.; Huang, T.; Tian, W. The Advances and Challenges of the Ediacaran Fractured Reservoir Development in the Central Sichuan Basin, China. Energies 2022, 15, 8137. [Google Scholar] [CrossRef]
- Nicoletti, L.; Hidalgo, J.C.; Strąpoć, D.; Moretti, I. H2 Transport in Sedimentary Basin. Geosciences 2025, 15, 298. [Google Scholar] [CrossRef]
- Sattarzadeh, Y.; Cosgrove, J.W.; Vita-Finzi, C. The Interplay of Faulting and Folding during the Evolution of the Zagros Deformation Belt. In Forced Folds and Fractures; Special Publications; Cosgrove, J.W., Ameen, M.S., Eds.; Geological Society: London, UK, 2000; Volume 169, pp. 187–196. [Google Scholar] [CrossRef]
- Vergés, J.; Saura, E.; Casciello, E.; Fernàndez, M.; Zoetemeijer, R.; Cloetingh, S. Crustal-Scale Cross-Sections across the NW Zagros Belt: Implications for the Arabian Margin Reconstruction. Geol. Mag. 2011, 148, 739–761. [Google Scholar] [CrossRef]
- Moustafa, A.R. Controls on the Development and Evolution of Transfer Zones: The Influence of Basement Structure and Sedimentary Thickness in the Suez Rift and Red Sea. J. Struct. Geol. 1997, 19, 755–768. [Google Scholar] [CrossRef]
- Bosworth, W.; Bosworth, W.; McClay, K. Structural and Stratigraphic Evolution of the Gulf of Suez Rift, Egypt: A Synthesis. In Peri-Tethys Memoir 6: Peri-Tethyan Rift/Wrench Basins and Passive Margins; Ziegler, P.A., Cavazza, W., Robertson, A.H.F., Crasquin-Soleau, S., Eds.; Mémoires du Muséum National d’Histoire Naturelle: Paris, France, 2001; Volume 186, pp. 567–606. [Google Scholar]
- Younes, A.I.; McClay, K. Development of Accommodation Zones in the Gulf of Suez–Red Sea Rift, Egypt. AAPG Bull. 2002, 86, 1003–1026. [Google Scholar] [CrossRef]
- Turrini, C.; Toscani, G.; Lacombe, O.; Roure, F. Influence of Structural Inheritance on Foreland–Foredeep System Evolution: An Example from the Po Valley Region (Northern Italy). Mar. Pet. Geol. 2016, 77, 376–398. [Google Scholar] [CrossRef]
- Turrini, C.; Bisica, B.; Ryan, P.; Shiner, P.; Lacombe, O.; Roure, F. 3D Structural and Thermal Modeling of Mesozoic Petroleum System in the Po Valley, Northern Italy. Pet. Geosci. 2018, 24, 172–196. [Google Scholar] [CrossRef]
- Zuffetti, C. Characterization and Modelling of Complex Geological Architectures: The Quaternary Fill of the Po Basin at the Po Plain–Apennines Border (Lombardy, Italy). Ph.D. Thesis, Università degli Studi di Milano, Milan, Italy, 2018. [Google Scholar]
- Saintot, A.; Stephenson, R.; Stovba, S.; Maystrenko, Y. Structures Associated with Inversion of the Donbas Foldbelt (Ukraine and Russia). Tectonophysics 2003, 373, 181–207. [Google Scholar] [CrossRef]
- Turner, P.; Baouche, R.; Sabaou, N. Triassic–Early Jurassic Evaporites of the Saharan Platform, Algeria: Astronomical and Geodynamic Constraints on Stratigraphy and Sedimentation. J. Afr. Earth Sci. 2023, 205, 104994. [Google Scholar] [CrossRef]
- Jia, C.; Wei, G. Structural Characteristics and Petroliferous Features of Tarim Basin. Chin. Sci. Bull. 2002, 47, 1–11. [Google Scholar] [CrossRef]
- Wu, S.; Han, Q.; Ma, Y.; Dong, D.; Lü, F. Petroleum System in Deepwater Basins of the Northern South China Sea. J. Earth Sci. 2009, 20, 124–135. [Google Scholar] [CrossRef]
- Spina, A.; Cirilli, S.; Sorci, A.; Schito, A.; Clayton, G.; Corrado, S.; Fernandes, P.; Galasso, F.; Montesi, G.; Pereira, Z.; et al. Assessing thermal maturity through a multi-proxy approach: A case study from the Permian Faraghan Formation (Zagros Basin, Southwest Iran). Geosciences 2021, 11, 484. [Google Scholar] [CrossRef]
- Alsharhan, A.S.; Nairn, A.E.M. Sedimentary Basins and Petroleum Geology of the Middle East; Elsevier: Amsterdam, The Netherlands, 1997; pp. 634–641. ISBN 9780444824653. [Google Scholar]
- Volozh, Y.A.; Antipov, M.P.; Garagash, I.A.; Lobkovsky, L.I.; Brunet, M.-F.; Cadet, J.-P. Pre-Mesozoic Geodynamics of the Precaspian Basin (Kazakhstan). Sediment. Geol. 2003, 156, 35–58. [Google Scholar] [CrossRef]
- Belonin, M.D.; Bulach, M.K.; Vorobyev, V.Y.; Galushkina, Z.A.; Gembitskaya, L.A.; Dimakov, A.I.; Zharkov, A.M.; Karpova, T.G.; Kirichkova, A.I.; Kuzmin, V.V. Atlas of the Russian Precaspian: Oil, Gas, Coal; Resources and Development; NVNIIGG: Saint Petersburg/Saratov, Russia, 2000; pp. 71–95. [Google Scholar]
- Wellmann, J.F.; Regenauer-Lieb, K. Uncertainties have a meaning: Information entropy as a quality measure for 3-D geological models. Tectonophysics 2012, 526–529, 207–216. [Google Scholar] [CrossRef]
- Groshong, R.H. 3-D Structural Geology: A Practical Guide; Springer: Berlin/Heidelberg, Germany, 2006; pp. 305–372. [Google Scholar] [CrossRef]
- Bond, C.E.; Gibbs, A.D.; Shipton, Z.K.; Jones, S. What do you think this is? “Conceptual uncertainty” in geoscience interpretation. GSA Today 2007, 17, 4–10. [Google Scholar] [CrossRef]
- Saffari, M.; Kianoush, P.; Saffari, B.; Adib, A. Sedimentological and diagenetic insights into the Sarvak Formation evaluating reservoir characteristics and depositional environments in the Zagros Basin. J. Pet. Explor. Prod. Technol. 2025, 15, 146. [Google Scholar] [CrossRef]
- Muñoz, J.A.; Izquierdo-Llavall, E.; Santolaria, P.; Toro, R.; Pueyo, E.L.; Casas, A.M.; Granado, P. Inheritance in Shortening Transfer and Kinematics in Fold-and-Thrust Belts: Revisiting the Structure of the Jaca Basin, Southern Pyrenees. Earth Sci. Rev. 2025, 270, 105237. [Google Scholar] [CrossRef]
- Radwan, A.E. Three-dimensional gas property geological modeling and simulation. In Sustainable Geoscience for Natural Gas SubSurface Systems; Wood, D.A., Cai, J., Eds.; Elsevier: Kidlington, UK, 2022; pp. 29–49. [Google Scholar] [CrossRef]
Disclaimer/Publisher’s Note: The statements, opinions and data contained in all publications are solely those of the individual author(s) and contributor(s) and not of MDPI and/or the editor(s). MDPI and/or the editor(s) disclaim responsibility for any injury to people or property resulting from any ideas, methods, instructions or products referred to in the content. |
© 2025 by the authors. Licensee MDPI, Basel, Switzerland. This article is an open access article distributed under the terms and conditions of the Creative Commons Attribution (CC BY) license (https://creativecommons.org/licenses/by/4.0/).