Abstract
The latest exploration developments and discoveries from the eastern Mediterranean documented that Neogene formations can act as source-rocks for hydrocarbon generation and their exploitation delivered large amounts of mostly biogenic gas to the market. Examples of such offshore gas-fields include the Zohr-Egypt, Leviathan/Tamar-Israel, and Aphrodite-Cyprus. Having attracted the oil majors’ attention for hydrocarbons exploration in southern Greece (e.g., Exxon-Mobil, Chevron), by using onshore geologic analogs, we suggest relevant perspectives in the country’s offshore sector. Our study focuses on Miocene marine deposits exploration, from Gavdos Island, southern Greece, evaluating their characteristics as potential source-rocks affected by a paleodepositional framework. By integrating fieldwork, organic (Rock-Eval VI-pyrolysis, CHNS) and inorganic geochemical data (XRF), the current results indicate gas-prone organic matter with variable preservation status, reflecting a few oxidation episodes during deposition under generally dysoxic-to-suboxic conditions. Paleoclimatic weathering indices (CIA, C.I., Sr/Cu, Rb/Sr) suggest predominantly arid to semi-arid regimes punctuated by short-lived humid phases that locally enhance organic accumulation and nutrient supply. Variations in paleosalinity and stratification, particularly within the Messinian section, are interpreted as precursors to the Messinian Salinity Crisis. Our findings highlight the potential for hydrocarbon-prone intervals in the deeper-offshore Eastern Mediterranean basins, where most favorable conditions for organic-carbon preservation and maturation are documented by the discoveries.
1. Introduction
Geographically, Gavdos is the southernmost island of Greece and Europe, and lies south of western Crete in the central-eastern Mediterranean Sea (Figure 1). The island has a limited size and covers approximately 33 km2. Despite its small size, the island holds a major role in the geotectonic map of the Mediterranean.
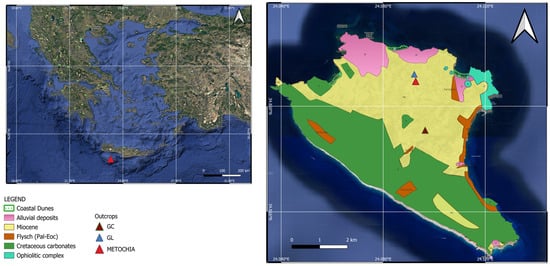
Figure 1.
Map of Greece (Gavdos Island is marked by the triangle, on the left) and geological map of Gavdos with the studied outcrops and their legend (GIS map generated according to original geological map IGME, sheet 320, by Vidakis, 1988 on the right). Note that the Cretaceous carbonates belong to the Pindos–Ethia Unit and include extended occurrences of black silex layers.
Together with the adjacent Crete Island, Gavdos, has long been considered as a type of geological laboratory, particularly in relation to the study of its Neogene age deposits. Among the first publications on the Miocene stratigraphic framework of the island are those of [1,2]. They reported on the cyclicity of deposition, and related it to the astronomical cycles of precession and eccentricity, pointing out the alternation of hemipelagic marls and laminites (described as sapropels).
Apart from the paleoenvironmental importance relevant to the climate–ocean–biosphere interactions, the Miocene sapropel-like intervals on Gavdos bear significance for another widely applicable reason: their enrichment in organic carbon and geochemical character underline a possible potential for hydrocarbon generation [3], making Gavdos a valuable onshore analogous case for linking paleoceanographic processes to source-rock quality maturation and preservation.
By studying samples from two Miocene age outcrops of Gavdos Island in the eastern Mediterranean, this work investigates the potential of these strata to generate gas, under conditions of offshore burial, to be used for energy production. In addition, it addresses for the first time two important issues: the connection or not of the lower (Tortonian) sapropelic layers to the upper ones (lower Messinian) pre-evaporitic succession, developed prior to the Messinian Salinity Crisis, and the existence or not of different sources of sediment supply. By combining field observations and laboratory organic and inorganic geochemical analyses, such as Rock-Eval pyrolysis, CHNS, and XRF analysis, we present results which support new interpretations. Our data document and highlight correlations in the paleodepositional environment prevailing between the two geological periods, as they are reflected in their hydrocarbon generation potential, the relevant elemental ratios, and various paleoclimate parameters through geochemical proxies, and provide clues for future exploration in the eastern Mediterranean, an area where, for the last two decades, such operations have dominated the energy sector (e.g., natural gas discoveries in Egypt, Cyprus, and Israel).
2. Geological Background
2.1. Geological Setting of Gavdos Island
Geologically, Gavdos Island is situated just north of the Hellenic Trench, at the bending point from the NNW-SSE direction to the NNE-SSW, marking a boundary zone between the northward subducting African plate and the overriding Aegean microplate, being part of the Eurasian plate. Beneath Gavdos, the crust thins, and the observed Moho is at 26 km depth, while further to the north, south of Crete Island, it reaches a thickness ranging between 32 and 40 km [4]. The trench should be considered as part of a forearc developing structure [5]. According to the intense active offshore tectonics due to its proxy to the active subduction processes, Gavdos is seated between the West and East Cretan Troughs (WCT and ECT, respectively), with steep flanks (highly indicative of the system geodynamics) in both sides. The WCT actually represents the continuation of the onshore Samaria Gorge, a significant geomorphologic structure of western Crete (UNESCO Heritage Site—National Park) known worldwide as the submarine Samaria Canyon [6]. Kinematics of the Aegean microplate at its southern sector are dominated by strike-slip faulting during Plio-Quaternary [7]. Recently, it was documented by studying deep seismic reflection data that active thrust-faulting is widespread in the offshore area south of Crete, and that, often, normal faults as well as strike-slip ones are rather “shallower” upper-plate structures and terminate at those thrust-planes (Hellenic forearc sector) [8]. Gavdos (or Gavdos Rise) is likely formed during late N–S shortening, which followed earlier N–S extension and graben formation and contributed to the Mediterranean Ridge accretionary wedge (developed further to the south of Gavdos) from around 11 Ma onwards [9].
Gavdos Island is composed of both Mesozoic strata, and younger Cenozoic to Quaternary sedimentary deposits [10]. The Mesozoic sequence is composed mainly of limestones, overlain by Cenozoic (Eocene) flysch, along with scattered ophiolitic bodies (notably at Sarakiniko Bay) and a few metamorphic rocks. Both the carbonates/flysch and the ophiolites are considered allochtonous, i.e., they are not in situ, but they have been tectonically transferred and emplaced at their present location. The thin-to-medium-bedded micritic limestones of Cretaceous age belong to the Pindos–Ethia zone (deep-water deposition) and dominate the southern and southwestern sectors of the island. They are aligned to a NNW-SSE orientation, parallel to the general Hellenides geotectonic zones trend, while flysch clastics are very restricted locally, and occur mainly at the eastern and southwestern coast. The only occurrence of the ophiolitic complex is quite restricted at the northeastern peninsula of Gavdos (between Sarakiniko and Karave Gulfs) (Figure 1, IGME geological map by Vidakis, 1988).
Neogene to Quaternary carbonate–clastic successions are widespread. The Neogene strata unconformably overlie the pre-Neogene units, covering most of the island’s central and northern parts. Deposits that are younger in age include Pleistocene marine terraces of marly limestones (for a detailed literature review, compare [11,12]) and recent-to-Holocene cross-bedded aeolianites bearing a lot of rhizoliths. The Neogene succession is the result of intensive tectonics, probably associated with the subduction initiation mentioned above. The dominant force of the extension is believed to be arc-normal pull, combined with intra-plate opening during the mid-late Miocene [13]. In this context, a paleogeographic configuration with a number of basins was developed, where marine sedimentation commenced. As the active arc further evolved (and it still continues), tectonically uplifted blocks separated and disrupted these basins, resulting in the recent distribution of the Miocene-to-Plio Pleistocene deposits.
The Neogene is litho- and bio-stratigraphically divided into two formations, namely, the Potamos and Metochia [11,14]. The former, dated bio-stratigraphically to the middle Serravallian up to lower Tortonian, is overlain by the Metochia Formation, which spans the middle Tortonian to Messinian [15]. The Metochia, is a synthetic section (lower: A, B, C and upper: D), and comprises a continuous Tortonian-to-Messinian depositional sequence that, due to its unique characteristics and continuity, has been extensively studied in the past three decades [1,2,16,17]. The recorded rhythmic alternation of organic-rich sapropelic layers with hemipelagic marlstones reflects orbitally driven sedimentary cycles. According to magnetostratigraphy, a basal age of 9.642 Ma was assigned to it. A number of ca. 58 sapropelic cycles was identified in Metochia-B and ca. 40 in Metochia-C [2]. Subsequent geochemical and provenance studies linked these deposits to alternating humid–arid climatic phases, while a shift from terrigenous to marine input is the postulated up-section [18,19,20]. Paleofloral analysis from the Tortonian deposits indicated that the paleogeographic setting, rather than temperature shifts, mainly influenced the island’s environment [21]. By studying Messinian benthic foraminifera from the Metochia D section, [22], we documented high primary productivity periods, with bottom-water dysoxic conditions pointing to temporal stratification. More recently, [23] interpreted the limestones intercalated in the uppermost Metochia (part D) as evaporitic, marking salinity rise and the onset of the Messinian Salinity Crisis at ~6.0 Ma.
2.2. Depositional Framework of Sapropels
Sapropels are cyclic, organic-rich, laminated sedimentary deposits that record coupled paleo-changes in the climate (astronomical cycles and orbital forcing), hydrological framework, oceanographic circulation, and biogeochemistry across the Mediterranean Neogene–Quaternary geological period ([24,25,26] and references therein). In the initial “quantitative” definition of [27], sapropels should include organic carbon greater than 2% wt. However, since then, other suggestions have been made (i.e., sapropelic layer) on how we can refer to laminated strata with distinct dark/white alternations of silty to marly beds, even with a lower than 2% TOC (total organic carbon) content [25,28,29]. Additionally, they usually record redox-sensitive metals (among others, the Mo, V, and U [30,31,32]).
Early interpretations suggested sluggish circulation under warm climates [33], but subsequent studies highlighted the importance of the astronomically paced factor, freshwater pulses, Mediterranean basin physiography, and sill-restricted sub-basins as key amplifiers of stratification and carbon burial [1,32,34,35]. Currently, it is generally believed that orbitally paced increases in northern summer insolation strengthened the African monsoons and enhanced freshwater and nutrient fluxes into the (paleo-)Mediterranean basin [36,37,38,39]. This influx of freshwater into the marine water body promoted surface-water stratification, suppressed deep-water ventilation, and fostered dysoxia to euxinia in bottom waters, conditions that are most favorable for organic matter preservation [31,40,41]. Nutrient loading from riverine runoff seasonally boosted primary productivity, and altogether the above processes generate the dark, organic-rich laminae that are defined as sapropels [42,43,44]. Evidence for this coupled productivity–preservation mechanism includes geochemical signals of euxinia, such as trace-metal enrichments and pyrite characteristics, together with the redox-sensitive element patterns mentioned previously [32,45,46,47,48], as well as sulfur/iron speciation [49,50]. Microfossil and nannofossil assemblage changes further document particular paleoenvironmental conditions through ecological stress during sapropel (or sapropelic layers) and/or diatomites deposition [22,51,52,53].
Particularly for the Metochia section on Gavdos Island, which is part of our current research, the data from the literature support the idea of sapropels forming during combined precession-induced minima and obliquity-forced signals, related to oscillations of excess runoff (wet) and dry conditions [18]. As pointed out by [54], all these changes in climate, interfingering with a background tectonic trend, resulted in the deposition of the studied strata (climate–tectonic coupling).
3. Materials and Methods
3.1. Samples
Two outcrops from Gavdos Island, designated GL# and GC#, were investigated in this study (Figure 1). The GL# outcrop is located north of the main Metochia-B section described in [1,2]. The GC# section lies southeast of the Metochia section, near the University of Crete facilities for satellites study. The applied methodology involved macro- and meso-scale fieldwork for the identification of the proper outcrop, and then the first description of the major lithofacies focused on rock hand specimen’s observations to identify specific lithologies (e.g., sapropels, mudstones), followed by detailed stratigraphic logging (in centimeter scale), careful cleaning the surface of the altered material, and systematic sampling. Bulk sampling by hammer use was carried out at both outcrops, yielding a total number of fifty-nine (59) samples: thirty-five (35) from the GL# section and twenty-four (24) from the GC# section. The collected material includes both sapropelic layers and marlstone facies (mudstones, siltstones).
3.2. Rock-Eval VI Pyrolysis (RE6)
Rock-Eval pyrolysis was performed on all 59 samples using a Rock-Eval VI® (RE6) anhydrous open-system pyrolyzer (Vinci Technologies, Nanterre, France) [55,56] following standard protocols for organic matter (OM) characterization [57,58]. Samples were finely powdered (<250 µm), oven-dried overnight, and analyzed through sequential pyrolysis and oxidation steps [56]. For each run, ~50–70 mg of dried material was placed in a RE VI crucible. Comprehensive descriptions of the analytical procedures and interpretive approaches for the RE VI system are available in previous works [55,57,59,60,61,62,63,64].
Volatile hydrocarbons were quantified using a flame ionization detector (FID). Pyrolysis was initiated isothermally at 300 °C, followed by heating at 25 °C/min up to 650 °C. Subsequent oxidation was carried out from 300 to 850 °C with a heating rate of 20 °C/min. The principal Rock-Eval parameters obtained include S1 [free hydrocarbons, mg HC/g rock], S2 [hydrocarbons released from kerogen during pyrolysis, mg HC/g rock], S3 [CO2 yield from organic matter breakdown, mg CO2/g rock], Tmax [temperature of maximum hydrocarbon generation, °C], TOC [total organic carbon, %wt.], Hydrogen Index (HI, mg HC/g TOC), and Oxygen Index (OI, mg CO2/g TOC) [55,56]. Data interpretation was guided by established frameworks [60,65,66,67].
3.3. CHNS Elemental Analysis
CHNS elemental analysis was performed on 10 of the samples in a ThermoFisher Scientific FLASH 2000 Elemental Analyzer. Carbonate-bonded carbon was removed by HCl treatment. Approximately 25 g of powdered sample was treated with ~30 mL of HCl (∼2 M) in glass vials. The vials were heated at 70–80 °C on a hotplate overnight, with continuous magnetic stirring, to ensure the complete dissolution of carbonate phases. Analyses were performed on both untreated and HCl-treated samples, with aliquots of 0.5–10 mg of powdered material. The combustion was performed at 1100 °C and the system was calibrated with BBOT (ThermoFisher Scientific, Waltham, MA, USA, BN/144136), sulfanilamide, and cystine quantitative standards. The calculated measurements were based on the same standards.
3.4. X-Ray Fluorescence (XRF)
X-ray fluorescence (XRF) analyses were carried out in 18 samples, using a SPECTRO XEPOS benchtop spectrometer (AMETEK, Berwyn, PA, USA), equipped with a palladium (Pd) anode X-ray end window tube (air-cooled, 50 W, 50 kV max). The instrument operated using the X-Lab Pro 4.5 software and Turbo Quant screening method. Excitation was performed under helium atmosphere using the Compton secondary/molybdenum mode [68,69]. Measurements were conducted using three irradiation modes as follows: (1) 40 KV (Compton /secondary, Molybdenum), (2) 49 KV (Barke Scatter, Aluminum Oxide), and (3) 17 KV (Bragg Crystal), with an irradiation time of 300 s (5 min) for each mode, resulting in a total duration of 15 min. The spectrometer featured a silicon drift detector (SDD) with Peltier cooling (−25 °C, no liquid nitrogen) and an 8 μm Moxtek Dura-Be window, offering a detector resolution of 160 eV at 5.9 keV (Mn Kα), a peak-to-background ratio of 5000:1, and a stability up to 120 kcounts/s ([68,69]). Each powdered sample (0.5–2 g) was soft-pressed on a flat 4 μm prolene® film Chemplex cup within a 32 mm diameter sample cup for analysis. Quantification was performed in weight percent (%wt.), using X-Lab Pro with glass tablet recalibration (FLX-S AMETEK), and further refined against certified reference materials from IAEA and NIST [68].
4. Results
4.1. Lithostratigraphy
4.1.1. GL# Outcrop
The studied GL# outcrop is a synthetic section located (N 34°51′37.00″, E 024°05′31.90″) north of the main Metochia-B outcrop [1,2]. It is composed of two parts: its basal part (shown in Figure 2a (bot) below) is dominated by a 2.4 m marly sandstone underlain by a 1 m thick gray-to-green muddy siltstone (samples GL#1 and GL#2), where rare and very fine (therefore not shown in Figure 3) oxidation levels were observed. The main body of the outcrop (Figure 2a (top) and Figure 3a) consists of alternations of dark gray sapropelic layers and gray-to-blue marlstones (silty mudstones and silty-to-fine sands). In particular, eight sapropelic-layer intervals with a cumulative thickness of approximately 7 m are clearly identified. The first seven correspond to those originally described in [1] as L1 to L7 (their Figure 3), while the eighth one was sampled at the boundary to the next lithology (a sandstone–turbiditic sequence), which caps by more than 12 m in thickness deposits (in the figure are shown the lower 6m of it) the main studied section.
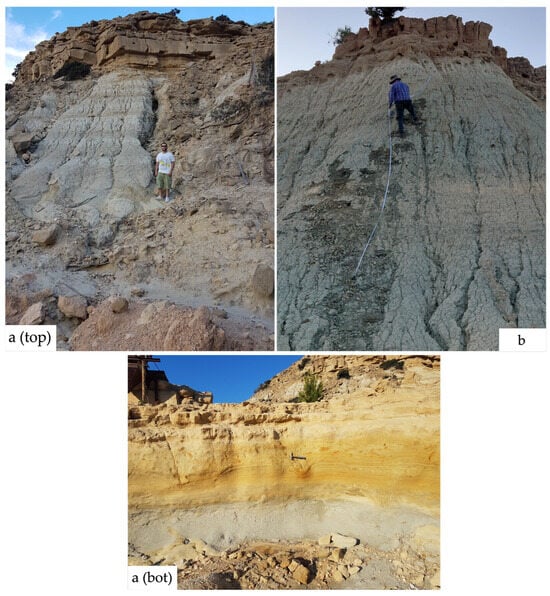
Figure 2.
General view of the investigated outcrops from Gavdos Island bearing typical sapropelic layers horizons: GL#: (a (bot)) lower part and (a (top)) upper part (including at the top of the section a turbiditic sequence) and the GC#: (b) Messinian section (note at the top the bioclastic sandstone).
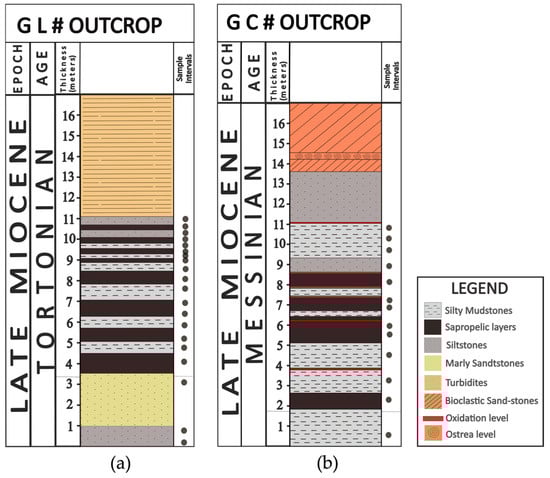
Figure 3.
Lithostratigraphic columns of the investigated GL# (a) and GC# (b) outcrops.
4.1.2. GC# Outcrop
The second section, designated as GC#, is located (N 34°50′32.82″, E 024°05′47.21″) southeast of the Metochia section, in close proximity to the University of Crete Geodetic station buildings. The outcrop has an overall thickness of approximately 16.5 m. Its lowermost part (sample GC#0) is situated a few meters east of the main body of the section and is regarded as its stratigraphic base. Above this level, an almost 12 m thick succession of dark gray alternating sapropelic-like horizons and gray mainly siltstones/mudstones is exposed (Figure 2b and Figure 3b). A key difficulty in this section, however, lies in the presence of oxidation features within several intervals, which obscure the primary sedimentary fabric and make the identification and precise counting of sapropelic layers locally uncertain. Toward the upper part of the sequence, the section is closed at the top by bioclastic sandstones exceeding 2.5 m in thickness, by the base of which a thin Ostrea-bearing level, of a few centimeters thick, was detected.
4.2. Rock-Eval VI Pyrolysis (RE6)
The complete experimental data of the Rock-Eval VI pyrolysis for the analyzed samples are shown in Table 1 and Table 2 below for the GL# and GC# outcrops, respectively.

Table 1.
Rock-Eval VI pyrolysis results of GL# outcrop samples. Initialisms used: SM (silty mudstone), SL (sapropelic layer), MS (muddy siltstone), SF (silty-to-fine sand), S (marly sandstone).
Table 2.
Rock-Eval VI pyrolysis results of GC# outcrop samples.
In the GL# section, the TOC content, considering the sapropelic layers, presents a lower limit value of 0.21%wt. and reaches a maximum of 0.5%wt. (sample GL#14), with average values of 0.26%wt. and 0.23%wt. for the remaining lithologies. Relatively comparable values were obtained from the GC# samples, where TOC values of sapropelic layers range between 0.13%wt. and 0.43%wt., with an average of 0.28%wt. across both sapropelic-like and other lithologies.
Considering the remaining Rock-Eval parameters, S2 values fluctuate between 0.02 and 0.52 mg HC/g rock in the GL# outcrop and between 0.02 and 0.17 mg HC/g rock in GC#. Comparing the Hydrogen Index (HI) between the two outcrops, it yields mean values of 41 mg HC/g TOC in GL# and 33 mg HC/g TOC in GC#, with a maximum of 130 mg HC/g TOC across all samples. The Oxygen Index (OI) values range between 133 and 917 mg CO2/g TOC in GL# and 365 and >1000 mg CO2/g TOC in GC#. These results align with the oxidized intervals identified during field observations.
4.3. CHNS Analysis
The CHNS analytical results are summarized in the CHNS Table in the Supplementary Materials. As previously noted, analyses were carried out on both untreated and HCl-treated samples. The most pronounced difference concerns carbon (C): in untreated samples, C content ranges from 2.05 to 5.21%wt., with mean values of 4.28%wt. for GL# samples and 3.00%wt. for GC# samples. After HCl treatment, carbon concentrations decrease considerably to 0.30–0.61%wt., with an average of 0.47%wt. across all samples, indicating that the majority of the carbon was present in inorganic form. In contrast, nitrogen (N) and hydrogen (H) contents show minimal differences between untreated and treated samples (maximum variation <0.3%), with concentrations ranging from 0.05 to 0.11%wt. for N and from 0.27 to 0.76%wt. for H in both outcrops. Sulfur (S) could not be detected as a signal in almost all samples, with the highest recorded value being 0.03%wt.
4.4. Elemental Composition
XRF results are presented in the Supplementary Materials (as XRF1 and XRF2 tables) and the associated major oxides in Table 3. The XRF data indicate enriched concentrations of carbonate-related elements, with Ca ranging from 8.70 to 15.06% wt. and from 7.37 to 10.50% wt. and Mg fluctuating between 1.9 and 3.36%wt. and 2–2.48% wt., in GL# and GC# samples, respectively. The aluminosilicate elements (Si, Al) exhibit relatively low concentrations (Si = 9.9–16.1% wt., Al = 3.9–5.8% wt.), showing an opposite trend to carbonate-related elements (Ca, Mg), which are enriched. The combined contribution of the major oxides (MgO, Al2O3, SiO2, CaO, Fe2O3) accounts for 56–71% wt. of the bulk composition, indicating that these components dominate the sediment matrix. Furthermore, in all samples, the sum of MgO + CaO (15–25.5%) remains consistently lower than that of SiO2 + Al2O3 (27.6–45.6%wt.), suggesting that, despite the elevated carbonate input, the aluminosilicate fraction remains the dominant constituent of the sediments (Table 3).
Table 3.
Distribution of the major oxides (%wt.) from XRF analysis for the studied samples.
4.5. Carbonate Content Determination
Carbonate content was quantified using two complementary approaches. First, total carbon (TC) was measured by CHNS elemental analysis on untreated samples. After drying, the acid-treated residue (by HCl treatment a bit different than [70]) was analyzed for organic carbon (OC) by CHNS elemental analysis. Inorganic carbon (IC) was obtained as the difference between TC and OC and converted to equivalent CaCO3 using the molecular weight conversion factor 8.33 (C → CaCO3; [71,72])
Second, geochemical composition was determined by X-ray fluorescence (XRF). Calcium was reported as CaO and, following previous approaches [73,74,75], converted to equivalent CaCO3. In this study, we applied the stoichiometric factor 1.7848 (CaO → CaCO3 [76,77]), under the assumption that all Ca is present as carbonate [78]. As noted by [79], such an assumption may introduce some uncertainty, which can be reduced through additional calibration procedures, such as those described in as [80,81], leading to more precise results.
Carbonate estimations derived from the two calculations were highly consistent with inter-method deviations between CHNS-based and XRF-based CaCO3 values. These deviations range between 0.3 and 4.5%wt., and the two plot patterns were almost identical, showing a very good matching (Figure 4). This strong convergence supports the reliability of our carbonate quantification and suggests that non-carbonate Ca phases (e.g., silicates, phosphates) are negligible in the analyzed samples.
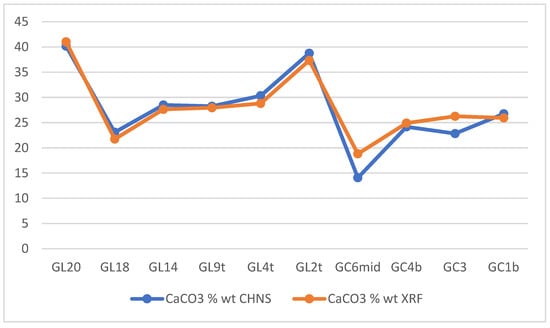
Figure 4.
Percentages of CaCO3 (calculated) from CHNS (blue) and XRF (orange) results.
5. Discussion
5.1. Organic Matter Quality and Source-Rock Assessment
Based on the Rock-Eval VI pyrolysis data, the key parameters (e.g., TOC, S2, HI, and OI) were determined and evaluated. The data were further illustrated through analytical diagrams assessing maturity and the samples potential for hydrocarbon generation.
The HI-Tmax plot ([82], Figure 5 left) illustrates the thermal maturity and kerogen type of the analyzed samples from both outcrops as squares for the GL# samples and circles for the GC# samples. Various lithologies are represented in different colors. The majority of data points cluster within the Type IV kerogen field, which is indicative of inert organic matter for both outcrops, while a smaller subset trends toward Type III kerogen (shown as squares in orange in Figure 5, left), suggesting a limited potential for gas-prone source-rocks. These values belong to the lower part of the GL# outcrop. None of the samples plot within the oil window; rather, they either remain thermally immature or surpass the dry gas window.
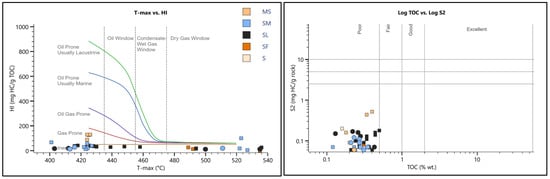
Figure 5.
(Left): HI vs. Tmax plot, showing kerogen type and maturity; (Right): log TOC vs. S2 plot, indicating source-rock (SR) potential. (Squares = GL# samples, circles = GC# samples. Colors denote different lithologies. For initialisms explanation, see Table 1).
Relevant to the TOC values, a slight difference in the minimum and maximum values between the two studied outcrops samples is observed. It is evident that the GL# samples include a slightly higher percentage of TOC, although differences are rather minimal. In addition, the TOC values, although low, fluctuate along the GL#.
Considering the S2 values, most of the analyzed samples, particularly those of the GC# outcrop, fall below the threshold of S2 > 0.2 mg HC/g rock, which reduces the reliability of these measurements for assessing hydrocarbon potential, as has been noted by [60].
The TOC–S2 diagram (Figure 5, right, [60,65]) highlights the overall hydrocarbon generation potentiality of the studied sections’ samples. The plotting of the values obtained for all of them falls within the bottom-left field, corresponding to poor source potential, and a single value approached the fair lower limit of source potential. Slightly lower TOC values are observed along the GC# section, which represents the Messinian, pre-evaporitic interval, where oxidized layers are present at five distinct stratigraphic levels (Figure 3). Thereafter, there is a negative TOC trend recorded from the bottom to the top of the section (Figure 6, right, GC#), while for the GL# outcrop (Tortonian), there is a positive trend, since TOC values are increasing even minutely up-section (Figure 6 left, GL#).
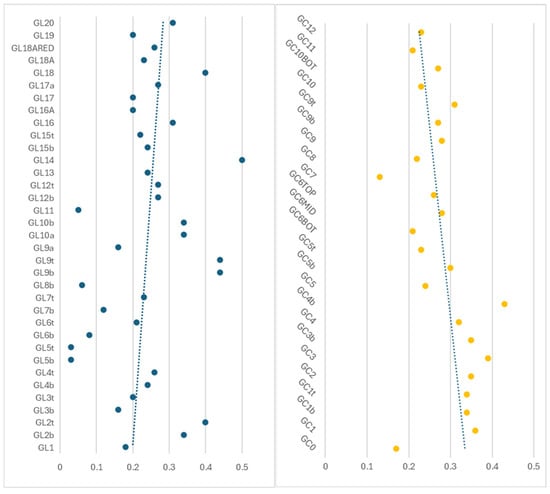
Figure 6.
TOC values of GL# (in blue) and GC# (in yellow) studied samples. By the least square lines, the different trend between the two sections is depicted (increasing upwards, i.e., positive for GL#, decreasing upwards, i.e., negative, for the GC#).
Elevated OI values, coupled with consistently low HI, confirm a strong post-depositional oxidation overprint that was somewhat responsible for degrading the original kerogen signal. This interpretation is consistent with the field observations of the few oxidized horizons recognized and recorded in both GL# and GC# outcrops, although the frequency of them is higher in the later one. Notwithstanding that our sampling protocol fulfilled international standards and was conducted carefully to minimize the impact of surface exposure and alteration, the influence of obviously post-depositional weathering in depth and oxidation likely reduced the preservation of the organic matter, resulting in less favorable geochemical signatures. We strongly believe that the same type and age strata in the offshore area would be able (as potential source-rocks) to maintain much higher values, supporting future gas exploration (compare [27]).
5.2. Bridging Elemental and Rock-Eval Analyses for Organic Matter Typing
The elemental composition of the samples was evaluated after HCl treatment to remove inorganic carbonates, allowing a more accurate assessment of the organic fraction. Carbon content measured by CHNS analysis closely matches the total organic carbon (TOC) values, with a maximum difference of only 0.22%, indicating that the CHNS derived C provides a reliable estimate of the organic carbon present [57,83]. Similarly, the H/C ratios taken from CHNS data are very similar to the H/TOC ratios, confirming the internal consistency of the elemental data. These data are available in the Supplementary Material (Table Carbon). Based on the standard kerogen boundaries defined from both H/C atomic ratios (from CHNS analysis) and Hydrogen Index (HI) values from Rock-Eval 6 pyrolysis, we constructed a cross-plot (Figure 7) to assess kerogen types in our samples [60,61]. This approach allows for the comparison of geochemical signatures, providing insights into the organic matter composition and potential hydrocarbon-generating capacity. By integrating both CHNS and RE6 data, we can identify variations in kerogen across the investigated outcrops, highlighting samples mostly with Type IV characteristics or inert and only one clearly belonging to Type III characteristics [59,61,65], enhancing the results of the previous diagrams.
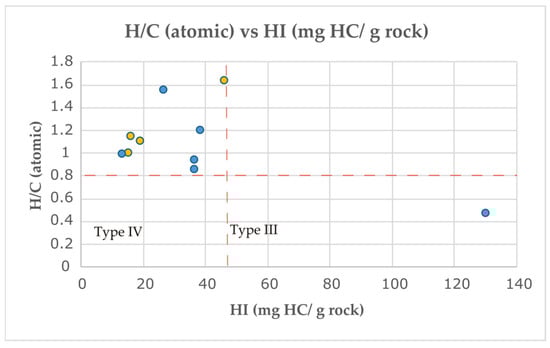
Figure 7.
Cross-plot of HI vs. H/C suggesting types of kerogens in studied samples (yellow: GC# samples, blue: GL# samples).
5.3. Inorganic Geochemical Signatures
5.3.1. Bulk Geochemistry and Sedimentary Inputs
The XRF data (Supplementary Material Tables) reveal enriched concentrations of carbonate-related elements (Ca + Mg), ranging between 9.40 and 12.77 and 11.32 to 18.57 in GC# and GL# outcrops, respectively, with higher values recorded in the GL# than in the GC#. In contrast, aluminosilicate elements (Si + Al) in both studied outcrops range from 17.28 to 21.99 in GC#, and in relatively the same range in GL# (13.29–21.83), displaying an opposite trend to Ca + Mg. The geochemical data indicate a significant contribution of carbonate and biogenic material compared with the terrigenous input [84]. Nonetheless, both the high presence of Ca, and also that of Si- and Al-bearing components, point to a clastic contribution derived from onshore Si-rich lithologies, most likely sourced either from the southern sector of Gavdos Island (dominated by silex intercalated in the of Pindos–Ethia carbonates; compare Figure 1: map), or from the southwestern margins of Crete (well developed Phyllite-Quartzite and Plattenkalk Units [85]) that were already uplifted and exposed during Serravallian-to-Early Tortonian times.
In addition to this compositional signal, Rock-Eval parameters further highlight the impact of redox conditions and oxidative processes on organic matter preservation. The combination of elevated OI values and generally low HI indicates that post-depositional oxidation significantly affected the original organic signal. This interpretation is consistent with field observations, where oxidized horizons were identified in both GL# and GC# outcrops. The alignment of geochemical data with observed oxidized horizons indicates that episodes of partial oxidation under dysoxic to suboxic conditions influenced both bottom-water redox and the degree of organic matter preservation [57,60,84,86].
5.3.2. Paleoenvironment, Redox Conditions, and Paleoclimate
Redox-sensitive trace elements such as V, Ni, Cr, Co, Mo, U, and Th are widely applied to reconstruct depositional redox conditions [32] and organic matter preservation [87]. Among these, the V/ (V + Ni) ratio (see below Figure 8) is frequently employed as an indicator of redox conditions. The redox state of the water column strongly influences organic matter accumulation in source-rocks, with anoxic environments favoring enrichment and oxygen-rich conditions inhibiting it. In the studied samples, the V/(V + Ni) ratio for the GC# section ranges between 0.60 and 1.11, and for the GL# section, between 0.61 and 1.24. Both recorded intervals are indicative of medium-to-strong reducing environment depositional conditions, with a moderately-to-strongly stratified water body overall [88,89,90,91,92,93,94,95,96]. Similarly, V/Cr ratios, ranging from 0.51 to 0.99 and 0.48–1.44 in GC# and GL# samples, respectively, remain below the threshold of 2, being the lower limit for fully anoxic conditions [89,97], suggesting dysoxic to suboxic environments.
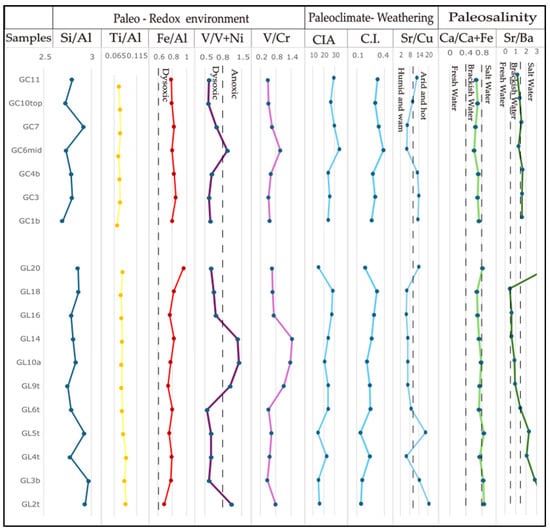
Figure 8.
Geochemical profile of various important element ratios of GC# (upper sector of figure, Messinian age) and GL# (lower sector of figure, Tortonian age) outcrops.
Furthermore, ratios such as Fe/Al, Ti/Al, and Si/Al provide insights into both redox conditions and paleoenvironmental variability (Figure 8). High Fe/Al ratios (>0.6) are typically associated with dysoxic to euxinic conditions. The higher values suggest Fe enrichment under low-oxygen conditions, while lower values are indicative of stable Fe levels [77,98,99,100,101]. In our dataset, Fe/Al ratio values range from 0.79 to 0.85 in GC# and 0.69–0.96 in GL# samples, being over the 0.6 limit, pointing to predominantly dysoxic to suboxic conditions, with GC# ratios having a higher upper (max) value, showing slightly more reducing intervals. Ti/Al ratios, reflecting aridity and dust input, range from 0.071 to 0.079 in GC# and 0.08–0.092 in GL#, indicating generally moderate aridity, with GL# samples recording slightly higher dust flux. Si/Al ratios, ranging between 2.69 and 2.91 in GC#, and 2.77–2.97 in GL#, are consistent with variations in detrital input under changing climatic conditions [102,103,104].
Paleoclimate proxies given by the ratios Sr/Cu and Rb/Sr (Figure 8) support previous observations, reflecting precipitation and chemical weathering intensity. Sr/Cu ratios in the GC# outcrop are overall above 10 (boundary set up by [94]) out of only two sapropelic samples falling below (values of 6.1 and 6.2), while in GL#, lower- and upper-part samples of the outcrop average 16.72 (>10), indicating dry and hot conditions, although the intermediate sapropelic intervals ratios ranging 5.7–7.8 (<10) are usually recording more humid and warm episodes [94,96,105]. Since our Rb/Sr recorded ratios overall are found to be below the 0.5 boundary (ranges: 0.21–0.32 in GC#; 0.09–0.28 in GL#), they further support less precipitation and moderate chemical weathering under arid climate conditions [106,107].
Paleosalinity indicators, which provide key insights into the paleoenvironment, reinforce the above interpretation. Paleosalinity not only informs water chemistry but also influences water column stratification and plankton development, which affects paleoproductivity and organic matter accumulation in sediments [87,108,109,110]. The Sr/Ba ratio is widely used as a proxy for paleosalinity, with higher values indicating more saline conditions, and lower values corresponding to fresh waters [87,94].
In the studied deposits, Sr/Ba ratios range from 1.16 to 1.6 in the GC# outcrop samples and 0.96–4 in the GL# samples, with four GL# samples falling below 0.9, indicating that the water body was predominantly of a transitional setting fluctuating from brackish to saline [87,94,108,109,110]. This interpretation is further supported by the Ca/(Ca + Fe) proxy, as has also been pointed out by [87,109]. A cross-plot of Sr/Ba versus Ca/(Ca + Fe) (Figure 9) shows that most of our samples fall in the brackish-water field, with a subset extending into the saline-water field for the GL# samples, highlighting shifting salinity conditions during deposition along this outcrop.
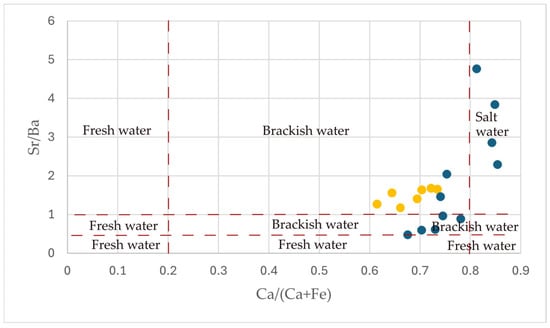
Figure 9.
Cross-plot of Sr/Ba vs. Ca/Ca + Fe suggesting paleosalinity conditions (yellow: GC# samples, blue: GL# samples).
5.3.3. Weathering
Weathering intensity was evaluated using both the Chemical Index of Alteration (CIA; [111]) and the Climate Index (C.I.; [107,112,113,114], Figure 8). Our CIA values ranged from 13 to 29%, indicating very low-to-negligible chemical alteration, comparable to unweathered, feldspar-rich sediments [115]. These values are well below the threshold for semi-humid to humid climates (>60–70%), instead pointing to predominantly arid to semi-arid weathering conditions [107,111]. Similarly, the C.I. values, ranging from 0.26 to 0.39 in GC# and 0.13–0.31 in GL# samples, suggest arid to semi-arid approaching semi-humid conditions [107,113,114]. The CIA versus C.I. cross-plot (Figure 10) further supports this interpretation, showing clear clustering within the low-weathering, from arid to semi-arid/semi-humid, domain. These results suggest that the source area underwent limited chemical alteration under generally dry conditions, punctuated by occasional intervals of slightly more humid climate.
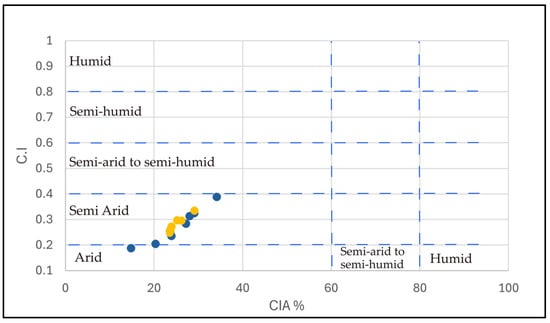
Figure 10.
Cross-plot of CIA vs. C.I. suggesting weathering conditions (yellow: GC# samples, blue: GL# samples).
5.4. Comparison with Relevant Data and Neighboring Areas
This study completes previous research on the organic-rich layers of Metochia [18], the source-rock potential of Gavdos Island [3], and the geochemical characterization of Neogene sediments in Crete Island and Western Greece [116,117,118,119] by providing additional Rock-Eval data gained from two outcrops (GL# and GC#) corresponding to the lower (Tortonian: GL#) and upper (Messinian: GC#) parts of the known Metochia section [1]. The GL# samples correspond to sapropelic layers and mudstones below the turbiditic sequence [2], while the GC# outcrop likely represents the upper cycles of the Metochia-C section (M92–M96) [1]. Exploring these previously geochemically unstudied intervals allows a more comprehensive understanding of the paleogeography and evolution of source-rock potentiality, which prevailed prior to the Messinian Salinity Crisis, during which vast amounts of evaporites were deposited all over the Mediterranean Sea.
Our results indicate poor to negligible hydrocarbon potential, with most samples dominated by Type IV kerogen and some of them tending toward Type III. Compared to the only relevant publication from Gavdos [3], the first part of our study (GL# outcrop, Tortonian) shows more degraded organic matter, and therefore a slightly lower potential than the previously reported poor-to-very good gas-oil generating potential intervals, while the second part (GC# outcrop, Messinian) exhibits similar low TOC, S2 values, and kerogen types, consistent with the previously reported upper marls–sapropel and turbiditic deposits of rather limited potential.
Comparison with other Greek Neogene successions studied for their source-rock potential highlights both similarities and differences. In the neighboring Crete Island to the north, ref. [118] reported TOC values ranging from 0.14 to 2.19%wt. across the Viannos, Skinias, Moulia (Tortonian), and Agios Myron Formations (Tortonian–Messinian age). While the overall kerogen types (III–IV) and low hydrocarbon potential are similar to our investigated samples, the maximum TOC in the Moulia formation and the Messinian Ploutis section exceed the ones reposted here, indicating more favorable source potential in some Cretan paleosettings. Similarly, ref. [117] describes the Tortonian–Messinian Kalamaki section (Zakynthos Island) as deposited under suboxic-to-anoxic conditions during pre-evaporitic stage, with Type III kerogen and TOC up to ~1 wt%, broadly comparable in redox environment but slightly higher gas-prone than our predominantly Type IV samples. Type III–IV kerogen in Tortonian/Messinian (Faneromeni) and Pliocene (Makrilia) deposits of eastern Crete are also recorded by [116], which, although found to be thermally immature, present with the potential of generating hydrocarbons in deeper basin centers.
In addition, our combined geochemical data indicate deposition under alternating redox conditions, shifting between oxygen-deficient and weakly anoxic to more oxygenated intervals, a pattern also recognized in other Neogene successions across Greece [18,117]. Overall, the geochemical signatures of the Gavdos sapropelic layers in both outcrops (GC# and GL#) closely resemble coeval Neogene successions in Greece in terms of redox conditions and kerogen composition. The dominance of degraded Type IV organic matter in the studied samples suggest partial oxidation during deposition, as has also been suggested by [84], by studying Pliocene–Pleistocene sapropels under Rock-Eval from the ODP Site 969 located at south of Crete (eastern Mediterranean). In these sapropels, Type II organic matter altered to Type III, with the main responsible procedure assigned to varying oxidation amounts. However, the recurring development of reducing intervals still favored periodic organic matter enrichment, underscoring the dynamic depositional regime that characterized the Gavdos basin during the late Neogene. The documentation from Miocene-age sapropels of the eastern Mediterranean offshore area (DSDP, Leg 42A, [27]) indicates that the preservation of organic matter (OM) is excessive compared to that observed in the studied onshore analogs. The data signify the high importance of this kind of deposits as potential source-rocks for gas exploration, particularly when they occur in the offshore area.
6. Conclusions
A comprehensive geochemical analysis was conducted on Neogene rock samples from two Gavdos Island outcrops (GL# and GC#), of Tortonian and Messinian age, respectively. The present analyses included RE-6 pyrolysis, XRF, and CHNS. The analyzed samples primarily consist of sapropelic layers and mudstone/siltstone alternations.
- Rock-Eval VI pyrolysis revealed that the hydrocarbon generation potential of the studied sediments ranges from poor to negligible, with most samples dominated by Type IV kerogen, including a few intervals showing partially preserved Type III kerogen. Data from the lower part of GL# proved more promising, recording better pyrolysis parameters (S2, TOC, HI, OI).
- The GL# outcrop, being a lateral equivalent to Metochia-B basal cycles (L1–L7/L8: Tortonian), exhibits lower hydrocarbon potential than previously reported, suggesting deposition in a more marginal sector of the Gavdos sedimentary basin.
- GC# outcrop samples, representing the Messinian, show poor hydrocarbon generation potential, consistent with reduced productivity and organic matter preservation as its depositional regime approaches the onset of the Messinian Salinity Crisis, pinpointed by the thick bioclastic sandstone closing the section at the top.
- Important paleodepositional indicators such as the trace element ratios (V/(V + Ni), V/Cr, Fe/Al, Ti/Al, Si/Al), corroborated by the Rock-Eval data, suggest that organic matter preservation was influenced by alternating redox conditions, fluctuating from oxygen-deficient to weakly anoxic and more oxygenated intervals. GL# samples point to predominantly dysoxic to suboxic conditions, with GC# ratios showing slightly more reducing intervals.
- Paleoclimate proxies (Sr/Cu, Rb/Sr) and weathering indices (CIA, C.I.) suggest deposition under generally arid to semi-arid conditions, punctuated by short intervals of increased humidity (i.e., sapropelic layers), which likely affected sedimentation patterns, detrital input, and organic matter. Such intervals are much better developed and recorded in the GL# (Tortonian) than in the GC# outcrop, the latter pointing to the Messinian warming close to the MSC.
- Paleosalinity indicators (Sr/Ba, Ca/(Ca + Fe)) suggest a transitional brackish-towards-saline water column. Our data show that most of the studied samples fall in the brackish-water sector, with a subset from the GL# outcrop highlighting a shift to higher salinity conditions during deposition, along this outcrop, i.e., to a pure marine environment.
These findings, by combing organic and inorganic geochemistry, fill the research gap for the Messinian section of Gavdos, refine the regional model of late Miocene depositional environments, and highlight the potential for more mature, hydrocarbon-prone equivalents in deeper offshore parts of the basin, where organic carbon preservation is enhanced, offering valuable implications for ongoing exploration efforts in the Eastern Mediterranean.
Supplementary Materials
The following supporting information can be downloaded at: https://www.mdpi.com/article/10.3390/geosciences15110432/s1.
Author Contributions
Conceptualization, D.T. and S.B.; methodology, D.T. and S.B.; software, D.T.; validation, S.B., N.K.-K., N.P., and E.M.; formal analysis, D.T.; investigation, D.T. and S.B.; resources, S.B., N.P., and N.K.-K.; data curation, S.B.; writing—original draft preparation, D.T. and S.B.; writing—review and editing, D.T., S.B., N.K.-K., N.P., and E.M.; visualization, D.T. and S.B.; supervision, S.B. and E.M.; project administration, S.B.; funding acquisition, S.B. All authors have read and agreed to the published version of the manuscript.
Funding
This research received no external funding.
Data Availability Statement
Most of the data supporting this study are included in the manuscript itself, particularly provided in Table 1, Table 2 and Table 3. Other results are included in the Supplementary Material.
Acknowledgments
We acknowledge the technical support by the Foundation for Research and Technology Hellas/Institute of Geoenergy (FORTH/IG) Geo-lab and the Technical University of Crete laboratories.
Conflicts of Interest
The authors declare no conflicts of interest.
References
- Postma, G.; Hilgen, F.J.; Zachariasse, W.J. Precession-punctuated Growth of a Late Miocene Submarine-fan Lobe on Gavdos (Greece). Terra Nova 1993, 5, 438–444. [Google Scholar] [CrossRef]
- Krijgsman, W.; Hilgen, F.J.; Langereis, C.G.; Santarelli, A.; Zachariasse, W.J. Late Miocene Magnetostratigraphy, Biostratigraphy and Cyclostratigraphy in the Mediterranean. EPSL Earth Planet. Sci. Lett. 1995, 136, 475–494. [Google Scholar] [CrossRef]
- Pyliotis, I.; Zelilidis, A.; Pasadakis, N.; Panagopoulos, G.; Manoutsoglou, E. Source Rock Potential of the Late Miocene Metochia Formation of Gavdos Island, Greece. Bull. Geol. Soc. 2013, 47, 871–879. [Google Scholar] [CrossRef]
- Li, X.; Bock, G.; Vafidis, A.; Kind, R.; Harjes, H.-P.; Hanka, W.; Wylegalla, K.; Van Der Meijde, M.; Yuan, X. Receiver Function Study of the Hellenic Subduction Zone: Imaging Crustal Thickness Variations and the Oceanic Moho of the Descending African Lithosphere. Geophys. J. Int. 2003, 155, 733–748. [Google Scholar] [CrossRef]
- Le Pichon, X.; Şengör, A.M.C.; İmren, C. A New Approach to the Opening of the Eastern Mediterranean Sea and the Origin of the Hellenic Subduction Zone. Part 1: The Eastern Mediterranean Sea. Can. J. Earth Sci. 2019, 56, 1119–1143. [Google Scholar] [CrossRef]
- Nomikou, P.; Lykousis, V.; Alexandri, M.; Rousakis, G.; Sakellariou, D.; Lampridou, D.; Alves, T.; Ballas, D. Geomorphologic Structures on the South Cretan Margin, Greece. In Proceedings of the EGU General Assembly 2015, Vienna, Austria, 12–17 April 2015; Volume 17. [Google Scholar]
- Sakellariou, D.; Mascle, J.; Lykousis, V. Strike Slip Tectonics and Transtensional Deformation in the Aegean Region and the Hellenic Arc: Preliminary Results. Bull. Geol. Soc. Greece 2013, 47, 647–656. [Google Scholar] [CrossRef]
- Mouslopoulou, V.; Begg, J.G.; Polonia, A.; Nicol, A.; Reston, T.J.; Cesca, S.; Giba, M.; Gasperini, L. Hellenic Subduction System and Upper-Plate Structures Revealed by Deep High-Resolution Seismic-Reflection Profiles and Seafloor Bathymetry. Tectonics 2025, 44, e2025TC008943. [Google Scholar] [CrossRef]
- Ring, U.; Yngwe, F. “To Be, or Not to Be, That Is the Question”—The Cretan Extensional Detachment, Greece. Tectonics 2018, 37, 3069–3084. [Google Scholar] [CrossRef]
- Vicente, J.-C. Etude Geologique de l’ile de Gavdos (Grece), La plus Meridionale de l’Europe. Bull. Soc. Géol. Fr. 1970, 7, 481–495. [Google Scholar] [CrossRef]
- Antonarakou, A. Biostratigraphic and Paleoenvironmental Interpretation in Miocene Sediments of the Eastern Mediterranean (Gavdos Island). Ph.D. Thesis, National and Kapodistrian University of Athens, Athens, Greece, 2001. [Google Scholar]
- Tsaparas, N. Contribution to the Sedimentation History of Marine Formations of Upper Cenozoic of Gavdos Island, Athens. Ph.D. Thesis, National and Kapodistrian University of Athens, Athens, Greece, 2005. [Google Scholar]
- ten Veen, J.H.; Meijer, P.T. Late Miocene to Recent Tectonic Evolution of Crete (Greece): Geological Observations and Model Analysis. Tectonophysics 1998, 298, 191–208. [Google Scholar] [CrossRef]
- Anastasakis, G.C.; Dermitzakis, M.D.; Triantaphyllou, M.V. Stratigraphic Framework of the Gavdos Island Neogene Sediments. Newsl. Strat. Stratigr. 1995, 32, 1–15. [Google Scholar] [CrossRef]
- Triantaphyllou, M.V.; Tsaparas, N.; Stamatakis, M.; Dermitzakis, M.D. Calcareous Nannofossil Biostratigraphy and Petrological Analysis of the Pre-Evaporitic Diatomaceous Sediments from Gavdos Island, Southern Greece. Neues Jahrb. Geol. Paläontol. Monatsh. 1999, 1999, 161–178. [Google Scholar] [CrossRef]
- Hilgen, F.J.; Krijgsman, W. Cyclostratigraphy and Astrochronology of the Tripoli Diatomite Formation (Pre-Evaporite Messinian, Sicily, Italy). Terra Nova 1999, 11, 16–22. [Google Scholar] [CrossRef]
- Postma, G.; Ten Veen, J.H. Astronomically and Tectonically Linked Variations in Gamma-Ray Intensity in Late Miocene Hemipelagic Successions of the Eastern Mediterranean Basin. Sediment. Geol. 1999, 128, 1–12. [Google Scholar] [CrossRef]
- Schenau, S.J.; Antonarakou, A.; Hilgen, F.J.; Lourens, L.J.; Nijenhuis, I.A.; Van Der Weijden, C.H.; Zachariasse, W.J. Organic-Rich Layers in the Metochia Section (Gavdos, Greece): Evidence for a Single Mechanism of Sapropel Formation during the Past 10 My. Mar. Geol. 1999, 153, 117–135. [Google Scholar] [CrossRef]
- Köhler, C.M.; Heslop, D.; Dekkers, M.J.; Krijgsman, W.; Van Hinsbergen, D.J.J.; Von Dobeneck, T. Tracking Provenance Change during the Late Miocene in the Eastern Mediterranean Using Geochemical and Environmental Magnetic Parameters. Geochem. Geophys. Geosyst. 2008, 9, 1–14. [Google Scholar] [CrossRef]
- Köhler, C.M.; Krijgsman, W.; van Hinsbergen, D.J.J.; Heslop, D.; Dupont-Nivet, G. Concurrent Tectonic and Climatic Changes Recorded in Upper Tortonian Sediments from the Eastern Mediterranean. Terra Nova 2010, 22, 52–63. [Google Scholar] [CrossRef]
- Mantzouka, D.; Kvaček, Z.; Teodoridis, V.; Utescher, T.; Tsaparas, N.; Karakitsios, V. A New Late Miocene (Tortonian) Flora from Gavdos Island in Southernmost Greece Evaluated in the Context of Vegetation and Climate in the Eastern Mediterranean. Neues Jahrb. Geol. Palaontol. Abh. 2015, 275, 47–81. [Google Scholar] [CrossRef]
- Drinia, H.; Antonarakou, A.; Tsaparas, N.; Kontakiotis, G. Palaeoenvironmental Conditions Preceding the Messinian Salinity Crisis: A Case Study from Gavdos Island. Geobios 2007, 40, 251–265. [Google Scholar] [CrossRef]
- Zachariasse, W.J.; Lourens, L.J. The Messinian on Gavdos (Greece) and the Status of Currently Used Ages for the Onset of the MSC and Gypsum Precipitation. Newsl. Strat. Stratigr. 2021, 55, 333–360. [Google Scholar] [CrossRef]
- Cramp, A.; O’Sullivan, G. Neogene Sapropels in the Mediterranean: A Review. Mar. Geol. 1999, 153, 11–28. [Google Scholar] [CrossRef]
- Nijenhuis, I.A. Geochemistry of Eastern Mediterranean Sedimentary Cycles: On the Origin of Miocene to Pleistocene Sapropels, Laminites and Diatomites. Ph.D. Thesis, University of Utrecht, Utrecht, The Netherlands, 1999. [Google Scholar]
- Rohling, E.J.; Marino, G.; Grant, K.M. Mediterranean Climate and Oceanography, and the Periodic Development of Anoxic Events (Sapropels). Earth Sci. Rev. 2015, 143, 62–97. [Google Scholar] [CrossRef]
- Kidd, R.B.; Cita, M.B.; Ryan, W.B.F.; Doherty, L. Stratigraphy of Eastern Mediterranean Sapropel Sequences Recovered During Leg 42A and Their Paleoenvironmental Significance. In Initial Reports of the Deep Sea Drilling Project; U.S. Government Printing Office: Washington, DC, USA, 1978; Volume 42A, pp. 421–443. [Google Scholar]
- Hilgen, F.J. Extension of the Astronomically Calibrated (Polarity) to the Miocene/Pliocene Boundary Time Scale. Earth Planet. Sctence Lett. 1991, 107, 349–368. [Google Scholar] [CrossRef]
- Fasone, S.; Scopelliti, G.; Baudin, F.; Caruso, A. Chemostratigraphy and Mineralogical Characterization of Piacenzian Sapropels Cluster A (2.75–2.57 Ma) in the Gelasian GSSP Type-Section of Monte San Nicola (Sicily, Italy): Paleoenvironmental and Paleogeographic Implications. Mar. Pet. Geol. 2024, 170, 107131. [Google Scholar] [CrossRef]
- Calvert, S.E.; Pedersen, T.F. Geochemistry of Recent Oxic and Anoxic Marine Sediments: Implications for the Geological Record. Mar. Geol. 1993, 113, 67–88. [Google Scholar] [CrossRef]
- Emeis, K.-C.; Sakamoto, T.; Wehausen, R.; Rgen Brumsack, H.-J. The Sapropel Record of the Eastern Mediterranean Sea-Results of Ocean Drilling Program Leg 160. Palaeogeogr. Palaeoclim. Palaeoclimatol. Palaeoecol. 2000, 158, 371–395. [Google Scholar] [CrossRef]
- Monedero-Contreras, R.D.; Martínez-Ruiz, F.; Rodríguez-Tovar, F.J.; de Lange, G. Redox Geochemical Signatures in Mediterranean Sapropels: Implications to Constrain Deoxygenation Dynamics in Deep-Marine Settings. Palaeogeogr. Palaeoclim. Palaeoclimatol. Palaeoecol. 2024, 634, 111953. [Google Scholar] [CrossRef]
- Cita, M.B.; Vergnaud-Grazzini, C.; Robert, C.; Chamley, H.; Ciaranfi, N.; D’Onofrio, S. Paleoclimatic Record of a Long Deep Sea Core from the Eastern Mediterranean. Quat. Res. 1977, 8, 205–235. [Google Scholar] [CrossRef]
- Emeis, K.C.; Weissert, H. Tethyan-Mediterranean Organic Carbon-Rich Sediments from Mesozoic Black Shales to Sapropels. Sedimentology 2009, 56, 247–266. [Google Scholar] [CrossRef]
- Dirksen, J.P.; Meijer, P. A Mechanism for High-Frequency Variability in Sapropels. Mar. Geol. 2022, 448, 106812. [Google Scholar] [CrossRef]
- Rossignol-Strick, M. Mediterranean Quaternary Sapropels, an Immediate Response of the African Monsoon to Variation of Insolation. Palaeogeogr. Palaeoclim. Palaeoclimatol. Palaeoecol. 1985, 49, 237–263. [Google Scholar] [CrossRef]
- Hilgen, F.J. Astronomical Calibration of Gauss to Matuyama Sapropels in the Mediterranean and Implication for the Geomagnetic Polarity Time Scale. Earth Planet. Sci. Lett. 1991, 104, 226–244. [Google Scholar] [CrossRef]
- Rohling, E.J. Review and New Aspects Concerning the Formation of Eastern Mediterranean Sapropels. Mar. Geol. 1994, 122, 1–28. [Google Scholar] [CrossRef]
- Wehausen, R.; Rgen Brumsack, H.-J. Chemical Cycles in Pliocene Sapropel-Bearing and Sapropel-Barren Eastern Mediterranean Sediments. Palaeogeogr. Palaeoclim. Palaeoclimatol. Palaeoecol. 2000, 158, 325–352. [Google Scholar] [CrossRef]
- Krom, M.D.; Cliff, R.A.; Eijsink, L.M.; Herut, B.; Chester, R. The Characterisation of Saharan Dusts and Nile Particulate Matter in Surface Sediments from the Levantine Basin Using Sr Isotopes. Mar. Geol. 1999, 155, 319–330. [Google Scholar] [CrossRef]
- Martinez-Ruiz, F.; Paytan, A.; Kastner, M.; Gonza, J.; Linares, D.; Bernasconi, S.; Jimenez-Espejo, F. A Comparative Study of the Geochemical and Mineralogical Characteristics of the S1 Sapropel in the Western and Eastern Mediterranean. Palaeogeogr. Palaeoclimatol. Palaecol. 2003, 190, 23–37. [Google Scholar] [CrossRef]
- Fontugne, M.R.; Calvert, S.E. Late Pleistocene Variability of the Carbon Isotopic Composition of Organic Matter in the Eastern Mediterranean: Monitor of Changes in Carbon Sources and Atmospheric CO2 Concentrations. Paleoceanography 1992, 7, 1–20. [Google Scholar] [CrossRef]
- Kemp, A.E.S.; Pearce, R.B.; Koizumi, I.; Pike, J.; Rance, S.J. The Role of Mat-Forming Diatoms in the Formation of Mediterranean Sapropels. Nature 1999, 398, 57–61. [Google Scholar] [CrossRef]
- Meyers, P.A. Paleoceanographic and Paleoclimatic Similarities between Mediterranean Sapropels and Cretaceous Black Shales. Palaeogeogr. Palaeoclimatol. Palaeoecol. 2006, 235, 305–320. [Google Scholar] [CrossRef]
- Lyons, T.W.; Berner, R.A.; Anderson, R.F. Evidence for Large Pre-Industrial Perturbations of the Black Sea Chemocline. Nature 1993, 365, 538–540. [Google Scholar] [CrossRef]
- Van Os, B.J.H.; Lourens, L.J.; Hilgen, F.J.; De Lange, G.J.; Beaufort, L. The Formation of Pliocene Sapropels and Carbonate Cycles in the Mediterranean: Diagenesis, Dilution, and Productivity. Paleoceanography 1994, 9, 601–617. [Google Scholar] [CrossRef]
- Thomson, J.; Higgs, N.C.; Wilson, T.R.S.; Croudace, I.W.; De Lange, G.J.; Van Santvoort, P.J.M. Redistribution and Geochemical Behaviour of Redox-Sensitive Elements around S1, the Most Recent Eastern Mediterranean Sapropel. Geochim. Cosmochim. Acta 1995, 59, 3487–3501. [Google Scholar] [CrossRef]
- Passier, H.F.; Middelburg, J.J.; De Lange, G.J.; Böttcher, M.E. Modes of Sapropel Formation in the Eastern Mediterranean: Some Constraints Based on Pyrite Properties. Mar. Geol. 1999, 153, 199–219. [Google Scholar] [CrossRef]
- Passier, H.F.; de Lange, G.J. Sedimentary Sulfur and Iron Chemistry in Relation to the Formation of Eastern Mediterranean Sapropels. In Ocean Drilling Program, Scientific Results; Robertson, A.H.F., Emeis, K.C., Richter, C., Camerlenghi, A., Eds.; U.S. Government Printing Office: Washington, DC, USA, 1998; Volume 160, pp. 249–259. [Google Scholar]
- Ten Haven, H.L.; Baas, M.; Kroot, M.; De Leeuw, J.W.; Schenck, P.A.; Ebbing, J. Late Quaternary Mediterranean Sapropels. III: Assessment of Source of Input and Palaeotemperature as Derived from Biological Markers. Geochem. Cosmochim. Acta 1987, 51, 803–810. [Google Scholar] [CrossRef]
- Castradori, D. Calcareous Nannofossils and the Origin of Eastern Mediterranean Sapropels. Paleoceanography 1993, 8, 459–471. [Google Scholar] [CrossRef]
- Zonneveld, K.A.F.; Versteegh, G.J.M.; De Lange, G.J. Palaeoproductivity and Post-Depositional Aerobic Organic Matter Decay Reflected by Dinoflagellate Cyst Assemblages of the Eastern Mediterranean S1 Sapropel. Mar. Geol. 2001, 172, 181–195. [Google Scholar] [CrossRef]
- Frydas, D.; Hemlebent, C.; Bellas, S.M. Distribution of Calcareous Nannofossils in the Sapropel Layer of Hole 69-2SL, Meteor Cruise 40/4, Eastern Mediterranena Sea. J. Nannoplankton Res. 2002, 24, 203–211. [Google Scholar] [CrossRef]
- Hilgen, F.; Kuiper, K.; Krijgsman, W.; Snel, E.; van der Laan, E. Astronomical Tuning as the Basis for High Resolution Chronostratigraphy: The Intricate History of the Messinian Salinity Crisis. Stratigraphy 2007, 4, 231–238. [Google Scholar] [CrossRef]
- Lafargue, E.; Marquis, F.; Pillot, D. Rock-Eval 6 Applications in Hydrocarbon Exploration, Production, and Soil Contamination Studies. Rev. Inst. Fr. Pétrole 1998, 53, 421–437. [Google Scholar] [CrossRef]
- Espitalié, J.; Marquis, F.; Barsony, I. Geochemical Logging. In Analytical Pyrolysis—Techniques and Applications; Voorhees, K.J., Ed.; Butterworth-Heinemann: Boston, MA, USA, 1984; pp. 276–304. [Google Scholar]
- Behar, F.; Beaumont, V.; De, H.L.; Penteado, B. Rock-Eval 6 Technology: Performances and Developments. Oil Gas. Sci. Technol. Rev. IFP 2001, 56, 111–134. [Google Scholar] [CrossRef]
- Disnar, J.-R.; Guillet, B.; Kéravis, D.; Giovanni, C.D.; Sebag, D.; Disnar, J.R.; Guillet, B.; Keravis, D.; Di-Giovanni, C.; Sebag, D. Soil Organic Matter (SOM) Characterization by Rock-Eval Pyrolysis: Scope and Limitations. Org. Geochem. 2003, 34, 327–343. [Google Scholar] [CrossRef]
- Peters, K.E. Guidelines for Evaluating Petroleum Source Rock Using Programmed Pyrolysis. Am. Assoc. Pet. Geol. Bull. 1986, 70, 318–329. [Google Scholar] [CrossRef]
- Peters, K.E.; Cassa, M.R. Applied Source Rock Geochemistry. In The Petroleum System—From Source to Trap; Magoon, L.B., Dow, W.G., Eds.; American Association of Petroleum Geologists: Tulsa, OK, USA, 1994; Volume 60, pp. 93–120. [Google Scholar]
- Espitalié, J.; Laporte, J.L.; Madec, M.; Marquis, F.; Leplat, P.; Paulet, J.; Boutefeu, A. Méthode Rapide de Caractérisation des Roches Mètres, de Leur Potentiel Pétrolier et de Leur Degré D’évolution. Rev. Inst. Fr. Pétrole 1977, 32, 23–42. [Google Scholar] [CrossRef]
- Espitalie, J.; Marquis, F.; Sage, L.; Barsony, I. Géochimie Organique du Bassin de Paris. Rev. Rev. Inst. Fr. Pétrole 1987, 42, 271–302. [Google Scholar] [CrossRef]
- Bostick, N.H.; Daws, T.A. Relationships between Data from Rock-Eval Pyrolysis and Proximate, Ultimate, Petrographic, and Physical Analyses of 142 Diverse U.S Coal Samples. Org. Geochem. 1994, 21, 35–49. [Google Scholar] [CrossRef]
- Jarvie, D.M. Total Organic Carbon (TOC) Analysis. In Source and Migration Processes and Evaluation Techniques; Merrill, R.K., Ed.; American Association of Petroleum Geologists: Tulsa, OK, USA, 1991; pp. 113–118. [Google Scholar]
- Tissot, B.P.; Welte, D.H. Petroleum Formation and Occurrence, 2nd ed.; Springer: Berlin/Heidelberg, Germany, 1984; ISBN 978-3-642-87815-2. [Google Scholar]
- Burwood, R.; De Witte, S.M.; Mycke, B.; Paulet, J. Petroleum Geochemical Characterisation of the Lower Congo Coastal Basin Bucomazi Formation. In Casebooks in Earth Sciences Petroleum Source Rocks; Katz, B.J., Ed.; Springer: Berlin/Heidelberg, Germany, 1995; pp. 235–263. [Google Scholar]
- Dyman, T.S.; Palacas, J.G.; Tysdal, R.G.; Perry, W.J.; Pawlewicz, M.J. Source Rock Potential of Middle Cretaceous Rocks in Southwestern Montana. Am. Assoc. Pet. Geol. Bull. 1996, 80, 1177–1184. [Google Scholar] [CrossRef]
- Hatzistavros, V.S.; Kallithrakas-Kontos, N.G. X-Ray Fluorescence Mercury Determination Using Cation Selective Membranes at Sub-Ppb Levels. Anal. Chim. Acta 2014, 809, 25–29. [Google Scholar] [CrossRef] [PubMed]
- Kallithrakas-Kontos, N.; Foteinis, S.; Paigniotaki, K.; Papadogiannakis, M. A Robust X-Ray Fluorescence Technique for Multielemental Analysis of Solid Samples. Env. Environ. Monit. Assess. 2016, 188, 120. [Google Scholar] [CrossRef]
- Harris, D.; Horwarth, W.R.; Van Kessel, C. Acid Fumigation of Soils to Remove Carbonates Prior to Total Organic Carbon or Carbon-13 Isotopic Analysis. Soil. Sci. Soc. Am. J. 2001, 65, 1853–1856. [Google Scholar] [CrossRef]
- Nelson, D.W.; Sommers, L.E. Total Carbon, Organic Carbon, and Organic Matter. In Methods of Soil Analysis, Part 3: Chemical Methods; Sparks, D.L., Page, A.L., Helmke, P.A., Loeppert, R.H., Soltanpou, P.N., Tabatabai, M.A., Johnston, C.T., Summer, M.E., Eds.; American Society of Agronomy: Madison, WI, USA, 1996; pp. 961–1010. ISBN 9780891188667. [Google Scholar]
- Walthert, L.; Graf, U.; Kammer, A.; Luster, J.; Pezzotta, D.; Zimmermann, S.; Hagedorn, F. Determination of Organic and Inorganic Carbon, Δ13C, and Nitrogen in Soils Containing Carbonates after Acid Fumigation with HCl. J. Plant Nutr. Soil. Sci. 2010, 173, 207–216. [Google Scholar] [CrossRef]
- Lyle, M.; Backman, J. Data Report: Calibration of XRF-Estimated CaCO3 along the Site U1338 Splice. In IODP Integrated Ocean Drill Program; Integrated Ocean Drilling Program Management International, Inc.: College Station, TX, USA, 2013; Volume 320/321. [Google Scholar]
- Lyle, M.; Olivarez Lyle, A.; Gorgas, T.; Holbourn, A.; Westerhold, T.; Hathorne, E.; Kimoto, K.; Yamamoto, S. Data Report: Raw and Normalized Elemental Data along the Site U1338 Splice from X-Ray Fluorescence Scanning. In IODP Integrated Ocean Drill Program; Integrated Ocean Drilling Program Management International, Inc.: College Station, TX, USA, 2012; Volume 320/321. [Google Scholar]
- Lee, I.T.; Ko, T.W.; Lee, K.E.; Bae, S.W.; Hwang, G.C.; Kim, R.A. Calibration of the XRF-Estimated CaCO3 Content in the Western Tropical Pacific Deep-Sea Sediments. Ocean. Sci. J. 2022, 57, 357–364. [Google Scholar] [CrossRef]
- Wehausen, R.; Brumsack, H.-J. Astronomical Forcing of the East Asian Monsoon Mirrored by the Composition of Pliocene South China Sea Sediments. Earth Planet. Sci. Lett. 2002, 201, 621–636. [Google Scholar] [CrossRef]
- Mandemaker, J.H.P.C. Geological Constraints on Tidal Dissipation in the Messinian. Master’s Thesis, Utrecht University, Utrecht, The Netherlands, 2021. [Google Scholar]
- Li, H.; Duan, L.; Mo, J.; Lin, J.; Li, H.; Wang, H.; Wu, J.; Sun, Q.; Zhang, H. Quantitative Characterization of Carbonate Mineralogy in Lake Yangzong Sediments Using XRF-Derived Calcium Signatures and Inorganic Carbon Measurements. Water 2025, 17, 1949. [Google Scholar] [CrossRef]
- Kasuya, T.; Iwasaki, S.; Okazaki, Y. Data Report: Calibration of XRF Scanning CaCO3 Estimates for the Upper 30 m along the Site U1543 Splice, International Ocean Discovery Program Expedition 383. Proc. Int. Ocean. Discov. Program. Exped. Rep. 2023, 383, 1–9. [Google Scholar] [CrossRef]
- Kido, Y.; Koshikawa, T.; Tada, R. Rapid and Quantitative Major Element Analysis Method for Wet Fine-Grained Sediments Using an XRF Microscanner. Mar. Geol. 2006, 229, 209–225. [Google Scholar] [CrossRef]
- Hennekam, R.; De Rick, G. X-Ray Fluorescence Core Scanning of Wet Marine Sediments: Methods to Improve Quality and Reproducibility of Highresolution Paleoenvironmental Records. Limnol. Ocean. Oceanogr. Methods 2012, 10, 991–1003. [Google Scholar] [CrossRef]
- Dembicki, H. Three Common Source Rock Evaluation Errors Made by Geologists during Prospect or Play Appraisals. Am. Assoc. Pet. Geol. Bull. 2009, 93, 341–356. [Google Scholar] [CrossRef]
- Baudin, F.; Disnar, J.R.; Aboussou, A.; Savignac, F. Guidelines for Rock-Eval Analysis of Recent Marine Sediments. Org. Geochem. 2015, 86, 71–80. [Google Scholar] [CrossRef]
- Meyers, P.A. Organic Geochemical Proxies of Paleoceanographic, Paleolimnologic, and Paleoclimatic Processes. Org. Geochem. 1997, 27, 213–250. [Google Scholar] [CrossRef]
- Ring, U.; Fassoulas, C.; Uysal, I.T.; Bolhar, R.; Tong, K.; Todd, A. Nappe Imbrication Within the Phyllite-Quartzite Unit of West Crete: Implications for Sustained High-Pressure Metamorphism in the Hellenide Subduction Orogen, Greece. Tectonics 2022, 41, e2022TC007430. [Google Scholar] [CrossRef]
- Espitalie, J.; Deroo, G.; Marquis, F. La Pyrolyse Rock-Eval et Ses Applications. Deuxième Partie. Rev. Inst. Fr. Pétrole 1985, 40, 755–784. [Google Scholar] [CrossRef]
- Miao, H.; Guo, J.; Wang, Y.; Jiang, Z.; Zhang, C.; Li, C. Mineralogical and Elemental Geochemical Characteristics of Taodonggou Group Mudstone in the Taibei Sag, Turpan-Hami Basin: Implication for Its Formation Mechanism. Solid. Earth 2023, 14, 1031–1052. [Google Scholar] [CrossRef]
- Hatch, U.J.; Leventhal, J. Relationship between Inferred Redox Potential of the Depositional Environment and Geochemistry of the Upper Pennsylvanian (Missourian) Stark Shale Member of the Dennis Limestone, Wabaunsee County, Kansas, U.S.A. Chem. Geol. 1992, 99, 65–82. [Google Scholar] [CrossRef]
- Jones, B.; Manning, D.A.C. Comparison of Geochemical Indices Used for the Interpretation of Palaeoredox Conditions in Ancient Mudstones. Chem. Geol. 1994, 111, 111–129. [Google Scholar] [CrossRef]
- Morford, J.L.; Emerson, S. The Geochemistry of Redox Sensitive Trace Metals in Sediments. Geochem. Cosmochim. Acta 1999, 63, 1735–1750. [Google Scholar] [CrossRef]
- Piper, D.Z.; Perkins, R.B. A Modern vs. Permian Black Shale—the Hydrography, Primary Productivity, and Water-Column Chemistry of Deposition. Chem. Geol. 2004, 206, 177–197. [Google Scholar] [CrossRef]
- Tribovillard, N.; Algeo, T.J.; Lyons, T.; Riboulleau, A. Trace Metals as Paleoredox and Paleoproductivity Proxies: An Update. Chem. Geol. 2006, 232, 12–32. [Google Scholar] [CrossRef]
- Martinez-Ruiz, F.; Kastner, M.; Gallego-Torres, D.; Rodrigo-Gámiz, M.; Nieto-Moreno, V.; Ortega-Huertas, M. Paleoclimate and Paleoceanography over the Past 20,000 yr in the Mediterranean Sea Basins as Indicated by Sediment Elemental Proxies. Quat. Sci. Rev. 2015, 107, 25–46. [Google Scholar] [CrossRef]
- Wang, J.; Guo, S. Comparison of Geochemical Characteristics of Marine Facies, Marine-Continental Transitional Facies and Continental Facies Shale in Typical Areas of China and Their Control over Organic-Rich Shale. Energy Sources Part A Recovery Util. Environ. Eff. 2020, 46, 12512–12524. [Google Scholar] [CrossRef]
- Liu, K.; Cheng, P.; Fan, C.W.; Song, P.; Huang, Q.T. Evolutions of Sedimentary Facies and Palaeoenvironment and Their Controls on the Development of Source Rocks in Continental Margin Basins: A Case Study from the Qiongdongnan Basin, South China Sea. Pet. Sci. 2023, 20, 2648–2663. [Google Scholar] [CrossRef]
- Makri, V.I.; Oikonomopoulos, I.; Muirhead, D.; Pasadakis, N. Kerogen Kinetics and the Effect of Rock Matrix: Insights from Western Greece. Int. J. Coal Geol. 2024, 292, 104585. [Google Scholar] [CrossRef]
- Ernst, W. Geochemical Facies Analysis; Elsevier: Amsterdam, The Netherlands, 1970; p. 152. [Google Scholar]
- Canfield, E.D.; Lyons, W.T.; Raiswell, R. A Model for Iron Deposition to Euxinic Black Sea Sediments. Am. J. Sci. 1996, 296, 818–834. [Google Scholar] [CrossRef]
- Raiswell, R.; Canfield, E.D. Sources of Iron for Pyrite Formation in Marine Sediments. Am. J. Sci. 1998, 298, 219–245. [Google Scholar] [CrossRef]
- Lyons, T.W.; Severmann, S. A Critical Look at Iron Paleoredox Proxies: New Insights from Modern Euxinic Marine Basins. Geochim. Cosmochim. Acta 2006, 70, 5698–5722. [Google Scholar] [CrossRef]
- Scheiderich, K.; Zerkle, A.L.; Helz, G.R.; Farquhar, J.; Walker, R.J. Molybdenum Isotope, Multiple Sulfur Isotope, and Redox-Sensitive Element Behavior in Early Pleistocene Mediterranean Sapropels. Chem. Geol. 2010, 279, 134–144. [Google Scholar] [CrossRef]
- Sirocko, F.; Garbe-Schonberg, D.; Devey, C. Processes Controlling Trace Element Geochemistry of Arabian Sea Sediments during the Last 25,000 Years. Glob. Planet. Change 2000, 26, 217–303. [Google Scholar] [CrossRef]
- Mir, I.A.; Mascarenhas, M.B.L.; Khare, N. Geochemistry and Granulometry as Indicators of Paleoclimate, Weathering, and Provenance of Sediments for the Past 1,00,000 Years in the Eastern Arabian Sea. J. Asian Earth Sci. 2022, 227, 105102. [Google Scholar] [CrossRef]
- Filippidi, A.; De Lange, G.J. Multiple Ba Phases in Marine Sediments Elucidate Environmental Processes and Conditions for the Holocene Mediterranean. Quat. Sci. Rev. 2024, 335, 108753. [Google Scholar] [CrossRef]
- Chermak, J.A.; Schreiber, M.E. Mineralogy and Trace Element Geochemistry of Gas Shales in the United States: Environmental Implications. Int. J. Coal Geol. 2014, 126, 32–44. [Google Scholar] [CrossRef]
- Zou, C.; Mao, L.; Tan, Z.; Zhou, L.; Liu, L. Geochemistry of Major and Trace Elements in Sediments from the Lubei Plain, China: Constraints for Paleoclimate, Paleosalinity, and Paleoredox Environment. J. Asian Earth Sci. 2021, 6, 100071. [Google Scholar] [CrossRef]
- Shaltami, O.; Ben Hkoma, M. Assessing Paleoclimate through Major and Trace Element Concentrations: A Review. AlQalam J. Med. Appl. Sci. 2024, 7, 1187–1993. [Google Scholar] [CrossRef]
- Thorpe, C.L.; Law, G.T.W.; Boothman, C.; Lloyd, J.R.; Burke, I.T.; Morris, K. The Synergistic Effects of High Nitrate Concentrations on Sediment Bioreduction. Geomicrobiol. J. 2012, 29, 484–493. [Google Scholar] [CrossRef]
- Wang, A.; Wang, Z.; Liu, J.; Xu, N.; Li, H. The Sr/Ba Ratio Response to Salinity in Clastic Sediments of the Yangtze River Delta. Chem. Geol. 2021, 559, 119923. [Google Scholar] [CrossRef]
- Shi, J.; Zou, Y.R.; Cai, Y.L.; Zhan, Z.W.; Sun, J.N.; Liang, T.; Peng, P. Organic Matter Enrichment of the Chang 7 Member in the Ordos Basin: Insights from Chemometrics and Element Geochemistry. Mar. Pet. Geol. 2022, 135, 105404. [Google Scholar] [CrossRef]
- Nesbitt, H.W.; Young, G.M. Early Proterozoic Climates and Plate Motions Inferred from Major Element Chemistry of Lutiles. Nature 1982, 299, 715–717. [Google Scholar] [CrossRef]
- Cao, J.; Wu, M.; Chen, Y.; Hu, K.; Bian, L.; Wang, L.; Zhang, Y. Trace and Rare Earth Element Geochemistry of Jurassic Mudstones in the Northern Qaidam Basin, Northwest China. Chem. Der Erde 2012, 72, 245–252. [Google Scholar] [CrossRef]
- Ding, J.; Zhang, J.; Tang, X.; Huo, Z.; Han, S.; Lang, Y.; Zheng, Y.; Li, X.; Liu, T. Elemental Geochemical Evidence for Depositional Conditions and Organic Matter Enrichment of Black Rock Series Strata in an Inter-Platform Basin: The Lower Carboniferous Datang Formation, Southern Guizhou, Southwest China. Minerals 2018, 8, 509. [Google Scholar] [CrossRef]
- Awan, R.S.; Liu, C.; Gong, H.; Dun, C.; Tong, C.; Chamssidini, L.G. Paleo-Sedimentary Environment in Relation to Enrichment of Organic Matter of Early Cambrian Black Rocks of Niutitang Formation from Xiangxi Area China. Mar. Pet. Geol. 2020, 112, 104057. [Google Scholar] [CrossRef]
- Mclennan, S.M. Weathering and Global Denudation. J. Geol. 1993, 101, 295–303. [Google Scholar] [CrossRef]
- Zelilidis, A.; Tserolas, P.; Chamilaki, E.; Pasadakis, N.; Kostopoulou, S.; Maravelis, A.G. Hydrocarbon Prospectivity in the Hellenic Trench System: Organic Geochemistry and Source Rock Potential of Upper Miocene–Lower Pliocene Successions in the Eastern Crete Island, Greece. Int. J. Earth Sci. 2016, 105, 1859–1878. [Google Scholar] [CrossRef]
- Kontakiotis, G.; Karakitsios, V.; Maravelis, A.G.; Zarkogiannis, S.D.; Agiadi, K.; Antonarakou, A.; Pasadakis, N.; Zelilidis, A. Integrated Isotopic and Organic Geochemical Constraints on the Depositional Controls and Source Rock Quality of the Neogene Kalamaki Sedimentary Successions (Zakynthos Island, Ionian Sea). Mediterr. Geosci. Rev. 2021, 3, 193–217. [Google Scholar] [CrossRef]
- Maravelis, A.G.; Kontakiotis, G.; Bellas, S.; Antonarakou, A.; Botziolis, C.; Janjuhah, H.T.; Makri, P.; Moissette, P.; Cornée, J.J.; Pasadakis, N.; et al. Organic Geochemical Signatures of the Upper Miocene (Tortonian—Messinian) Sedimentary Succession Onshore Crete Island, Greece: Implications for Hydrocarbon Prospectivity. J. Mar. Sci. Eng. 2022, 10, 1323. [Google Scholar] [CrossRef]
- Telemenis, D.; Makri, V.I.; Manoutsoglou, E.; Bellas, S. Exploring Neogene Marine Diatomites in Western Crete: A New Source-Rock Candidate with Hydrocarbon Generation Potential? Eng 2023, 4, 285–300. [Google Scholar] [CrossRef]
Disclaimer/Publisher’s Note: The statements, opinions and data contained in all publications are solely those of the individual author(s) and contributor(s) and not of MDPI and/or the editor(s). MDPI and/or the editor(s) disclaim responsibility for any injury to people or property resulting from any ideas, methods, instructions or products referred to in the content. |
© 2025 by the authors. Licensee MDPI, Basel, Switzerland. This article is an open access article distributed under the terms and conditions of the Creative Commons Attribution (CC BY) license (https://creativecommons.org/licenses/by/4.0/).