Abstract
This study is focused on one of the most active features of the Hellenic Volcanic Arc Southern Aegean Sea, the Santorini Island Volcanic Complex (SVC). The recent volcano-tectonic crisis in the intracalderic area has emerged the need for closer monitoring of the region. The 2011–2012 unrest has been attributed to the augmentation of fluid flow inside local mapped fracture zones. After March 2012, the seismic activity dropped significantly, raising questions about whether we would have a long period of quiescence or be on a break before the next period of unrest. In this research, a re-examination of the seismic outbreak of 2011–2012 was conducted by adding more travel-time data from 2013 while we further analyzed the waveform data from 2014 to May 2024 to explore the differences of the SVC body-wave velocity structure by performing seismic tomography in these two time windows. The new dataset serves to identify the state of the Santorini Volcanic Complex. The results show a significant reduction in Vp and Vs anomalies at shallow depths since the period of unrest. At the same time, the distribution of Vp/Vs ratio remains high (>1.87) in the area NNE of Kameni at a shallower depth (2 km). The areas of Christiana Islands and Columbo volcano are mainly characterized by negative body-wave anomalies and low Vp/Vs ratio (1.56–1.64) at shallow depths for the study period, while a possible explanation to results in the submarine volcano may be explained by dry steam/gas phases that may have resulted in the generation of the swarms that occurred in the region.
1. Introduction
The broader area of Southern Aegean is dominated by the tectonic structure of the Hellenic arc, which is a contact boundary between the Eurasian lithospheric plate and the African plate (Eastern Mediterranean). These two plates converge in this area at a relative speed of 2.5 cm per year [1,2,3,4,5,6], resulting in the subduction of the Tethys oceanic plate under the Aegean continental plate. The Southern Aegean Volcanic Arc (SAVA) dominates the study area, with the volcanoes of Sousaki, Aegina, and Methana–Poros in its NW end (Central Greece), the volcanic centers of Milos and Santorini in its central part, and Nisyros–Kos at its eastern termination, near the western shores of Turkey (Figure 1).
The seismic crises in Nisyros that occurred in 1995 [7,8], and Columbo [9,10,11] in 2003, and the Santorini intracalderic activity between September 2011 and March 2012 [12,13,14,15,16,17] highlighted the importance of the systematic monitoring of the volcanic centers in the Greek area. Santorini is in the central part of the modern volcanic arc (SAVA), constituting an excellent example of applying various methods to investigate the local volcanotectonic elements. The island is characterized by a multi-center volcanic field that is intersected by a flooded caldera, one of the world’s most violent volcanoes of this category. During the Pleistocene, over a hundred explosive eruptions were manifested. Twelve of these discharged volumes of magma exceeding a few cubic kilometers and triggered at least four caldera collapses [18,19,20,21].
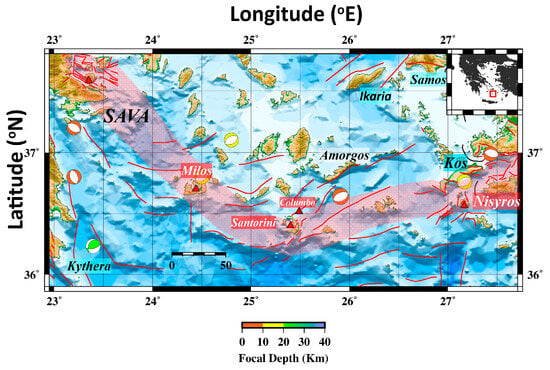
Figure 1.
Main tectonic features in Southern Aegean with the location of focal mechanisms of the significant earthquakes (Table S1) that occurred between 1950 and 2020 (M > 6.0) [6]. The color of the focal mechanism represents the depth (km) of each event. Abbreviations—SAVA: South Aegean Volcanic Arc. Fault traces (red lines) derived by [16].
The position of the vents during the last 600,000 years was controlled by two NE–SW volcano-tectonic lines of Kameni and Columbo [13,22], which acted as paths for the magma. At least five major explosive eruptions were focused along the Kameni line as well as the Aspronisi tuff ring. On the other hand, the Columbo line controlled the vent position of two major explosive events as well as the dyke swarm, cinder cones, and Cape Columbo tuff ring on the northern part of Thira [23] (Figure 2).
The broader area of the Southern Aegean has been affected by numerous earthquakes throughout historic times, mainly due to its tectonic setting along the Hellenic Arc. This seismic zone is one of the most active in the Mediterranean. The particular interest in the Santorini Island Volcanic Complex is concentrated on the nature of the events recorded during these times, which may be either tectonic or volcanic. The earliest eruptive events were located near Akrotiri during the Pleistocene. These eruptions differ from the most recent volcanism regarding the content of amphiboles.
Since the latest 360 ka, we observed two primary cycles of eruptive activity that caused a caldera formation. This period was also divided into a series of sub-cycles where lava flows and explosive eruptions of smaller scale had built up cones. The most famous one occurred during the Late Bronze Age (mid of the second millennium BCE) and is widely known as the Minoan eruption. Post-Minoan eruptive activity is concentrated on the Kammeni islands, in the caldera’s center, which emerged in 197 BCE [23,24,25,26,27]. The most notable events during this period are the following:
- -
- The 1650 Columbo Volcanic Eruption: The trembling from the volcanic eruption caused widespread damage to Santorini and resulted in tsunamis that hit surrounding areas.
- -
- 1707, when an earthquake was associated with an eruption, and the activity ended on September 1711, creating Nea Kameni [28].
- -
- Since then, four central vent eruptions have been recorded, with the most recent one ending in 1950.
- -
- The 1956 Amorgos Earthquake, with a magnitude of 7.7, was one of the most devastating in modern times. It centered near the island of Amorgos but severely affected Santorini. The earthquake and subsequent tsunami destroyed many buildings and caused a significant loss of life, impacting the island [29,30,31,32].
These earthquakes and numerous smaller quakes constantly remind us of the region’s ongoing seismic and volcanic activity. This activity, which has significantly shaped the island’s history, has garnered the attention of the entire geoscientist community in the Southern Aegean region.
The earthquake activity in the broader area of Santorini Volcanic Center (SVC) is strongly connected with the tectonic regime and the volcanic processes [9,10,33]. The highest rate of seismic activity in this area has been observed along the NE–SW striking Santorini–Columbo volcano-tectonic line, a deep-seated, strike-slip feature [9,34,35]. Within this zone, the submarine Columbo volcano shows strong seismic and hydrothermal activity, which could be associated with the magma reservoir and the migration of magma and fluids towards the surface [9,10,36].
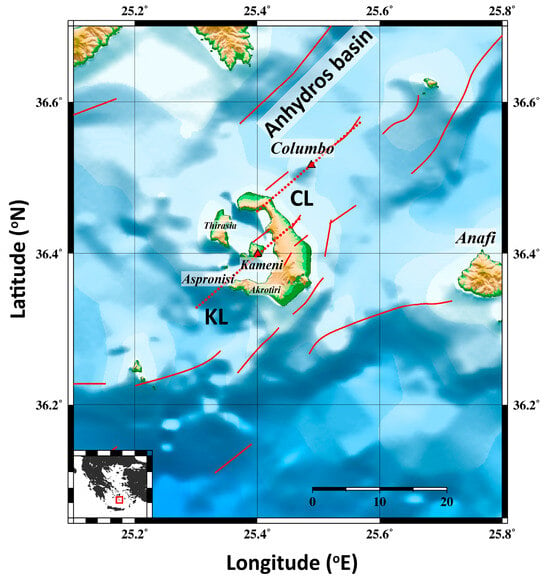
Figure 2.
Main tectonic features in the broader area of Santorini Volcanic Complex. The red triangles represent the active volcanic centers of the area. Fault traces (red lines) derived by [34,35].
A similar pattern of seismic activity is observed NE of Columbo, with small-scale activity spots that may indicate local pathways of upward migrating fluids, developing volcanic activity within this zone of crustal weakness [9]. Ref. [10] suggests that the observed seismicity underneath Columbo is associated with the Kameni–Columbo line, which corresponds to the western termination of the major Santorini–Amorgos Fault Zone to the NE. Further on, they suggest that the NE Santorini–Columbo faults belong to a single rupture system. The tomographic study of [37] identified a low-velocity zone of body waves between 5 and 7 km in the northeastern part of Santorini Island in agreement with the local tectonic regime. The direction of this zone coincides with the faults of the “Kameni–Columbo” line. According to the authors of this study, the negative velocity perturbation below 6 km depth could be linked to the magmatic chamber beneath the submarine volcanic center of Columbo. Dimitriadis et al. [37] could not exclude a connection between the surface intracalderic volcanic rocks and a deeper (>10 km depth) magmatic chamber beneath Columbo.
In September 2011, a seismic unrest period began changing the seismic pattern of the SVC. The volcanic complex has repeatedly been activated since antiquity, with the most recent one occurring in 1950, which included some small explosions and the production of lava. The initiation of the intense activity caused damage to the local infrastructure, as the local authorities reported it and thoughts on the volcano’s status—a high-resolution relocation of the intracalderic seismic events connected that activity with the Kameni line [38,39]. The variability of fault plane solutions at the edges of that volcano-tectonic feature was interpreted as differentiation from local stress by [16] highlighting the consistency with the theoretical behavior inside the caldera due to magmatic inflation in an extensional stress regime of NW–SE direction [40]. Rivalta et al. [41] have underlined the possibility of a larger regional stress at the volcanic complex than previous results, discussing the underestimation of the extension rates.
Using data from the 2003 and 2011–2012 swarms, the simultaneous tomographic inversion identified the top of the magmatic reservoir at ~4 km b.s.l. NE of Nea Kameni Island [16]. Since then, the activity inside the caldera has gradually decreased until it approached minimal events per month (total of ~50 events for 2013–2024 with ML ≥ 1.6; Figure 3). Another sizable portion of the seismic activity (13–15/01/2019) was located south of Akrotiri, 17.1 km SSW of Thira, aligned in a general WSW–ENE direction. The most notable event of this group, which lasted 72 h, occurred on 13 January 2019 (ML = 3.6) (Figure 4, cluster #1).
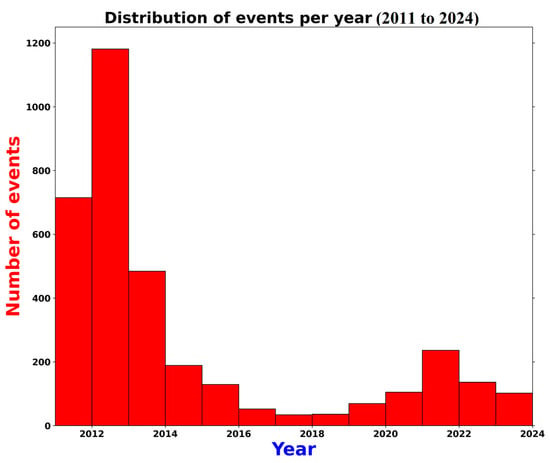
Figure 3.
Histogram of the distribution of earthquakes that were analyzed in this study between 2011 and 2024.
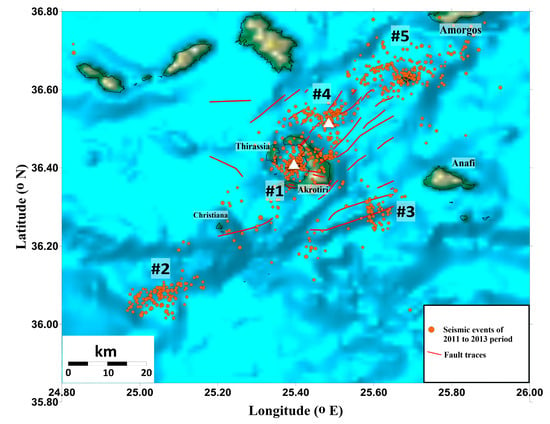
Figure 4.
Distribution of the most important earthquake clusters identified between 2011 and 2013. White triangles represent the active volcanic centers, and the red lines represent the mapped fault traces [34,35].
During the first half of 2020, we had a small outbreak about 10 kilometers west of Anafi (24–29 April 2020). It started with an earthquake of local magnitude equal to 4.0 and continued until the end of April with magnitudes smaller than 3.0, finally dying out in the first ten days of May of the same year (cluster #2). Towards Columbo, a series of light to moderate-size tectonic earthquakes occurred during the first half of 2021, 5–10 km NE of Thira, as shown by the analysis of [42]. Most recorded earthquakes were located ~40 km NE of Thira, SSW of Amorgos, as part of the seismic sequence that began with the Mw = 4.5 event on 20 April 2021. The northern boundary of this cluster (cluster #3) lies on the southern boundary of the activated fault during the 1956 tsunamigenic M7.2 earthquake of Amorgos (cluster #4) [31,43,44,45] (Figure 5).
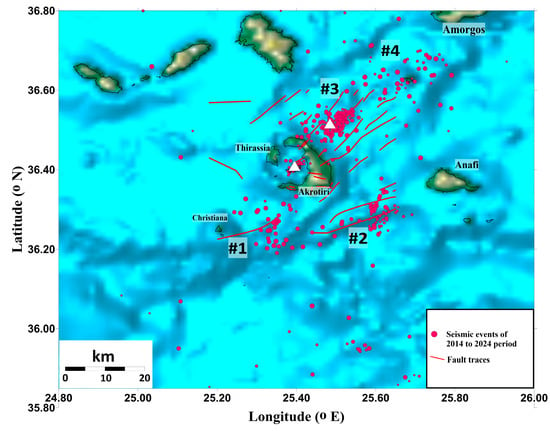
Figure 5.
Distribution of the most important earthquake clusters identified between 2014 and 2024. White triangles represent the active volcanic centers, and the red lines represent the mapped fault traces [34,35].
In this study, we re-examined the data of the seismic outbreak of 2011–2012 by adding more travel-time data from 2013 while we further analyzed the waveform data from 2014 to May 2024 to examine the change of the SVC body-wave velocity structure by performing seismic tomography in these two time windows. The new dataset served to identify the status of the Santorini Volcanic Complex and discuss the geologic processes behind these results. The identification of the main magmatic plumbing system’s location in SVC and its evolution since the 2011–2012 unrest can help in revising the volcanic hazard assessment in the Southern Aegean. Understanding how the shallower magmatic chambers of the volcanic complex move in depth, in connection with past recorded eruptions and recent geochemical data from institutions and organizations, could be a valuable tool for the scientific community and Civil Protection officials.
2. Data
This study is significant as it delves into the seismic activity of the Santorini Volcanic Complex (SVC) and the surrounding regions of the Southern Aegean. The region is monitored by several permanent Hellenic Unified Seismological Network (HUSN) stations on the island, with additional temporary stations installed by the partners of the permanent network in 2011 and operated during the period of unrest [16]. Since 2007, real-time data, including both 1-component (1 Hz) and 3-component (broadband or short-period) stations, have been transmitted, with manual arrival-time picking used to obtain hypocentral locations (http://www.geophysics.geol.uoa.gr/stations/gmaps3/leaf_stations.php?map=2&lng=en accessed on 1 September 2024).
Manual arrival-time picking is applied to obtain the optimal hypocentral locations using the SeisComP3 graphical user interface [46] and a custom regional 1-D velocity model for the Southern Aegean Sea [16] (Figure S2). As a first step, we analyzed the seismic data in near real-time using the Hypo71 location algorithm [47]. Then, these results were rerun with the HypoInverse code [48].
The next step we made was the division of the dataset into two relatively homogeneous subsets. The main criteria of the period selection was the gradual diminishing of the Santorini caldera, Columbo–Amorgos, the area south of Christiana islands’ seismic activity near the end of 2013, and the onset of a cluster of earthquakes in the area of cluster #5 early in the year (2 January 2014–23 January 2024), with the majority of magnitudes approaching 3. Its migration to the neighboring Columbus area in the second fortnight of February of the same year, with its peak observed the following (February 2015) with cluster #4 magnitudes exceeding local magnitude 3.0, played an essential role in the occurrence of an ML = 4.1 S of Christiana islands.
Finally, we divided the dataset period into two main frames: (1) 30 September 2011 to 31 December 2013 (Figure 6a) and (2) 1 January 2014 to 31 May 2024 (Figure 6b). The input data consist of 1626 earthquakes for the first time-window and 1088 for the second.
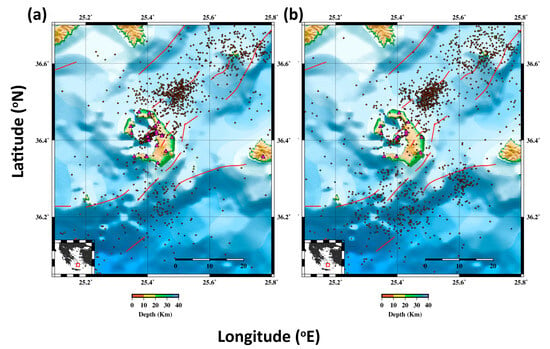
Figure 6.
Distribution of the initial catalogue’s seismic events that were used in this study. The selected earthquakes for (a) 2011–2013 and (b) 2014–2024 time window. Seismic stations are depicted in purple triangles. Fault traces (red lines) derived by [34,35].
To ensure the quality of the selected seismic data used in the tomographic inversions, the earthquakes and body-wave arrivals had to meet the following conditions:
- -
- Each event had to be recorded at least by eight stations for both P and S phases.
- -
- For both time windows, we kept the arrivals recorded in common stations of the permanent network of HUSN.
- -
- A selection based on the magnitude was applied (ML ≥ 2.0) for the 2011–2012 intracalderic activity to maintain a similar ray coverage.
- -
- Focal depths had to be between 1 and 50 km.
- -
- The nearest station distance had to be less than the selected events’ hypocentral depth.
- -
- RMS could not be larger than 0.5 s.
Applying these criteria led to a slightly reduced dataset of 1337 and 1005 seismic events for each period, including 28,421 P combined with 14,957 S, 14,539 P, and 12,846 S picks, respectively.
3. Tomographic Inversion
In this study, the analysis was performed using the LOcal TOmographic Software (LOTOS-12) by [49]. This software provides us with two options: either the Vp–Vs scheme, using P and S travel-time residuals (dtP and dtS), or the Vp–Vp/Vs scheme, selecting the available dtP and differential residuals, dtS–dtP. This code requires as input data the stations’ coordinates, elevations, and arrival times from locally recorded seismicity. The coordinates of the hypocenters and the origin times are not required, given that they are determined during the execution of the calculations. If preliminary hypocentral locations are available, as in this case, they are used to speed up the processing. Additionally, the user defines the available initial 1–D model and a set of input parameters to perform the convergence iteration steps, i.e., parameterization, grid dimensions, and damping parameter [49].
The level of regularization for the real-data inversion and the ideal number of iterations is defined based on the results of the synthetic tests, choosing the best set of parameters that result in the finest resolution. A nodal representation was employed (Figures S4 and S5), given that the velocity field, reconstructed by a three-dimensional grid, does not assume a specific geometry of heterogeneities [50]. The spacing between the nodes (~2 km) was smaller than the expected resolution length to reduce any bias to the resulting models caused by the grid configuration. The optimal grid mesh has been determined by taking into account the station/event geometry (Figures S4 and S5). Furthermore, to decrease any influence of the parameterization of the model on the final solutions, we repeated the inversion using four different grid orientations (e.g., 0°, 22°, 45°, and 67°). The results obtained for the above-mentioned grids were stacked into one summary model, reducing the artefacts related to grid orientation, as described by [49].
During the inversion, we used both schemes (Vp–Vs and Vp–Vp/Vs) to obtain more information as they matter for the Vp and Vs anomalies [49,51]. Body-wave travel times and ray paths (Figures S4–S9) were calculated based on the bending method as proposed by [52]. The sources were located using the same 1-D reference model for the area of the SVC [16] for the periods under examination. This velocity model (Vp and Vp/Vs) provided minimum travel-time errors and misfits to the dataset of both periods (2011–2013 and 2014–2024).
The procedure was performed simultaneously for the body-wave velocities, the source parameters (dx, dy, dz, and dt), and the station corrections. The LSQR algorithm was used for the inversion [53,54]. The stability of the procedure was controlled by damping and smoothing. We employed a technique to smooth the velocity anomalies to minimize the differences in the solutions from neighboring nodes. This was achieved by adding equations with two non-zero elements having opposite signs corresponding to all pairs of neighboring nodes. The best values of smoothing were determined through a multiple synthetic test to choose among the parameters that gave the most accurate model recovery. It is important to note that the number of iterations had a similar effect to changes in damping. Therefore, we consistently applied five iterations and only adjusted the smoothing parameters. In total, we used five iterations to derive the final models in both study periods.
Another significant factor to consider is the performance of local earthquake tomography (LET) in different time periods, particularly the application of smoothing over time [55]. This approach was deemed necessary to compensate for the lack of data in some periods, such as our data between 2014 and 2024 in the intracalderic area. Smoothing over time ensures the continuity of the tomographic results, which is crucial for better fidelity in interpreting the final results. The resolution of the available dataset was evaluated using the checkerboard synthetic test [56], described in the supportive information (Section 3; Figures S10–S25). This method involves applying alternating anomalies of positive and negative velocity perturbations on a 1-D gradient model evenly distributed in a checkerboard pattern throughout the model. The optimal values for P- and S-wave amplitude damping and smoothing and the corrections for the station, source coordinates, and origin times were determined based on the results of these tests, as described in [56,57].
The results of the synthetic test showed that, for both time windows, we see higher values of the obtained anomalies at the superficial depth slices (2 and 4 km) than the initial checkerboard ones in step 0 of the procedure. More specifically, the reconstructed body-wave velocity perturbations in iteration 5 are 14–15% (2011–2013; Figures S14–S16) and 12–13% (2014–2024; Figures S23–S25) instead of the original 12%. At deeper slices (8 km), the amplitudes of the anomalies appear to be weaker for the 2011–2013 time window, while for the second one (2014–2024), we observe slightly higher perturbations in P and S as in the shallow ones (2 and 4 km). The tests showed a satisfactory reconstruction of the anomalies for the greatest part of the area for cell sizes greater than 10 km (36.25°–36.55° N, 25.3°–25.6° E) for both time periods. In the area SW of SVC (ESE of Christiana islands), the results were successfully reconstructed in the first time-interval, with an underestimation of the initial board anomalies of about 2–3%. In the second one, horizontal smearing was observed, as in the case of the NE part of the study area. This is mainly due to a lack of seismological stations of the regional network of HUSN and, as a result, a much smaller amount of accurately located earthquake data (36.55°–36.75° N, 25.62°–26.00° E; Amorgos–Columbo spatial cluster) in both of the time intervals.
The results of the vertical resolution tests were robust for the shallow part of the model, with satisfactory results to detect the change in the anomaly sign at these depths. However, the model did not have resolve well for depths greater than 15 km. The cross-sections showed that the anomalies at both ends were blurred due to poor ray coverage (Figures S11–S13). This was caused by the poor azimuthal coverage between available stations and seismic events during the inversion procedure. The study area reconstruction adequately captures the transition from negative to positive velocity anomalies in the cross-sections for the greatest part of the profiles in both time windows. Nevertheless, profiles DD’–FF’ appeared less resolved than the others, particularly in the WNW margin (0–10 km across the section) of the profiles. The lower vertical resolution than the respective horizontal one may be due to the source and velocity parameters trade-off, as suggested by previous studies (e.g., [58]).
The results derived by the tomographic inversion show reduced travel-time residuals of the body-wave arrivals compared to the initial step (iteration 1) in the procedure. The width of the residual distribution (one standard deviation) is reduced by the tomography, from 0.38 to 0.30 s (2011–2013 time window) and from 0.28 to 0.19 s (2014–2024 time window) for the P-waves and from 0.50 to 0.35 s (2011–2013 time window) for the S-waves (2014–2024 time window). The distribution’s mean value has notably shifted toward zero, from −0.90 to 0.55 s for P-waves and 1.05 to 0.85 s for S-waves (Figure 7).
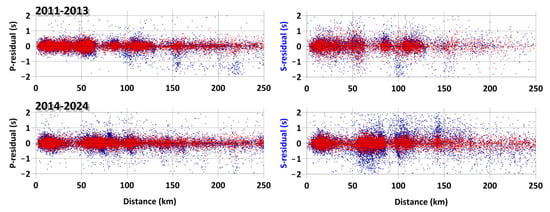
Figure 7.
Residuals of P− (left) and S−wave (right) arrival times as a function of hypocentral distance before (blue dots) and after the tomographic inversion (red dots).
4. Results
As mentioned in the previous paragraph, we divided the dataset into two main windows to conduct the tomographic inversion. The main results of this study, which were derived from the inversion of the earthquake travel times, are presented as dVp, dVs, and Vp/Vs ratios in four tomographic slices at 2, 4, 8, and 12 km depths. Figure 6, Figure 7 and Figure 8 show the six vertical profiles transverse the main volcanic centers of Kameni and Columbo of the SVC.
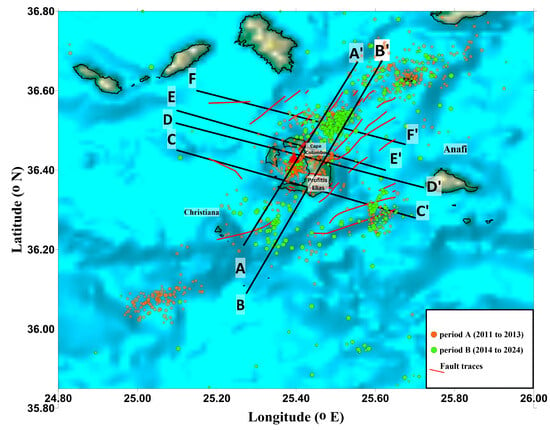
Figure 8.
Location of the performed cross-sections. Red triangles represent the active volcanic centers and the red lines the mapped fault traces [34,35].
Velocity variations for the superficial layers generally range between –12 and +10% for P- and S-waves. At the same time, the respective Vp/Vs ratio varies between 1.54 and 2.05. According to the synthetic modeling tests and the ray coverage, the velocity structure is resolvable for the 2–12 km depth range. Recent studies of active seismic tomography have shown that the intracalderic area (north of Nea Kameni) is mainly composed of a low-velocity anomaly, mainly related to a collapse [59,60], possibly from the episode (3.6 ka; [19,61]). This anomaly appears to be located over the inflation source from 2011–2012 volcanic unrest [39].
2011–2013
For the first period, the most substantial velocity contrasts were identified in the surface layers of the crust (<4 km), while for depths greater than 8 km, the whole picture changes. Summarizing, the following observations can be made from the horizontal slices:
- A zone of low velocities (Vp and Vs) under the Santorini Caldera (Figure 9 and Figure 10), contrasting with the corresponding positive anomalies in the island’s northern part, where the Columbus tectonic line passes.
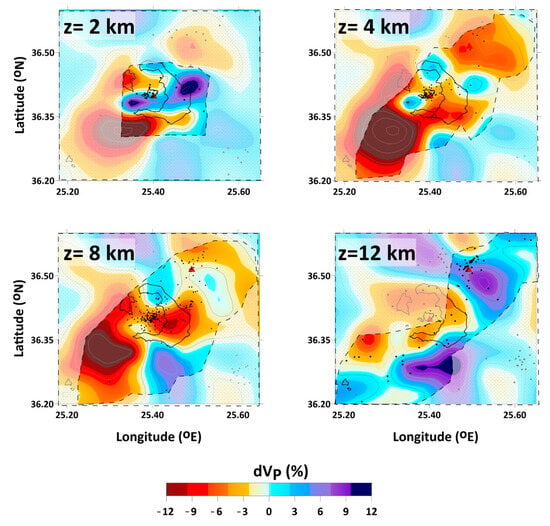 Figure 9. Tomograms of lateral Vp (%) variations at 2, 4, 8, and 12 km depths. Black dots represent the seismicity at each depth slice. Regions with low resolution are manually masked based on the resolution tests. Red triangles represent the volcanic centers of the SVC.
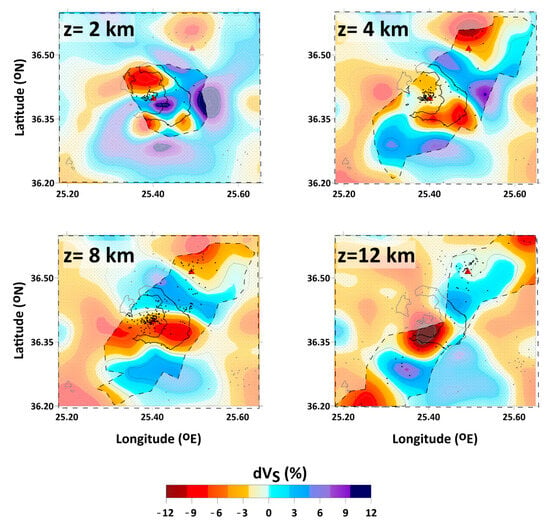 Figure 10. Tomograms of lateral Vs (%) variations at 2, 4, 8, and 12 km depths. Black dots represent the seismicity at each depth slice. Regions with low resolution are manually masked based on the resolution tests. Red triangles represent the volcanic centers of the SVC.
 - An extensive low Vp (%) zone is observed for the depth slices of 4 and 8 km depth in the area SW of Christiana islands (36.20°–36.30° N, 25.2°–25.35° E). These results appear to agree with those of [37,59,60].
- The main negative anomaly for P-waves located in the southern part of the volcanic complex (~−12%) contrasts with the corresponding positive one (~+10%) from the central sector of Nea Kameni to Imerovigli, creating a discontinuity possibly connected with the Kameni tectonic line (slices of 2 and 4 km).
- The distribution of dVp is anticorrelated with that of dVs in the area N–NNE of Kameni.
- Furthermore, a similar observation is made in the central sector of Santorini Island, NNE of Akrotiri, where a strong contrast of the E–W direction between positive (north) and negative (south) body-wave velocity perturbations is observed (36.35–36.42° Ν, 25.42–25.45° Ε).
- On the other hand, heading towards Columbo, we see the dominance of negative body-wave velocity perturbations for the depth slices of 2 and 4 km, while in the deeper tomograms, this changes with the prevalence of positive anomalies (~6–8%) and the distribution of higher Vp/Vs ratio (Figure 11) (>1.87; ~36.50° Ν, 25.50° Ε).
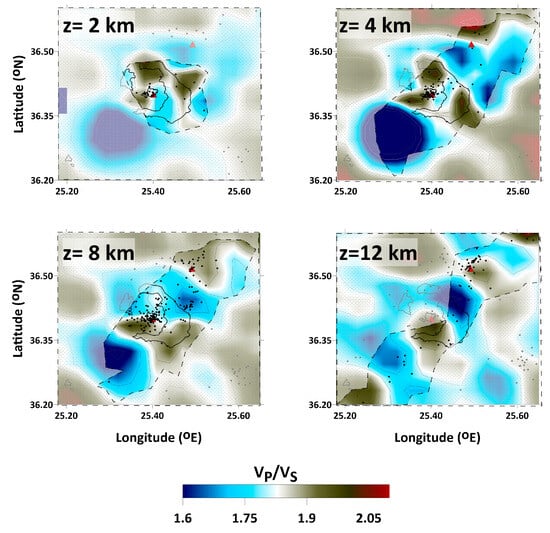 Figure 11. Tomograms of lateral Vp/Vs ratio at 2, 4, 8, and 12 km depths. Black dots represent the seismicity at each depth slice. Regions with low resolution are manually masked based on the resolution tests. Red triangles represent the volcanic centers of the SVC.
Six profiles were drawn to track these anomalies in more detail, two NNE-oriented and four WNW–ESE (Figure 8). These cross-sections have highlighted the following:
- Strong negative anomalies at shallow depths to 6 km and relatively large Vp/Vs ratio values.
- At depths greater than 4 km (profiles AA’ and BB’), NNE and SSW of Nea Kameni, high body-wave anomalies (>8%).
- At a depth range between 3 and 7 km, beneath the caldera of Santorini, positive dVp (%) and negative dVs (%). This resulted in high Vp/Vs ratios that approached the value of 2.
- High Vp, low Vs, and high Vp/Vs ratios are observed at 6–8 km depth, south of Nea Kameni and north of Akrotiri (profile CC’).
- In profiles AA’, BB’, and FF’, the distribution of a broad negative anomaly (~ −10%) becomes evident in both dVp and dVs, and low Vp/Vs ratio values at the end of each section beneath Columbo volcano can be observed (Figure 12, Figure 13 and Figure 14).
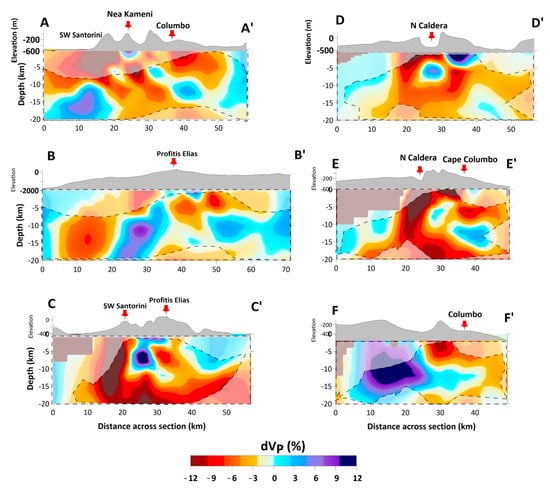 Figure 12. Distribution of Vp (%) variations. Regions with low resolution are manually masked based on the resolution tests. Map projection of cross-sections in Figure 8.
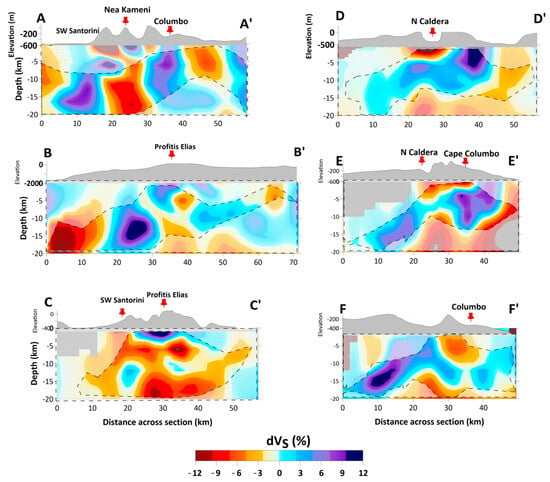 Figure 13. Distribution of Vs (%) variations. Regions with low resolution are manually masked based on the resolution tests. Map projection of cross-sections in Figure 8.
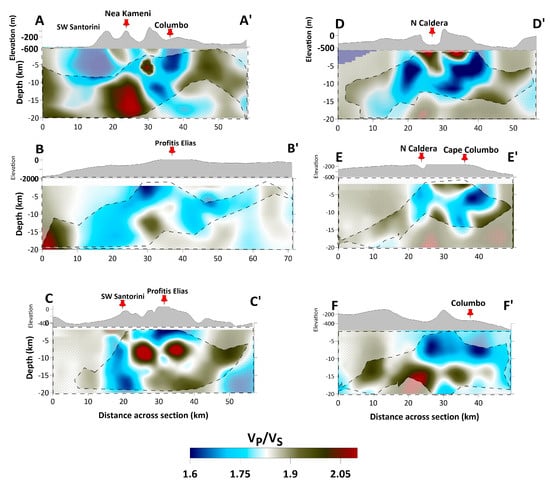 Figure 14. Distribution of Vp/Vs ratio values. Regions with low resolution are manually masked based on the resolution tests. Map projection of cross-sections in Figure 8.
 - The absolute body-wave velocities range from 3.4 to 5.0 km/s (P-wave) and 2.2 to 3.4 km/s (S-wave) in the uppermost part of the crust (~5.0 km depth). At the 5–10 km depth, the P- and S velocities are generally low beneath the main volcanic centers of Kameni and Columbo, compared to the areas SW and NE (profiles AA’ and BB’; Figures S26 and S27).
2014–2024
In this time interval, we have observed the following:
- A considerable decrease in the intensity of the anomalies at depth slices of 2 and 4 km compared to the first time-window. In comparison, the widening of the negative anomalies (~−12%) in the S waves’ velocities and the change of the sign of the perturbations in the area south of Kameni for the slices of 8 and 12 km are characteristic.
- The greatest velocity contrasts were seen in the surface layers of the crust (<4 km), while for depths greater than 8 km, a zone of fast velocity anomalies (Vp and Vs) is observed in the area south of Kameni and near Akrotiri (Figure 15 and Figure 16), contrasting with the corresponding negative ones to the north.
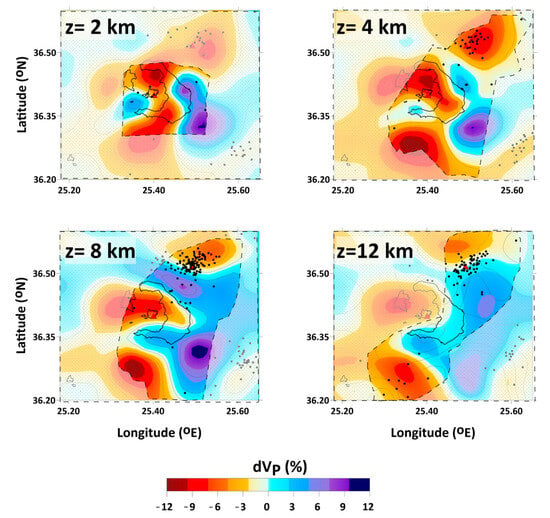 Figure 15. Tomograms of lateral Vp (%) variations at 2, 4, 8, and 12 km depths. Black dots represent the seismicity at each depth slice. Regions with low resolution are manually masked based on the resolution tests. Red triangles represent the volcanic centers of the SVC.
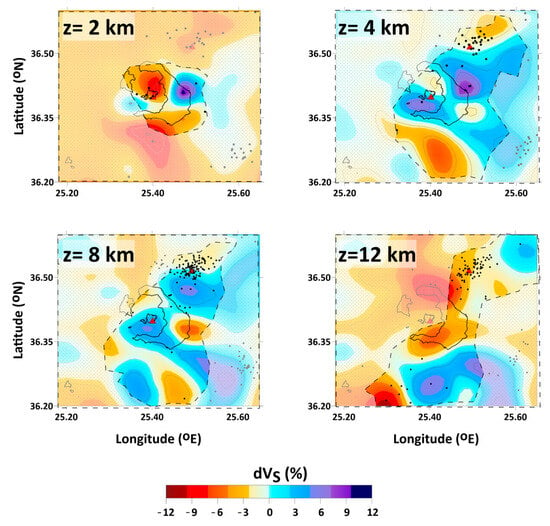 Figure 16. Tomograms of lateral Vs (%) variations at 2, 4, 8, and 12 km depths. Black dots represent the seismicity at each depth slice. Regions with low resolution are manually masked based on the resolution tests. Red triangles represent the volcanic centers of the SVC.
 - The main negative anomaly for P-waves located in the central part of the volcanic complex (~−12%) contrasts with the corresponding positive one (~+10%) from the southern sector of SVC, creating a discontinuity at the southern part of the island.
- The distribution of the Vp/Vs ratio appears to have its maximum values (>1.87) N-NNE of Kameni in a region close to the magmatic chamber that was identified by [16] in the 2011–2012 swarm (36.40–36.43° Ν, 25.42–25.45° Ε; Figure 17).
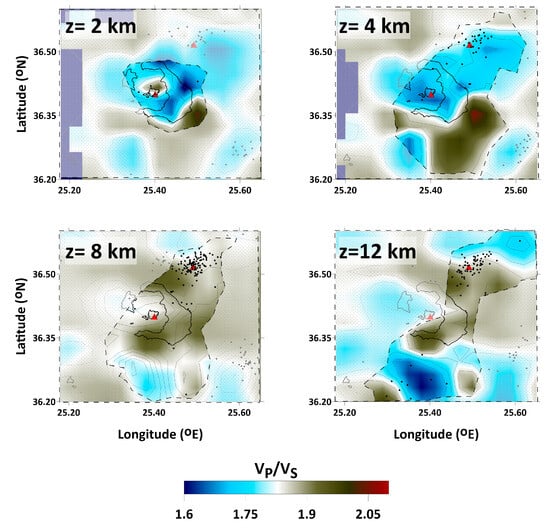 Figure 17. Tomograms of lateral Vp/Vs ratio at 2, 4, 8, and 12 km depths. Black dots represent the seismicity at each depth slice. Regions with low resolution are manually masked based on the resolution tests. Red triangles represent the volcanic centers of the SVC.
 - Furthermore, a similar observation is made in the central sector of Santorini Island, NNE of Akrotiri, where a strong contrast of the E–W direction between positive (north) and negative (south) body-wave velocity perturbations is observed (36.35–36.42° Ν, 25.42–25.45° Ε), which resembles the results of [59,60,62] from the active source experiment conducted in 2015. In the area NE of Santorini Island, we keep seeing the dominance of negative body-wave velocity perturbations for the depth slices of 2 and 4 km, as in the first time-window (~36.50° Ν, 25.50° Ε). This is in agreement with the studies of [37,62,63]. The latter [63] has shown the presence of a low Vp zone below the submarine volcano of Columbo between 2 and 4 km depth.
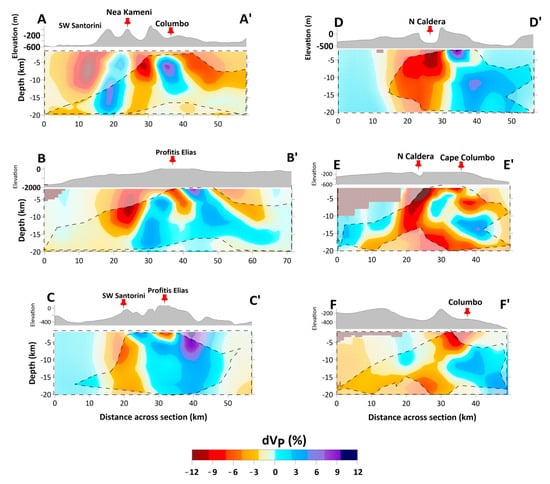
Figure 18.
Distribution of Vp (%) variations. Regions with low resolution are manually masked based on the resolution tests. Map projection of cross-sections in Figure 8.
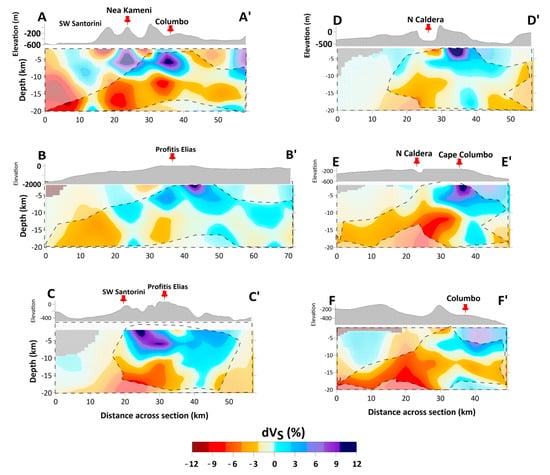
Figure 19.
Distribution of Vs (%) variations. Regions with low resolution are manually masked based on the resolution tests. Map projection of cross-sections in Figure 8.
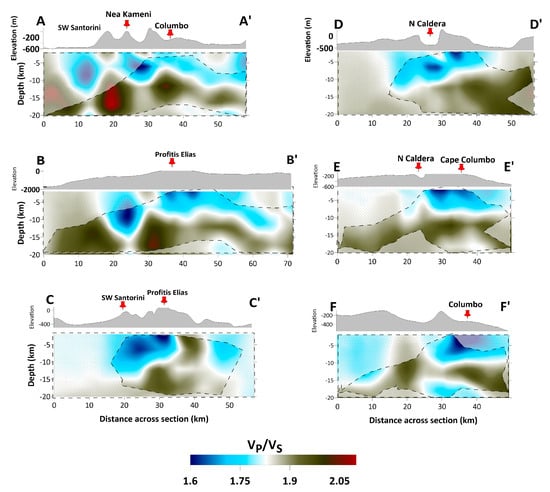
Figure 20.
Distribution of Vp/Vs ratio values. Regions with low resolution are manually masked based on the resolution tests. Map projection of cross-sections in Figure 8.
- Strong negative anomalies at shallow depths in the intracalderic area, associated with relatively high Vp/Vs ratio values (>1.85).
- Low Vp and high Vs anomalies at deep parts of the area beneath Kameni (profiles DD’ and EE’), forming a low Vp/Vs ratio distribution.
- The absolute body-wave velocities range from 3.4 to 5.0 km/s (P-wave) and 2.2 to 3.4 km/s (S-wave) in the uppermost part of the crust (~5.0 km depth).
At depths greater than 7 km, these values approach 6.2 km/s (P-wave) velocities and 3.5 km/s (S-wave; Figures S28 and S29).
5. Discussion
Our study rigorously examines the changes in the velocity structure of body waves (Vp, Vs, Vp/Vs) between the 2011–2012 unrest up to the current phase of the SVC. The main goal was to explore what (and if something) has changed in the body-wave velocity structure from 2011 to 2012, as well as to explore more features than the caldera area and the volcanotectonic lines that may be promising to explore and find our limitations while correlating the results with the ones derived by active seismic tomographic surveys in order to have a clearer view of the evolution of the area that may help us to construct better starting velocity models and provide a better earthquake catalogue with more accurate focal parameters.
The alternation between periods of inactivity and unrest is an interesting issue in volcanic complexes. The 2011–2012 phase of unrest commenced at the Santorini volcano in January 2011, picked up in December 2012, and gradually diminished in the second quarter of the year. While the characteristic part of that period was the concentration of microseismic activity along the Kameni line, in the second half of the same year, we saw elevated numbers of microearthquakes in both the Columbo line and Anhydros basin in the Amorgos–Columbo fracture zone. Recent studies of past seismic swarms (2006–2007) have concluded the possibility of a fluid saturated crust below the submarine volcano of Columbo and the presence of a magma chamber composed by melts that may have been the driving mechanisms of these swarms due to perturbations in pore-fluid pressure [64].
The analysis of the first time-window (2011–2013) revealed a connection between the recorded seismicity to magmatic bodies and active faulting, especially along the NE–SW direction. The velocity anomalies remain comparable to the previous studies of [16], highlighting an area of low Vp and Vs and high Vp/Vs anomaly located beneath the Caldera, NE of Nea Kameni, centered at ~5 km depth. The presence of these conditions (low body-wave velocity perturbations and high Vp/Vs) of seismic parameters is a clear indicator of the presence of a liquid phase in shallow magmatic chambers (e.g., dissolved volatiles or melts) [65,66,67,68]. These results have a good correlation with the ones of [62] that found a low-velocity volume in the area north of Kameni Island that was attributed to a magmatic body with melts ranging from 4 to 13%.
In the area to the NNE of Akrotiri, we have obtained a strong contrast of E–W direction between positive (north) and negative (south) body-wave velocity perturbations. This can be linked to the hydrothermal activity recorded contemporaneous with the studies of the 2011–2012 unrest [36]. In general, negative anomalies in body-wave velocities are associated with the fragmentation of local fault zones of the crust, where hot fluids find a passage to rise. More specifically, the collapsed parts of the volcanic complex are characterized by a broad zone of low-velocity P-waves up to a depth of 7 km. Refs. [59,61] revealed an anomalous low-velocity body in a depth range between 0.5 and 3 km using active source seismic data. They modeled their results to a low-density cylinder, interpreting it as sill emplacement beneath the caldera.
During the 2014–2024 period, we observed a significant reduction in body-wave perturbations (%) for the shallow depth slices, a finding that is of great importance when compared to the 2011–2013 time window. The circular area of the high Vp/Vs ratio (>1.87) remains in the area N–NNE of Kameni at a shallower depth (~2 km), a consistency that aligns with recent studies [59,60,62,63,64]. The reduction in the Vp/Vs ratio for the broader region of Kameni Island fits the data of [69]. In this study, they have concluded that a gas depletion and cooling of the magma emplaced at ~4 km depth during the last volcanic unrest of 2011–2012 has taken place considering the data from the caldera over 2015–2022. On the other hand, near the volcanic center of Columbo, we see the dominion of negative Vp, and Vs anomalies and a low Vp/Vs ratio (1.56–1.64) at shallow depths, comparable to the 2011–2013 time window. Usually, low Vp/Vs values are usually associated with dry steam/gas phases [59,60,69,70]. This observation is supported by the results of [69], who report high gas concentrations at about 270 °C underneath the Columbo submarine volcano at shallow depths (Figure 21).
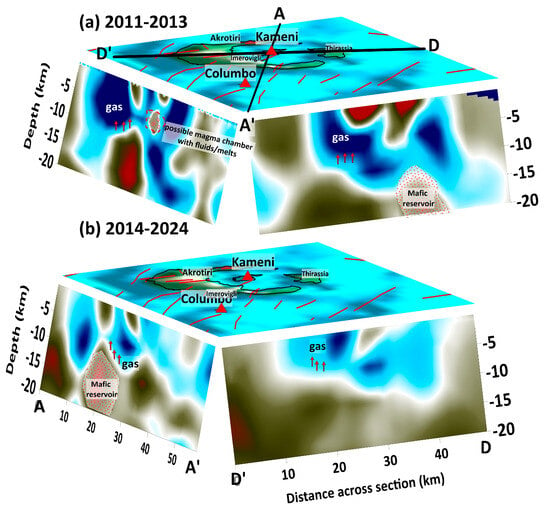
Figure 21.
Interpretation of the tomography results of profiles AA’ and DD’ based on the results of Vp/Vs ratio for (a) 2011–2013 and (b) 2014–2024 temporal window.
In the vertical sections of both time windows, we observe an anomaly of very high Vp/Vs beneath Kameni at depths between 3 and 7 km below sea level. The transition from high to low Vp/Vs in both time windows may be associated with the point where the dissolved magma fluids transform into gases due to the crystallization of anhydrous minerals and/or decompression, as mentioned in relevant studies [71,72,73]. The distribution of absolute body-wave velocities ranges from 6.5 to 6.8 km/s (P-wave) and 3.5 to 4.0 km/s (S-wave) in the uppermost part of the crust (~17–22.0 km depth). These results are by both recent [59,60,61,62,63,64] and previous studies conducted in the past [9,37,74]. In the cross-section that passes through the volcanic centers of Nea Kameni and Columbo (AA’), there is not any clear evidence of a resolvable connection between these two magmatic chambers in body-wave velocities (Vp and Vs) and Vp/Vs ratio, which is in accordance with petrological studies [75] that rule out a connection between these two magmatic chambers in shallow depths. Past LET in the area [37] on this matter has suggested that there might be a connection between these two systems at deeper parts of the crust.
Heading towards the SW of SVC, we can see a zone with negative Vp (%) perturbations in the limits of our fidelity area for both time periods. This feature is interesting since it is highlighted by both LETs, using the lineaments of earthquakes we observe, and active-source seismic tomography studies. According to [76], this area is an NNE-oriented Pliocene basin that connects the Christiana islands with the submarine volcano of Columbo.
During this work, several similarities with respective local earthquake tomography studies have been observed, but there are also some crucial differences. The differences are mainly focused on the method, active vs. passive (earthquake) seismic tomography. Ref. [77] has emphasized that the reliability of seismic imaging relies on the artificial seismic sources, the knowledge of locations and arrival times at the receivers, the controlled geometry of the experiment, and the high precision of the results, which provide more accurate results on the selected target. Here, it should be pointed out that upgrading the seismological network with the simultaneous processing of active seismic is necessary to allow an overlap of the results in certain areas while in others, mostly in greater depths, it complements them.
The amelioration of the seismic network and a more systematic monitoring of the volcano may provide more evidence for melt accumulation in the shallow part of the crust, which may play an essential role in future tomographic studies. The knowledge of a 3-D body-wave velocity model obtained in this study and the characteristics of the behavior of the magmatic system assist in reducing the calculation times of a new model without any a priori knowledge. These results, combined with continuous temporal monitoring, may give significant information on the evolution of the magmatic feeding system, combined with a close look at the classification of the events. In this study, we have tried to provide a detailed image of the shallow magmatic system of the SVC and give a first insight into their evolution in the last 15 years. This is valuable information on the behavior of the Santorini Volcanic Complex that hopefully may assist geoscientists with important input on volcanic hazard assessments and provide an estimate of the impact of a future event in the region of the Eastern Mediterranean Sea.
6. Conclusions
In the concluding remarks of this paper, a comparison between two different time periods has been applied to the SVC velocity structure between 2011 and 2024. The adopted temporal windows for a tomographic application were 2011–2013 and 2014–2024 to overcome the lack of data in some periods. However, we must keep in mind, as previous studies mention, that while this kind of technique has the potential to detect and resolve spatiotemporal changes in seismic velocities, on the other hand, it is subject to bias due to these variations with time in ray paths, which are mainly caused by the differentiation in the hypocenter locations. To reduce these effects, we filtered the available hypocenter locations and kept the standard stations of the permanent network (HUSN). The main results are summarized in the following:
- -
- A significant reduction in body-wave anomalies has been observed at shallow depths since the 2011–2012 unrest.
- -
- A persistently high Vp/Vs ratio (>1.87) remains NNE of Kameni at a shallower depth (2 km) than in the first time-period.
- -
- The Columbo volcano is mainly characterized by negative P and S anomalies and a low Vp/Vs ratio (1.56–1.64) at shallow depths in both time windows, interpreted as dry steam/gas phases.
- -
- At depths shallower than 20 km, the Columbo submarine volcanic center is not connected to the Kameni one.
- -
- There is a wide low-velocity (Vp) zone in the SW of Christiana Islands, which is correlated to the Pliocene NNE–SSW-oriented basin.
- -
- We have to be cautious about the above-mentioned results due to the limited resolution regarding the separation lengths between the volcano-tectonic features.
The seismic crises of volcanic centers of the SAVA highlight the importance of adding more stations to the permanent facilities [78,79,80,81,82,83] to obtain a high-precision hypocenter catalogue and perform detailed studies that will include the investigation of the waveform shape, frequency content, and hypocenter migration using new algorithms of artificial intelligence (AI). The results of this study are a vital step towards a better understanding of the processes in the central part of the HVA, an area that has seen attention by the community of geoscientists.
Supplementary Materials
The following supporting information can be downloaded at https://www.mdpi.com/article/10.3390/geosciences14100263/s1. Table S1: Focal parameters of the significant earthquakes in Figure 1. Source: [6]. Figure S1: Total P-(blue) and S-ray (yellow) distribution for (a) 2011–2013 and (b) 2014–2024 time periods. Red triangles indicate the locations of the used stations. The selected seismicity used in this work is presented by black dots; Figure S2: Custom 1-D velocity model for Vp and Vs. The Vp/Vs ratio was 1.82; Figure S3: Depth distribution of the seismic events of (a) 2011–2013 and (b) 2014–2024; Figures S4 and S5: Normalized ray density of the P and S-waves for the maximum value, and nodes (magenta circles) for two grids with orientations of 0 and 67 degrees at depths of 2 km and 6 km (2011–2013 and 2014–2024 time periods); Figures S6–S9: Vertical distribution of P- and S-rays for the 2011–2013 and 2014–2024 time intervals; Figures S10–S13: Horizontal and vertical initial checkerboard anomalies; Figures S14–S16: Reconstruction of Vp, Vs, and Vp/Vs for the depth slices of 2, and 6 km and cell size of 5, 10, and 20 km for 2011–2013 time interval; Figures S17–S19: Vertical resolution of Vp, Vs, and Vp/Vs for 2011–2013 time interval; Figures S20–S22: Reconstruction of Vp, Vs, and Vp/Vs for the depth slices of 2, and 6 km and cell size of 5, 10, and 20 km for 2014–2024 time interval; Figures S23–S25: Vertical resolution of Vp, Vs, and Vp/Vs for 2014–2024 time interval; Figures S26–S29: Distribution of the absolute body-wave velocities (Vp and Vs) for the 2011–2013 and 2014–2024 time periods.
Author Contributions
Conceptualization, A.K.; methodology, A.K. and F.V.; software, A.K.; validation, A.K. and F.V.; formal analysis, A.K. and F.V.; investigation, A.K. and F.V.; resources, A.K. and F.V.; data curation, A.K. and F.V.; writing—original draft preparation, A.K.; writing—review and editing, A.K. and F.V.; visualization, A.K.; supervision, A.K. All authors have read and agreed to the published version of the manuscript.
Funding
This research received no external funding.
Data Availability Statement
All data products generated in this study (velocity models, earthquake catalogues) are available from the authors upon request.
Acknowledgments
We would like to thank all the scientists with whom we have discussed these matters on Santorini Island and the reviewers for their creative comments and suggestions on upgrading the content of this study. Special thanks to Kyriaki Drymoni for her valuable advice in matters concerning active magmatic systems. We used data from the following seismic networks: HL (Institute of Geodynamics, National Observatory of Athens, https://doi.org/10.7914/SN/HL), HP (University of Patras, doi: 10.7914/SN/HP), HT (Aristotle University of Thessaloniki, https://doi.org/10.7914/SN/HT), HA (National and Kapodistrian University of Athens, https://doi.org/10.7914/SN/HA), HC (Seismological Network of Crete, https://doi.org/10.7914/SN/HC), and HI Institute of Engineering Seismology and Earthquake Engineering, https://doi.org/10.7914/SN/HI) networks.
Conflicts of Interest
The authors declare no conflict of interest.
References
- Papazachos, C.B.; Kiratzi, A.A. A detailed study of the active crustal deformation in the Aegean and surrounding area. Tectonophysics 1996, 253, 129–153. [Google Scholar] [CrossRef]
- McKenzie, D. Active Tectonics of the Mediterranean Region. Geophys. J. Int. 1972, 30, 109–185. [Google Scholar] [CrossRef]
- McClusky, S.; Balassanian, S.; Barka, A.; Demir, C.; Ergintav, S.; Georgiev, I.; Gurkan, O.; Hamburger, M.; Hurst, K.; Kahle, H.; et al. Global Positioning System constraints on plate kinematics and dynamics in the eastern Mediterranean and Caucasus. J. Geophys. Res. Space Phys. 2000, 105, 5695–5719. [Google Scholar] [CrossRef]
- Brüstle, A.; Friederich, W.; Meier, T.; Gross, C. Focal mechanism and depth of the 1956 Amorgos twin earthquakes from waveform matching of analogue seismograms. Solid Earth 2014, 5, 1027–1044. [Google Scholar] [CrossRef]
- Papazachos, B.C.; Papadimitriou, E.E.; Kiratzi, A.A.; Papazachos, C.B.; Louvari, E.K. Fault plane solutions in the Aegean Sea and the surrounding area and their tectonic implication. Boll. Geofis. Teor. Appl. 1998, 39, 199–218. [Google Scholar]
- Kassaras, I.; Kapetanidis, V.; Ganas, A.; Tzanis, A.; Kosma, C.; Karakonstantis, A.; Valkaniotis, S.; Chailas, S.; Kouskouna, V.; Papadimitriou, P. The New Seismotectonic Atlas of Greece (v1.0) and Its Implementation. Geosciences 2020, 10, 447. [Google Scholar] [CrossRef]
- Papadopoulos, G.; Sachpazi, M.; Panopoulou, G.; Stavrakakis, G. The volcanoseismic crisis of 1996–1997 in Nisyros, SE Aegean Sea, Greece. Terra Nova 1998, 10, 151–154. [Google Scholar] [CrossRef]
- Sachpazi, M.; Kontoes, C.; Voulgaris, N.; Laigle, M.; Vougioukalakis, G.; Sikioti, O.; Stavrakakis, G.; Baskoutas, J.; Kalogeras, J.; Lepine, J.C. Seismological and SAR signature of unrest at Nisyros Caldera, Greece. J. Volcanol. Geotherm. Res. 2002, 116, 19–33. [Google Scholar] [CrossRef]
- Bohnhoff, B.; Rische, M.; Meier, T.; Becker, D.; Stavrakakis, G.; Harjes, H.P. Microseismic activity in the Hellenic Volcanic Arc, Greece, with emphasis on the seismotectonic setting of the Santorini–Amorgos zone. Tectonophysics 2006, 423, 17–33. [Google Scholar] [CrossRef]
- Dimitriadis, I.; Karagianni, E.; Panagiotopoulos, D.; Papazachos, C.; Hatzidimitriou, P.; Bohnhoff, M.; Rische, M.; Meier, T. Seismicity and active tectonics at Coloumbo Reef (Aegean Sea, Greece): Monitoring an active volcano at Santorini Volcanic Center using a temporary seismic network. Tectonophysics 2009, 465, 136–149. [Google Scholar] [CrossRef]
- Kolaitis, A.; Papadimiriou, P.; Kassaras, I.; Makropoulos, K. Seismic observations with broadband instruments at Santorini Volcano, Bulletin of the Geological Society of Greece. In Proceedings of the 11th International Congress, Athens, Greece, 24 May 2007; pp. 1150–1161. [Google Scholar]
- Lagios, E.; Sakkas, V.; Novali, F.; Bellotti, F.; Ferretti, A.; Vlachou, K.; Dietrich, V. SqueeSARTM and GPS ground deformation monitoring of Santorini Volcano (1992–2012): Tectonic Implications. Tectonophysics 2013, 594, 38–59. [Google Scholar] [CrossRef]
- Newman, A.V.; Stiros, S.; Feng, L.; Psimoulis, P.; Moschas, F.; Saltogianni, V.; Jiang, Y.; Papazachos, C.; Panagiotopoulos, D.; Karagianni, E.; et al. Recent geodetic unrest at Santorini Caldera, Greece. Geophys. Res. Lett. 2012, 39, L06309. [Google Scholar] [CrossRef]
- Nomikou, P.; Parks, M.M.; Papanikolaou, D.; Pyle, D.M.; Mather, T.A.; Carey, S.; Watts, A.B.; Paulatto, M.; Kalnins, M.L.; Livanos, I.; et al. The emergence and growth of a submarine volcano: The Kameni islands, Santorini (Greece). Geo. Res. J. 2014, 1–2, 8–18. [Google Scholar] [CrossRef]
- Saltogianni, V.; Stiros, S.C.; Newman, A.V.; Flanagan, K.; Moschas, F. Time-space modeling of the dynamics of Santorini volcano (Greece) during the 2011–2012 unrest. J. Geophys. Res. Solid Earth 2014, 119, 8517–8537. [Google Scholar] [CrossRef]
- Papadimitriou, P.; Kapetanidis, V.; Karakonstantis, A.; Kaviris, G.; Voulgaris, N.; Makropoulos, K. The Santorini Volcanic Complex: A detailed multi-parameter seismological approach with emphasis on the 2011–2012 unrest period. J. Geodyn. 2015, 85, 32–57. [Google Scholar] [CrossRef]
- Kaviris, G.; Papadimitriou, P.; Kravvariti, P.; Kapetanidis, V.; Karakonstantis, A.; Voulgaris, N.; Makropoulos, K. A detailed seismic anisotropy study during the 2011-2012 unrest period in the Santorini Volcanic Complex. Phys. Earth Planet. Inter. 2015, 238, 51–88. [Google Scholar] [CrossRef]
- Druitt, T.H.; Mellors, R.A.; Pyle, D.M.; Sparks, R.S.J. Explosive volcanism on Santorini, Greece. Geol. Mag. 1989, 126, 95–126. [Google Scholar] [CrossRef]
- Druitt, T.H. New insights into the initiation and venting of the Bronze-Age eruption of Santorini, from component analysis. Bull. Volcanol. 2014, 76, 794. [Google Scholar] [CrossRef]
- Druitt, T.H.; Francaviglia, V. Caldera formation on Santorini and the physiography of the islands in the late Bronze Age. Bull. Volcanol. 1992, 54, 484–493. [Google Scholar] [CrossRef]
- Dura, A.; Nomikou, P.; Mertzimekis, T.J.; Hannington, M.D.; Petersen, S.; Poulos, S. Identifying Probable Submarine Hydrothermal Spots in North Santorini Caldera Using the Generalized Moments Method. Geosciences 2023, 13, 269. [Google Scholar] [CrossRef]
- Paraskevas, M.; Paradissis, D.; Hooft, E.; Nomikou, P. Spatiotemporal gravity changes at the Santorini Volcanic complex and their interpretation. Quat. Sci. Adv. 2024, 13, 100140. [Google Scholar] [CrossRef]
- Vougioukalakis, G.E.; Fytikas, M. Volcanic Hazards in the Aegean Area, Relative Risk Evaluation, Monitoring and Present State of the Active Volcanic Centers. In The South Aegean Active Volcanic Arc, Development in Volcanology; Fytikas, M., Vougioukalakis, G.E., Eds.; Elsevier: Amsterdam, The Netherlands, 2005; Volume 7, pp. 161–183. [Google Scholar]
- Dominey-Howes, D.; Cundy, A.; Croudace, I. High energy marine flood deposits on Astypalea Island, Greece: Possible evidence for the AD 1956 southern Aegean tsunami. Mar. Geol. 2000, 163, 303–315. [Google Scholar] [CrossRef]
- Cantner, K.; Carey, S.; Nomikou, P. Integrated volcanologic and petrologic analysis of the 1650 AD eruption of Kolumbo submarine volcano, Greece. J. Volcanol. Geotherm. Res. 2014, 269, 28–43. [Google Scholar] [CrossRef]
- Ulrova, M.; Paris, R.; Nomikou, P.; Kelfoun, K.; Leibrandt, S.; Tappin, D.R.; McCoy, F.W. Source of the tsunami generated by the 1650 AD eruption of Kolumbo submarine volcano (Aegean Sea, Greece). J. Volcanol. Geotherm. Res. 2016, 321, 125–139. [Google Scholar] [CrossRef]
- Konstantinou, K.I. Magma chamber evolution during the 1650 AD Kolumbo eruption provides clues about past and future volcanic activity. Sci. Rep. 2020, 10, 15423. [Google Scholar] [CrossRef]
- Papazachos, B.C.; Papazachou, C. The Earthquakes of Greece; Ziti Publications: Athens, Greece, 2003. [Google Scholar]
- ten Veen, J.H.; Kleinspehn, K.L. Incipient continental collision and plate-boundary curvature: Late Pliocene–Holocene transtensional Hellenic forearc, Crete, Greece. J. Geol. Soc. 2003, 160 Pt 2, 161–181. [Google Scholar] [CrossRef]
- Papadimitriou, E.; Sourlas, G.; Karakostas, V. Seismicity variations in the Southern Aegean, Greece, before and after the large (M7.7) 1956 Amorgos earthquake due to evolving stress. Pure Appl. Geophys. 2005, 162, 783–804. [Google Scholar] [CrossRef]
- Okal, E.A.; Synolakis, C.E.; Uslu, B.; Kalligeris, N.; Voukouvalas, E. The 1956 earthquake and tsunami in Amorgos, Greece. Geophys. J. Int. 2009, 178, 1533–1554. [Google Scholar] [CrossRef]
- Konstantinou, K. Crustal rheology of the Santorini–Amorgos zone: Implications for the nucleation depth and rupture extent of the 9 July 1956 Amorgos earthquake, southern Aegean. J. Geodyn. 2010, 50, 400–409. [Google Scholar] [CrossRef]
- Hensch, M.; Dahm, T.; Hort, M.; Dehghani, A.; Hübscher, C.; The EGELADOS Working Group. First results of the ocean-bottom-seismometer and-tiltmeter experiment at Coloumbo submarine volcano (Aegean Sea, Greece). In Geophysical Research Abstracts, Proceedings of the EGU General Assembly, Vienna, Austria, 13–18 April 2008; European Geosciences Union: Vienna, Austria, 2008; Volume 10, EGU2008-A-02760. [Google Scholar]
- Sakellariou, D.; Sigurdsson, H.; Alexandri, M.; Carey, S.; Rousakis, G.; Nomikou, P.; Georgiou, P.; Ballas, D. Active Tectonics in the Hellenic Volcanic Arc: The Kolumbo Submarine Volcanic Zone. Bull. Geol. Soc. Greece 2017, 43, 1056. [Google Scholar] [CrossRef]
- Nomikou, P.; Hübscher, C.; Papanikolaou, D.; Farangitakis, G.; Ruhnau, M.; Lampridou, D. Expanding extension, subsidence and lateral segmentation within the Santorini–Amorgos basins during Quaternary: Implications for the 1956 Amorgos events, central–south Aegean Sea, Greece. Tectonophysics 2018, 722, 138–153. [Google Scholar] [CrossRef]
- Sigurdsson, H.; Carey, S.; Alexandri, M.; Vougioukalakis, G.; Croff, K.L.; Roman, C.; Sakellariou, D.; Anagnostou, C.; Rousakis, G.; Ioakim, C. Marine investigations of Greece’s Santorini volcanic field. Eos 2006, 87, 337–339. [Google Scholar] [CrossRef]
- Dimitriadis, I.; Papazachos, C.; Panagiotopoulos, D.; Hatzidimitriou, P.; Bohnhoff, M.; Rische, M.; Meier, T. P and S velocity structures of the Santorini–Coloumbo volcanic system (Aegean Sea, Greece) obtained by non-linear inversion of travel times and its tectonic implications. J. Volcanol. Geotherm. Res. 2010, 195, 13–30. [Google Scholar] [CrossRef]
- Konstantinou, K.; Evangelidis, C.; Liang, W.-T.; Melis, N.; Kalogeras, I. Seismicity, Vp/Vs and shear wave anisotropy variations during the 2011 unrest at Santorini caldera, southern Aegean. J. Volcanol. Geotherm. Res. 2013, 267, 57–67. [Google Scholar] [CrossRef]
- Parks, M.M.; Moore, J.D.P.; Papanikolaou, X.; Biggs, J.; Mather, T.A.; Pyle, D.M.; Raptakis, C.; Paradissis, D.; Hooper, A.; Parsons, B.; et al. Evolution From quiescence to unrest: 20 years of satellite geodetic measurements at Santorini volcano, Greece. J. Geophys. Res. Solid Earth 2015, 120, 1309–1328. [Google Scholar] [CrossRef]
- Feuillet, N. The 2011–2012 unrest at Santorini rift: Stress interaction between active faulting and volcanism. Geophys. Res. Lett. 2013, 40, 3532–3537. [Google Scholar] [CrossRef]
- Rivalta, E.; Corbi, F.; Passarelli, L.; Acocella, V.; Davis, T.; Di Vito, M.A. Stress inversions to forecast magma pathways and eruptive vent location. Sci. Adv. 2019, 5, eaau9784. [Google Scholar] [CrossRef]
- Karakonstantis, A.; Papadimitriou, P.; Kapetanidis, V.; Kaviris, G.; Voulgaris, N.; Kassaras, I. Moderate to Strong recoded earthquakes during 2020–2022 in the Hellenic peninsula and neighbouring regions. In Proceedings of the 16th International Congress of the Geological Society of Greece, Patras, Greece, 17–19 October 2022; p. 278. [Google Scholar]
- Ambraseys, N.N. The seismic sea wave of July 9, 1956, in the Greek archipelago. J. Geophys. Res. Space Phys. 1960, 65, 1257–1265. [Google Scholar] [CrossRef]
- Papadopoulos, G.A.; Gràcia, E.; Urgeles, R.; Sallares, V.; De Martini, P.M.; Pantosti, D.; González, M.; Yalciner, A.C.; Mascle, J.; Sakellariou, D.; et al. Historical and pre-historical tsunamis in the Mediterranean and its connected seas: Geological signatures, generation mechanisms and coastal impacts. Mar. Geol. 2014, 354, 81–109. [Google Scholar] [CrossRef]
- Papadopoulos, G.A.; Pavlides, S.B. The large 1956 earthquake in the South Aegean: Macroseismic field configuration, faulting, and neotectonics of Amorgos Island. Earth Planet. Sci. Lett. 1992, 113, 383–396. [Google Scholar] [CrossRef]
- Behr, Y.; Clinton, J.F.; Cauzzi, C.; Hauksson, E.; Jónsdóttir, K.; Marius, C.G.; Pinar, A.; Salichon, J.; Sokos, E. The Virtual Seismologist in SeisComP3: A New Implementation Strategy for Earthquake Early Warning Algorithms. Seism. Res. Lett. 2016, 87, 363–373. [Google Scholar] [CrossRef]
- Lee, W.H.K.; Lahr, J.C. HYP071 (Revised): A Computer Program for Determining Hypocenter, Magnitude, and First Motion Pattern of Local Earthquakes; U.S. Geological Survey Open File Report 75-311; U.S. Geological Survey: Reston, VA, USA, 1975.
- Klein, F.W. User’s Guide to HYPOINVERSE-2000, a Fortran Program to Solve for Earthquake Locations and Magnitudes, 2002–2171; United States Department of the Interior Geological Survey: Menlo Park, CA, USA, 2002; p. 123. [Google Scholar]
- Koulakov, I. LOTOS code for local earthquake tomographic inversion: Benchmarks for testing tomographic algorithms. Bull. Seismol. Soc. Am. 2009, 99, 194–214. [Google Scholar] [CrossRef]
- Toomey, D.R.; Foulger, G.R. Tomographic inversion of local earthquake data from the Hengill–Grensdalur central volcano complex, Iceland. J. Geophys. Res. 1989, 94, 17497–17510. [Google Scholar] [CrossRef]
- Jaxybulatov, K.; Koulakov, I.; Ibs-von Seht, M.; Klinge, K.; Reichert, C.; Dahren, B.; Troll, V.R. Evidence for high fluid/melt content beneath Krakatau volcano (Indonesia) from local earthquake tomography. J. Volcanol. Geotherm. Res. 2011, 206, 96–105. [Google Scholar] [CrossRef]
- Um, J.; Thurber, C.A. Fast algorithm for two-point seismic ray tracing. Bull. Seismol. Soc. Am. 1987, 77, 972–986. [Google Scholar] [CrossRef]
- Paige, C.C.; Saunders, M.A. LSQR: An Algorithm for Sparse Linear Equations and Sparse Least Squares. ACM Trans. Math. Softw. 1982, 8, 43–71. [Google Scholar] [CrossRef]
- Nolet, G. Seismic wave propagation and seismic tomography. In Seismic Tomography; Springer: Dordrecht, The Netherlands, 1987; pp. 1–23. [Google Scholar]
- Julian, B.R.; Foulger, G.R. Time-dependent seismic tomography. Geophys. J. Int. 2010, 182, 1327–1338. [Google Scholar] [CrossRef]
- Humphreys, E.; Clayton, R.W. Adaptation of back projection tomography to seismic travel time problems. J. Geophys. Res. 1988, 93, 1073–1085. [Google Scholar] [CrossRef]
- Koulakov, I.; Boychenko, E.; Smirnov, S.Z. Magma Chambers and Meteoric Fluid Flows Beneath the Atka Volcanic Complex (Aleutian Islands) Inferred from Local Earthquake Tomography. Geosciences 2020, 10, 214. [Google Scholar] [CrossRef]
- Kasatkina, E.; Koulakov, I.; West, M.; Izbekov, P. Seismic structure changes beneath Redoubt Volcano during the 2009 eruption inferred from local earthquake tomography. J. Geophys. Res. Solid Earth 2014, 119, 4938–4954. [Google Scholar] [CrossRef]
- Hooft, E.; Heath, B.A.; Toomey, D.R.; Paulatto, M.; Papazachos, C.B.; Nomikou, P.; Morgan, J.V.; Warner, M.R. Seismic imaging of Santorini: Subsurface constraints on caldera collapse and present-day magma recharge. Earth Planet. Sci. Lett. 2019, 514, 48–61. [Google Scholar] [CrossRef]
- Heath, B.A.; Hooft, E.E.E.; Toomey, D.R.; Paulatto, M.; Papazachos, C.B.; Nomikou, P.; Morgan, J.V. Relationship between active faulting/fracturing and magmatism around Santorini: Seismic anisotropy from an active source tomography experiment. J. Geophys. Res. Solid Earth 2021, 126, e2021JB021898. [Google Scholar] [CrossRef]
- Drymoni, K.; Browning, J.; Gudmundsson, A. Spatial and temporal volcanotectonic evolution of Santorini volcano, Greece. Bull. Volcanol. 2022, 84, 60. [Google Scholar] [CrossRef]
- McVey, B.; Hooft, E.; Heath, B.; Toomey, D.; Paulatto, M.; Morgan, J. Magma accumulation beneath Santorini volcano, Greece, from P-wave tomography. Geology 2020, 48, 231–235. [Google Scholar] [CrossRef]
- Chrapkiewicz, K.; Paulatto, M.; Heath, B.; Hooft, E.; Nomikou, P.; Papazachos, C.B.; Schmid, F.; Toomey, D.R.; Warner, M.R.; Morgan, J.V. Magma Chamber Detected Beneath an Arc Volcano With Full-Waveform Inversion of Active-Source Seismic Data, Magma chamber detected beneath an arc volcano with full-waveform inversion of active-source seismic data. Geochem. Geophys. Geosystems 2022, 23, e2022GC010475. [Google Scholar] [CrossRef]
- Schmid, F.; Petersen, G.; Hooft, E.; Paulatto, M.; Chrapkiewicz, K.; Hensch, M.; Dahm, T. Heralds of future volcanism: Swarms of microseismicity beneath the submarine Kolumbo volcano indicate opening of near-vertical fractures exploited by ascending melts. Geochem. Geophys. Geosystems 2022, 23, e2022GC010420. [Google Scholar] [CrossRef]
- Tong, P.; Yang, D.; Li, D.; Liu, Q. Time-evolving seismic tomography: The method and its application to the 1989 Loma Prieta and 2014 South Napa earthquake area, California. Geophys. Res. Lett. 2017, 44, 3165–3175. [Google Scholar] [CrossRef]
- Ranjan, P.; Konstantinou, K.I. Local earthquake tomography of the Aegean crust: Implications for active deformation, large earthquakes, and arc volcanism. Tectonophysics 2024, 880, 230331. [Google Scholar] [CrossRef]
- D’Auria, L.; Koulakov, I.; Prudencio, J.; Cabrera-Pérez, I.; Ibáñez, J.M.; Barrancos, J.; García-Hernández, R.; Martínez van Dorth, D.; Padilla, G.D.; Przeor, M.; et al. Rapid magma ascent beneath La Palma revealed by seismic tomography. Sci Rep 2022, 12, 17654. [Google Scholar] [CrossRef]
- Kuznetsov, P.Y.; Koulakov, I.Y. The three-dimensional structure beneath the Popocatépetl volcano (Mexico) based on local earthquake seismic tomography. J. Volcanol. Geotherm. Res. 2014, 276, 10–21. [Google Scholar] [CrossRef]
- Bernard, A.; Battani, A.; Rizzo, A.L.; Balci, U.; Györe, D.; D’Alessandro, W.; Callot, J.-P.; Kyriakopoulos, K.; Pujol, M. Temporal monitoring of fumarole composition at Santorini volcano (Greece) highlights a quiescent state after the 2011–2012 unrest. Front. Earth Sci. 2024, 12, 1366213. [Google Scholar] [CrossRef]
- Dotsika, E.; Poutoukis, D.; Michelot, J.L.; Raco, B. Natural tracers for identifying the origin of the thermal fluids emerging along the Aegean Volcanic arc (Greece): Evidence of Arc-Type Magmatic Water (ATMW) participation. J. Volcanol. Geotherm. Res. 2009, 179, 19–32. [Google Scholar] [CrossRef]
- Boitnott, G.N.; Kirkpatrick, A. Interpretation of field seismic tomography at The Geysers geothermal field, California. In Proceedings of the 22nd Workshop on Geothermal Reservoir Engineering, Stanford, CA, USA, 27–29 January 1997. [Google Scholar]
- De Natale, G.; Troise, C.; Trigila, R.; Dolfi, D.; Chiarabba, C. Seismicity and 3-D substructure at Somma–Vesuvius volcano: Evidence for magma quenching. Earth Planet. Sci. Lett. 2004, 221, 181–196. [Google Scholar] [CrossRef]
- Rizzo, A.L.; Caracausi, A.; Chavagnac, V.; Nomikou, P.; Polymenakou, P.N.; Mandalakis, M.; Kotoulas, G.; Magoulas, A.; Castillo, A.; Lampridou, D.; et al. Geochemistry of CO2-Rich Gases Venting From Submarine Volcanism: The Case of Kolumbo (Hellenic Volcanic Arc, Greece). Front. Earth Sci. 2019, 7, 60. [Google Scholar] [CrossRef]
- Karagianni, E.E.; Papazachos, C.B.; Panagiotopoulos, D.G.; Suhadolc, P.; Vuan, A.; Panza, G.F. Shear velocity structure in the Aegean area obtained by inversion of Rayleigh waves. Geophys. J. Int. 2005, 160, 127–143. [Google Scholar] [CrossRef]
- Klaver, M.; Carey, S.; Nomikou, P.; Smet, I.; Godelitsas, A.; Vroon, P. A distinct source and differentiation history for Kolumbo submarine volcano, Santorini volcanic field, Aegean arc. Geochem. Geophys. Geosystems 2016, 17, 3254–3273. [Google Scholar] [CrossRef]
- Preine, J.; Karstens, J.; Hübscher, C.; Crutchley, G.J.; Druitt, T.H.; Schmid, F.; Nomikou, P. The Hidden Giant: How a rift pulse triggered a cascade of sector collapses and voluminous secondary mass-transport events in the early evolution of Santorini. Basin Res. 2022, 34, 1465–1485. [Google Scholar] [CrossRef]
- Paulatto, M.; Hooft, E.E.E.; Chrapkiewicz, K.; Heath, B.; Toomey, D.R.; Morgan, J.V. Advances in seismic imaging of magma and crystal mush. Front. Earth Sci. 2022, 10, 970131. [Google Scholar] [CrossRef]
- Hellenic Mediterranean University Research Center (Former Technological Educational Institute of Crete). Seismological Network of Crete; 10.7914/SN/HC; International Federation of Digital Seismograph Networks: Crete, Greece, 2006. [Google Scholar]
- National Observatory of Athens, Institute of Geodynamics, Athens. National Observatory of Athens Seismic Network [Data set]. International Federation of Digital Seismograph Networks. 1975. Available online: https://www.fdsn.org/networks/detail/HL/ (accessed on 30 June 2024).
- University of Athens. Hellenic Seismological Network, University of Athens, Seismological Laboratory [Data Set]. International Federation of Digital Seismograph Networks. 2008. Available online: https://www.fdsn.org/networks/detail/HA/ (accessed on 30 June 2024).
- Aristotle University of Thessaloniki. Aristotle University of Thessaloniki Seismological Network [Data Set]. International Federation of Digital Seismograph Networks. 1981. Available online: https://www.fdsn.org/networks/detail/HT/ (accessed on 30 June 2024).
- Institute of Engineering Seismology Earthquake Engineering (ITSAK), Greece. 1981. Available online: https://www.fdsn.org/networks/detail/HI/ (accessed on 30 June 2024).
- University of Patras, Seismological Laboratory, HP. 2000. Available online: https://www.fdsn.org/networks/detail/HP/ (accessed on 30 June 2024).
Disclaimer/Publisher’s Note: The statements, opinions and data contained in all publications are solely those of the individual author(s) and contributor(s) and not of MDPI and/or the editor(s). MDPI and/or the editor(s) disclaim responsibility for any injury to people or property resulting from any ideas, methods, instructions or products referred to in the content. |
© 2024 by the authors. Licensee MDPI, Basel, Switzerland. This article is an open access article distributed under the terms and conditions of the Creative Commons Attribution (CC BY) license (https://creativecommons.org/licenses/by/4.0/).