Article

Possible Indication of the Impact of the Storegga Slide Tsunami on the German North Sea Coast around 8150 cal BP

1
Institute of Geography, Johannes Gutenberg-Universität, Johann-Joachim-Becher-Weg 21, 55099 Mainz, Germany
2
German Federal Institute of Hydrology, Am Mainzer Tor 1, 56068 Koblenz, Germany
3
Lower Saxony Institute for Historical Coastal Research, Viktoriastr. 26/28, 26382 Wilhelmshaven, Germany
4
Department for Applied Morphodynamics, Deltares, Boussinesqweg 1, 2629 HV Delft, The Netherlands
5
Leibniz Institute for Applied Geophysics (LIAG), Stilleweg 2, 30655 Hannover, Germany
6
Free and Hanseatic City of Hamburg, Ministry of Environment, Climate, Energy and Agriculture, Geological Survey, Neuenfelder Straße 19, 21109 Hamburg, Germany
7
Institute of Geosciences, Johannes Gutenberg-Universität Mainz, Johann-Joachim-Becher-Weg 21, 55128 Mainz, Germany
*
Author to whom correspondence should be addressed.
Geosciences 2024, 14(10), 262; https://doi.org/10.3390/geosciences14100262
Submission received: 22 August 2024 / Revised: 30 September 2024 / Accepted: 2 October 2024 / Published: 3 October 2024

Abstract

:
The Storegga slide tsunami (SST) at ca. 8100 ± 100–250 cal BP is known to be the largest tsunami that affected the North Sea during the entire Holocene. Geological traces of tsunami landfall were discovered along the coasts of Norway, Scotland, England, Denmark, the Faroes and Shetland Islands. So far, the German North Sea coast has been considered as being well protected due to the wide continental shelf and predominant shallow water depths, both assumed to dissipate tsunami wave energy significantly, thus hindering SST propagation dynamics. The objective of our research was to clarify if the SST reached the German Bight and if corresponding sediment markers can be found. Our research was based on the in-depth investigation of a 5 m long section of the research core Garding-2 from Eiderstedt Peninsula near Garding in North Frisia known from a previous study. For this, we newly recovered sediment core Garding-2A at exactly the same coring location as core Garding-2. Additionally, high-resolution Direct Push sensing data were collected to gain undisturbed stratigraphic information. Multi-proxy analyses of sediment material (grain size, geochemical, geochronological and microfaunal data) were carried out to reconstruct palaeoenvironmental and palaeogeographical conditions. We identified a high-energy event layer with sedimentological (e.g., erosional unconformity, rip-up clasts, fining-upward), microfaunal (e.g., strongly mixed foraminiferal assemblage) and other features typical of tsunami influence and identical in age with the SST, dated to ca. 8.15 ka cal BP. The event layer was deposited at or maximum ca. 1–1.5 m below the local contemporary relative sea level and several tens of kilometers inland from the coastline within the palaeo-Eider estuarine system beyond the reach of storm surges. Tsunami facies and geochronological data correspond well with SST signatures identified on the nearby island of Rømø. SST candidate deposits identified at Garding represent the southernmost indications of this event in the southeastern North Sea. They give evidence, for the first time, of high-energy tsunami landfall along the German North Sea coast and tsunami impact related to the Storegga slide. SST deposits seem to have been subsequently reworked and redeposited over centuries until the site was affected by the Holocene marine transgression around 7 ka cal BP (7.3–6.5 ka cal BP). Moreover, the transgression initiated energetically and ecologically stable shallow marine conditions within an Eider-related tidal channel, lasting several millennia. It is suggested that the SST was not essentially weakened across the shallow continental shelf of the North Sea, but rather caused tsunami run-up of several meters (Rømø Island) or largely intruded estuarine systems tens of kilometers inland (North Frisia, this study). We, therefore, assume that the southern North Sea coast was generally affected by the SST but sedimentary signals have not yet been identified or have been misinterpreted. Our findings suggest that the German North Sea coast is not protected from tsunami events, as assumed so far, but that tsunamis are also a phenomenon in this region.

1. Introduction

For many decades, the Storegga slide tsunami (SST) has been known to be the largest tsunami that had affected the northeastern Atlantic Ocean and the North Sea during the Holocene. The Storegga slide occurred at ca. 8100 ± 100–250 cal BP [1,2,3] and is one of at least five huge landslides that took place along the Storegga escarpment off the Norwegian coast. Younger, minor slides could be dated to ca. 5700 cal BP and 2200–2800 cal BP [1].
The Storegga slide was most probably caused by the decomposition of methane-gas-hydrates resulting in a destabilization of the Norwegian continental slope [4] (Figure 1). A total sediment volume of ca. 2400–3200 km3 with an average thickness of 114 m was displaced down the continental slope over a distance of more than 800 km to water depths of up to 3.5 km, affecting a total area of ca. 95,000 km2 [1,5,6].
The slide triggered tsunami waves with initial wave heights of more than 20 m spreading across the entire Norwegian Sea, the northeastern Atlantic Ocean and also entering the North Sea [7,8,9,10]. At the North Sea coasts, the tsunami caused tremendous inundation. Corresponding traces were discovered along the coasts of Norway, Scotland, England, Denmark, the Faroes and Shetland Islands. For the southern North Sea coast, it was suggested that inundation was weak or even negligible associated with a significant drop in water depth from around 500 m below sea level (b.s.l.) off Bergen (Norway) to ~70 m b.s.l. at ca. 57° N and to few meters b.s.l. in the 450 km distant Wadden Sea, potentially resulting in strong tsunami wave dissipation. However, recent studies have found that the SST propagated deep into the southern North Sea and left corresponding sedimentological evidence both offshore east England and in the immediate surroundings of the Dogger Bank [11,12] as well as at the Danish west coast [13]. Here, tsunami run-up was found to have been minimum 1.5–5.5 m above the contemporary sea level.
So far, the German North Sea coast has been considered as being safe from tsunami wave impact because of the wide continental shelf and predominant shallow water depths, both assumed to significantly dissipate tsunami wave energy and impede vast propagation [14,15]. Comparable scenarios were also calculated for the coastal zone of the Netherlands [16]. In contrast to tsunamis, extreme storm surges are well known to have repeatedly hit and strongly affected the German North Sea coasts throughout centuries. Ref. [17] lists a selection of more than 20 devastating storm surge events since the beginning of the 13th century AD, among them the First Marcellus Flood in AD 1219 and the Grote Mandrenke in AD 1362, causing presumably more than 50,000 and 100,000 casualties, respectively. Surging water masses inundated areas inland by several kilometers in the moment in which dikes and other coastal protection facilities had failed. Aside from the storm surge risk, more recent studies have revealed evidence of meteorologically induced tsunamis (‘Seebär’ in German) that hit the southern North Sea coast, such as in 2017 in the Netherlands [18], in 2011 in the English Channel [19] and in 1858 in Germany and Denmark, the latter resulting in local run-ups of up to 6 m above sea level (a.s.l.) [20,21]. In addition, previous sedimentological and stratigraphic studies along the German North Sea coast have found isochronous transgressive surfaces that seem to represent extreme inundation events [22]. Considering all these aspects, one should realistically expect the Storegga slide tsunami having left remarkable traces in the German coastal sequences of that time.
Figure 1. (a) Location of the Storegga submarine slide off western Norway and the North Sea basin with sites where geological evidence of tsunami landfall associated with the Storegga event is reported by different groups of authors (white and black dots; modified after [11,12]). The black dot directly north of the framed study area marks Storegga event deposits at Rømø Island reported by [13]. The asterisk marks vibracoring site Garding-2A. (b) Topographical map of the wider area around Eiderstedt Peninsula in North Frisia, Germany. Maps based on EMODnet Bathymetry World Base Layer data and DTM derived from SRTM data. See Section 4 for further information.
Geosciences 14 00262 g001
The objective of our research was thus to elucidate (i) whether or not the Storegga slide tsunami reached the German Bight leaving corresponding sediment markers in adequate coastal sedimentary archives, (ii) how tsunami dynamics may potentially be reconstructed in terms of inland propagation and run-up and (iii) what might have been the potential consequences of a tsunami landfall on the German coast.

2. Current State of Research

2.1. Identification of SST Deposits

The first sedimentary traces ascribed to the SST were reported from eastern Scotland where they intersect Holocene coastal deposits [5]. The SST seems to have directly affected mankind, namely, a Mesolithic site in Inverness, NW Scotland [23], where corresponding sediments cover archaeological remains (see also [24]). Stunning SST deposits were later presented by [25] from shallow marine basins and coastal lakes in western Norway, together with a precise description of the tsunami deposit: a 20–100 cm thick fining upward layer or massive sand with locally marine fossils overlying an erosional unconformity. The SST sand layer thins and fines upward and landward. Towards the top, it is made out of organic detritus with rip-up clasts. Lower lake basins, partly lying still below the contemporary sea level, were hit by several individual waves of the tsunami, whereas high, elevated basins were only hit by one SST wave. The SST run-up was found highest in areas proximal to the Storegga slide scar on the Norwegian continental slope, namely, between 3 and 11 m above the contemporary sea level (here and in the following always relative to the contemporary sea level at the time of the SST; [26]). Major progress in recognizing high-energy tsunami sediments and identifying them as SST deposits was made in Norway by discriminating them from the Holocene marine transgression facies associated to a gradually rising relative sea level (RSL): the latter shows differences in the overall grain size composition, has much less erosional features towards the underlying sediments and is considerably younger in age [27,28]. Re-investigating three isolated, emerged lake basins in northern Norway revealed a mixed SST backwash facies with marine remnants and terrestrial rip-up clasts with a green moss-based age of 8175–8120 cal BP that could be clearly discerned from the sea level-driven transgression facies culminating at ca. 7400 cal BP [29]. Identifying SST deposits is highly relevant because it has been, in some cases, misinterpreted as coastal transgressive facies and used to reconstruct long-term RSL changes [27].
Moreover, the sheer height above sea level is another important criterion: On the Shetland Islands, an SST-associated chaotic deposit of sand layers, rip-up clasts, re-deposited lake mud and marine fossils intercalated in peat was found around 20–25 m higher than the sea level at that time [9,28]. In a review of previously reported evidence for the SST in the UK, it was found that the tsunami involved an area much greater than known before, namely, the 600 km long coastal section from Shetland to NE England. Associated deposits show strong consistencies, a sheet of fine or fine to medium sand with coarser material at the base, fining-upward sequences, and a general fining-landward trend [30]. Run-up heights were found to be lower along the open coast compared to inlets and the SST was recognized as a major marker horizon in Holocene coastal sequences already at that time [30].

2.2. Preservation of SST Deposits

The preservation of SST deposits is dependent on the existence of adequate sediment traps, and inundation dynamics are strongly controlled by bathymetric and topographic conditions [31]. Ref. [32], for example, identified SST deposits, up to 3 m thick, embedded in uplifted lake deposits at the head of the 106 km long Nordfjord in western Norway, indicating a minimum run-up of 1–7.5 m above the contemporary sea level. Within a small area, different kinds of tsunami facies can be found, mainly controlled by the local relief and sediment sources, whereas the mineral signature may be similar over even differ over longer distances as shown by [33] for different locations on the Shetland Islands. The first evidence of SST deposits in Sutherland, northern Scotland, was presented by [34] based on characteristic sedimentary (e.g., erosive basal contact, rip-up clasts, fining-upward sequences) and geomorphological features (laterally continuous sand sheets traceable inland) and on diagnostic geochemical signals such as increased Ti and Zr concentrations which may indicate the presence of heavy minerals associated with high-energy sedimentation, also known from tsunami inundation [35].

2.3. Effects of SST on the Mesolithic Population

The effects of the Storegga event on the Mesolithic population, especially on Doggerland, have been widely discussed by several authors [2,11,12,23,36,37]. It is yet to be determined whether the tsunami or the Holocene sea level rise was the primary cause of the flooding of Doggerland. Ref. [38] suggests that drawing socio-ecological conclusions from geoscientific studies is problematic due to unanswered questions of scale and representativeness. However, according to most authors, the submergence of Doggerland was rather the consequence of the rising mid-Holocene sea level.

2.4. Numerical Simulation

Another milestone in the investigation of the SST was the numerical simulation of the slide and its effects. Doing so, ref. [9] found a good agreement of calculated surface wave elevations with field data. Ref. [10] calculated models considering changes in bathymetry since the SST event, thus improving the agreement with run-up heights deduced from field observations. Moreover, these authors suggest considerable wave heights and inundation for the southern and southeastern North Sea, and [39] even asserted SST effects for the German Bight. General deviations between simulated wave heights and geological tsunami run-up estimates found for the Shetland Isles can be explained, among others, by deficits of the applied numerical models regarding diffraction, refraction, reflection and wave interference effects within the tsunami wave trains [40]. Ref. [41] reconstructed a tripartite SST wave train for Scotland and found that modelling attempts need to consider palaeotopographical and palaeo-near-shore bathymetrical data when compared to geological evidence of palaeotsunami impact (see also [42,43]).

2.5. Geographical Disctribution of SST Deposits

So far, the southeasternmost SST event layer is reported by [13] from the Danish coast at the barrier island Rømø. Here, SST sediments were deposited in a freshwater palaeolake 16 m below the present mean sea level. RSL curves were used to estimate tsunami sediment run-up between 1.5 m and 5.5 m above the contemporaneous sea level. The SST deposits—a 0.8 m thick sand bed—were found on top of an erosion surface and contain coarse sand, pebbles, rip-up clasts of algal gyttja and peat at the base; the sand is generally poorly sorted and organic debris increases towards the top. Consequently, the SST facies are essentially different from the Holocene transgression facies (missing rip-up clasts and only weakly developed basal erosion) and from extraordinary storm deposits (well sorted, normally graded, laminated sheet sands, see also [44]). Moreover, the Holocene transgression occurred several hundreds of years after the SST event [13].
Ref. [13] added new information about the geomorphological impact of a palaeotsunami, showing that the tsunami energy had not already dissipated before the tsunami reached the coast as was thought before. In fact, it seems that the SST propagated almost 1000 km across the shallow continental North Sea shelf, affecting the entire southeastern North Sea coast and leaving distinct sedimentary traces.
However, these findings led to the paper at hand. Ref. ([13], p. 1050) remind us that “concrete evidence besides the Rømø example is still lacking”, which motivated us to search for corresponding SST deposits along the German North Sea coast. We identified an adequate sedimentary archive potentially hosting SST signatures in North Frisia in the eastern part of Eiderstedt Peninsula (Schleswig-Holstein) associated with the Garding-2 core [45,46] as described in the following section.

3. Eiderstedt Peninsula and the Garding Site (German Bight)
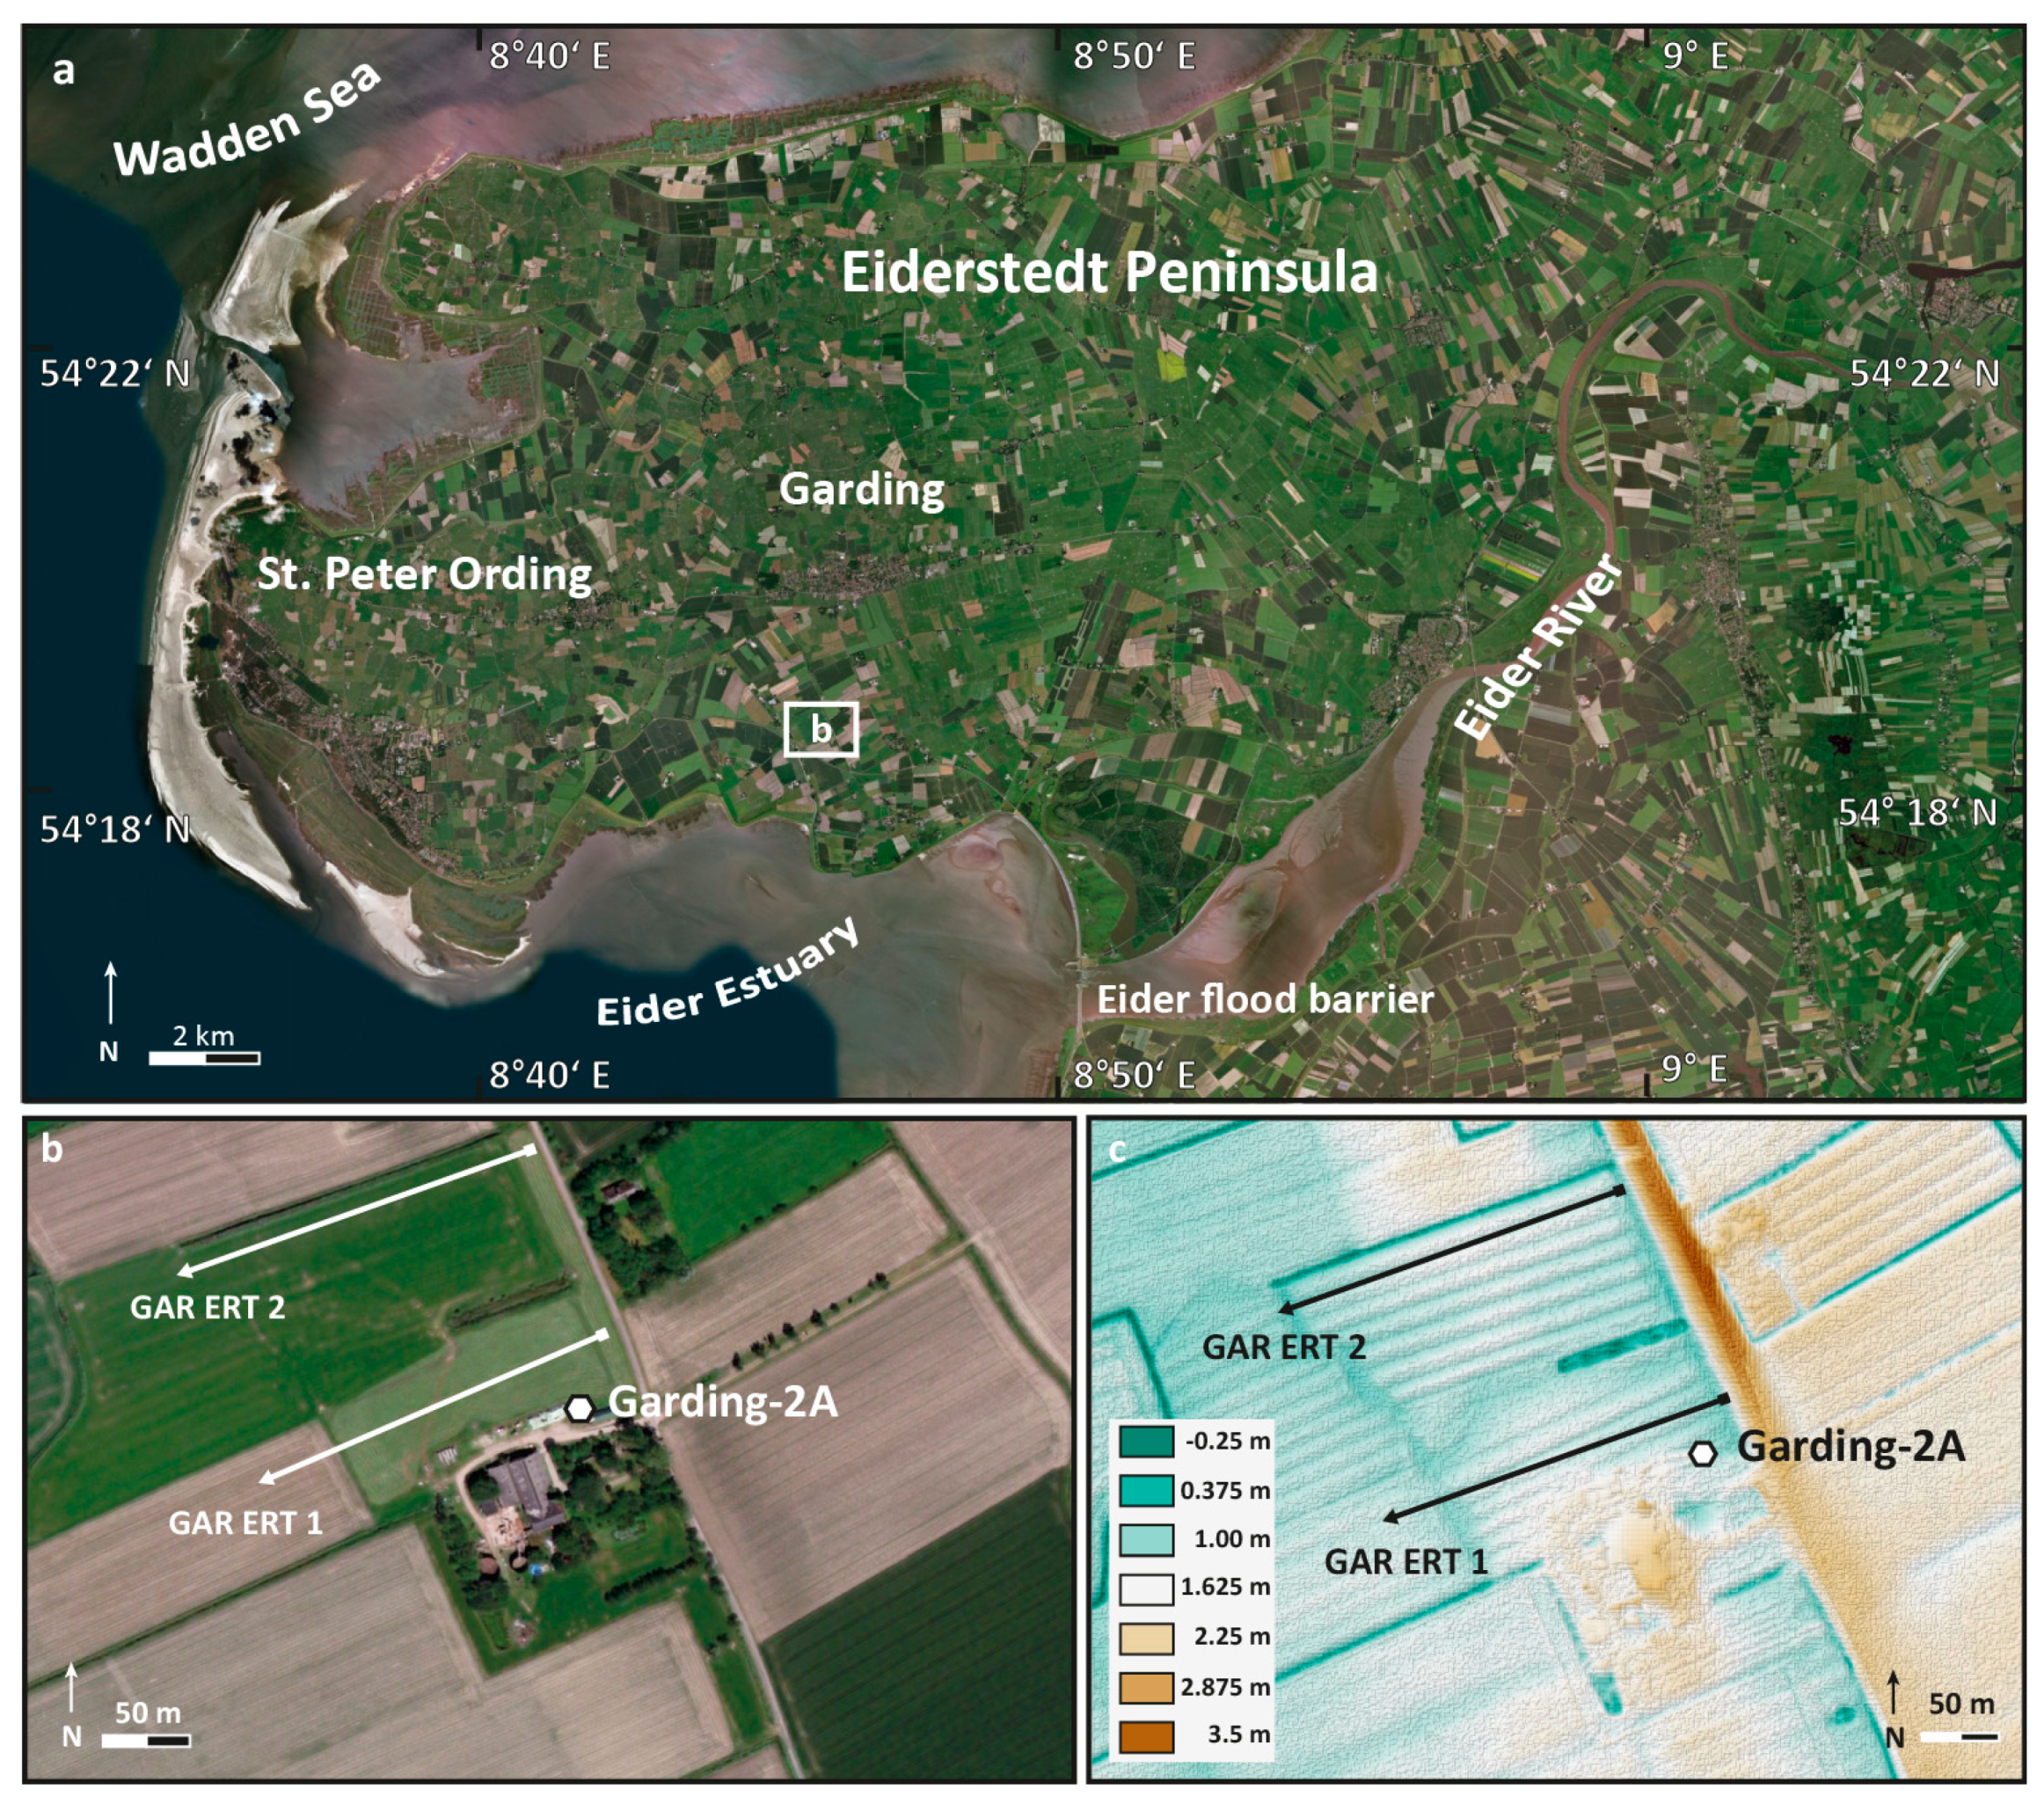
The study area is located on Eiderstedt Peninsula ca. 3 km south of the village of Garding and 10.5 km to the west of the city of Tönning, around 2.5 km distant from the present Eider estuarine system (Figure 1, Figure 2 and Figure 3). This coastal area is part of the German Bight in the southeastern North Sea basin.
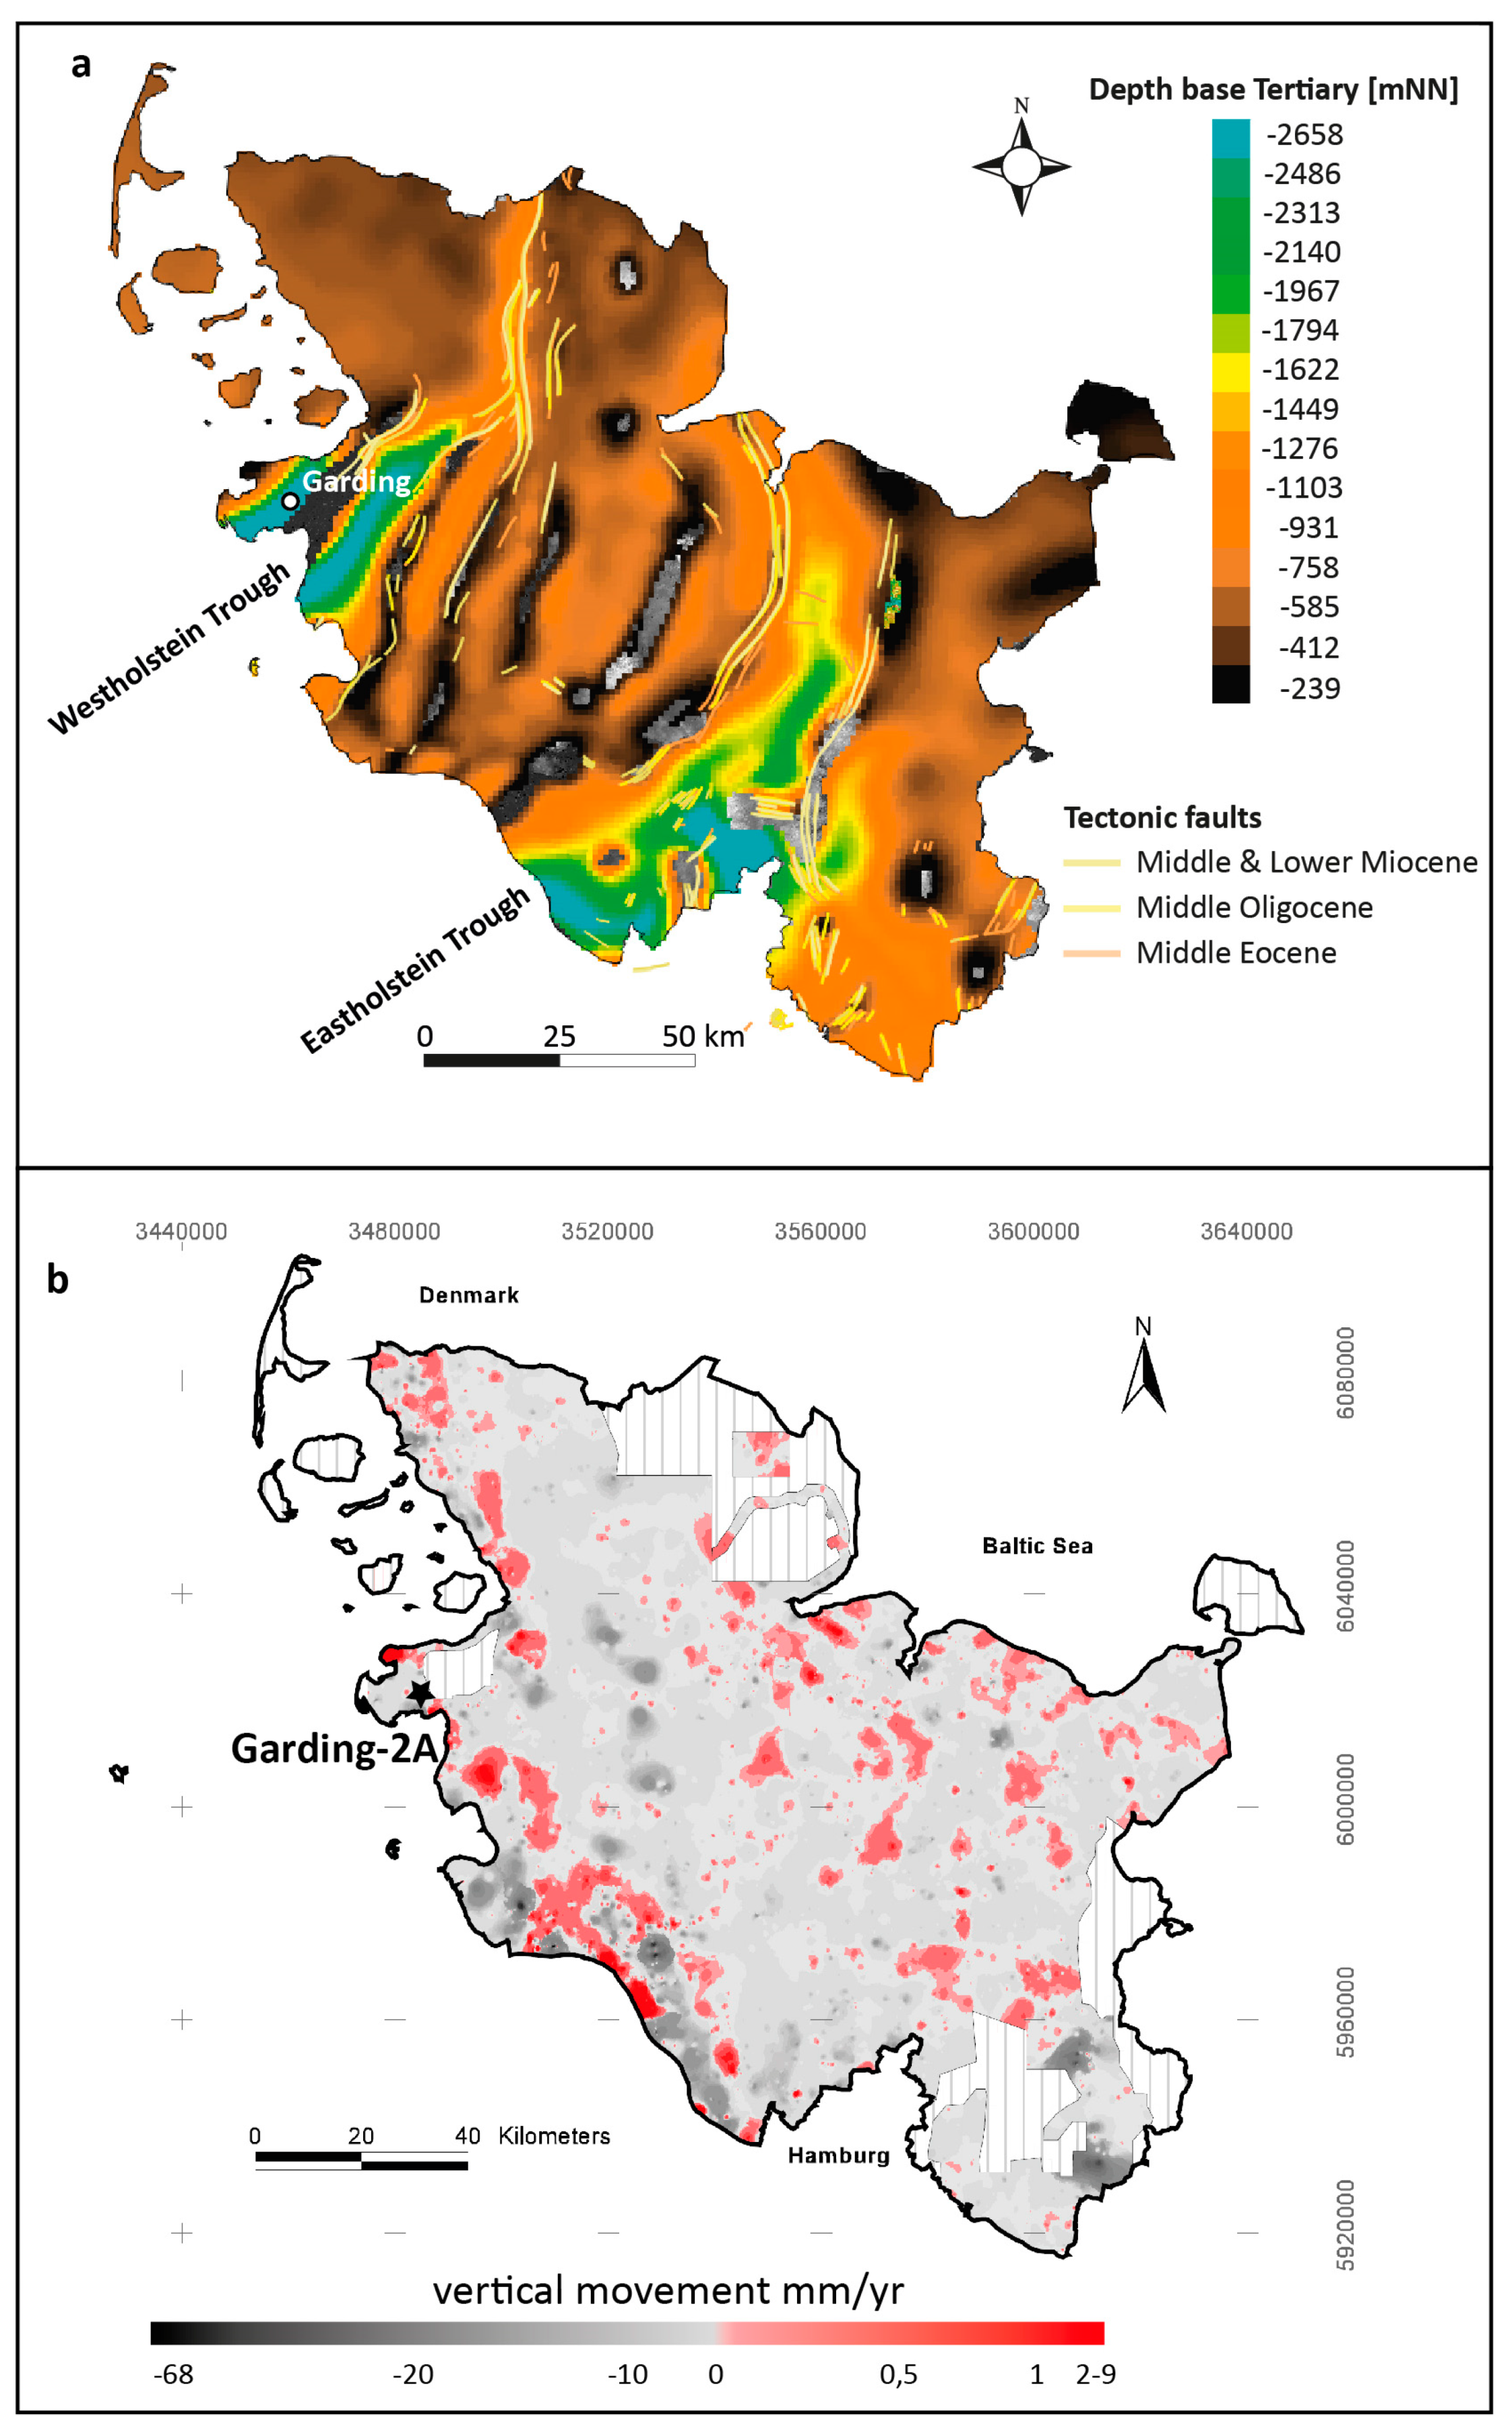
The study site lies on the eastern flank of the Garding trough which is the foredeep of the ascending Oldenswort salt dome guaranteeing permanent sedimentation since at least Cenozoic times (Figure 2a). The latter has caused permanent long-term subsidence in the surroundings, enabling permanent accommodation space to be filled with sediments at least since the Pleistocene [45,46,47]. During the Holocene, the Eiderstedt Peninsula was originally composed of two main islands, namely, Everschop and Utholm, that were separated by a tidal channel belonging to the Süderhever system [48,49,50]. In AD 1213, both islands were connected by a dike, resulting in the present shape of the peninsula [51,52]. According to [53], two E-W and SE-NW trending barrier systems located seawards at the western fringe of Eiderstedt Peninsula have protected the hinterland from marine influence since 2500 BP.
Most detailed information on the local geological development have been retrieved from the Garding-2 research core that was recovered near the village of Garding [45,46]. The entire core is 240 m long and covers late Pliocene to Holocene deposits [54]. Based on the upper 20 m section of the core, ref. [55] provided valuable, so far unknown details on local palaeoenvironmental changes during the Quaternary RSL history based on radiocarbon and OSL dating.
According to [55], the Garding site documents the Holocene development from an open estuarine environment of the former Eider River overlain by the Holocene transgression including conspicuous erosional as well as sedimentary features. The Holocene succession of the Garding-2 core was found by [55] to consist of well sorted light greyish medium- to coarse-grained sand accumulated in an estuarine sedimentary environment (26–19.85 m b.s., unit 6), followed by fine sand rich in shell fragments (19.85–19.30 m b.s., unit 5) indicating high-energy conditions and interpreted as shoreface deposits [55]. On top, grey to brown clayey silt was encountered (19.30–16 m b.s., unit 4) and suggested to represent marine sediments accumulated under rapidly rising sea level.
Ref. [56] carried out detailed pollen analysis using samples from the uppermost 20 m of the Garding-2 core. They found an overall mixed pollen spectrum with a first principal cluster showing comparatively constant values of Quercus, Ulmus, Tilia, Fraxinus, Alnus, Betula, and Corylus, then increased amounts of non-arboreal pollen (NAP), especially terrestrial herbs, followed by the onset of Fagus and Carpinus pollen. The basal peat layer, typical of many sedimentary sequences along the German coast, is missing at the Garding site [54,56].
Figure 2. (a) Depth topography of the base of Palaeogene and Neogene sediments in Schleswig-Holstein including Cenozoic tectonic faults (adapted from [57]). Coring site Garding-2A is situated where Cenozoic deposits are thickest. (b) Recent vertical crust movements based on the GIS-based analysis of repeated precise leveling data in Schleswig-Holstein from 1923 to 1985 [58].
Geosciences 14 00262 g002
Figure 3. (a) Aerial photograph of Eiderstedt Peninsula with inlay maps b and c showing details of the study site south of the village of Garding. (b) Location of vibracoring site Garding-2A and ERT transects GAR ERT 1 and 2. Direct push (DP) measurements were conducted at site Garding-2A. (c) Lidar map of the study area of the coring location. Site Garding-2A is located in the area of the former tidal inlet (displayed by green colours) that separated, until AD 1213, the two main islands of Eiderstedt, namely, Everschop and Utholm. An old dike to the east of the vibracoring site is displayed in dark brown colours. Maps in (a,b) are based on GoogleEarth aerial images. The DTM in (c) is derived from SRTM data.
Geosciences 14 00262 g003

4. Materials and Methods

We carried out geophysical prospection at the original site where research core Garding-2 was drilled [45,55] using electrical conductivity tomography (ERT) and in situ Direct Push (DP) sensing, followed by vibracoring of core Garding-2A at exactly the same location where core Garding-2 was recovered. Sediments of core Garding-2A were used for sedimentological, geochemical as well as microfaunal analyses.

4.1. ERT Studies

ERT studies along two transects GAR ERT1 and ERT2 (Figure 3 and Figure 4) were applied by means of a Syscal R1 plus Switch 48 multi-electrode device (Iris instrument) with 5 m electrode spacing in order to obtain general information on subsurface structures and stratigraphic conditions (Figure 1). We used a Wenner–Schlumberger electrode array and the RES2DINV inversion software, version 3.55, to calculate ERT depth sections. Sediment core Garding-2A was drilled at exactly the same coring location of research core Garding-2 [45,55]. The site is located ca. 20 m to the south of ERT transect GAR ERT 1 at transect meter 203, i.e., at the eastern end of the transect (ground surface 1.27 m a.s.l.).

4.2. DP Sensing

Direct Push (DP) measurements were carried out at the same location as vibracoring site Garding-2A (see below) with a Geoprobe 540 MT system mounted on a Nordmeyer drill rig type RS 0/2.3 (Figure 3). For in situ site investigation, we conducted DP measurements of the electrical conductivity (DP-EC) together with the application of the hydraulic profiling tool (HPT) using a Geoprobe HPT K6050 (1.5 in. System) probe and undertook cone penetration testing (CPT) using a GEOTECH NOVA CPT probe. DP studies are based on the controlled and continuous hydraulically driven penetration of the underground using different kinds of sensors that collect in situ real-time data for the calculation of specific mechanical, geophysical and hydraulic parameters. Using the Direct Image Viewer Software (www.geoprobe.com) and the CPT Pro software (www.geosoft.com), measured parameters are subsequently used for site specification and to establish a high-resolution stratigraphy. During the HPT penetration process, water is injected into the pushhole with a constant flow rate (Q) of ca. 250 mL/min. A screen port allows for the measurement of specific parameters with a vertical resolution of 2 cm [59,60]. For each measurement, Ptotal (raw HPT pressure) is the sum of Patm (atmospheric pressure), Phydro (hydrostatic pressure) and Pinj (injection pressure of the subsurface). Pinj needs to be corrected using dissipation tests because Phydro grows with increasing depth below ground water level. Pinj can then be calculated as Pinj = Ptotal − (Phydro + Patm); finally, Kest. (hydraulic conductivity) is calculated using the parameters Q and Pinj [60,61,62,63]. Four electrodes fixed to the HPT probe and arranged in a line (Geoprobe SC520 soil probe) are additionally used to collect electrical conductivity data based on a Wenner array [64]. In contrast to the HPT technique, which yields highly reliable in situ data on sedimentary changes, EC measurements also reflect chemical and mineralogical characteristics of the penetrated sediments and the pore water [60,63,65].
CPT comprised the measurement of qc (cone resistance), fs (sleeve friction) and u2 (ambient pore pressure) near the cone with a vertical resolution of 2 cm [66,67]. The qc and fs have to be corrected for water effects [68,69]. The normalized friction ratio Fr is then calculated using qt (corrected cone resistance) and ft (corrected sleeve friction) [67]. At the study site, HPT profiling was carried out down to 21 m, whereas CPT sensing stopped at 20 m depth.

4.3. Vibracoring and Sedimentological Analyses

Sediment core Garding-2A was retrieved at exactly the same position as the Garding-2 core (Figure 3; [45,46]). The Garding-2 core was recovered in 2011 from the site of maximum Cenozoic subsidence in Schleswig-Holstein, i.e., in the Garding Trough (within the Westholstein Trough), representing the rim depression west of the Oldenswort salt diapir (Figure 2). Research was conducted by a joint team from the Leibniz Institute for Applied Geophysics (LIAG, Hannover), the Geological Department at the Schleswig-Holstein State Office for Agriculture, for the Environment and Rural Areas (Flintbek), the Institute of Ecology, Leuphana University of Lüneburg, and the Institute of Geosciences of the Johannes Gutenberg-Universität Mainz [45,46,47,54,55,56].
Vibracore aGarding-2A was recovered at exactly the same site in September 2017 using an automotive Nordmeyer drill rig (Type RS 0/2.3) and a closed coring system with a core diameter of 60 mm and plastic inliners with a diameter of 50 mm from a maximum coring depth of 20 m b.s. Core Garding-2A was calibrated using compaction-free in situ DP data in order to assess potential compaction and allow the best-fit comparison with the Garding-2 core.
We used a differential GPS (type Topcon HiPer Pro FC-250) with a horizontal and vertical precision of approximately 2 cm to obtain coordinates for ERT transects as well as DP and coring sites. Sediment-filled plastic inliners were opened in the laboratory, photo-documented and analyzed using a multi-proxy approach. We conducted grain size measurements using the Köhn sieving and pipette approach [70,71] resulting in mass percentages for the fractions clay (<2 µm), fine silt (2–6.3 µm), medium silt (6.3–20 µm), coarse silt (20–63 µm), very fine sand (63–125 µm), fine sand (125–200 µm), medium sand (200–630 µm) and coarse sand (630–2000 µm). Altogether, we analyzed 106 grain size samples and obtained a mean reproduction error of <2% with regard to original sample weights; in this paper, we present grain size data of 24 samples retrieved from core Garding-2A between 15.00 m and 20.00 m b.s. Additionally, organic contents of sediment samples of core Garding-2A were measured by means of the loss on ignition (LOI) approach using a muffle furnace at 550 °C ([72], see also [73,74]). Concentrations of Ca were determined by means of X-ray fluorescence (XRF) measurements using a handheld Niton XL3t 900S GOLDD instrument (with calibration mode SOIL; Thermo Fisher Scientific, Waltham, MA, USA) with an average measurement interval of 2 cm.

4.4. Microfaunal Analysis

We accomplished microfossil analyses with focus on foraminifera in order to determine the sedimentary environment, palaeoecological conditions and potential interferences of the palaeoenvironment by high-energy wave impact (e.g., [75,76,77,78]). In this paper, we present microfossil data collected from 14 sediment samples from the depth section between 15 and 20 m b.s. We interpreted encountered species with regard to their habitat preferences according to [79,80,81,82]. For sample preparation, a volume of 15 mL for each sample was pre-treated with H2O2 and subsequently sieved into fractions 125–200 µm, 200–400 µm and >400 µm. Each fraction was counted individually. Where needed due to a large number of foraminiferal tests, sediment samples were divided into subsamples of comparable size, one subsample was counted and the total number of specimens of the entire sample was extrapolated accordingly. The determination of foraminifera species and taxa was carried out according to [83,84,85,86]. As for ostracods, only the total number of specimens was determined. Samples were counted using a stereo microscope (type Nikon SMZ 745T). Marker species were identified using [80,84,85,86] and picked and photographed by means of a Nikon Eclipse 50i POL camera mounted on polarizing photo microscope.

4.5. Geochronological Data

Age control for sediment core Garding-2A is given as OSL and radiocarbon data that were originally retrieved for the Garding-2 core [55], which was drilled at exactly the same site. Radiocarbon data from [55] were recalibrated using the marine20 calibration curve [87,88] and recently published local marine reservoir correction data using the Calib 8.2 software [89]. We calculated two different calibrated age scenarios based on the best available local marine reservoir correction data using different ΔR values to assess the marine reservoir effect (MRE). The first scenario (scenarioa, Table 1) is based on ΔR = −160.0 ± 93.0 averaging data points # 73, 74 and 75 in the Calib Marine Reservoir Correction Database from open marine waters of the the German Bight [90]. The second scenario (scenariob, Table 1) uses data points collected from near-coast environments, namely, of 11 local data points # 685, 687, 688 and 689–696 from the nearby Danish coast and another 2 data points # 2136 and 2137 from Wangerooge Island [91,92,93], resulting in an average ΔR = −19 ± 140. The selected Calib Marine Reservoir Correction Database points are based on samples from near-coast fluvio-lagoon-type environments of the nearby Danish coast assumed to be similar to the pre-Storegga conditions near Garding and on samples from Wangerooge Island [91,92,93], a coastal setting comparable to present conditions at Amrum and Sylt not far from the study area of this paper (ΔR = −19 ± 140; Table 1). Recalibrated ages are listed in Table 1. Radiocarbon analyses were originally carried out by the AMS 14C Leibniz-Laboratory for Radiometric Dating and Stable Isotope Research at the Christian-Albrecht-Universität zu Kiel (sample no. KIA 48673–48676, see Table 1), Germany.
Moreover, we used seven OSL ages determined for the Garding-2 core between 15.35 m and 20.65 m b.s. published by [55] as a base to cross-check the recalibrated radiocarbon ages (Table 2). For information on sample treatment and the OSL protocol used, see [55].

4.6. Palaeogeographical Maps

We reconstructed palaeocoastlines for the wider study area mainly based on relative sea level data published by [94] as well as digitally available topographical and bathymetrical data of the present coastal environment. Water levels used for palaeogeographical reconstructions for the southern North Sea are based on the actual bathymetrical dataset that is available worldwide (EMODnet Bathymetry World Base Layer, EBWBL). The bathymetrical resolution for the study area was first displayed for a fictive spectrum between −254 m and 0 m a.s.l. in order to focus on the most interesting part of the underwater topography using the available 256 colour steps. Every single meter is thus displayed with a different colour. Then, the coastline was shifted to the depth levels at −22 m a.s.l., −17 m a.s.l. and −10 m a.s.l. deduced from palaeo sea level data for the time slices 8300 cal BP, 8000 cal BP and 7000 cal BP, respectively [94]. Reconstructions are based on the 2018 EMODnet Bathymetric grid around Europe with an approximate resolution of 115 m. The greenish colours represent the land–sea transition area from tidal flats to high marshes. As discussed based on core and map material in [95,96], this area has to be assumed as much wider than often depicted.
With regard to locally considerable crust movements, ref. [58] published high-resolution rates of subrecent to recent vertical deformation in Schleswig-Holstein due to neotectonics, salt tectonics and post-glacial deformation patterns (Figure 2). In areas adjacent to coring site Garding-2A, subrecent to recent vertical movements may reach up to 1 mm/a; however, for coring site Garding-2A as such, vertical displacements are presented as around nil (e.g., [58]: Figure 4; [97]; see Figure 2b). Although neotectonically driven topographical alterations may represent a considerable factor for relative sea level and palaeogeographical reconstructions, we focused, therefore, on the published palaeo-sea level data within the context of this paper, without correcting for rates of vertical crust changes. The maps, therefore, present only a rough estimation of the coastal geographies for the southeastern coasts of the North Sea. This is also the case because coastline reconstructions are based on the actual bathymetry. Palaeobathymetrical or palaeo-DGM data as used in other studies (e.g., [43]) are not available for the study area and for the time slices given. However, coastline contours and estimated distances from the present coastline are in line with palaeogeographical scenarios published by ([2]: Figure 4), ([11]: Figure 1), ([12]: Figure 2) and ([17]: Figure 7), see also ([24]: Figure 2) for similar time slices. For further details on topographic changes due to neotectonic and salt dynamics see [98,99].

5. Results

5.1. Geophysical Prospection Using Electrical Resistivity Tomography (ERT)

ERT depth sections with electrode spacing of 5 m were measured along ERT transects GAR ERT 1 and GAR ERT 2 both trending in the WSW-ENE direction (Figure 3 and Figure 4). The two depth sections show a quite homogeneous and similar structure with an upper zone of higher resistivity (>5 Ωm to >25 Ωm) and a lower zone of lower resistivity (<5 Ωm). The boundary between the two zones reflects a comparatively strong resistivity gradient that is slightly inclined from −7.5 m a.s.l. in the WSW to −10 m a.s.l. in the ENE and from −5 m a.s.l. in the WSW to −7.5 m a.s.l. for GAR ERT 1 and GAR ERT 2, respectively, resulting in an SSE-ward dip of the boundary surface. Within the upper zone and the lower zone, there are secondary areas with slightly higher and lower resistivity values, respectively. Considering that the groundwater level is around 0 m a.s.l. so that measurements were carried out under full water saturation, differences in resistivity values predominantly reflect differences in grain size no matter if the groundwater is dominated by freshwater or uniformly influenced by saltwater. In general, resistivity values increase with increasing grain size (e.g., [60,100]. The boundary surface identified by ERT measurements in this study thus reflects the transition between finer-grained sediments at the base towards coarser-grained sediments in the upper section.

5.2. Description of Core Garding-2A

Sediment core Garding-2A was newly recovered at exactly the same location as core Garding-2 (Figure 1, Figure 2 and Figure 3; [45,55]). The stratigraphy of core Garding-2A is identical with the general structure described by [55] (see Figure 5). Additonally, DP sensing was carried out to collect in situ stratigraphic information free of potential compaction effects. In this study, we focus on the core section between 15 m and 20 m b.s. (Figure 5) which was studied using a multi-proxy approach and for which a detailed stratigraphic description is presented.

5.2.1. Stratigraphic Units

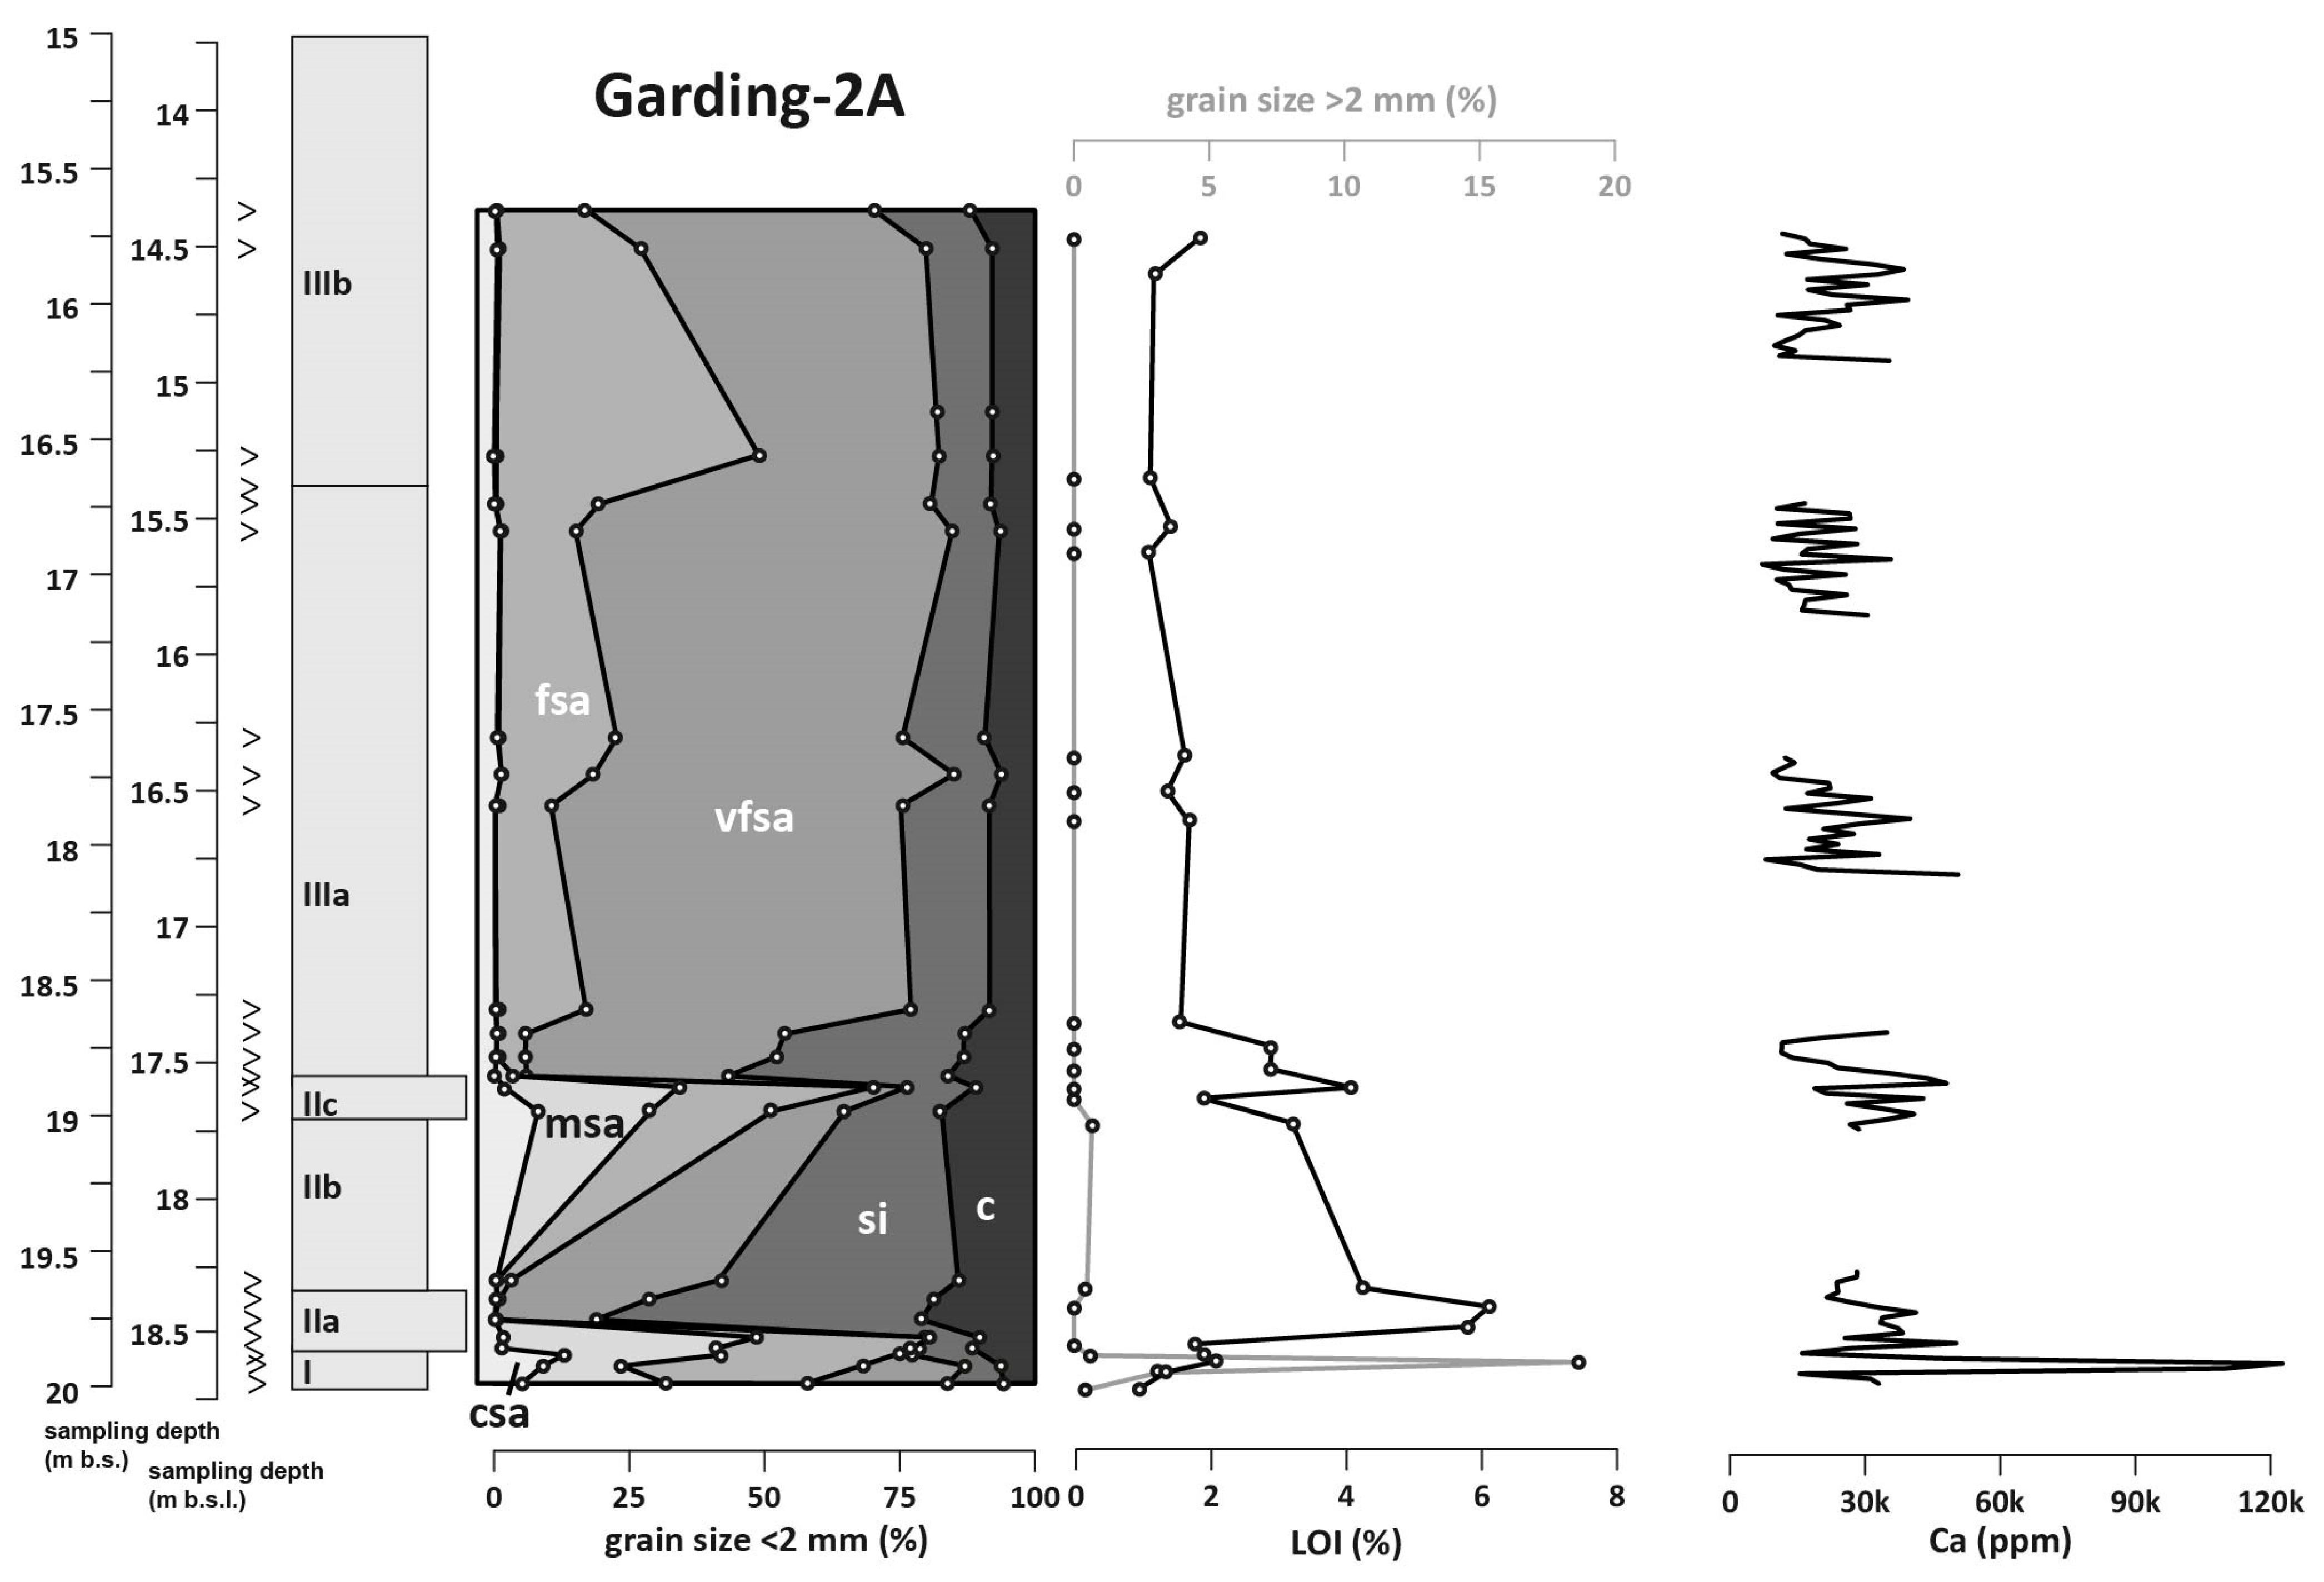
From the studied section of core Garding-2A between 15 and 20 m b.s., three units were identified (Figure 6, Figure 7 and Figure 8). Unit I (20.00–19.87 m b.s.) is a homogeneous light grey deposit dominated by fine sand (volume percentage 55–66%), includes remarkable portions of silt and clay (10–13%) and shows comparatively low concentrations of Ca. The sediment is well sorted with a unimodal grain size distribution showing a plateau for the fine and medium sand fractions (84–85%). Only few macroscopically discernable and indeterminable fossil fragments were observed.
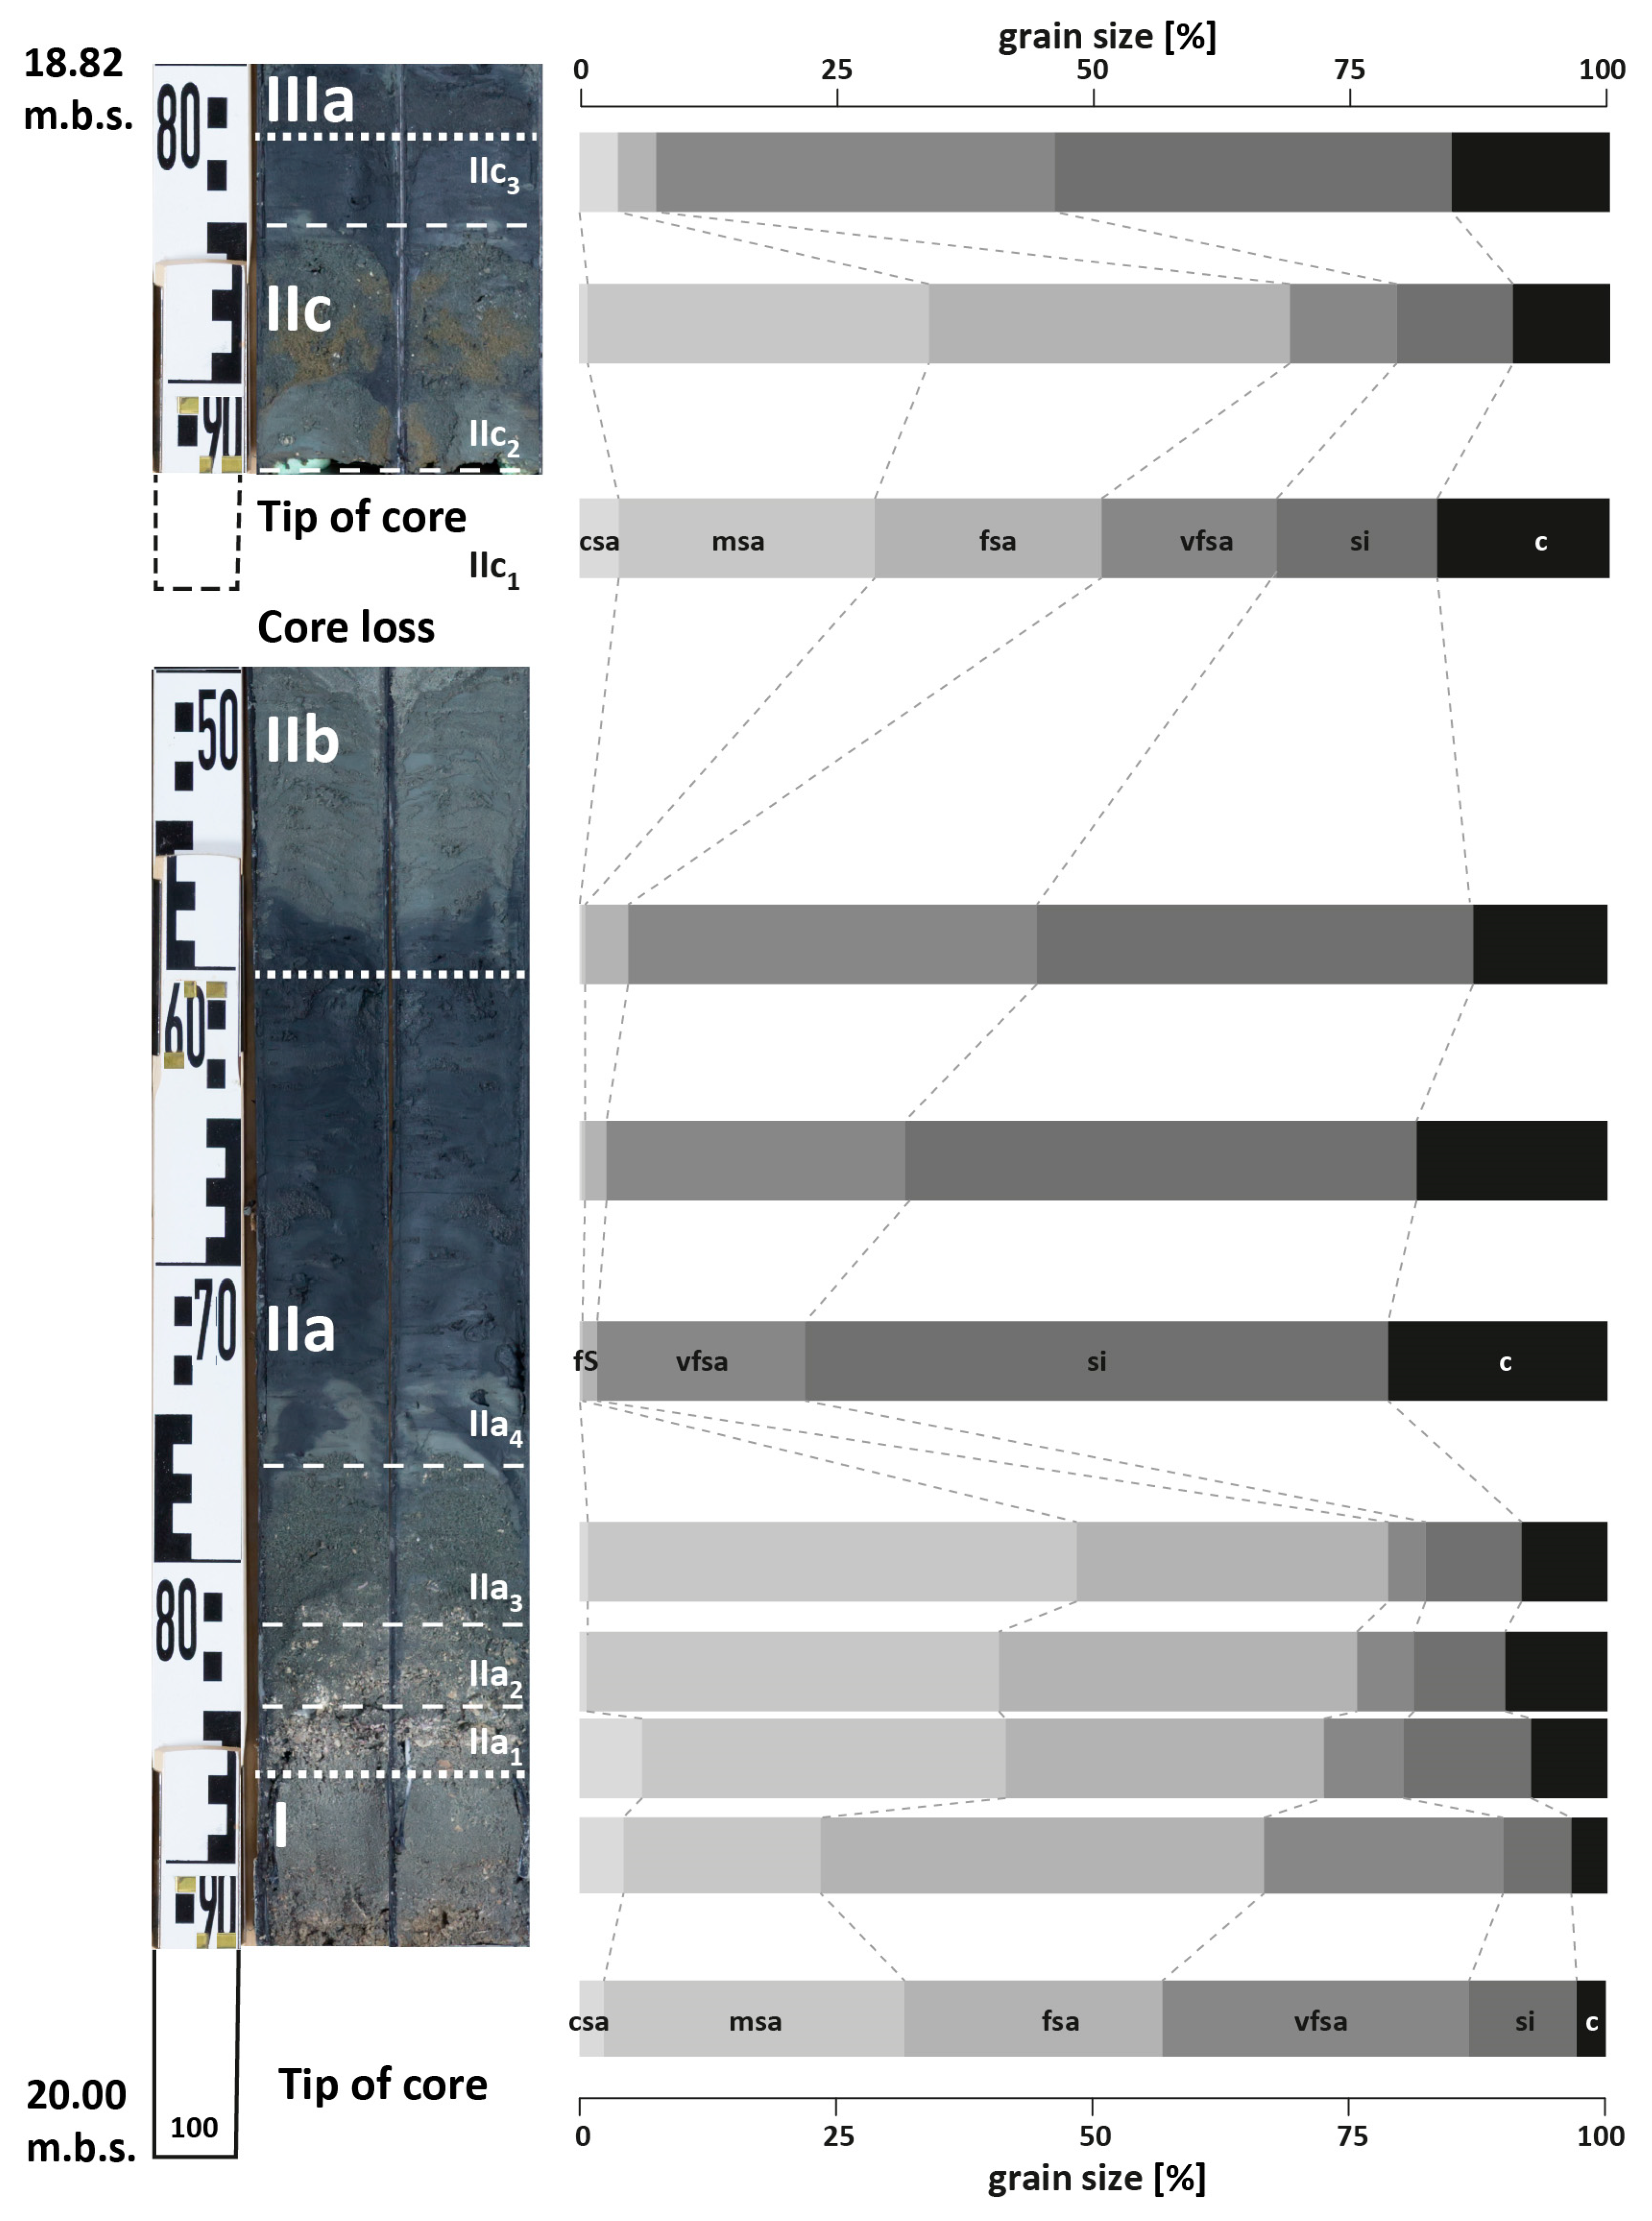
Unit II is composed of three subunits. Subunit IIa (19.87–19.60 m b.s.) is separated from unit I by an erosional unconformity. The unit consists of a 2 cm thick whitish-grey shell debris layer in a matrix of silty fine and medium sand (IIa1: 19.87–19.85 m b.s.) overlain by grey lenses of shell debris, clayey silt and silty fine and medium sand (IIa2: 19.85–19.82 m b.s.). Calcium concentrations were found highest for this subunit (Figure 6). Between 19.82 and 19.77 m b.s. (IIa3), the core is composed of brownish-grey, poorly sorted fine and medium sand with several intraclasts of clayey silt, up to 0.5 cm in diameter. The overlying sediment (IIa4: 19.77–19.60 m b.s.) has a greyish-black colour, and is composed of clayey silt including very few fine and medium sand lenses. Towards the top of subunit IIa (19.87–19.77 m b.s.), the clay fraction reaches maximum volume percentages of around 20% (Figure 8). In its lower part, the medium sand fraction is almost double as high as compared to the underlying unit I sediments. Subunits IIa1 to IIa3 show a fining-upward trend in grain size. Moreover, the organic content increases upward within subunit IIa, reaching the highest values (≥6%) measured within the entire section of core Garding-2A presented in this study. Both the lower and the upper sections of subunit IIa are characterized by bimodal grain size distribution patterns and a low degree of sediment sorting (Figure 7).
Subunit IIb (19.60–19.00 m b.s.) is characterized by alternating laminae of fine sand and clayey silt, the laminae being 0.5–1 cm thick (Figure 7). The colour is light grey and the sediments show a moderate to low Ca concentration. Subunit IIc (19.00–18.82 m b.s.) is composed of a ca. 5 cm-thick shell debris layer embedded in grey fine and medium sand (IIc1: 19.00–18.95 m b.s.). From 18.95–18.85 m b.s. (IIc2), a brownish-grey section with the sand content reaching 79% was observed. Overall, the lower section of subunit IIc shows an abrupt appearance of medium sand (24–33%) that was absent in the upper part of the underlying subunit IIb. In contrast, the upper section of subunit IIc (IIc3: 18.85–18.82 m b.s.) is dominated by very fine sand, silt and clay (Figure 8). Both the lower and upper sections of subunit IIc are characterized by poorly sorted sediments as documented by bimodal grain size distribution patterns. Within subunit IIc, the organic content strongly increases towards the top, reaching a second maximum of 4%. Subunit IIc further shows a fining-upward grain size towards the very top and an upward increase of the organic content (Figure 6).
Unit III is separated into two subunits (Figure 6 and Figure 7). Subunit IIIa (18.82–16.64 m b.s.) is clearly dominated by brownish-grey to grey very fine sand (47–71%) with medium to low Ca concentrations and an organic content between 1% (top) and 2.8% (base). Subunit IIIa appears to have well-sorted fine sand with intercalated fine sand-dominated and silt-dominated laminae up to 2 cm thick (Figure 7). Subunit IIIb (16.64–15.00 m b.s.) has a similar lithology but the sediment is slightly coarser and less well sorted than subunit IIIa (Figure 7) and partly shows lower Ca concentrations. Moreover, the lamination is less clear.

5.2.2. DP Measurements

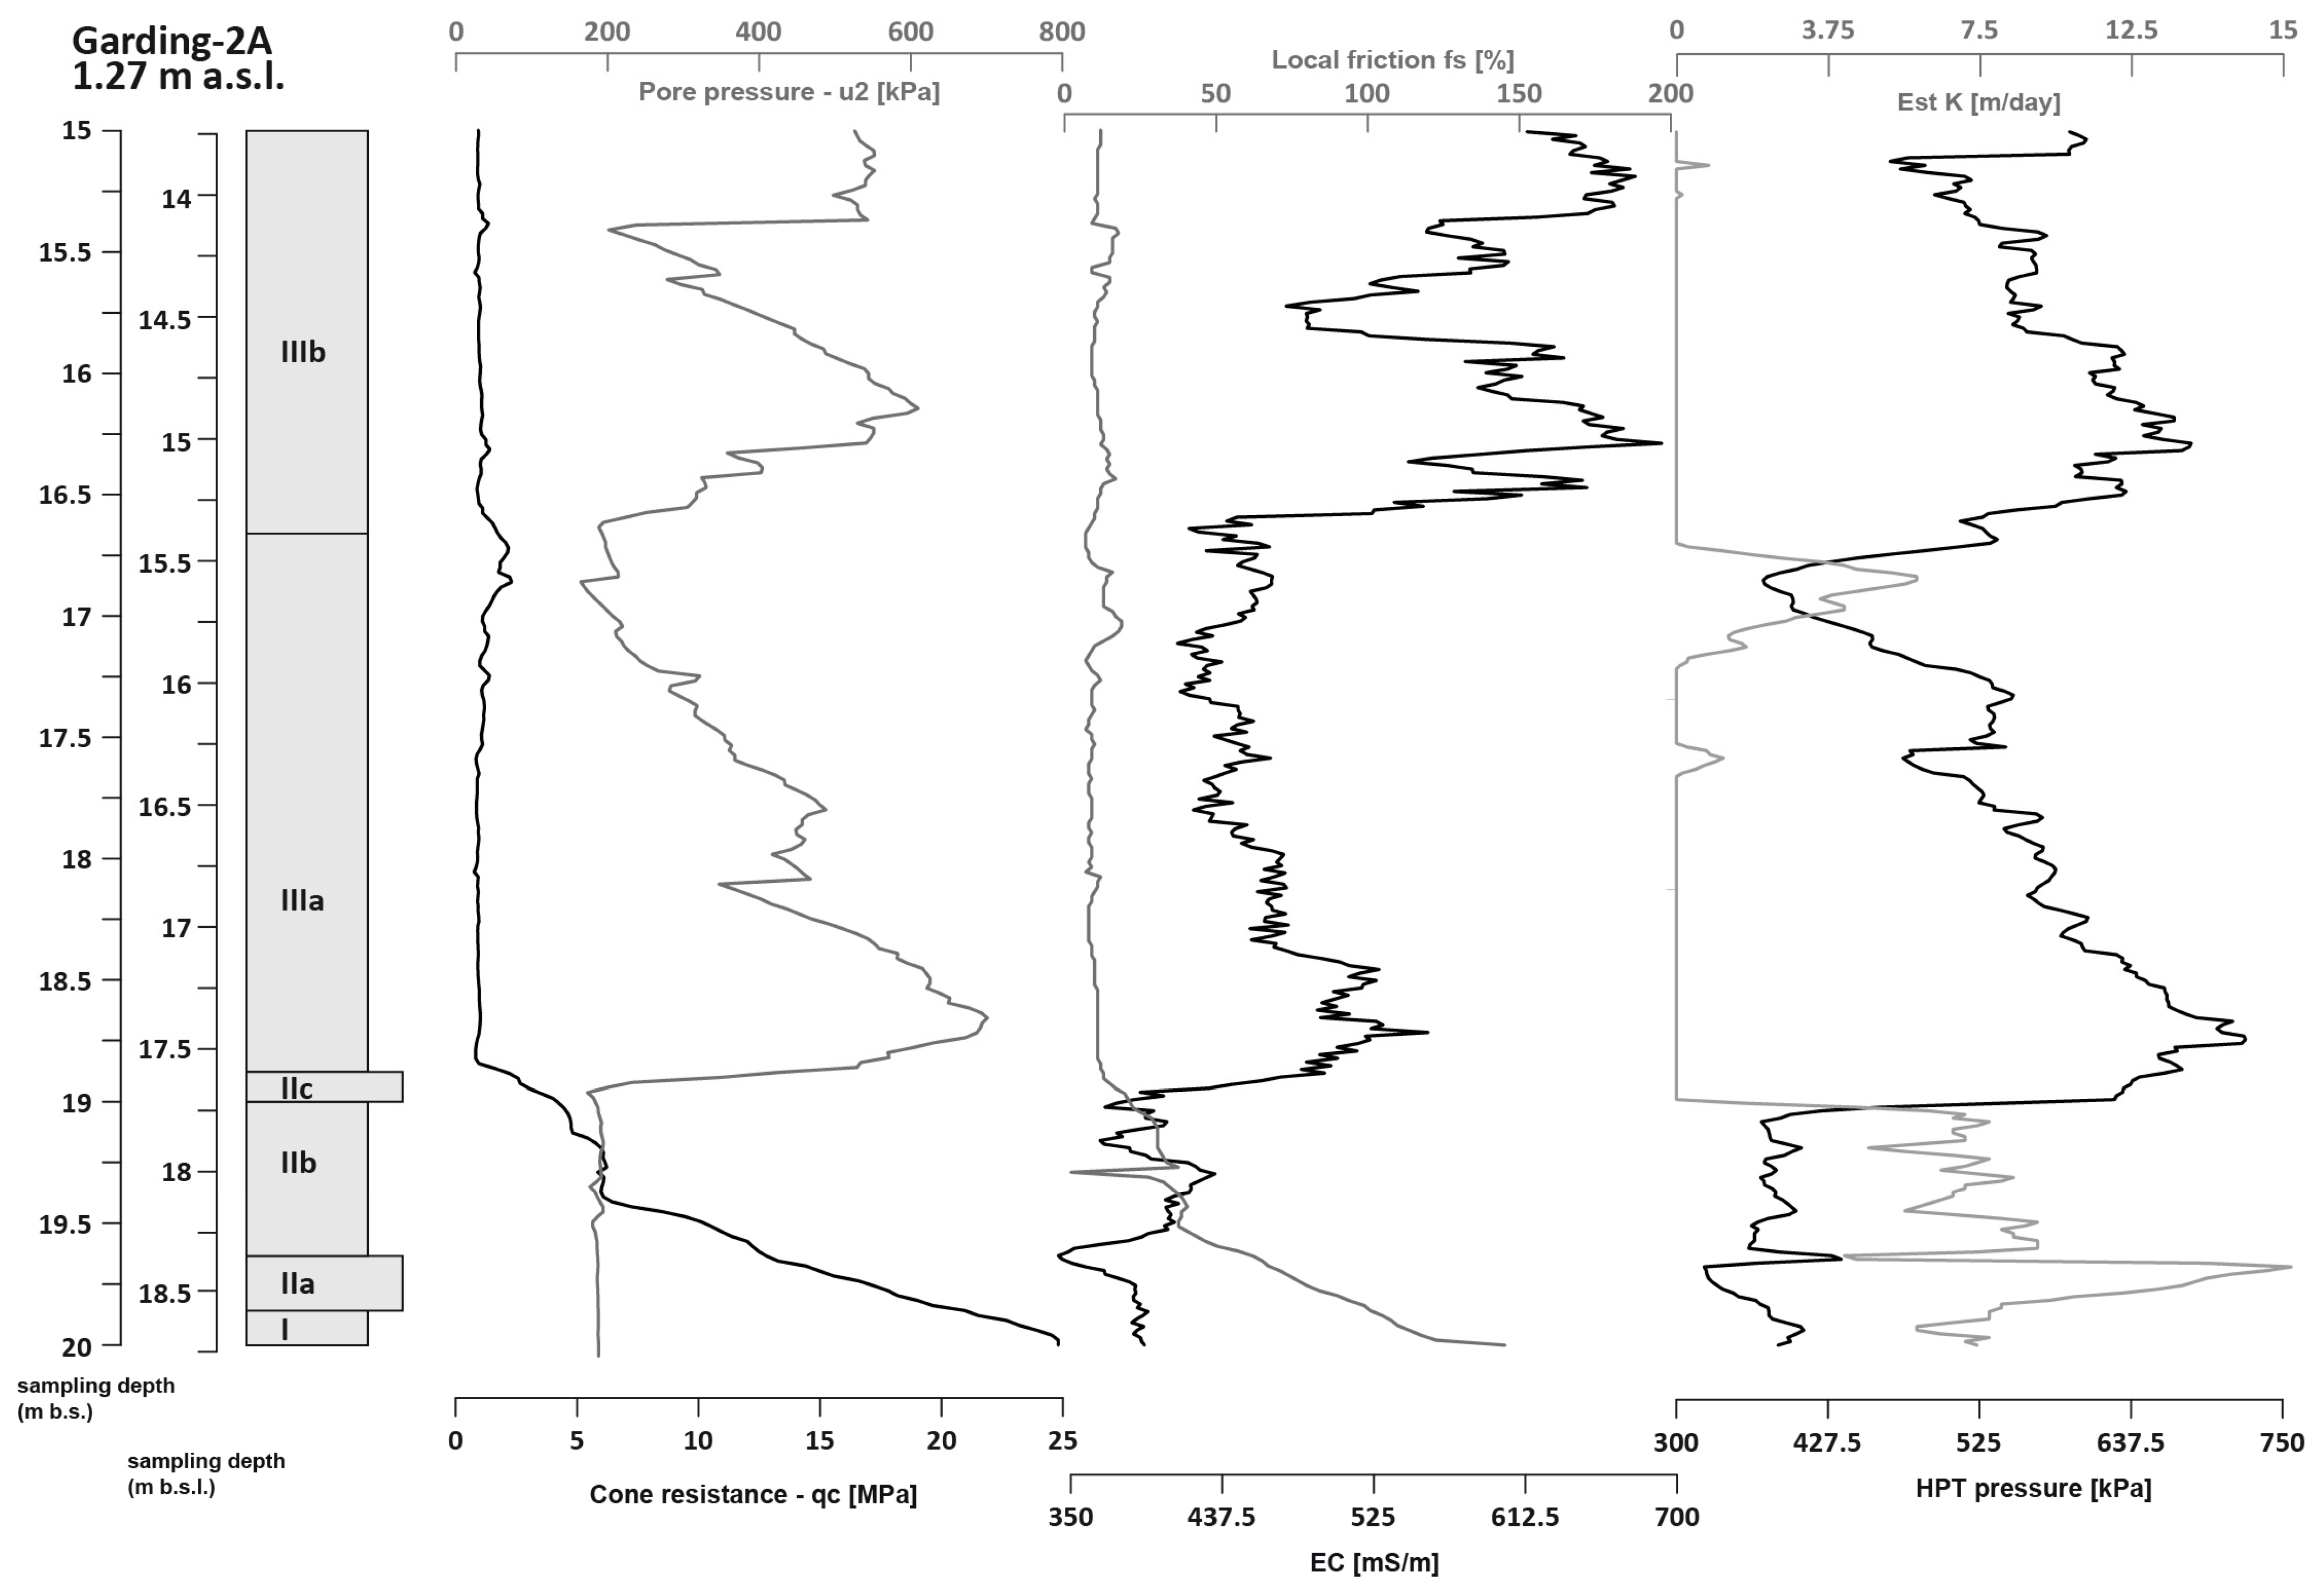
The cone resistance (qc) was found highest for stratigraphic unit I and lowest for stratigraphic unit III (Figure 9). In between stratigraphic unit II, qc values strongly decrease upwards from subunit IIa to subunit IIc. CPT-based pore pressure data (u2) reveal more or less stable values around 200 kPa for units I and II. With the onset of subunit IIIa, a very strong increase of u2 appears (>700 kPa), followed by a steady upward decline towards the top zone of subunit IIIa. Another increase and subsequent decline can be seen for the lower section of subunit IIIb. This is followed by another, third, again very sharp increase in the top zone of subunit IIIb before u2 values stabilized on a level at around 550 kPa. The friction ratio (Fr) was found to have its maximum in units I (~150%) and II (≤100%) with a decreasing upward trend. Fr values stabilize with the onset of unit III on a comparatively low level (≤15%). Electrical conductivity (EC) measurements reveal constant values around 390 mS/m for unit I. Unit II shows three distinct negative peaks with minimum values around ~350–370 mS/m, the lower minimum peak coinciding with subunit IIa and the uppermost one with subunit IIc. With the onset of subunit IIIa, EC values strongly increase to a considerably higher level between ~525 mS/m at the base and ~425 mS/m towards the top of subunit IIIa. The beginning of unit IIIb marks another very sharp increase of the EC values levelling around ~610 mS/m with an intersecting minimum peak of ~490 mS/m (Figure 9).
HPT pressure data show a general similarity with the u2-curve but reveal a distinctly higher sensitivity with regard to stratigraphic details. HPT pressure for unit I was found to be quite constantly around 400 kPa. In contrast, subunit IIa is characterized by a first strong minimum of ~325 kPa and an immediately following maximum of ~430 kPa, whereas HPT pressure data measured for subunit IIb show a baseline at ~400 kPa (Figure 9). The subsequent very sharp increase in pressure to maximum values of ~740 kPa coincides with the onset of subunit IIIa. HPT pressure continuously decrease to ~400 kPa towards the top of unit IIIa, followed by another strong increase with the onset of subunit IIIb. Within subunit IIIb, values again continuously decline towards the top. Groundwater flow rate data (Est. K) are more or less vertically mirrored HPT pressure data but allow an even clearer categorization: at the base of the profile, unit I, subunits IIb and IIc show medium flow rates of ~7.5 m/day. In contrast, subunit IIa is characterized by a thicker zone of a doubled flow rate (15 m/day) followed by a distinct minimum peak found for a thinner zone with 3.75 m/day. Subunits IIIa and IIIb show 0 m/day and thus do not allow any groundwater movement, except for a thin zone towards the top of subunit IIIa where maximum values of 5.8 m/day were measured. To sum up, DP data corroborate the stratigraphic structure of sediment core Garding-2A and allow for the precise identification of stratigraphy-related changes in the mechanic, hydraulic and geophysical behaviour of the sedimentary stack.

5.3. Microfossil Analyses

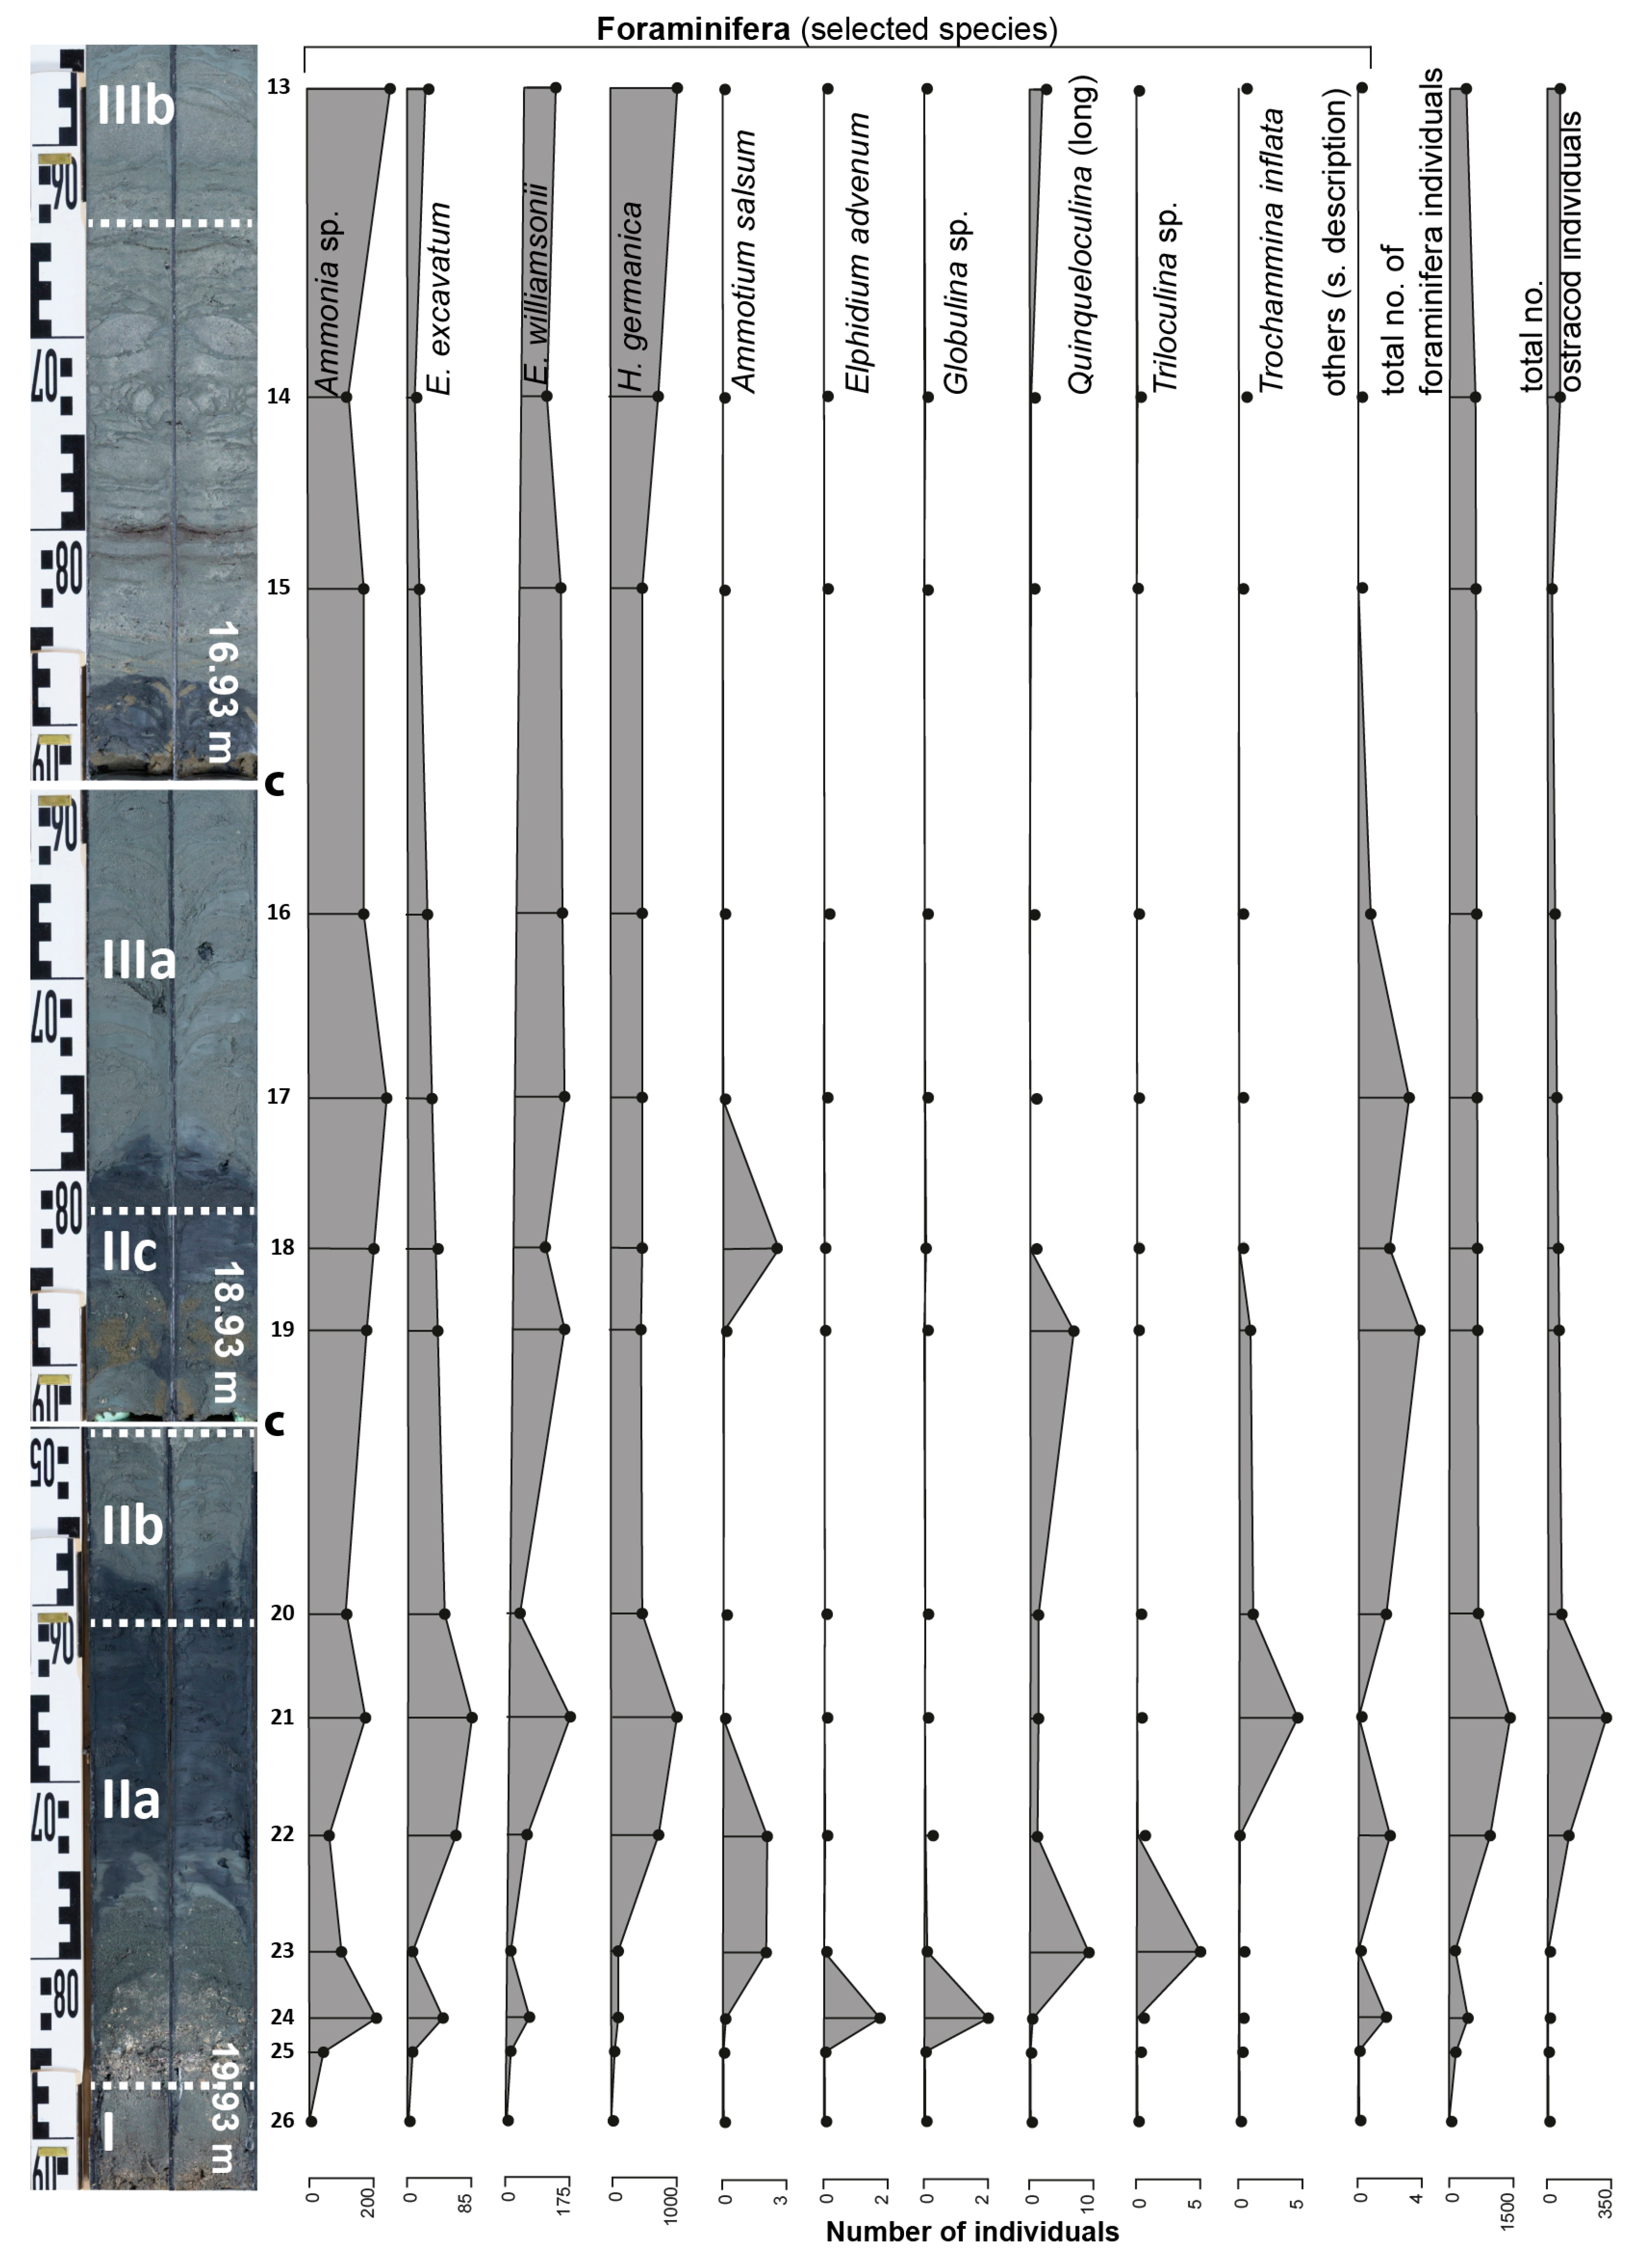
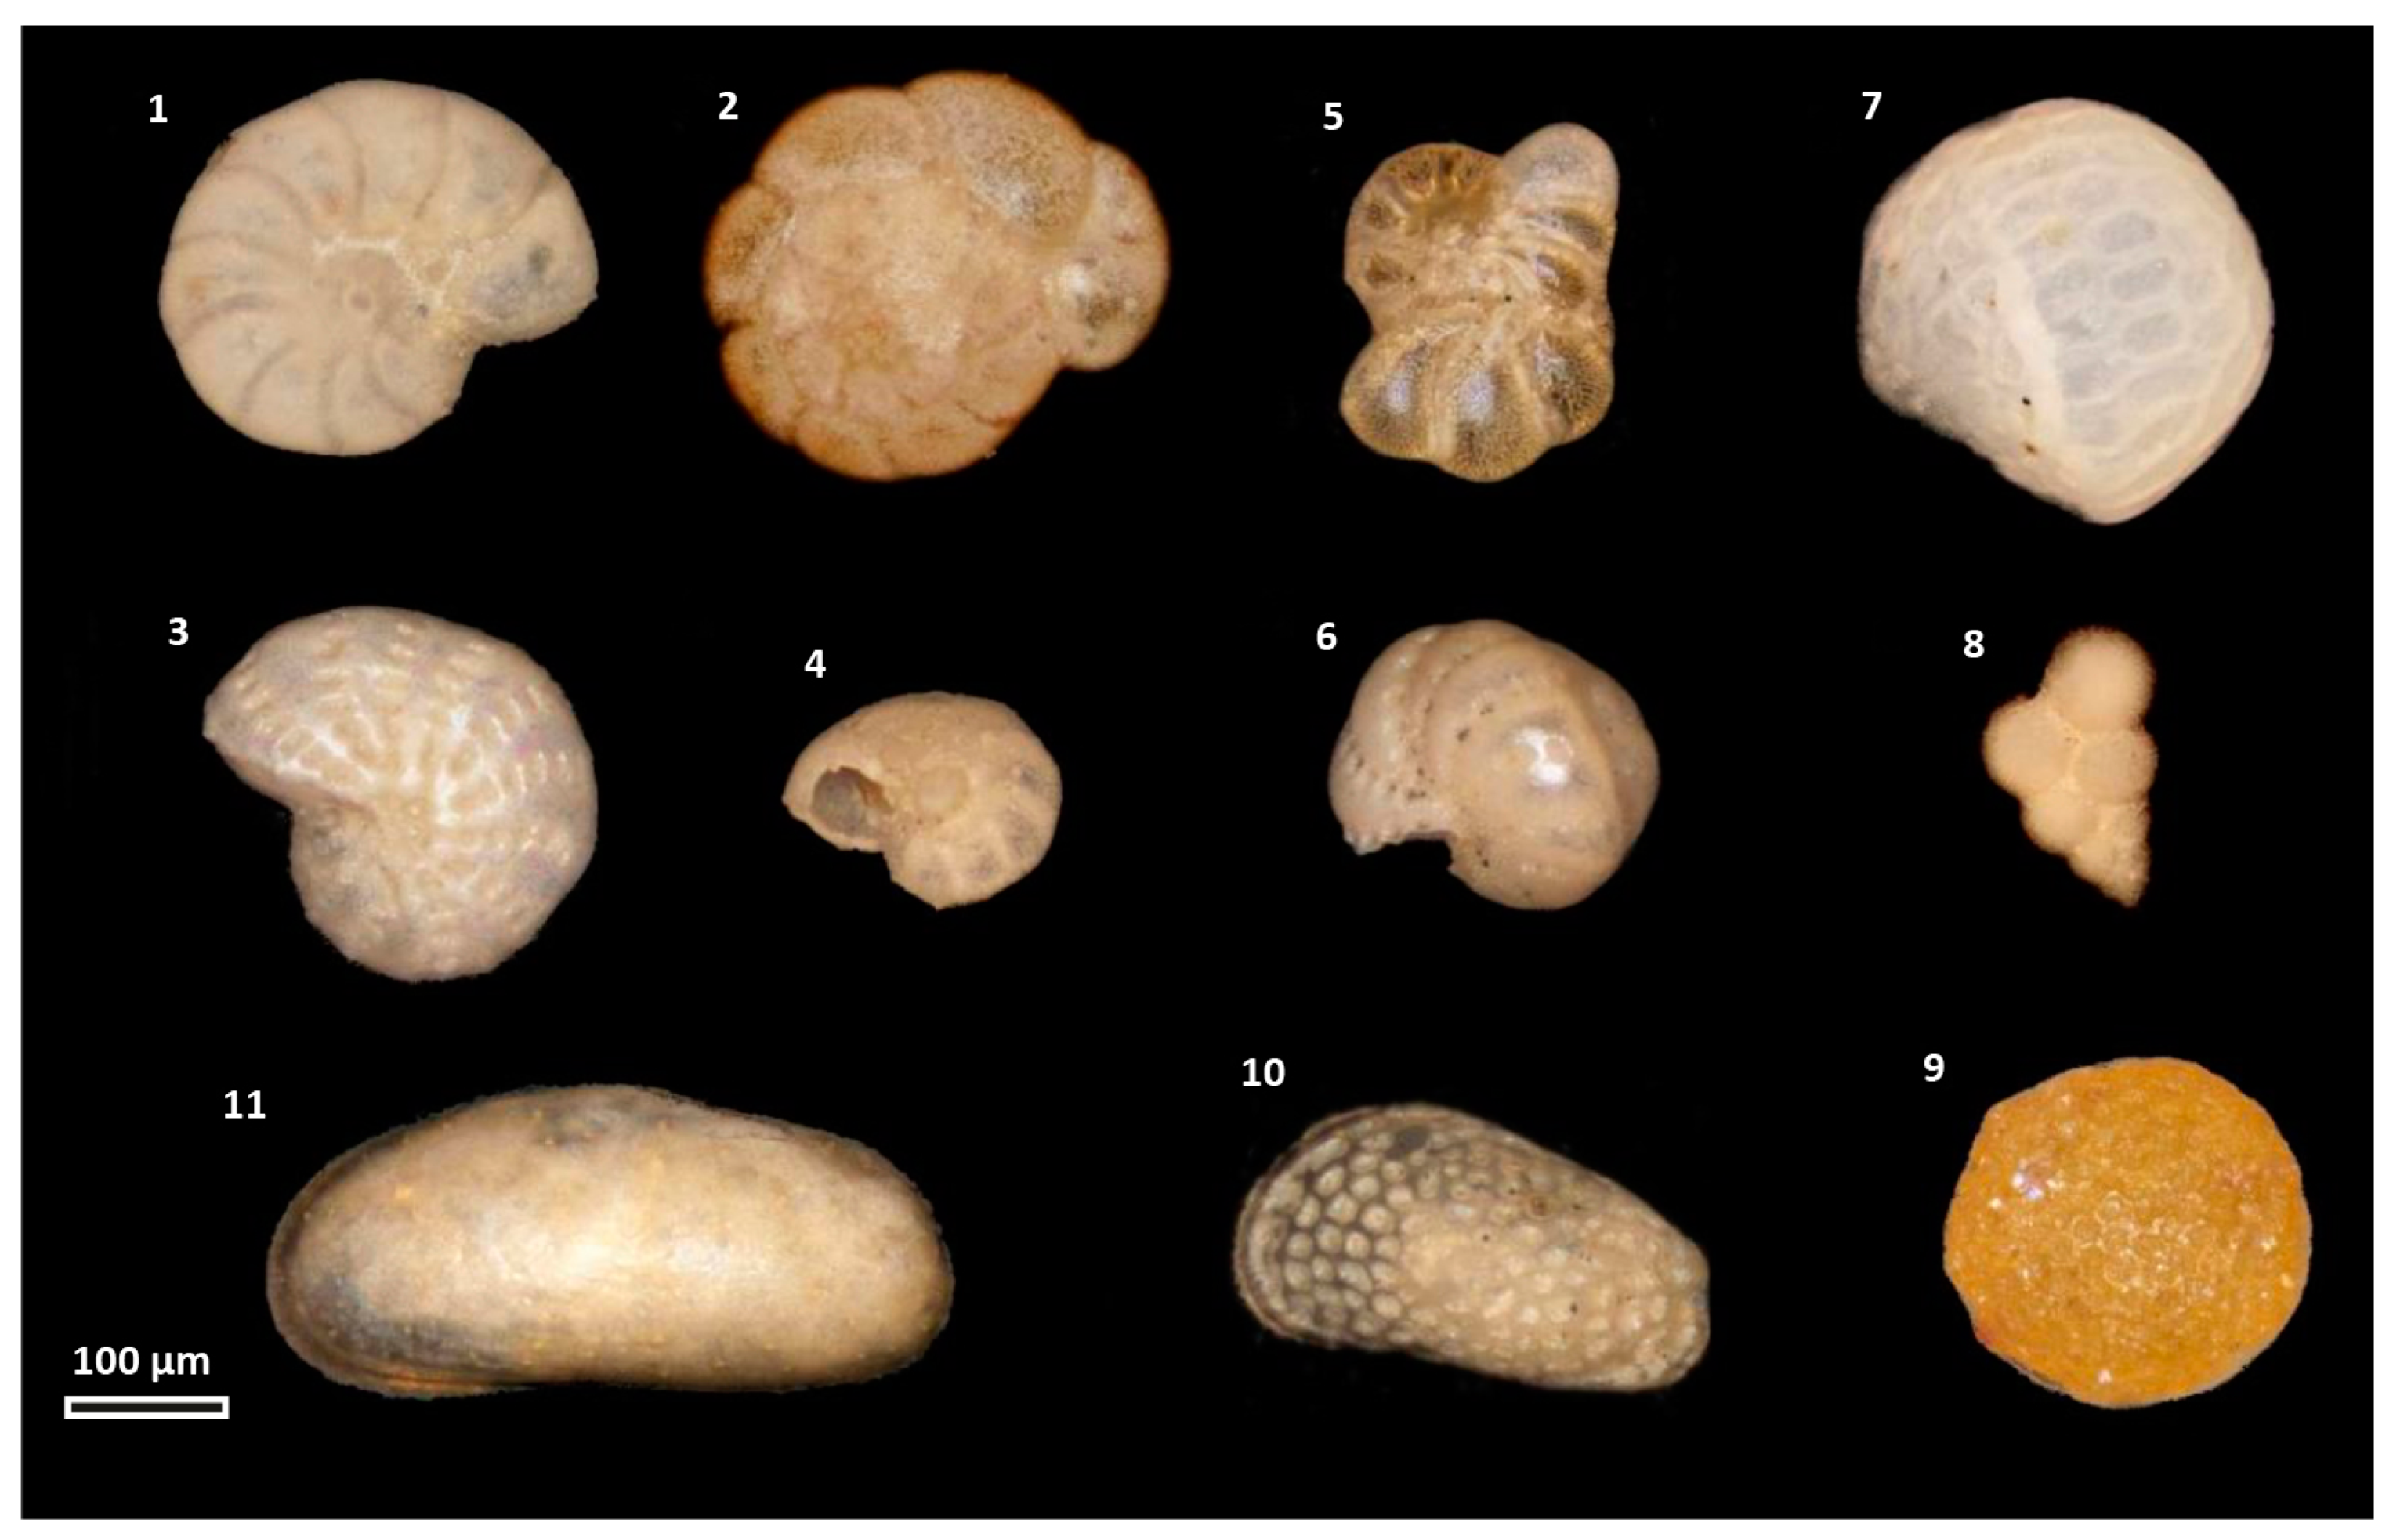
Altogether, 14 sediment samples were collected from core Garding-2A and analyzed for their microfossil content with a special focus on foraminifera (Figure 10 and Figure 11). Sampled sediment from unit I (MF 26, 20.00–19.87 m b.s.) appeared completely void of foraminifera. Foraminifera abruptly occur with the onset of the basal shell layer encountered in subunit IIa1 (MF 25, 19.87–19.85 m b.s.). Among these are Haynesina germanica, Ammonia sp. (Ammonia tepida and Ammonia beccarii), Elphidium williamsonii and E. excavatum, which were found persisting throughout the entire core section studied in this paper with considerably high numbers of individuals, making them the predominant foraminifera species. In the poorly sorted fine and medium sand (subunits IIa2 and IIa3; 19.85–19.77 m b.s.) overlying the subunit IIa1 shell layer, several other species were found, among them Quinqueloculina sp., Ammotium salsum, Triloculina sp., Textularia sp., Globigerinoidea sp., Globulina sp. and Elphidium advenum (MF 25–23). Further, the portion of deformed and fragmented specimens was found highest in these samples. The upper, mud-dominated part of the fining-upward succession of subunit IIa4 (19.77–19.60 m b.s., MF 22–21) revealed the highest abundance of the four persistent species observed. At the same time, we found several specimens of Trochammina inflata (a), Quinqueloculina sp., Orbulina bilobata, Phtalmina sp., Lobatula lobatula (b) and Lagena sp. (c)—that means intermingled facies out of marsh (a), shallow marine to littoral (b) and deeper shallow marine or coastal water (c) species, respectively [47,79,80]. Altogether, subunit IIa is the one with the highest biodiversity and abundance with regard to foraminifera. Moreover, this core section is also characterized by the highest number of (undetermined, but counted) ostracod individuals encountered in the entire studied core section (Figure 10).
Foraminifera also occur in subunits IIb and IIc but with clearly reduced diversity. The abundance of the four main species remains high. An upward decrease in numbers of Trochammina inflata and an upward increase of Quinqueloculina sp. (MF 20–18, 19.60–18.82 m b.s.) can be observed. Furthermore, a few individuals of Ammotium salsum re-occurred towards the top of subunit IIc. In contrast, subsections IIIa and IIIb (GAR 1A MF 17–13, 18.82–15.00 m b.s.) show a poorer diversity, but ongoing high abundance of the mentioned four main species Haynesina germanica, Ammonia sp., Elphidium williamsonii and E. excavatum.

5.4. Radiocarbon and OSL Dating

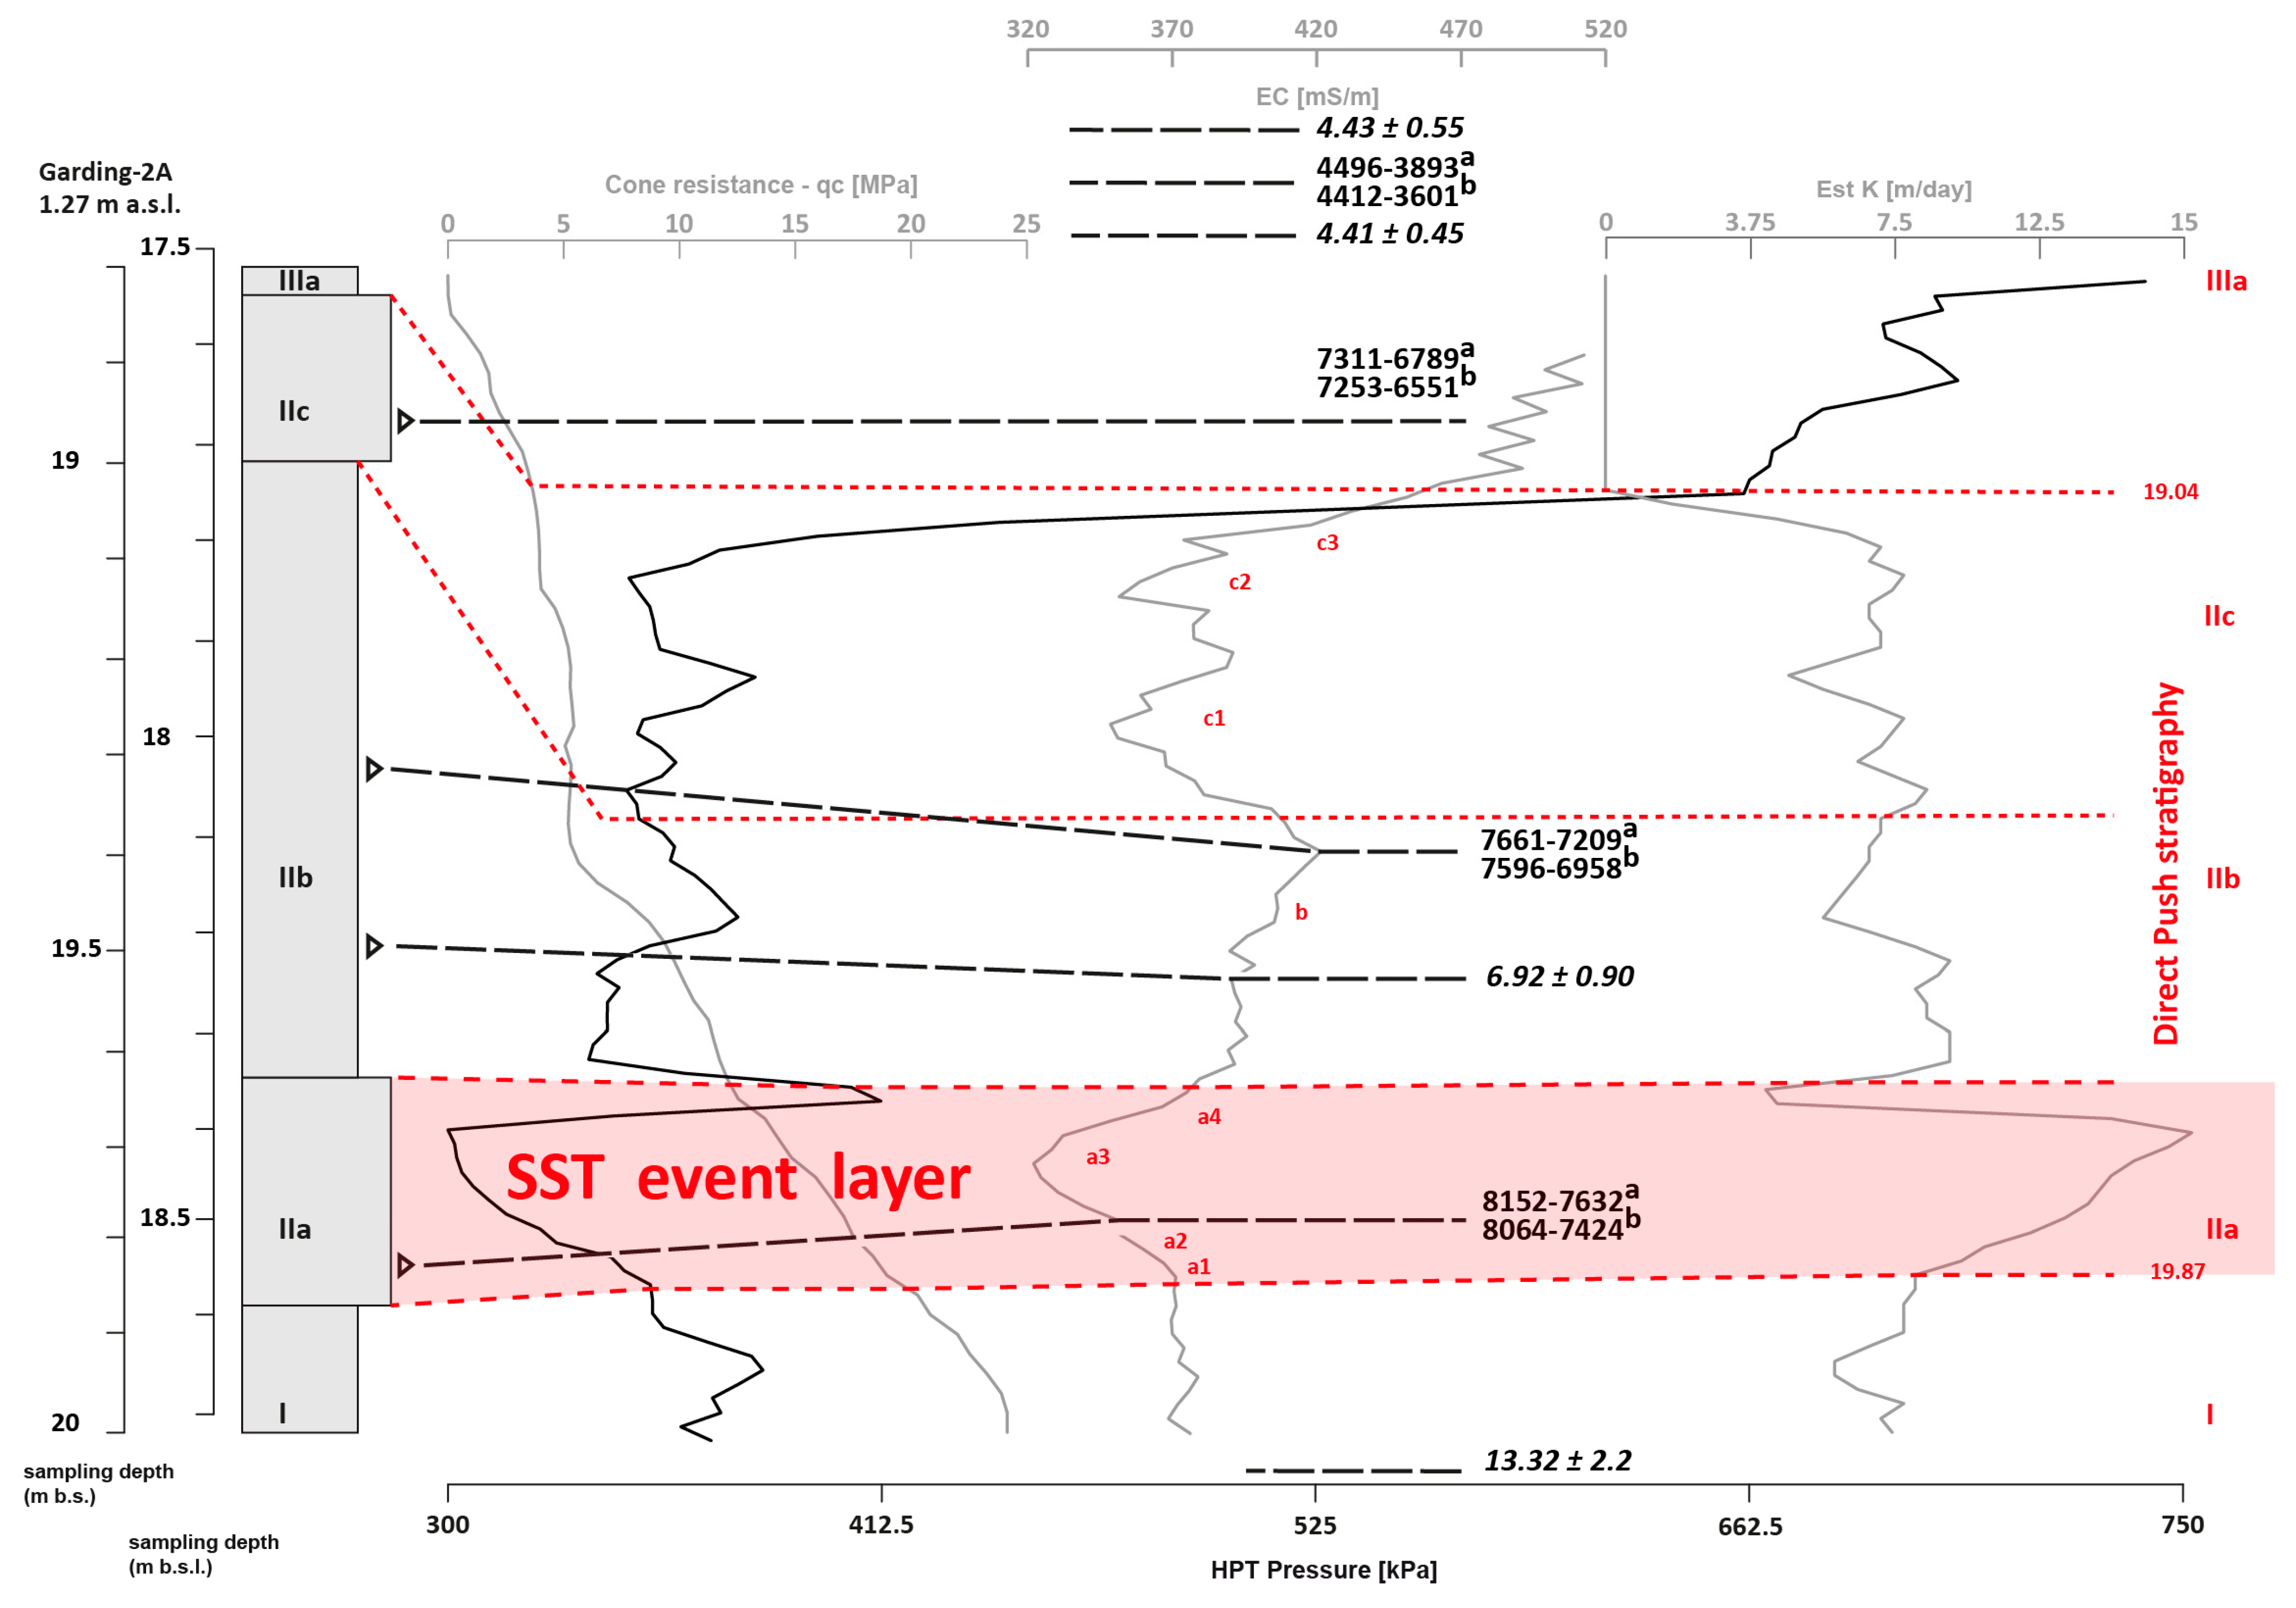
Original radiocarbon samples KIA 48676, KIA 48675, KIA 48674 and KIA 48673 were collected from core Garding-2 ([55]; see also Table 1, Figure 5 and Section 5.2.1). These ages can be neatly assigned to subunits IIa, IIb, IIc and IIIa of parallel sediment core Garding-2A (this paper), respectively, based on the calibration of its stratigraphy with Direct Push sensing data. The latter were measured in situ and are free of any compaction issues. Calibrated radiocarbon data are illustrated in synoptical Figure 12.
The radiocarbon sample from subunit IIa is recalibrated to 8152–7632 cal BP based on calibration scenarioa and to 8064–7424 cal BP based on calibration scenariob (Table 1). Another sample from the midst of unit IIb yields a calibrated age of 7661–7209 cal BP and 7596–6958 cal BP for scenarioa and scenariob, respectively. For subunit IIc, calibrated radiocarbon ages of 7311–6789 cal BP (scenarioa) and 7253–6551 cal BP (scenariob) were calculated. Finally, an upcore section of subunit IIIa was dated to 4496–3893 cal BP and 4412–3601 cal BP for scenarioa and scenariob, respectively (Figure 12).
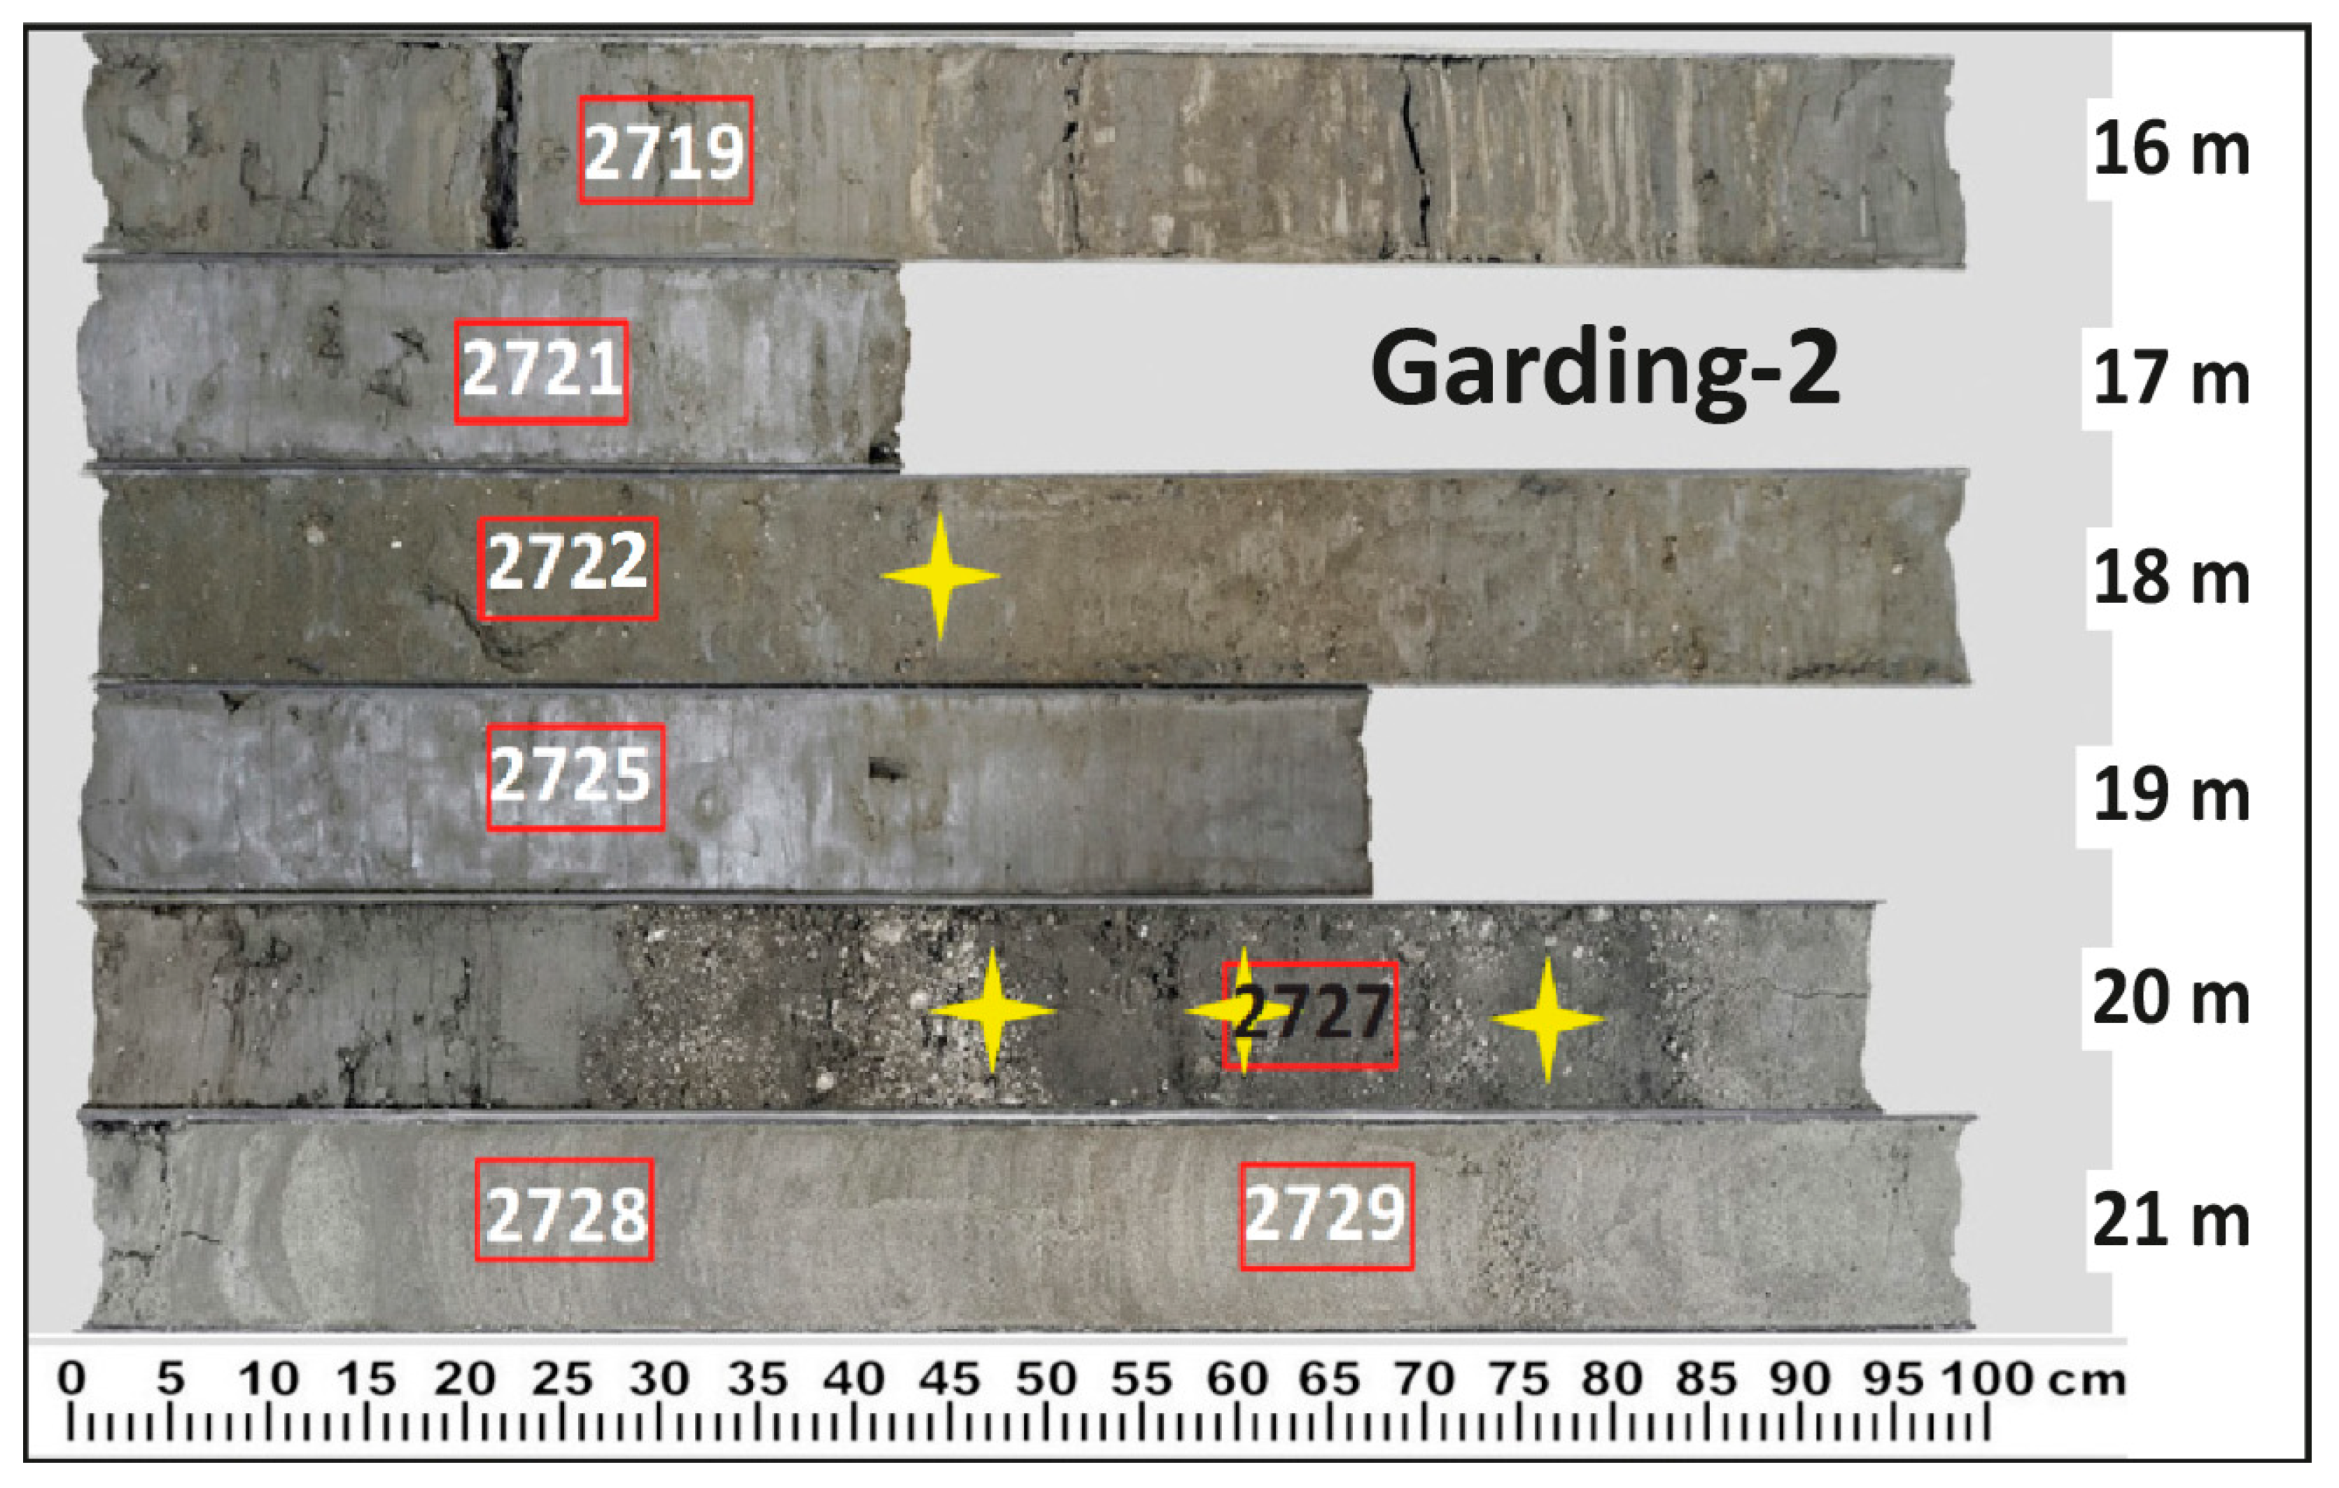
Original OSL samples and age estimates by [55] (see Table 2) no. 2728 and 2729 are related to unit I, no. 2727 is related to the upper section of subunit IIb, and nos. 2725 + 2722, 2721 + 2719 are related to unit IIIa and IIIb, respectively. Unit I was OSL dated to ca. 13.32 ± 2.2 ka and 12.8 ± 2.3 before 2012 (sample ID 2728 and 2729), unit IIb to 6.92 ± 0.90 ka before 2012 (sample ID 2727) and unit III to 4.41 ± 0.45 ka before 2012 and 4.43 ± 0.55 ka before 2012 (sample ID 2725 and 2722). The upper part of unit III was dated to 3.13 ± 0.26 ka and 3.30 ± 0.27 ka before 2012 (sample ID 2721 and 2719).
The OSL age obtained for unit IIb (6.92 ± 0.90 ka before 2012) is quasi-identical within the error range with the radiocarbon age obtained for this unit (7661–7209 cal BP and 7596–6958 cal BP for scenarioa and scenariob, respectively). The radiocarbon age given for unit IIIa (4496–3893 cal BP and 4412–3601 cal BP for scenarioa and scenariob, respectively) is corroborated by under-and overlying OSL samples yielding 4.41 ± 0.45 ka before 2012 and 4.43 ± 0.55 ka before 2012, respectively.

6. Discussion

6.1. Geochronostratigraphy

Overall, the stratigraphy of the section between 15 and 20 m b.s. of the Garding-2 core appears slightly more compact than observed in core Garding-2A, but the internal structure is quasi-identical. The Garding-2 core shows all the (sub-)units that were identified in core Garding-2A (19.94–19.85 m: unit I; 19.85–19.82 m: subunit IIa1; 19.82–19.73: subunit IIa2; 19.73–19.68 m: subunits IIa3+4; 19.68–19.49 m: subunit IIb; 19.49–19.39: subunit IIc1; 19.39–19.27 m: subunits IIc2+3; 19.27–19.00: subunit IIIa). The comparison of the two cores is based on compaction-free in situ DP measurements (Figure 12).
In total, unit II in the Garding-2 core (19.85–19.27 m b.s.) measures 0.62 m in thickness, whereas Garding-2A revealed 1.05 m of the same unit (19.87–18.82 m b.s.). The difference may be explained by local variations in the natural thickness of the deposit within a subtidal channel and/or by different coring techniques that are subject to different compaction effects. Figure 12 summarizes the advantages of applying DP technologies because it allows for the collection of stratigraphic data without any vertical compaction and/or distortion effects. DP data were, therefore, used to compare and calibrate the sediment cores Garding-2 and Garding-2A. Stratigraphic units IIa, IIb, IIc and IIIa coincide with EC, HPT and Est K curve geometries: e.g., subunit IIa1 is characterized by minimum HPT pressure, minimum EC and maximum Est K values, which clearly reflect sand- and shell-dominated sediments (e.g., [60,103]); subunit IIb shows intermediate values in most categories, whereas subunit IIc again reveals the predominance of sand and shells by low values of HPT pressure and EC (Figure 12). The shift towards silt-dominated subunit IIIa deposits is clearly documented by maxima found for HPT pressure and EC values, whereas Est K data abruptly become nil. A best-fit estimation of the “real” thickness of unit II can thus be given based on Direct Push data resulting in 83 cm (ca. 19.87–19.04 m b.s., see Figure 12). This value lies right between thickness values obtained for cores Garding-2 and Garding-2A.
Age data reveal a distinct hiatus between unit I and subunit IIa, spanning ca. 5 ka, that coincides with the sharp erosional unconformity found in the same place: Unit I was OSL-dated to 13.3 ± 2.2 ka, whereas the overlying subunit IIa yielded maximum ages (termini ad or post quos) of 8152–7632 cal BP and 8064–7424 cal BP using calibration scenariosa and scenariob, respectively, for the event layer (Table 1; Figure 12). Subunit IIb obviously developed within few following centuries as documented by both radiocarbon ages 7661–7209 cal BP (scenarioa) and 7596–6958 cal BP (scenariob) and an OSL-age of 6.92 ± 0.90 ka covering the same period. The subsequent abrupt increase in grain size and depositional energy from subunit IIb to subunit IIc is dated by radiocarbon ages 7311–6789 cal BP and 7253–6551 cal BP, again using scenarioa and scenariob, respectively. The age difference between subunits IIa and IIb can, thus, be estimated as lying between 841 and 1363 years and between 811 and 1513 years for scenarios a and b, respectively.
OSL and radiocarbon ages for subunit IIIa are clearly younger, namely, 4.41 ± 0.45 ka, 4.43 ± 0.55 ka and intermediate radiocarbon ages of 4496–3893 cal BP (scenarioa) and 4412–3601 cal BP (scenariob), respectively (Table 1 and Table 2, Figure 12).

6.2. Palaeogeographies and Coastal Configuration

Palaeogeographical reconstructions based on palaeo-sea level data by Vink et al. (2007) [94] and actual bathymetrical data (Section 4) are depicted in Figure 13 for the time slices 8300, 8000 and 7000 cal BP. Based on these palaeogeographical sketches, maximum and minimum distances between the coring site and the open North Sea were determined to be approx. 71, 69 and 24 km and 49, 43 and 14 km, respectively. As elevation changes due to sediment accumulation between the time of the presented time slice and the present day are not reflected in the used actual bathymetrical data (accumulated sediments presumably become thicker towards the coast and thinner towards the central North Sea), we suggest minimum estimates for the given distances more likely. The palaeogeographical scenarios for coring site Garding-2(A) for the time slices 8300, 8000 and 7000 cal BP are thus presumably characterized by a lowland nature with wide marsh and lagoonal to limnic areas arranged along long fluvial estuarine axes that drained the North Frisia hinterland towards the North Sea.

6.3. Sedimentological and Palaeoenvironmental Interpretation

Microfossil analyses reveal a major and abrupt change from non-marine, presumably freshwater conditions (unit I) to palaeoenvironmental conditions that are characterized by strong but heterogeneous marine signals going hand in hand with coarsest grain size records (unit II, subunit IIa; see Section 5.3 and Figure 10). This is also indicated by clearly increasing EC values above the boundary between units II and III (Figure 12), which may suggest the establishment of marine environments. Permanent marine conditions are initiated by the onset of coarser-grained subunit IIc sands that are finally overlain by a thick unit of fine sands indicating stable and homogeneous shallow marine conditions (subunits IIIa and IIIb; Figure 6, Figure 7 and Figure 12).
Given the palaeogeographical conditions (Section 6.2), the stratigraphic sequences recorded in vibracore Garding-2A is interpreted as follows.
Basal unit I—mostly made out of silt and very fine sand (Figure 7) and completely void of foraminifera (Figure 10)—documents fluvial deposits that accumulated in the most landward part of the freshwater-dominated sedimentary environment of the likely palaeo-Eider estuary that is not yet influenced by the North Sea. This is in accordance with results of [47,55] and well explains the lack of marine microfauna. According to [94,104], the relative sea level at the time when unit I was deposited (ca. 13.3 ± 2.2 ka; see Table 2) was below 40–50 m b.s.l.
Subunit IIa marks the first appearance of seawater indicators at site Garding-2A during the Holocene (Figure 10). Subunit IIa overlays an erosional unconformity in basal unit I deposits, followed by poorly sorted, bimodally distributed fine and medium sands, including muddy intraclasts as well as shell debris layers (subunits IIa1 to IIa3). The latter show maximum concentrations of Ca, mostly bound in the form of calcium carbonate by marine organisms (Figure 6). Moreover, fining-upward of grain size as well as an upward increase of organic material were observed (subunits IIa1 to IIa4). Such sedimentary characteristics are typical of extreme wave events such as extreme storms and tsunamis and are described from many coastal sequences worldwide (e.g., [105]). Subunit IIa4 is interpreted as the mud cap-type upper part of the event bed with a very high LOI value, as found typical of many tsunami deposits and not present in storm sediments (e.g., [105,106]. As for the microfossil signature, the same subunit IIa4 (19.77–19.60 m b.s., MF 22–21) revealed several specimens of Trochammina inflata (a), Quinqueloculina sp., Orbulina bilobata, Phtalmina sp., Lobatula lobatula (b) and Lagena sp. (c)—that means intermingled facies out of marsh (a), shallow marine to littoral (b) and potentially deep water (c) species, respectively [47,79,80]. Subunit IIa4 further shows the maximum abundance of the foraminifer Trochammina inflata, which is typical of middle and high marsh environments [107]. Therefore, it seems to document that marsh areas of the outer palaeo-Eider estuarine system were flooded and microfossils transported to the so far freshwater-dominated inner section of the palaeo-Eider fluvial system.
In the present context, especially considering the fact that the study site is located some tens of kilometers distant from the open North Sea coast at the time when subunit IIa was deposited (Table 1), storm influence can be fully excluded based on the palaeogeographical setting. Coring site Garding-2(A) is, thus, located too far inland to allow storms to leave a layer, 25 cm thick, as assumed by ([47], p. 150). In contrast, the observed features such as a fining-upward trend in grain size and the presence of silty to clayey ripped-up intraclasts correspond well to tsunami signatures in sedimentary records, most recently summarized by [108]. Subunit IIa, therefore, not only marks the beginning of shallow marine influence at the study site, but also documents that this marine influence is related with tsunami impact on an amphibious fluvial landscape located far inland.
This interpretation takes into account site-specific geomorphological criteria that are important to identify tsunami deposits as was requested by [11]. Moreover, microfaunal data collected from core Garding-2A show an abrupt onset of foraminifera from different ecotopes, resulting in a clearly mixed facies including marsh, fluvio-limnic, marine to littoral, as well as species from deeper shallow marine or coastal waters (Section 5.3). Subunit IIa shows highest biodiversity and abundance values observed for the entire core section presented in this paper (Figure 10); these criteria are well known as being indicative of tsunami impact when related to the mentioned sedimentary and geomorphological criteria (e.g., [75,77,109].
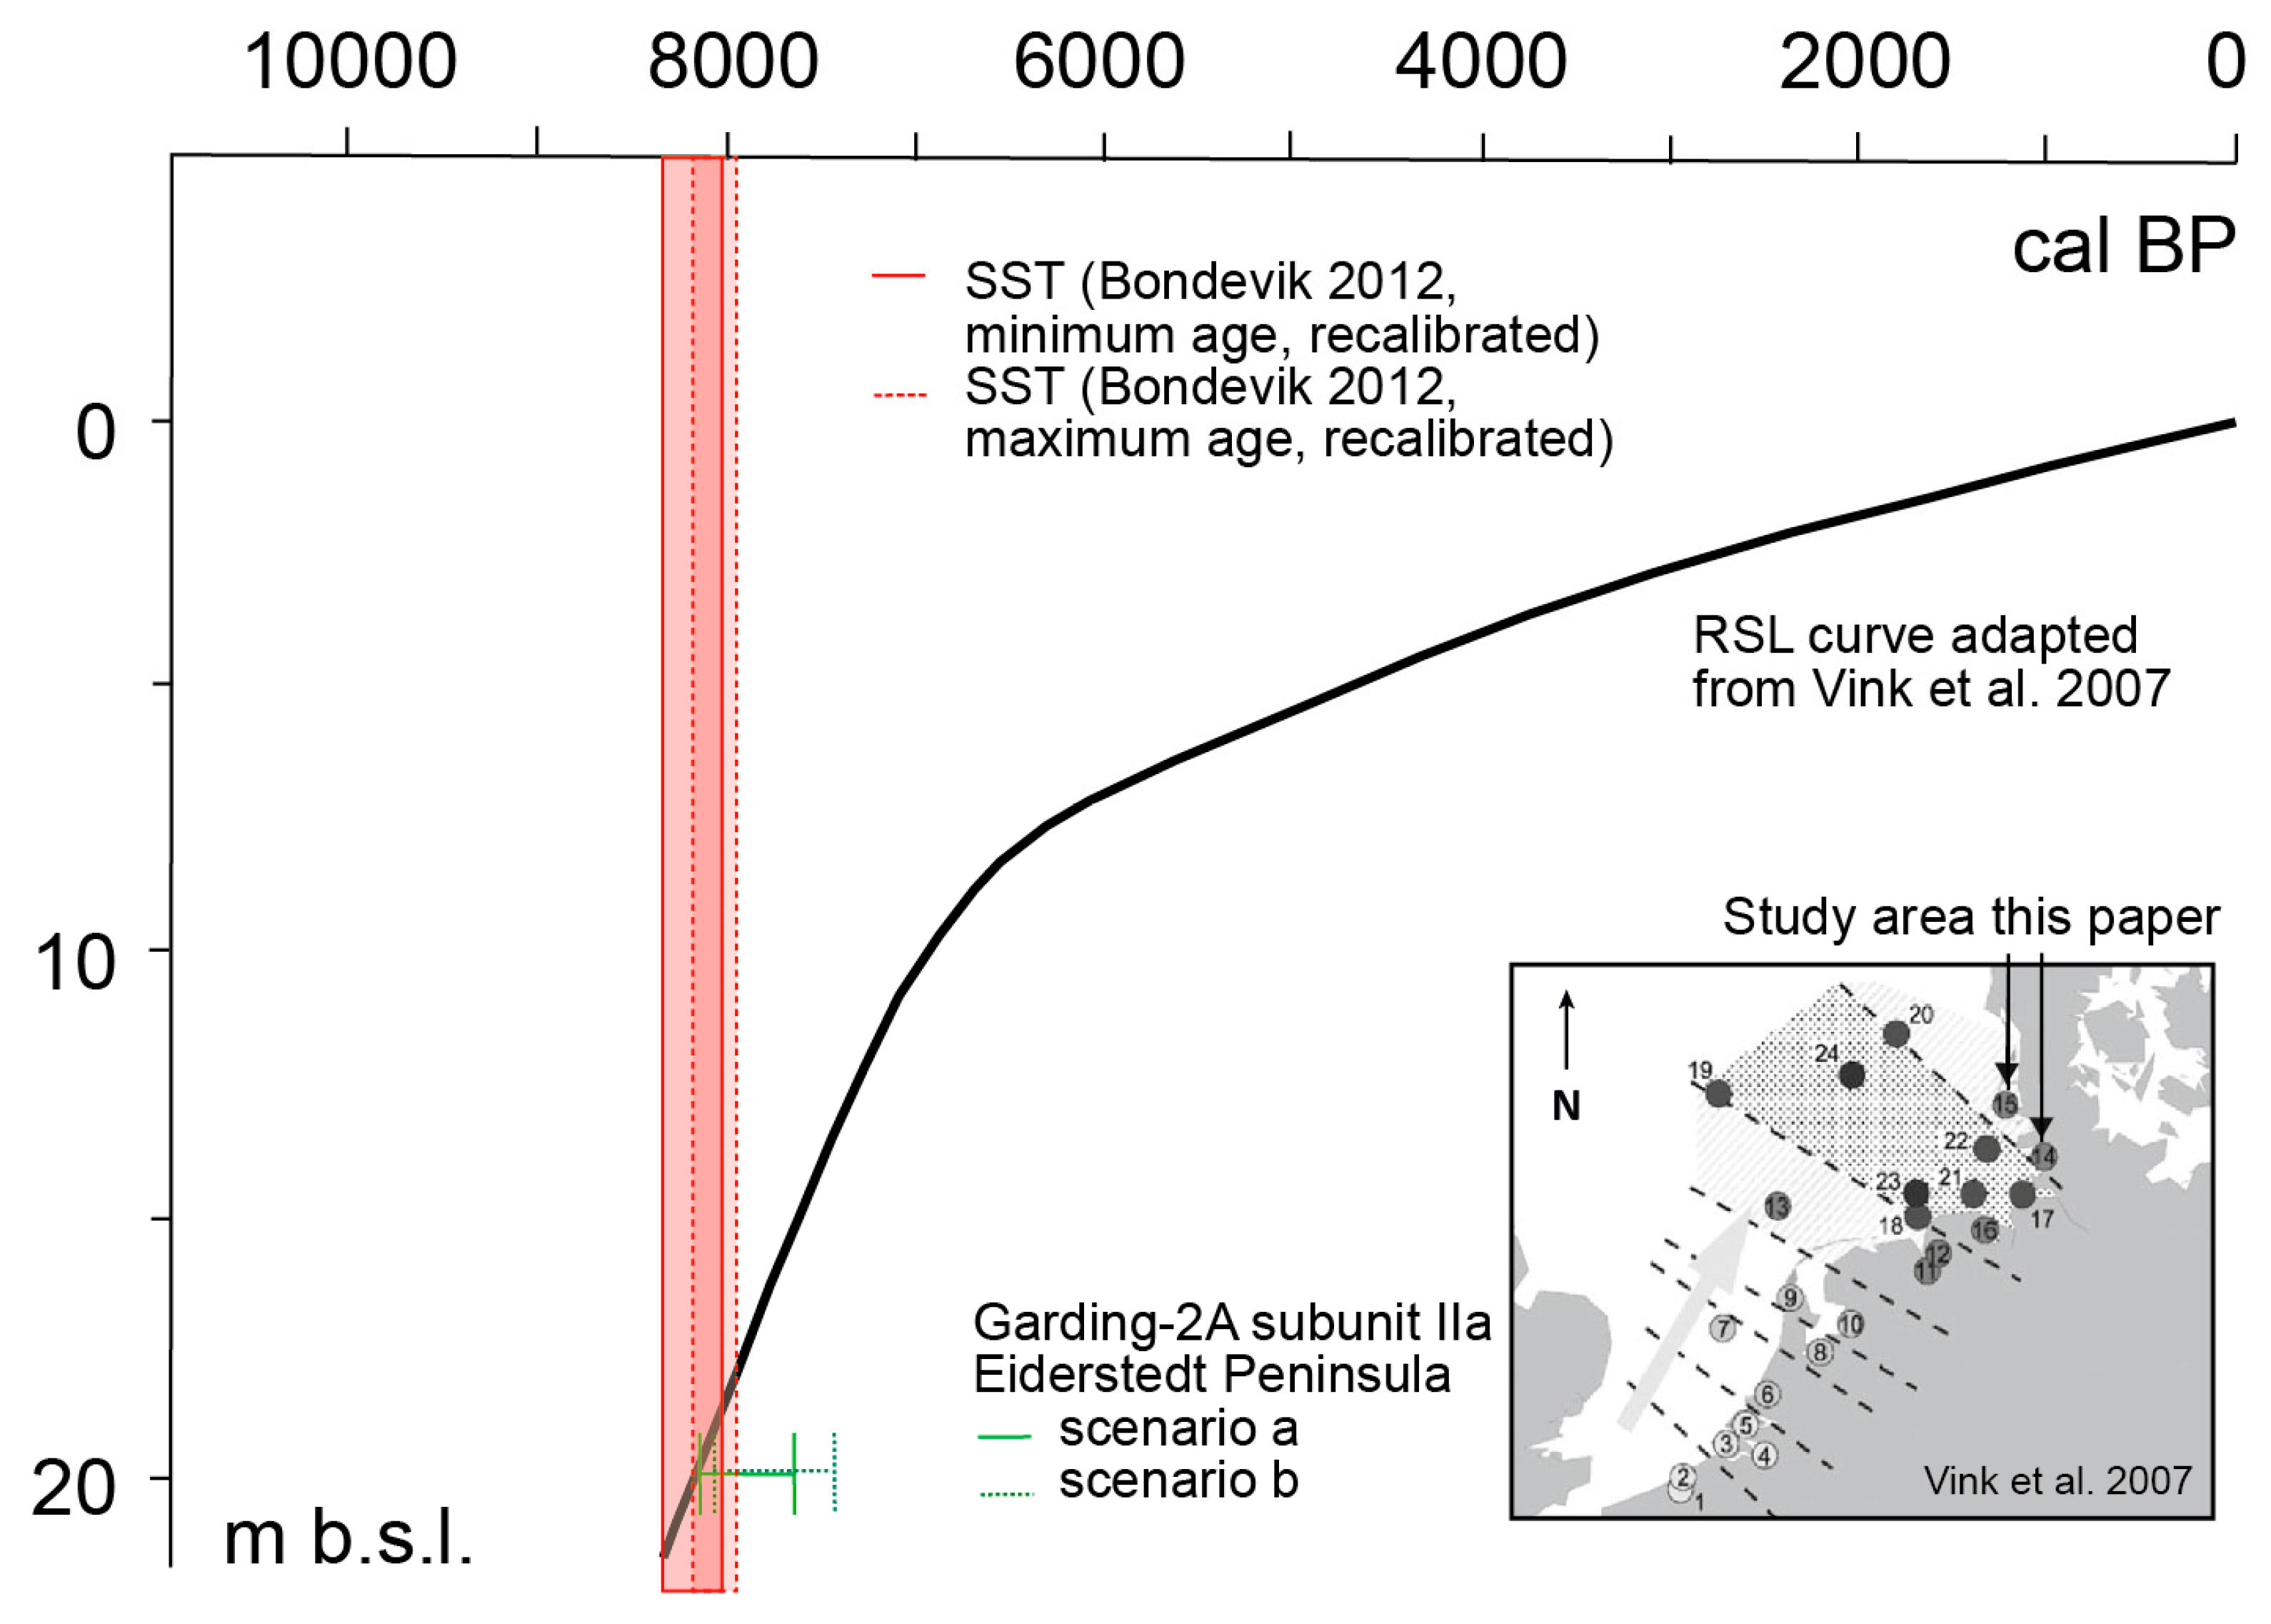
Considering age data, the age estimates obtained for subunit IIa largely overlap the high-precision age determination for the SST provided by [3] based on 14C-analyses of green mosses that were still alive when hit by tsunami waters. Results of [3], recalibrated using Calib Rev 8.2, yield a minimum age of 8176–7941 cal BP, a maximum age of 8346–8029 cal BP and a (weighted) mean age of 8172–8031 cal BP (Table 1). We, therefore, see a strong consistency in age between the SST and the tsunami event bed recorded as subunit IIa in vibracore Garding-2A near Garding (8152–7632 cal BP (scenarioa) and 8064–7424 cal BP (scenariob), Table 1), suggesting that the site was most probably affected by the known tsunami event (Figure 12 and Figure 14).
Further arguments that underline this interpretation are that the event facies observed at site Garding-2A strongly resemble the event facies interpreted as caused by the SST and described by [13] encountered in a palaeo-lake environment on the island of Rømø (southern Denmark). Beyond that, age data retrieved for subunit IIa in core Garding-2A lies even somewhat closer to SST age data published by [3] than the OSL data reported for Rømø by [13] for the SST-candidate deposit (7.90 ± 0.5 ka, [13]).
Another potential site with SST impact on the German North Sea coast, so far unidentified, is described by [110], who applied radiocarbon and OSL dating to set up a geochronostratigraphy for a core recovered from the near-shore-zone off Sylt Island (located between the current coring site Garding-2A on Eiderstedt Peninsula and Rømø Island). Core 06VC described by [110] shows glaciofluvial fine sands with plant remains and wood fragments covered by Holocene sands and a subsequent peat layer. The latter, lying at 21.47 m b.s.l., was dated to 8.4–8.2 ka cal BP, and is covered by marine silts and two conspicuous shell layers right on top of the peat unit ([110]: Figure 4). Ref. ([55], p. 11) already noted the age consistency with regard to the Garding-2 core, so that it cannot be excluded, on a hypothetical base, that the intercalating shell debris layers reported by [110] in fact also represent a potential SST signal.
Moreover, ref. [2] identified the western regions of Jutland and surrounding areas—including North Frisia—as an outstandingly large region (Figure 4) with major hypothetical SST impact because of its nature as low-lying ‘run-in’ area. Finally, pollen analyses conducted by [56] on the abruptly appearing marine sediments at 19.80 m b.s. from the Garding-2 core revealed a mixed tree pollen spectrum with notably low values of Alnus sp. and Quercus sp., redeposited pollen of early Pleistocene Tsuga diversifolia, incorporated elements of swamps and bogs and conspicuously low amounts to even absence of heliophilous Chenopodiaceae herbs. This signature may be interpreted as the result of widely tsunami-flooded paralic swamps in largely amphibious landscapes as well as of tsunami-related dilution effects with regard to pollen concentration. The latter has been observed for many tsunami deposits worldwide (see [108], p. 309 for further references), e.g., by ([111], pp. 188–120) for a tsunami bed intercalating Lake Voulkaria limnic deposits in western Greece.
Compared with relative sea level data for the North Sea, subunit IIa (18.60–18.35 m b.s.l.) lies within the range of the RSL of 19 m b.s.l. reconstructed on the base of ([94]: Figure 9) for the time of 8100 cal BP (Figure 14). Please note that the curve by ([94]: Figure 9), integrated into Figure 14 of this paper, corresponds to a predicted smooth RSL curve based on a best-fit earth model for the Eiderstedt Peninsula which was originally published without hull curve. RSL data by [104] yield a RSL of ca. 17 m b.s.l. for the same time period. We, thus, assume that the Garding-2(A) site was lying at or most probably slightly (max. 1 to 1.5 m) below the RSL at that time ensuring the existence of the estuarine environment described for the study site. It remains, however, unclear as to which grade tsunami-related erosion affected the basal estuarine sediments, so that the actual water depth may have also been even shallower.
Subunit IIb is characterized by alternating laminae of fine sand and clayey silt. Unit IIb is interpreted as an interim phase between the impact of the SST (unit IIa) and the onset of the marine transgression (unit IIc, see below), representing a period of re-arrangement and redeposition of sediments after major interference of the local palaeoecosystem by and during the SST impact. After the high-energy SST impact, the ecosystem is characterized by a trend towards the re-establishment of pre-impact low-energy conditions which is shown by a clear change from predominant medium and fine sand (subunits IIa1 to IIa3) to predominant clay and silt (subunits IIa4 and IIb). LOI values remain on a high level within entire unit IIb (Figure 6). Moreover, microfauna abundance seems to remain high, whereas diversity clearly decreases compared to the underlying event bed (Figure 10). Based on this, we suggest that after the SST impact, environmental conditions at the Garding-2(A) site were of low-energy nature and subject to strong eutrophication. Singular Trochammina inflata specimens of middle to high marsh grounds seem to indicate at least temporary subaerial and/or freshwater conditions. The re-arrangement of sediments initiated by SST waves as well as the subsequent phase of eutrophication of a re-established low-energy environment dates back to 7661–7209 cal BP and 7596–6958 cal BP with regard to calibration scenarioa and scenariob, respectively (Table 1).
In contrast, subsequent subunit IIc deposits are again badly sorted and show a bimodal grain size distribution (Figure 7). In addition, this subunit shows an upward increase of organic material (Figure 6) as well as a fining-upward trend of grain size (Figure 8). Compared to subunit IIa, subunit IIc shows reduced biodiversity and abundance values with regard to foraminifera (Figure 10). For example, specimens of Elphidium advenum, Globulina sp. and Triloculina sp. are completely missing, and those of Trochammina inflata are reduced to a minimum. We interpret these characteristics as being linked to the Holocene marine transgression using the palaeo-Eider fluvio-estuarine system and opening it towards permanent marine conditions as documented by unit III sediments. Radiocarbon ages of 7311–6789 cal BP (scenarioa) and 7253–6551cal BP (scenariob, Table 1) for subunit IIc (Figure 12) are in line with results from Rømø Island [13] where the Holocene transgression was encountered on top of a brackish lake gyttja and did not occur before 7.75 ± 0.16 and 7.2 ± 0.40 ka cal BP ([13], p. 1049 and Figure 2).
Comparable to the results from Rømø Island, the onset of the marine transgression is marked by a sharp increase in grain size and the number of shell fragments ([13]: Figure 2). This remarkable environmental shift is underlined by a homogenization of the marine foraminifera signature (Figure 10) and a clear change of DP-signals (Figure 12). Although the coastline towards the open North Sea, at that time, was still lying at least some 10 km further west, the transgressive event obviously introduced permanent shallow marine conditions of a tidal channel network to the palaeo-Eider system as evidenced by the foraminiferal assemblage found for unit III.
Although the stratigraphic subunit IIa may have some similarities with event layers deposited by storms or within the course of the Holocene marine transgression, our results rather point to a formation caused by the SST. Storm layers in the North Sea are often characterized by well-sorted washover or sheet sands [13,112] and are thus considered different from the poorly sorted event subunit IIa found at the Garding site. Moreover, rip-up intraclasts out of silty clay as encountered in subunit IIa are considered as a sedimentological feature most common to tsunami impact [108]; the same is true for mud caps rich in organic material, with both features not reported from storm deposits (e.g., [105]). Moreover, the return rate of storms in the North Sea is much higher than those of tsunamis, so that storm influence is expected to leave frequently repeated sand intercalations separated by layers documenting more moderate inter-storm conditions. Subunit IIa, however, marks a singular and unpreceded unit.
Another possibility, namely, that the subunit IIa event layer itself was formed in combination with the Holocene marine transgression and that the transgressive surface and stratigraphic lag may stratigraphically resemble the effects of a tsunami wave, is considered unlikely because of the clearly heterogeneous microfossil signature of the sediment and the numerous sedimentological traces of high-energy processes as repeatedly reported typical of tsunami impact (e.g., [105,108]). For these reasons, we consider unit IIa as being the direct consequence of tsunami impact, in this case most probably associated with the SST.
In contrast, the sedimentological features of subunit IIc resemble more the type of bioturbated muddy and shelly sands deposited on top of an erosional surface within the course of the Holocene marine transgression as observed at different sites along the North Sea coast [13,112,113]. Based on this, we consider subunit IIc as being directly linked to the Holocene marine transgression.

6.4. Synopsis and Geographical Implications

The Garding-2A record, presented in this paper, reveals—for the first time—strong sedimentary and microfaunal indications of the SST impact on the North Sea coast of Germany. Subunit IIa shows clear tsunami signatures and was found contemporaneous with SST deposits described by [3,13] and many other researchers for the northern part of the North Sea Basin (Figure 14; Section 1 and Section 2). It is only subsequent to the SST landfall and an interim phase of highly eutrophicated low-energy conditions that the Holocene marine transgression occurred between ca. 7.3 and 6.5 ka cal BP (Figure 12). Associated with the Holocene transgression, energetically as well as ecologically stable shallow marine conditions of an Eider-related tidal channel system were established. Marine conditions lasted several thousands of years before they were followed by littoral and/or marsh conditions ([55]: Figure 6).
The SST seems to have propagated several tens of kilometers along the southeastern North Sea coast intruding the palaeo-Eider estuarine system and leaving a distinct high-energy tsunami bed slightly below the relative sea level at that time (Figure 12, Figure 13 and Figure 14). Besides the mentioned geoscientific traces of the SST described from Rømø Island by [13], the Garding example is another piece of evidence that the SST most probably impacted the entire southeastern and southern North Sea basin. Other than presumed so far (Section 1 and Section 2, see also ([114], p. 141), it seems that the energy related with the SST on its way along the 900–1000 km long shallow continental shelf of the North Sea was not essentially dissipated. The SST rather seems to have hit the palaeocoastline and caused tsunami run-up in the range of several meters on Rømø Island, Denmark ([13], pp. 1047, 1050), or largely intruded estuarine systems of the coast, causing tsunami-related erosion and the deposition of sandy tsunami beds in the range of tens of kilometers distant from the contemporary coastline of North Frisia, Germany (this study).
Existing numerical tsunami simulation studies have so far negated a tsunami threat to the German North Sea coasts ([14,15]; also [16] for the Netherlands); only [39] attest a specific tsunami risk for the North Sea in general and find tsunami energy especially focused at the Frisian Islands, which is in good accordance with the results of this paper regarding SST effects. Our paper presents geoscientific evidence of tsunami impact most probably caused by the SST on the, so far, southernmost point of the southeastern North Sea Basin. Based on the results of [13] and our paper, numerical simulations are recommended to be recalculated and calibrated using field evidence, an approach that was successfully developed and repeatedly applied in palaeotsunami research (e.g., [115,116,117].
Beyond this, our results from North Frisia may indicate that tsunamis might be a phenomenon much more common to the German North Sea coast as considered so far. Refs. [20,21] provided detailed evidence for the historic North Sea (meteo-)tsunami that occurred on 5 June 1858. Further tsunamis are reported for 1607 and 1755 [118]. Moreover, ref. [21] suggests to investigate if some of the medieval extreme storm events that have been described for the German North Sea based on historical descriptions, may rather represent candidates for tsunami events (most probably meteotsunamis; [21]) or storm events combined with meteotsunamis, so far unidentified. Especially, ref. ([20], p. 938) hypothesize that the AD 1634 event of the 2nd Grote Mandrenke (Burchardi Flood) may have actually been a tremendous (meteo-)tsunami bringing forward specific tsunami-type phenomena that were observed during the event. The eyewitness Heimreich, for example, describes that the North Sea between Flensburg and Warnemünde fell dry before the sea water became subject to a quick rise and coastal lowlands were catastrophically flooded ([119], pp. 137–138). Another eyewitness, Lobedanz, reports on a great additional rise of water during low tide on Nordstrand ([120], p. 86), both observations being atypical of storms. According to the eyewitness P. Sax, massive damage along the North Frisian coasts was caused by extraordinary flood levels reaching 4.2–6 m (Sax, in ([121], pp. 102–103). Detailed geoscientific investigations should, therefore, also be undertaken for cases which seem to be already fully understood.
Overall, the tsunami risk for the North Sea seems higher than previously suggested and it should be re-evaluated in favour of a more realistic and reliable coastal protection even if the expectable frequency for an event like the SST is low. This is especially true for highly vulnerable infrastructure such as nuclear power plants located in estuarine configurations of the Weser and Elbe rivers and thus contradicts the assessments by [122,123] that no dedicated measures for protection against tsunamis in the German Bight are necessary for such installations. The present North Sea shelf constellation as well as the present coastal topography, against all previous assumptions, seem not to provide (sufficient) shelter or protection against tsunami propagation independent of the cause of (future) tsunami landfall.

7. Conclusions

Geoscientific investigations were carried out in North Frisia in order to search for traces of the SST at the German North Sea coast. A 20 m long sediment core was recovered from Eiderstedt Peninsula near Garding from which the section between 15 and 20 m below ground surface was investigated in detail. High-resolution DP sensing data as well as results of multi-proxy analyses of the sediment core were used to reconstruct palaeoenvironmental as well as palaeogeographical conditions.
(i)
Based on sedimentary and microfaunal evidence, we identified a high-energy event layer between 19.85 and 19.68 m b.s., representing an allochthonous intermingled marine facies lying on top of autochthonous fluvial deposits of the palaeo-Eider estuary system. This event facies bears sedimentary characteristics typical of tsunami impact such as a basal erosional unconformity, abundant shell debris, fining-upward in grain size and an upward increase of organic matter as well as incorporated muddy rip-up clasts.
(ii)
Considering the entire chronostratigraphy obtained for core Garding-2(A), the age of the tsunami bed most probably coincides with the SST (Garding-2A scenarioa and scenariob: 8152–7632 cal BP and 8064–7424 cal BP compared to SST ages by [3]: minimum 8176–7941 cal BP, maximum 8346–8029 cal BP, (weighted) mean age 8172–8031 cal BP).
(iii)
The Storegga slide tsunami layer identified at Garding was deposited at or maximum ca. 1–1.5 m below the local relative sea level at that time and tens of kilometers inland from the mouth of the palaeo-Eider estuary. This palaeogeographical setting along with sedimentary characteristics allow for the exclusion that the event layer was accumulated during a storm.
(iv)
Based on sedimentological results, the palaeogeographical setting and chronostratigraphic data, we suggest that the high-energy layer identified in core Garding-2A was deposited by the SST. Thus, this paper gives evidence, for the first time, of indications for (a) high-energy tsunami landfall along German North Sea coast and (b) the southernmost point of Storegga tsunami impact in the North Sea.
(v)
We identified the sedimentary unit found on top of the SST layer (unit IIc) as representing the Holocene marine transgression at Eiderstedt Peninsula at the end of the 8th mill. BP (7.3–6.5 ka cal BP), which correlates well with the findings for Rømø Island. The transgression finally opens up the palaeo-Eider estuary into a tidal channel system under permanent marine conditions as evidenced my sedimentary features and microfaunal assemblages.
(vi)
Other than presumed so far, we assume that the entire southern North Sea coast was affected by the SST, but that sedimentary signals have not yet been identified or have been misinterpreted.
(vii)
This paper gives reason to assume that the German North Sea coast is not protected from tsunami events but that tsunamis seem to be a common, low-frequency phenomenon in this region (see also [88,118]). The tsunami threat to the present coast, especially along the estuaries, should not be underestimated, especially for highly vulnerable infrastructure such as nuclear power plants (e.g., those located in the Elbe estuary).

Author Contributions

Conceptualization, A.V. and F.S.; Data curation, T.W., P.F., M.F., A.G. and F.S.; Funding acquisition, A.V.; Investigation, A.V., H.H., T.W., A.S., L.S., H.W., P.F., F.B., B.R.R., M.F. and F.S.; Methodology, T.W. and P.F.; Project administration, A.V.; Validation, F.B., B.R.R. and F.S.; Visualization, H.H., T.W., A.S. and L.S.; Writing—original draft, A.V.; Writing—review and editing, H.H., A.S., P.F., F.B., B.R.R., M.F., A.G. and F.S. All authors have read and agreed to the published version of the manuscript.

Funding

We acknowledge funding by the Deutsche Forschungsgemeinschaft (German Research Foundation), project ID: VO 938/31-1.

Data Availability Statement

All the scientific data relevant for this manuscript will be uploaded to the scientific data repository PANGAEA under the following doi: https://issues.pangaea.de/browse/PDI-34351, accessed on 1 October 2024.

Acknowledgments

Sincere thanks are due to Klaus-Peter Hechmann, who allowed us to use his grounds for drilling vibracore Garding-2A in September 2017, for his helpful logistical and technical support and for delicious meals that helped the team come through the stressful days of field work. We further express our thanks to Hannah Wahlen and Vera Werner for their help during field work. We finally acknowledge various support by Kurt Emde, Izea Berdicever and Gerlinde Borngässer, Geolabor at the Institute of Geography, Johannes Gutenberg-Universität Mainz, during the laboratory campaign.

Conflicts of Interest

The authors declare no conflict of interest.

References

  1. Haflidason, H.; Lien, R.; Sejrup, H.P.; Forsberg, C.F.; Bryn, P. The dating and morphometry of the Storegga Slide. Mar. Pet. Geol. 2005, 22, 123–136. [Google Scholar] [CrossRef]
  2. Weninger, B.; Schulting, R.; Bradtmöller, M.; Clare, L.; Collard, M.; Edinborough, K.; Hilpert, J.; Jöris, O.; Niekus, M.; Rohling, E.J.; et al. The catastrophic final flooding of Doggerland by the Storegga Slide tsunami. Doc. Praehist. 2008, 25, 1–24. [Google Scholar] [CrossRef]
  3. Bondevik, S.; Stormo, S.K.; Skjerdal, G. Green mosses date the Storegga tsunami to the chilliest decades of the 8.2 ka cold event. Quat. Sci. Rev. 2012, 45, 1–6. [Google Scholar] [CrossRef]
  4. Brown, H.E.; Holbrook, W.S.; Hornbach, M.J.; Nealon, J. Slide structure and role of gas hydrate at the northern boundary of the Storegga Slide, offshore Norway. Mar. Geol. 2006, 229, 179–186. [Google Scholar] [CrossRef]
  5. Dawson, A.G.; Long, D.; Smith, D.E. The Storegga slides: Evidence from eastern Scotland for a possible tsunami. Mar. Geol. 1988, 82, 271–276. [Google Scholar] [CrossRef]
  6. Dawson, A.; Bondevik, S.; Teller, J.T. Relative Timing of the Storegga submarine slide, methane release, and climate change during the 8.2 ka cold event. Holocene 2011, 21, 1167–1171. [Google Scholar] [CrossRef]
  7. Harbitz, C.B. Model simulations of tsunamis generated by the Storegga slides. Mar. Geol. 1992, 105, 1–21. [Google Scholar] [CrossRef]
  8. Henry, R.F.; Murty, T.S. Model studies of the effects of the Storegga slide tsunami. Sci. Tsunami Hazards 1992, 10, 51–62. [Google Scholar]
  9. Bondevik, S.; Magerud, J.; Dawson, S.; Dawson, A.; Lohne, Ø. Evidence for three North Sea tsunamis at the Shetland Islands between 8000 and 1500 years ago. Quat. Sci. Rev. 2005, 24, 1757–1775. [Google Scholar] [CrossRef]
  10. Hill, J.; Collins, G.S.; Avdis, A.; Kramer, S.C.; Piggott, M.D. How does multiscale modelling and inclusion of realistic palaeobathymetry affect numerical simulation of the Storegga slide tsunami? Ocean. Model. 2014, 83, 11–25. [Google Scholar] [CrossRef]
  11. Gaffney, V.; Fitch, S.; Bates, M.; Ware, R.L.; Kinnaird, T.; Gearey, B.; Hill, T.; Telford, R.; Batt, C.; Stern, B.; et al. Multi-proxy characterisation of the Storegga tsunami and its impact on the early Holocene landscapes of the southern North Sea. Geosciences 2020, 10, 270. [Google Scholar] [CrossRef]
  12. Walker, J.; Gaffney, V.; Fitch, S.; Muru, M.; Fraser, A.; Bates, M.; Bates, R. A great wave: The Storegga tsunami and the end of Doggerland? Antiquity 2020, 94, 1409–1425. [Google Scholar] [CrossRef]
  13. Fruergaard, M.; Piasecki, S.; Johannessen, P.N.; Noe-Nygaard, N.; Andersen, T.J.; Pejrup, M.; Nielsen, L.H. Tsunami propagation over a wide, shallow continental shelf caused by the Storegga slide, southeastern North Sea, Denmark. Geology 2015, 43, 1047–1050. [Google Scholar] [CrossRef]
  14. Bork, I.; Dick, S.; Kleine, E.; Müller-Navarra, S.H. Tsunami-Untersuchungen für die deutsche Nordseeküste. Die Küste 2007, 72, 65–103. Available online: https://hdl.handle.net/20.500.11970/101573 (accessed on 1 October 2024).
  15. Lehfeldt, R.; Milbradt, P.; Plüss, A.; Schüttrumpf, H. Propagation of a tsunami-wave in the North Sea. Die Küste 2007, 72, 105–123. Available online: https://hdl.handle.net/20.500.11970/101574 (accessed on 1 October 2024).
  16. Kulkarni, R.; Zimmermann, N.; Lanckriet, T.; Breugem, A. Inundation risk due to landslide-generated tsunami in the North-Sea. In Proceedings of the XXIVth TELEMAC-MASCARET User Conference, Graz, Austria, 17–20 October 2017; Dorfmann, C., Zenz, G., Eds.; Graz University of Technology: Graz, Austria, 2017; pp. 23–29. [Google Scholar]
  17. Behre, K.-E. Landschaftsgeschichte Norddeutschlands: Umwelt und Siedlung von der Steinzeit bis zur Gegenwart; Wachholtz Verlag: Kiel, Germany, 2008; 308p. [Google Scholar]
  18. Donkers, H. Een Tsunami aan Onze Kust. Geografie. November/December 2017. Available online: https://geografie.nl/artikel/een-tsunami-aan-onze-kust (accessed on 2 September 2021).
  19. Frère, A.; Daubord, C.; Gailler, A.; Hérbert, H. Sea level surges of June 2011 in the NE Atlantic Ocean: Observations and possible interpretation. Nat. Hazards 2014, 74, 179–196. [Google Scholar] [CrossRef]
  20. Newig, J.; Kelletat, D. The North Sea tsunami of June 5, 1858. J. Coast. Res. 2011, 27, 931–941. [Google Scholar] [CrossRef]
  21. Newig, J. Merkmale eines historischen Tsunamis in der Nordsee. Mainz. Geogr. Stud. 2013, 55, 95–110. [Google Scholar]
  22. Wartenberg, W.; Vött, A.; Freund, H.; Hadler, H.; Frechen, M.; Willershäuser, T.; Schnaidt, S.; Fischer, P.; Obrocki, L. Evidence of isochronic transgressive surfaces within the Jade Bay tidal flat area, southern German North Sea coast—Holocene event horizons of regional interest. Z. Geomorphol. Suppl. 2013, 57, 229–256. [Google Scholar] [CrossRef]
  23. Dawson, A.G.; Long, D.; Smith, D.E. Evidence for a tsunami from a Mesolithic site in Inverness, Scotland. J. Archaeol. Sci. 1990, 17, 509–512. [Google Scholar] [CrossRef]
  24. Nyland, A.J.; Walker, J.; Warren, G. Evidence of the Storegga Tsunami 8200 BP? An archaeological review of impact after a large-scale marine event in Mesolithic Northern Europe. Front. Earth Sci. 2021, 9, 767460. [Google Scholar] [CrossRef]
  25. Bondevik, S.; Svendsen, J.I.; Mangerud, J. Tsunami sedimentary facies deposited by the Storegga tsunami in shallow marine basins and coastal lakes, western Norway. Sedimentology 1997, 44, 1115–1131. [Google Scholar] [CrossRef]
  26. Bondevik, S.; Svendsen, J.I.; Johnson, G.; Mangerud, J.; Kaland, P.E. The Storegga tsunami along the Norwegian coast, its age and runup. Boreas 1997, 26, 29–53. [Google Scholar] [CrossRef]
  27. Bondevik, S.; Svendsen, J.I.; Mangerud, J. Distinction between the Storegga tsunami and the Holocene marine transgression in coastal basin deposits of western Norway. J. Quaternraay Sci. 1998, 13, 529–537. [Google Scholar] [CrossRef]
  28. Bondevik, S.; Mangerud, J.; Dawson, S.; Dawson, A.; Lohne, Ø. Record-breaking height for 8000-year-old tsunami in the North Atlantic. EOS Trans. Am. Geophys. Union 2003, 84, 289–293. [Google Scholar] [CrossRef]
  29. Rasmussen, H.; Bondevik, S.; Corner, G.D. Holocene relative sea level history and Storegga tsunami run-up in Lyngen, northern Norway. J. Quat. Sci. 2018, 33, 393–408. [Google Scholar] [CrossRef]
  30. Smith, D.E.; Shi, S.; Cullingford, R.A.; Dawson, A.G.; Dawson, S.; Firth, C.R.; Foster, I.D.L.; Fretwell, P.T.; Haggart, B.A.; Holloway, L.K.; et al. The Holocene Storegga slide tsunami in the United Kingdom. Quat. Sci. Rev. 2004, 23, 2291–2321. [Google Scholar] [CrossRef]
  31. Bondevik, S. The sands of tsunami time. Nature 2008, 455, 1183–1184. [Google Scholar] [CrossRef]
  32. Vasskog, K.; Waldmann, N.; Bondevik, S.; Nesje, A.; Chapron, E.; Ariztegui, D. Evidence of the Storegga tsunami run-up at the head of Nordfjord, western Norway. J. Quat. Sci. 2013, 28, 391–402. [Google Scholar] [CrossRef]
  33. Cascalho, J.; Costa, P.; Dawson, S.; Milne, F.; Rocha, A. Heavy mineral assemblages of the Storegga tsunami deposit. Sediment. Geol. 2016, 334, 21–33. [Google Scholar] [CrossRef]
  34. Long, A.J.; Barlow, N.L.M.; Dawson, S.; Hill, J.; Innes, J.B.; Kelham, C.; Milne, F.D.; Dawson, A. Lateglacial and Holocene relative sea-level changes and first evidence for the Storegga tsunami in Sutherland, Scotland. J. Quat. Sci. 2016, 31, 239–255. [Google Scholar] [CrossRef]
  35. Chagué-Goff, C.; Goff, J.; Wong, H.K.Y.; Cisternas, M. Insights from geochemistry and diatoms to characterise a tsunami’s deposit and maximum inundation limit. Mar. Geol. 2015, 359, 22–34. [Google Scholar] [CrossRef]
  36. Hill, J.; Avdis, A.; Mouradian, S.; Collins, G.; Piggott, M. Was Doggerland catastrophically flooded by the Mesolithic Storegga tsunami? arXiv 2017, arXiv:1707.05593v1. [Google Scholar]
  37. Waddington, C.; Wicks, K. Resilience or wipe out? Evaluating the convergent impacts of the 8.2 ka event and Storegga tsunami on the Mesolithic of northeast Britain. J. Archaeol. Sci. Rep. 2017, 14, 692–714. [Google Scholar] [CrossRef]
  38. Blankholm, H.P. In the wake of the wake. An investigation of the impact of the Storegga tsunami on the human settlement of inner Varangerfjord, northern Norway. Quat. Int. 2020, 549, 65–73. [Google Scholar] [CrossRef]
  39. Chacón-Barrantes, S.; Narayanan, R.; Mayerle, R. Several tsunami scenarios at the North Sea and their consequences at the German Bight. Sci. Tsunami Hazards 2013, 32, 8–28. [Google Scholar]
  40. Dawson, A.G.; Dawson, S.; Bondevik, S.; Costa, P.; Hill, J.; Stewart, I. Reconciling SToregga tsunami sedimentation pattersn with modelled wave heights: A discussioin from the Shetland Isles field laboratory. Sedimentology 2020, 67, 1344–1353. [Google Scholar] [CrossRef]
  41. Bateman, M.D.; Kinnaird, T.C.; Hill, J.; Ashurst, R.A.; Mohan, J.; Bateman, R.B.I.; Robinson, R. Detailing the impact of the Storegga Tsunami at Montrose, Scotland. Boreas 2021, 50, 1059–1078. [Google Scholar] [CrossRef]
  42. Röbke, B.R.; Vött, A.; Willershäuser, T.; Fischer, P.; Hadler, H. Considering coastal palaeogeographical changes in a numerical tsunami model—A progressive base to compare simulation results with field traces from three coastal settings in western Greece. Z. Geomorphol. Suppl. 2015, 59, 157–188. [Google Scholar] [CrossRef]
  43. Röbke, B.R.; Schüttrumpf, H.; Vött, A. Effects of different boundary conditions and palaeotopographies on the onshore response of tsunamis in a numerical model—A case study from western Greece. Cont. Shelf Res. 2016, 124, 182–199. [Google Scholar] [CrossRef]
  44. Fruergaard, M.; Andersen, T.J.; Johannessen, P.N.; Nielsen, L.H.; Pejrup, M. Major coastal impact induced by a 1000-year storm event. Sci. Rep. 2013, 3, 1051. [Google Scholar] [CrossRef]
  45. Leibniz-Institut für Angewandte Geophysik (LIAG). Informationsblatt zur Forschungsbohrung Garding; LIAG: Hannover, Germany, 2011; 8p. [Google Scholar]
  46. Grube, A.; Frechen, M.; Hesse, K.; Proborukmi, M.S.; Urban, B.; Wonik, T.; Zhang, J. Die Forschungsbohrung Garding-2—Ein neues wichtiges Klima- und Paläoumwelt-Archiv an der Westküste Schleswig-Holstein. Nat.-Landeskd. Z. Schleswig-Holst. Hambg. Mecklenbg. 2019, 126, 1–15. [Google Scholar]
  47. Adams, C.K.H. Faziesuntersuchungen an Tertiären und Quartären Sedimenten der Bohrung Garding-2. Ph.D. Thesis, Fachbereich Chemie, Pharmazie, Geowissenschaften und Geographie, Johannes Gutenberg-Universität Mainz, Mainz, Germany, 2021; 204p. [Google Scholar] [CrossRef]
  48. Panten, A.; Porada, H.T.; Steensen, T. (Eds.) Eiderstedt: Eine Landeskundliche Bestandsaufnahme im Raum St. Peter-Ording, Garding, Tönning und Friedrichstadt; Volume 72 Landschaften in Deutschland. Werte der deutschen Heimat; Köln/Weimar/Wien; Böhlau: Vienna, Austria, 2013; 400p. [Google Scholar]
  49. Panten, A. Der Reichtum der Rungholter: Sage oder Wirklichkeit? In Rungholt: Rätselhaft und Widersprüchlich; Newig, J., Haupenthal, U., Eds.; Druck- und Verlagsgesellschaft: Husum, Germany, 2016; pp. 41–45. [Google Scholar]
  50. Newig, J. Nordfrieslands Küste zwischen Landgewinn und Landverlust. Geogr. Rundsch. 2014, 3, 4–12. [Google Scholar]
  51. Prange, W. Die Bedeichungsgeschichte der Marschen in Schleswig-Holstein. Probl. Küstenforschung Südlichen Nord. 1986, 16, 1–53. [Google Scholar]
  52. Ehlers, J. The Morphodynamics of the Wadden Sea; Balkema: Rotterdam, The Netherlands, 1988; 397p. [Google Scholar]
  53. Meier, D. Man and environment in the marsh area of Schlewsig-Holstein from Roman until Medieval times. Quat. Int. 2004, 112, 55–69. [Google Scholar] [CrossRef]
  54. Proborukmi, M.S.; Urban, B.; Frechen, M.; Grube, A.; Rolf, C. Late Pliocene-Pleistocene record of the Garding-2 research drill core, Northwest Germany. Z. Dtsch. Ges. Geowiss. 2017, 168, 141–167. [Google Scholar] [CrossRef]
  55. Zhang, J.; Tsukamoto, S.; Grube, A.; Frechen, M. OSL and 14C chronologies of a Holocene sedimentary record (Garding-2 core) from the German North Sea coast. Boreas 2014, 43, 856–868. [Google Scholar] [CrossRef]
  56. Proborukmi, M.S.; Urban, B. Palaeoenvironmental investigations of the Holocene sedimentary record of the Garding-2 research drill core, northwestern Germany. Z. Dtsch. Ges. Geowiss. 2017, 168, 39–51. [Google Scholar] [CrossRef]
  57. Albert, J.; Schärf, M.; Enzmann, F.; Waltl, M.; Sirocko, F. Local radon flux maxima in the quaternary sediments of Schleswig-Holstein (Germany). Int. J. Earth Sci. 2021, 110, 1501–1516. [Google Scholar] [CrossRef]
  58. Lehné, R.; Sirocko, F. Recent vertical crustal movements and resulting surface deformation within the North German Basin (Schleswig-Holstein) derived by GIS-based analysis of repeated precise leveling data. Z. Ges. Geowiss. 2010, 161, 175–188. [Google Scholar] [CrossRef]
  59. McCall, W. Application of Geoprobe HPT Logging System for geo-environmental investigations. Geoprobe Tech. Bull. MK 2011, 3184, 1–36. [Google Scholar]
  60. Obrocki, L.; Vött, A.; Wilken, D.; Fischer, P.; Willershäuser, T.; Koster, B.; Lang, F.; Papanikolaou, I.; Rabbel, W.; Reicherter, K. Tracing tsunami signatures of the AD 551 and AD 1303 tsunamis at the Gulf of Kyparissia (Peloponnese, Greece) using Direct Push in situ sensing techniques combined with geophysical studies. Sedimentology 2020, 67, 1274–1308. [Google Scholar] [CrossRef]
  61. Köber, R.; Hornbruch, G.; Leven, C.; Tischer, L.; Großmann, J.; Dietrich, P.; Weiß, H.; Dahmke, A. Evaluation of Combined Direct-Push Methods Used for Aquifer Model Generation. Ground Water 2009, 47, 536–546. [Google Scholar] [CrossRef] [PubMed]
  62. McCall, W.; Christy, T.M.; Pipp, D.; Terkelsen, M.; Christensen, A.; Weber, K.; Engelsen, P. Field application of combined membrane-interface probe and hydraulic profiling tool (MiHpt). Ground Water Monit. Remediat. 2014, 34, 85–95. [Google Scholar] [CrossRef]
  63. Geoprobe. Geoprobe Hydraulic Profiling Tool (HPT) System. Standard Operating Procedure. Geoprobe Technical Bulletin MK313; Kejr, Inc.: Salina, KS, USA, 2015; pp. 1–22. [Google Scholar]
  64. Harrington, G.A.; Hendry, M.J. Using Direct-Push EC Logging to delineate heterogeneity in a clay-rich aquitard. Groundw. Monit. Remediat. 2006, 26, 92–100. [Google Scholar] [CrossRef]
  65. Wunderlich, T.; Fischer, P.; Wilken, D.; Hadler, H.; Erkul, E.; Mecking, R.; Günther, T.; Heinzelmann, M.; Vött, A.; Rabbel, W. Constraining electric resistivity tomography by direct push electric conductivity logs and vibracores: An exemplary study of the Fiume Morto silted riverbed (Ostia Antica, western Italy). Geophysics 2018, 83, B87–B103. [Google Scholar] [CrossRef]
  66. Lunne, T.; Robertson, P.K.; Powell, J.J.M. Cone Penetration Testing in Geotechnical Practice; Taylor and Francis Group: London, UK; New York, NY, USA, 2002; 312p. [Google Scholar]
  67. Robertson, P.K. Cone penetration test (CPT)-based soil bahviour type (SBT) classification system—An update. Can. Geotech. J. 2016, 23, 1910–1927. [Google Scholar] [CrossRef]
  68. Robertson, P.K. Interpretation of cone penetration tests—A unified approach. Can. Geotech. J. 2009, 46, 1337–1355. [Google Scholar] [CrossRef]
  69. Hausmann, J.; Dietrich, P.; Vienken, T.; Werban, U. Technique, analysis routines, and application of direct push-driven in situ color logging. Environ. Earth Sci. 2016, 75, 957. [Google Scholar] [CrossRef]
  70. Köhn, M. Korngrößenbestimmung vermittels Pipettanalyse. Tonind.-Ztg. 1929, 55, 729–731. [Google Scholar]
  71. Barsch, H.; Billwitz, K.; Bork, H.-R. (Eds.) Arbeitsmethoden in Physiogeographie und Geoökologie; Klett: Stuttgart, Germany, 2000; 612p. [Google Scholar]
  72. DIN EN 15935:2012-11; Sludge, Treated Biowaste, Soil and Waste—Determination of Loss on Ignition; German version EN 15935:2012. German Institute for Standardisation: Berlin, Germany, 2012.
  73. Schlichting, E.; Blume, H.-P.; Stahr, K. Bodenkundliches Praktikum: Eine Einführung in Pedologisches Arbeiten für Ökologen, Insbesondere Land- und Forstwirte, und für Geowissenschaftler, 2nd ed.; Spektrum Akademischer Verlag: Berlin/Wien, Germany, 1995. [Google Scholar]
  74. Blume, H.-P.; Stahr, K.; Leinweber, P. Bodenkundliches Praktikum: Eine Einführung in Pedologisches Arbeiten für Ökologen, Insbesondere Land- und Forstwirte, und für Geo- und Umweltwissenschaftler, 3rd ed.; Spektrum Akademischer Verlag: Heidelberg, Germany, 2010; 255p. [Google Scholar]
  75. Donato, S.V.; Reinhardt, E.G.; Boyce, J.I.; Rothaus, R.; Vosmer, T. Identifying tsunami deposits using bivalve shell taphonomy. Geology 2008, 36, 199–202. [Google Scholar] [CrossRef]
  76. Mischke, S.; Schudack, U.; Bertrand, S.; Leroy, S.A.G. Ostracods from a Marmara Sea lagoon (Turkey) as tsunami indicators. Quat. Int. 2012, 261, 156–161. [Google Scholar] [CrossRef]
  77. Pilarczyk, J.E.; Dura, T.; Horton, B.P.; Engelhart, S.E.; Kemp, A.C.; Sawai, Y. Microfossils from coastal environments as indicators of paleo-earthquakes, tsunamis and storms. Palaeogeogr. Palaeoclimatol. Palaeoecol. 2014, 413, 144–157. [Google Scholar] [CrossRef]
  78. Engel, M.; Pilarczyk, J.; May, S.M.; Brill, D.; Garrett, E. Geological Records of Tsunamis and Other Extreme Waves; Elsevier: Amsterdam, The Netherlands, 2020; 848p. [Google Scholar]
  79. Murray, J.W. Ecology and Applications of Benthic Foraminifers; Cambridge University Press: Cambridge, UK, 2006; 426p. [Google Scholar]
  80. Murray, J.W. Living benthic foraminifera: Biogeographical distributions and the significance of rare morphospecies. J. Micropalaeontology 2013, 32, 1–58. [Google Scholar] [CrossRef]
  81. Sen Gupta, B.K. Introduction to modern Foraminifera. In Modern Foraminifera; Sen Gupta, B.K., Ed.; Kluwer Academic Publisher: Dordrecht, The Netherlands, 1999; pp. 3–6. [Google Scholar]
  82. Sen Gupta, B.K. Systematics of modern Foraminifera. In Modern Foraminifera; Sen Gupta, B.K., Ed.; Kluwer Academic Publisher: Dordrecht, The Netherlands, 1999; pp. 7–36. [Google Scholar]
  83. Loeblich, A.R.; Tappan, H.N. Foraminiferal Genera and Their Classification; Springer: New York, NY, USA, 1988; 970p. [Google Scholar]
  84. Rönnfeld, W. Foraminifera a Catalogue of Typical Forms, 4th revised English ed.; Grzybowski Foundation Special Publication 24; Rheinisches Mineralien-Kontor GmbH: Bonn, Germany, 2020; 159p. [Google Scholar]
  85. Scott, D.B.; Medioli, F.S.; Schafer, C.T. Monitoring in Coastal Environments Using Foraminifera and Thecamooebian Indicators; Cambridge University Press: New York, NY, USA, 2001; 192p. [Google Scholar] [CrossRef]
  86. Cimerman, F.; Langer, M.R. Mediterranean Foraminifera; Classis IV: Historia Naturalis, Opera; Academia Scientiarum et Artium Slovenica: Lubljana, Slovenia, 1991; Volume 30, pp. 1–119. [Google Scholar]
  87. Heaton, T.J.; Köhler, P.; Butzin, M.; Bard, E.; Reimer, R.W.; Austin, W.E.N.; Bronk Ramsey, C.; Grootes, P.M.; Hughen, K.A.; Kromer, B.; et al. marine20—The marine radiocarbon age calibration curve (0–55,000 cal BP). Radiocarbon 2020, 62, 779–820. [Google Scholar] [CrossRef]
  88. Reimer, P.; Austin, W.E.N.; Bard, E.; Bayliss, A.; Blackwell, P.G.; Bronk Ramsey, C.; Butzin, M.; Edwards, R.L.; Friedrich, M.; Grootes, P.M.; et al. The IntCal20 Northern Hemisphere radiocarbon age calibration curve (0–55 cal kB). Radiocarbon 2020, 62, 725–757. [Google Scholar] [CrossRef]
  89. Stuiver, M.; Reimer, P.J.; Reimer, R.W. CALIB 8.2 [WWW Program]. 2021. Available online: http://calib.org (accessed on 4 January 2021).
  90. Weidman, C.R. Development and Application of the Mollusc Arctica islandica as a Paleoceanographic Tool for the North Atlantic Ocean. Ph.D. Thesis, MIT/WHOI, Joint Program in Oceanography, Massachusetts Institute of Technology, Cambridge, MA, USA, Woods Hole Oceanographic Institution, Woods Hole, MA, USA, 1995; 203p. [Google Scholar]
  91. Olsson, I.U. Content of 14C in marine mammals from northern Europe. Radiocarbon 1980, 22, 662–675. [Google Scholar] [CrossRef]
  92. Heier-Nielsen, S.; Heinemeir, J.; Nielsen, H.L.; Rud, N. Recent reservoir ages for Danish fjords and marine waters. Radiocarbon 1995, 37, 875–882. [Google Scholar] [CrossRef]
  93. Enters, D.; Haynert, K.; Wehrmann, A.; Freund, H.; Schlütz, F. A new ΔR value for the southern North Sea and its application in coastal research. Neth. J. Geosci. 2021, 100, e1. [Google Scholar] [CrossRef]
  94. Vink, A.; Steffen, H.; Reinhardt, L.; Kaufmann, G. Holocene relative sea-level change, isostatic subsidence and the radial viscosity structure of the mantle of northwest Euoep (Belgium, the Netherlands, Germany, southern North Sea). Quat. Sci. Rev. 2007, 26, 3249–3275. [Google Scholar] [CrossRef]
  95. Elschner, A.; Scheder, J.; Bungenstock, F.; Bartholomä, A.; Becker, T.M.; Capperucci, R.M.; Enters, D.; Karle, M.; Schlütz, F.; Wehrmann, A.; et al. Microfauna- and sedimentology-based facies analysis for palaeolandscape reconstruction in the back-barrier area of Norderney (NW Germany). Neth. J. Geosci. 2021, 100, e4. [Google Scholar] [CrossRef]
  96. Karle, M.; Bungenstock, F.; Wehrmann, A. Holocene coastal landscape development in response to rising sea level in the Central Wadden Sea coastal region. Neth. J. Geosci. 2021, 100, e12. [Google Scholar] [CrossRef]
  97. Frischbutter, A. Recent vertical movements. Brand. Geowiss. Beiträge 2001, 8, 27–31. [Google Scholar]
  98. Lehné, R.; Sirocko, F. Quantification of recent movement potentials in Schleswig-Holstein (Germany) by GIS-based calculation of correlation coefficients. Int. J. Earth Sci. 2005, 94, 1094–1102. [Google Scholar] [CrossRef]
  99. Sirocko, F.; Reicherter, K.; Lehné, R.; Hübscher, C.; Winsemann, J.; Stackebrandt, W. Glaciation, salt and the present landscape. In Dynamics of Complex Intracontinental Basins—The Central European Basin System; Littke, R., Bayer, U., Gajewski, D., Nelskamp, S., Eds.; Springer: Hamburg, Germany, 2009; pp. 232–245. [Google Scholar]
  100. Hadler, H.; Fischer, P.; Obrocki, L.; Heinzelmann, M.; Vött, A. River channel evolution and tsunami impacts recorded in local sedimentary archives—The ‘Fiume Morto’ at Ostia Antica (Tiber River, Italy). Sedimentology 2020, 67, 1309–1343. [Google Scholar] [CrossRef]
  101. Ad-hoc-Arbeitsgruppe Boden. Bodenkundliche Kartieranleitung, 5th ed.; Schweizerbart: Hannover, Germany, 2005; 438p. [Google Scholar]
  102. Gebhardt, H.; Glaser, R.; Radtke, U.; Reuber, P.; Vött, A. (Eds.) Geographie. Physische Geographie und Humangeographie. 3. Auflage; Springer Nature: Berlin/Heidelberg, Germany, 2020; 1272p. [Google Scholar]
  103. Fischer, P.; Wunderlich, T.; Rabbel, W.; Vött, A.; Willershäuser, T.; Baika, K.; Rigakou, D.; Metallinou, G. Combined electrical resistivity tomography (ERT), direct-push electrical conductivity logging (DP-EC) and coring—A new methodological approach in geoarchaeological research. Archaeol. Prospect. 2016, 23, 213–228. [Google Scholar] [CrossRef]
  104. Behre, K.-E. A new Holocene sea-level curve for the southern North Sea. Boreas 2007, 36, 82–102. [Google Scholar] [CrossRef]
  105. Morton, R.A.; Gelfenbaum, G.; Jaffe, B.E. Physical criteria for distinguishing sandy tsunami and storm deposits using modern examples. Sediment. Geol. 2007, 200, 184–207. [Google Scholar] [CrossRef]
  106. Kortekaas, S.; Dawson, A.G. Distinguishing tsunami and storm deposits: An example from Martinhal, SW Portugal. Sediment. Geol. 2007, 200, 208–221. [Google Scholar] [CrossRef]
  107. Hadler, H.; Wilken, D.; Bäumler, S.; Fischer, P.; Rabbel, W.; Willershäuser, T.; Wunderlich, T.; Vött, A. The Trendermarsch Polder (North Frisia, Germany)—Geophysical and geoarchaeological investigations of an anthropogenic medieval coastal landscape and its vulnerability against natural hazards. Geomorphology 2022, 418, 108461. [Google Scholar] [CrossRef]
  108. Röbke, B.R.; Vött, A. The tsunami phenomenon. Prog. Oceanogr. 2017, 159, 296–322. [Google Scholar] [CrossRef]
  109. De Martini, P.M.; Bruins, H.; Feist, L.; Goodman-Tchernov, B.N.; Hadler, H.; Lario, J.; Mastronuzzi, G.; Obrocki, L.; Pantosti, D.; Paris, R.; et al. The Mediterranean Sea and the Gulf of Cadiz as a natural laboratory for paleotsunami research: Recent advancements. Earth-Sci. Rev. 2021, 216, 103578. [Google Scholar] [CrossRef]
  110. Alappat, L.; Vink, A.; Tsukamoto, S.; Frechen, M. Establishing the late Pleistocene-Holocene sedimentation boundary in the southern North Sea using OSL dating of shallow continental shelf sediments. Proc. Geol. Assoc. 2010, 121, 43–54. [Google Scholar] [CrossRef]
  111. Vött, A.; Brückner, H.; May, S.M.; Sakellariou, D.; Nelle, O.; Lang, F.; Kapsimalis, V.; Jahns, S.; Herd, R.; Handl, M.; et al. The Lake Voulkaria (Akarnania, NW Greece) palaeoenvironmental archive—A sediment trap for multiple tsunami impact since the mid-Holocene. Z. Geomorphol. Suppl. 2009, 53, 1–37. [Google Scholar] [CrossRef]
  112. Fruergaard, M.; Andersen, T.J.; Nielsen, L.H.; Johannessen, P.N.; Aagaard, T.; Pejrup, M. High-resolution reconstruction of a coastal barrier system: Impact of Holocene sea-level change. Sedimentology 2015, 62, 928–969. [Google Scholar] [CrossRef]
  113. Fruergaard, M.; Møller, I.; Johannessen, P.N.; Nielsen, L.H.; Andersen, T.J.; Nielsen, L.; Sander, L.; Pejrup, M. Stratigraphy, evolution, and controls of a Holocene transgressive–regressive barrier island under changing sea level: Danish North Sea coast. J. Sediment. Res. 2015, 85, 820–844. [Google Scholar] [CrossRef]
  114. Hijma, M. From River Valley to Estuary: The Early-Mid Holocene Transgression of the Rhine-Meuse Valley, The Netherlands; Netherlands Geographical Studies 389; Utrecht University, Royal Dutch Geographical Society: Utrecht, The Netherlands, 2009; 192p. [Google Scholar]
  115. Röbke, B.R.; Schüttrumpf, H.; Vött, A. Hydro- and morphodynamic tsunami simulation for the Ambrakian Gulf (Greece) and comparison with geoscientific field traces. Geophys. J. Int. 2018, 213, 317–339. [Google Scholar] [CrossRef]
  116. Bahrouni, N.; Meghraoui, M.; Bayraktar, H.B.; Lorito, S.; Zagrarni, M.F.; Nabil Bel Mabrouk, N.B. Evidence of tsunami deposits in East Tunisia coastline contemporaneous of the AD 365 Crete earthquake: Field data and modelling. In Proceedings of the EGU21-9104, Online Event, 19–30 April 2021. [Google Scholar] [CrossRef]
  117. Scardino, G.; Rizzo, A.; De Santis, V.; Kyriakoudi, D.; Rovere, A.; Vacchi, M.; Scicchitano, G. On the origin of multiple tsunami inundation of the archaeological site of Ognina (Sicily): Numerical models and field geological data. In Proceedings of the EGU21-8591, Online, 19–30 April 2021. [Google Scholar] [CrossRef]
  118. Haslett, S.K.; Bryant, E.A. Historic tsunami in Britain since AD 1000: A review. Nat. Hazards Earth Syst. Sci. 2008, 8, 587–601. [Google Scholar] [CrossRef]
  119. Heimreich, A. (reprints: 1819, 1982). Nordfresische Chronik, Bd. 2. Schleswig, Tondern, Leer. 1668. [Google Scholar]
  120. Hinrichs, B. Die Landverderbliche Sündenflut. In Flutkatastrophe 1634; Hinrichs, B., Panten, A., Riecken, B., Eds.; Wachholtz Verlag: Neumünster, Germany, 1985. [Google Scholar]
  121. Müller, F.; Fischer, O. Alt-Nordstrand. Das Wasserwesen an der Schleswig-Holsteinischen Nordseeküste, 2. Teil; Die Inseln: Berlin, Germany; Reimer-Verlag: Berlin, Germany, 1936; 224p. [Google Scholar]
  122. Berg, H.P.; Goertz, R.; Frohmel, T.; Winter, C. Probabilistic safety assessment of external flooding protection for nuclear power plants in Germany. J. Power Energy Syst. 2008, 2, 734–743. [Google Scholar] [CrossRef]
  123. Iancu, A.; Berg, H.-P. Tsunamis and sea level rise in the North and Baltic Seas and potential consequences for nuclear facilities. J. Pol. Saf. Reliab. Assoc. Summer Saf. Reliab. Semin. 2017, 8, 55–66. [Google Scholar]
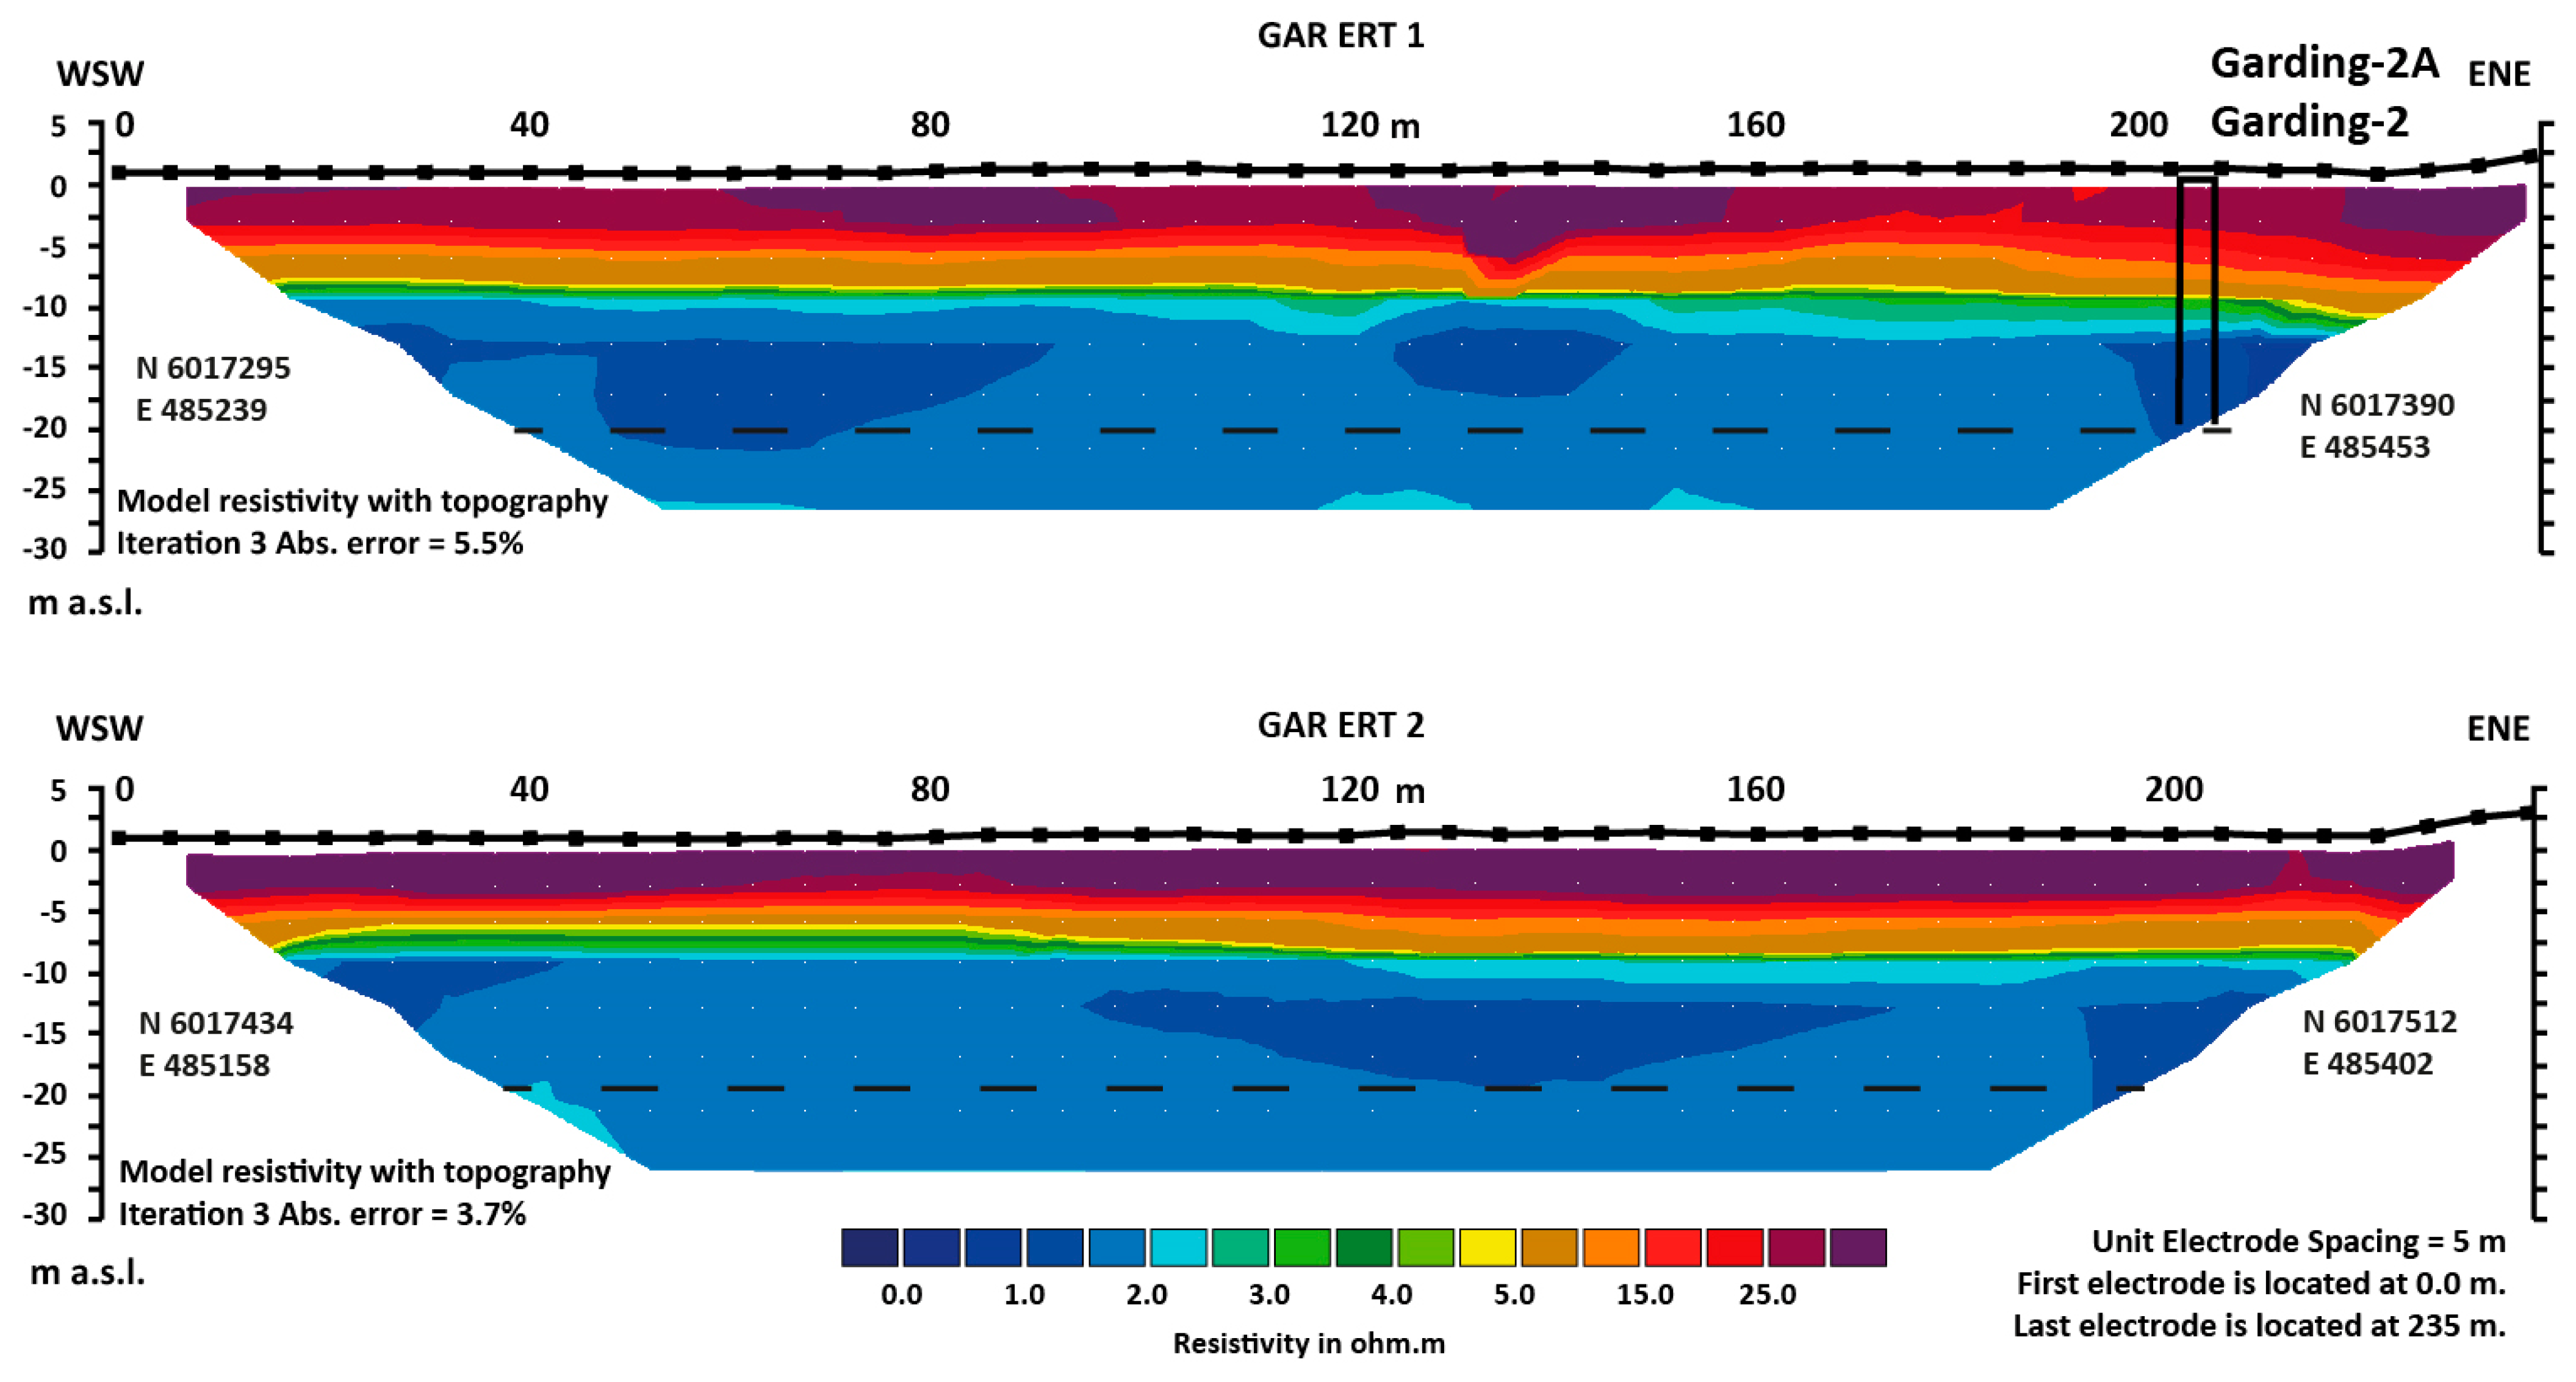
Figure 4. Depth sections of electrical resistivity transects GAR ERT 1 and 2 measured in the immediate northern environs of coring site Garding-2A. Dashed line indicates approximate level of unit IIa considered to be accumulated within the course of the SST. See text for further details.
Geosciences 14 00262 g004
Figure 5. Photograph of the Garding-2 research core section between 15 m and 21 m below ground surface with the location of radiocarbon (yellow asterisks) and OSL samples (red boxes with OSL sample IDs), modified after [55]. Core Garding-2A, presented in this paper, was drilled at exactly the same location (Figure 1 and Figure 3). Ages are summarized in Table 1 and Table 2.
Geosciences 14 00262 g005
Figure 6. Stratigraphic units I to III of sediment core Garding-2A, section 15–20 m b.s., compared with grain size data, loss on ignition (LOI) and Ca concentrations. See text for further details. csa—coarse sand (2000–630 µm); msa—medium sand (630–200 µm); fsa—fine sand (200–125 µm); ffsa—finest fine sand (125–63 µm); si—silt (63–2 µm); c—clay (<2 µm). Grain size scale adapted from [71,101,102]. Open triangles next to stratigraphic log mark sampling depths.
Geosciences 14 00262 g006
Figure 7. Frequency distributions of grain size data (black curves) as well as cumulative grain size data (red curves) obtained for sediment samples from core Garding-2A, classified after sedimentary units (IVI). Samples are grouped according to stratigraphic units I to III. See text for further information. csa—coarse sand (2000–630 µm); msa—medium sand (630–200 µm); fsa—fine sand (200–125 µm); vfsa—very fine sand (125–63 µm); csi—coarse silt (63–20 µm); msi—medium silt (20–6.3 µm); fsi—fine silt (6.3–2 µm); c—clay (<2 µm).
Geosciences 14 00262 g007
Figure 8. Detail photo and grain size data of section 20–18.82 m b.s. of sediment core Garding-2A. See text for further details. csa—coarse sand (2000–630 µm); msa—medium sand (630–200 µm); fsa—fine sand (200–125 µm); vfsa—very fine sand (125–63 µm); si—silt (63–2 µm); c—clay (<2 µm).
Geosciences 14 00262 g008
Figure 9. Results of direct Push (DP) in situ sensing at coring site Garding-2(A) based on Hydraulic Profiling Tools (HPT) and Cone Penetration Testing (CPT). Variables EC (electrical conductivity), HPT (maximum) pressure and Est K (estimated hydraulic conductivity) are derived from HPT sensing, variables u2 (pore pressure), qc (cone resistance) and fs (sleeve friction) are based on CPT data.
Geosciences 14 00262 g009
Figure 10. Results of microfossil analyses conducted for sediment samples from sediment core Garding-2A (black dots). The small figures to the right of the core photo represent sample numbers and sampling depths. Core loss is indicated by lowercase c. Abundance and diversity of foraminifera were found highest for samples of stratigraphic units IIa. The increase is interpreted as the effect of a tsunami impact.
Geosciences 14 00262 g010
Figure 11. Detail photographs of foraminifers and ostracods found in sediment samples from sediment core Garding-2A. 1—Haynesina germanica; 2—Ammonia sp.; 3—Elphidium williamsonii; 4—Elphidium excavatum; 5—Ammonia sp. (deformed). 6—Elphidium williamsonii (deformed); 7—Lagena sp.; 8—Textularia sp.; 9—Orbulina sp., 10—Leptocythere sp.; 11—Pontocythere sp.
Geosciences 14 00262 g011
Figure 12. High-resolution results of Direct Push (DP) in situ sensing compared to stratigraphic units derived from sediment core Garding-2A and geochronological data. Radiocarbon ages are displayed as scenario a and b ages in cal BP (see Table 1); OSL ages are given in ka (before 2012; in italics; see Table 2). The stratigraphy corrected according to DP data is illustrated in red lines and letters. As DP allows obtaining stratigraphic information without any vertical compaction and/or distortion effects, the true thickness of unit II is calculated with 83 cm based on DP data.
Geosciences 14 00262 g012
Figure 13. Palaeogeographical maps showing the coastline as transition from blue to green colours for the time slices 8300 cal BP, 8000 cal BP and 7000 cal BP based on palaeo-sea levels of 22 m, 17 m and 10 m below present sea level (m b.s.l.) after [94], respectively, and topographical and bathymetrical data for the German North Sea coast. Thin black lines depict the present shoreline. Coring site Garding-2A on Eiderstedt Peninsula is marked by an asterisk. Please note that the scenario for 7000 cal BP shows more topographic details than the other ones. This is due to resolution issues of the underlying bathymetric model data used. Scenarios (ac) only represent rough estimates of the palaeogeographical constellation.
Geosciences 14 00262 g013
Figure 14. Local relative sea level data for the German North Sea coast predicted by [94] for the southern North Sea coast based on ice and earth models showing a good correlation with observational sea level data. Curves 14 and 15 are relevant for the Eiderstedt Peninsula (this study). The SST age range based on [3] (ages recalibrated, see Table 1) is marked as the red zone. Calibrated radiocarbon age scenarios a and b obtained for unit IIa of core Garding-2A are marked in green.
Geosciences 14 00262 g014
Table 1. Radiocarbon ages (14C AMS) for the Garding-2 core based on data from [55], recalibrated using different Marine Reservoir Effect models and compared to widely accepted SST calibrated ages after [3].
ReferenceLab. No.Depth (m b.s.)Depth (m b.s.l.)Sample Descriptionδ13C (ppm)14C Age (BP)1σ Max; Min
(cal BP)
2σ Max; Min
(cal BP)
[55]KIA 4867417.4416.17shell−2.71 ± 0.164115 ± 354361–4053 a4496–3893 a
4225–3812 b4412–3601 b
KIA 4806319.5018.23shell−0.32 ± 0.106600 ± 407202–6936 a7311–6789 a
7095–6730 b7253–6551 b
KIA 4867519.6118.34shell−0.85 ± 0.216975 ± 457551–7328 a7661–7209 a
7462–7151 b7596–6958 b
KIA 48676 19.7718.50shell−1.30 ± 0.417445 ± 608005–7747 a8152–7632 a
7907–7590 b8064–7424 b
[3]TUa-2893--Racomitrium sp., green moss, minimum age−21.17231 ± 648165; 79718176–7941
TUa-3055--Pleurozium schreberi, green moss, maximum age−24.67387 ± 728326; 80458346–8029
Mean green mosses, mean age-7300 ± 208169; 80388172–8031
Note: b.s.—below ground surface; b.s.l.—below present mean sea sea level; 1σ (2σ) max; min cal BP– calibrated ages, 1σ (2σ)-range; “;”—total interval between minimum and maximum calibrated ages, age model shows multiple intersections with the calibration curve; calibration based on Calib 8.2 software [88,89]; Marine Reservoir Effect (MRE) considered for calibration using the marine20 calibration curve: a MRE average from 3 data points # 73, 74 and 75 registered in the Calib Marine Reservoir Correction Database from the German Bight according to [90] (ΔR = −160.0 ± 93.0); b MRE average from 11 data points # 685, 687, 688 and 689–696 from Calib Marine Reservoir Correction Database, based on samples collected from near-coast fluvio-lagoon-type environments at the nearby Danish coast expected to be similar to the pre-Storegga conditions near Garding, and another 2 data points # 2136 and 2137 from Calib Marine Reservoir Correction Database, based on samples from Wangerooge island [93] (ΔR = −19 ± 140); Lab. No.—laboratory number according to original data source (see references).
Table 2. Optically stimulated luminescence (OSL) ages of sediment samples collected from the Garding-2 core after [55]. U, Th and K contents, total dose rates and De values. See Figure 5 for exact location of samples. Sample # 2727 (bold frame) was collected from the possible SST layer identified by this study.
Sample IDDepth (m b.s.)Depth
(m b.s.l.)
Uranium
(ppm)
Thorium
(ppm)
Potassium (%)Total Dose Rate (Environmental + Cosmic) (Gy ka−1)De (Gy)Age
(ka before 2012)
271915.3514.081.92 ± 0.106.35 ± 0.331.62 ± 0.101.57 ± 0.135.2 ± 0.113.30 ± 0.27
272116.2214.952.06 ±0.117.22 ± 0.371.63 ± 0.101.61 ± 0.135.0 ± 0.093.13 ± 0.26
272217.2515.980.87 ±0.052.71 ± 0.161.11 ± 0.071.16 ± 0.135.1 ± 0.264.43 ± 0.55
272518.2516.981.29 ±0.073.95 ± 0.221.32 ± 0.081.45 ± 0.146.4 ± 0.154.41 ± 0.45
272719.6518.380.89 ± 0.052.07 ± 0.120.98 ± 0.061.10 ± 0.147.6 ± 0.166.92 ± 0.90
272820.2518.980.52 ± 0.031.15 ± 0.100.76 ± 0.050.83 ± 0.1411.0 ± 0.3213.3 ± 2.2
272920.6519.380.46 ±0.031.01 ± 0.080.74 ± 0.050.82 ± 0.1510.4 ± 0.2212.8 ± 2.3
Disclaimer/Publisher’s Note: The statements, opinions and data contained in all publications are solely those of the individual author(s) and contributor(s) and not of MDPI and/or the editor(s). MDPI and/or the editor(s) disclaim responsibility for any injury to people or property resulting from any ideas, methods, instructions or products referred to in the content.