Abstract
To complement discussions about vegetation history and climate variations in south Greenland, especially during the Norse settlement, we developed a sedimentological multiproxy approach to study a 4300-year-old lacustrine core comprising pollen analysis, NPPs analysis, physical measurements (magnetic susceptibility, density, and grain size), and geochemical analyses (X-ray fluorescence, X-ray diffraction, and elemental analyses). Sediment archives were retrieved from a river-fed lake, Lake Qallimiut, located in the outer fjords of the Vatnahverfi area. The pollen analysis indicated a transition from juniper and willow cover to a dwarf birch forest. Non-pollen palynomorphs (NPPs) suggested grazing pressure and the presence of wild herbivores between 2300 and 1800 cal. BC. From ca. 1000 cal. AD, the presence of Norse farmers was evidenced in this area by archaeological surveys, and pollen analyses confirm the presence of human activities from the 11th century to the end of the 13th century. However, human impact progressively vanished between the 12th and 13th centuries, much earlier than at the other Vatnahverfi sites.
1. Introduction
Due to its sensitivity to climate changes and well-documented historical context, South Greenland is suitable for understanding past interactions between climate changes, environments, and societies. Indeed, the Arctic amplification phenomenon [1] associated with the proximity of the Greenlandic Ice Sheet, the polar front, and the adjacent North Atlantic oceanic currents make South Greenland sensitive to climate variations in continental archives. Moreover, South Greenland has a well-documented human history. Paleo-Eskimo arrived in Greenland approximately 4500 years ago [2]; although some paleo-Eskimo sites have been surveyed in south Greenland, most settlements were localized further north. Norse settled in South Greenland during the Medieval Warm Period (MCA) and developed agropastoralism for the first time in this region [3,4,5]. One century after the Norse colonization, Thule groups arrived in Greenland and are still present today [6], whereas the Norse left Greenland in the 15th century, during the cooling of the Little Ice Age (LIA [7]). Finally, warming temperatures have allowed for the redevelopment of agropastoral activities in South Greenland since the 1920s [8].
In this paper, we develop a sedimentological multiproxy approach to study a 4300-year-old lacustrine core by combining physical (magnetic susceptibility, density, and grain size) and geochemical (X-ray fluorescence, X-ray diffraction, elemental analyses, and organic geochemistry) measurements and pollen analysis. Sediment archives were retrieved from a river-fed lake in the Vatnahverfi area. Recent studies [9] in the Eastern Settlement provide evidence of changes in settlement patterns during the Norse period. While the inner fjords were the first occupied zones, the outer fjords were settled later and abandoned sooner [7,10]. We focused on Qallimiut, a small locality in the Vatnahverfi area in this outer fjord zone along the Alluitsup fjord (Figure 1).
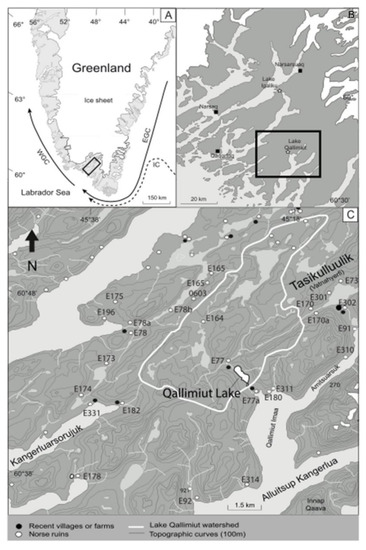
Figure 1.
Location of Lake Qallimiut (indicated by x). (A) Map of Greenland with the oceanic current in solid lines (EGC: East Greenland Current; WGC: West Greenland Current) and dotted line (IC: Irminger Current). (B) Map of South Greenland. (C) Catchment outline (white line). White dots represent Norse archaeological sites, and black dots are recent farms.
We chose to study a lacustrine sequence located nearby medieval-age farm ruins. This zone was one of the most densely settled parts of the medieval Norse Eastern Settlement, occupied by farmer-hunters between ca. AD 980 and 1450. 550 Norse sites are recorded in the Eastern Settlement, with almost a quarter located in the Vatnahverfi region [9]. The sites in this region were recently surveyed during the Vatnahverfi Project (2005–2011), which aimed at describing, inventorying, and dating Norse settlement and land use patterns on a regional scale [9]. This study reveals a short settlement phase, and we hypothesize either an abandonment due to Little Ice Age cooling or a change in the settlement pattern.
2. Background
2.1. Human History
Greenland was first settled by two cultural traditions of hunter–gatherer–fishers: Palaeoeskimo and Thule. Paleo-Eskimo refers to several cultures from the Eastern Arctic (Pre-Dorset, Saqqaq, Independence, and Dorset) who settled in Greenland between ca. 2000 BC and 1100 AD. They were followed by Thule groups, ancestors of the current Inuit population, after 1000 AD [2]. During the ninth century, Norse societies expanded in the North Atlantic islands, importing their subsistence traditions that mixed farming and harvesting wild resources to pristine landscapes [3,4]. Although farming activities in Iceland have lasted until today, Greenlandic farming finally failed around 1450 AD [4,5,10].
The Norse settlement of Greenland from 985 to ca. 1450 AD has been much studied [4,5,9,11,12,13,14,15,16,17,18,19]. The Norse colonization was developed based on an agro-pastoral economy and, at its height, supported a population of about 3000 [4]. The chronology of the Norse demise is unclear and is the object of many theories and much speculation [7,10,19]. Climatic change during the LIA [20,21,22,23,24], changes in European trade systems [7], as well as governance and global economic changes isolated [19] the community and probably caused progressive emigration towards Iceland and Norway. Around the 18th century, the medieval Norse territories in south Greenland were partially reoccupied again by European settlers. From 1920 AD, sheep farming was reintroduced in south Greenland within the heart of the former Norse agricultural areas. Agricultural activity is expected to grow over the next century as anticipated climate warming extends the length of the growing season and increases productivity [25].
2.2. Palaeoenvironmental Context
Various lake and marine sediment records document the Holocene climate variability in the Arctic/Subarctic coastal areas [26,27,28]. Between 8000 and 3000 BC, the Eastern Arctic and most Greenland recorded a thermal optimum [26,27,28]. Then, late Holocene cooling (Neoglacial) occurred in the Arctic in the west and the east [28,29]. Arctic climate is subject to remarkably large inter-annual and multi-decadal climate variability due to the oscillation of atmospheric mass circulation (AO/NAO) and ocean variability (ex-AMO but also ENSO). In addition, there is recent evidence of a significant response to volcanic forcing [30]. These factors all influence temperature, precipitation, and sea ice conditions in the Arctic and Subarctic regions [31].
In South Greenland, the vegetation history of the last eight millennia is characterized by two main phases in pollen diagrams: from 6000 to 2000 BC, Juniperus, Salix, and Alnus are the dominant taxa. Then, wet, and colder conditions during the Neoglacial period enabled the spread of dwarf birch (Betula glandulosa) and white birch (B. pubescens) [11,29]. The pollen records retrieved at coastal and inland locations provide the main features of the vegetation found by the Norse in the 10th century AD and the cultural landscapes that were developed in the region following the landnám. Pollen studies indicate that the Vatnahverfi region was partially wooded before the Norse arrival. The spread of dwarf birch occurred in places sheltered from winds blowing from the Igaliku fjord, meaning inner sites were more wooded than coastal sites [29]. The human impact linked to the Norse settlement usually consisted of birch clearances and the subsequent spread of grasslands to enable farming activities strongly dependent on sheep breeding. Saqqa and Nimerialik sites (E71 and E196, Figure 1) provide evidence of this landscape management (often with the additional occurrence of ruderal taxa [32]) just after the arrival of the Norse in the 10th century AD.
As occurred in other areas of South Greenland [20,21,33,34], the sites of Nimerialik, Saqqa, and Atikilleq were probably abandoned in the 13th century AD [35,36]. At other sites, such as The Mountain Farm [33], human activity is reported from the 11th century and was likely intensified for seasonal hay production from the late 12th to 13th centuries AD. This more prolonged activity may suggest diverse occupation strategies during the later period. After the Norse demise, only Thule groups settled the zone previously occupied by Norse farmers. Since 1920, sheep farming has been reintroduced and has had a growing impact in recent decades [21,22].
2.3. Study Site Location and Archaeological Setting
Lake Qallimiut (informal name) is a proglacial lake (60° 4327 N, 45° 2312 E, 40 m asl) located in the Vatnahverfi area at the end of the Alluitsup Kangerlua fjord, 3 km away from the coast (Figure 1). The lake has a northwest–southeast orientation and is 1500 m long and 450 m wide. It has a surface area of ca. 0.82 km² and a maximum depth of 26 m. Its granite catchment (geological survey of Denmark and Greenland; 19**) has a surface of 112 km2 and a catchment-to-lake ratio of around 137. It includes about twenty upstream lakes, making Lake Qallimiut the last sediment trap of this catchment. Two main tributaries feed it (on the northwest and the eastern shores, respectively), while a single outlet drains it directly into the Alluitsup Kangerlua fjord (Figure 1). This sector of Vatnahverfi has been defined as a sub-oceanic and low arctic zone [37]. Meteorological data over the last 60 years indicate a mean annual temperature of 0.9 °C, a mean annual precipitation of 907 mm, 211 days with frost and 61 days of snow per year [38,39].
Five Norse sites are located in Lake Qallimiut’s catchment (Figure 1). E77a, situated southeast of the study lake, is nowadays drowned at high tide. E77a was probably a large farmstead, perhaps even a local manorial center, with the surrounding sites E180 and E311 likely serving E77a in some capacity [9,40]. A fifth Norse site is located northwest of the lake: E77 is a small farmstead partly excavated in AD 1880 [40]. Presently, two sheep farms are on the lake’s south shore, near the outlet (fodder fields are currently cultivated between the lake and the seashore). Domestic sheep freely roam along the margin. The farming area and adjacent pastures grow common weeds (Ranunculus acris, Rumex acetosa, R. acetosella, and Taraxacum officinale). The catchment is overlooked by slopes reaching 450 m asl covered with herbs and patches of Salix glauca (grey willow) and Betula glandulosa (dwarf birch).
3. Materials and Methods
In July 2011, a 118 cm long sediment core was retrieved from the deepest part of Lake Qallimiut at a depth of 26 m using a UWITEC gravity corer. Core QAL-2011 was used for sedimentological and palynological analyses (Figure 2).
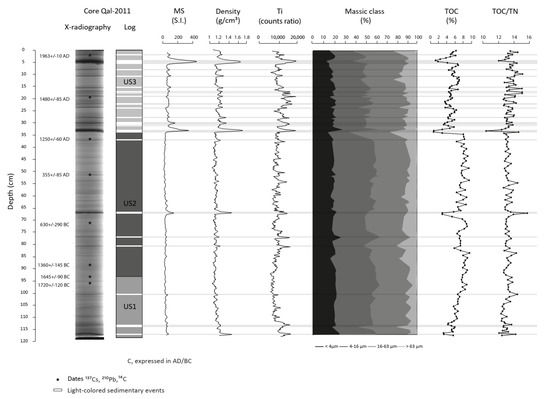
Figure 2.
X–radiographs and logs representing the Lake Qallimiut core’s magnetic susceptibility, γ-density, XRF-Ti, grain size classes, TOC, and TOC/TN ratio measurements. Grey lines highlight the physical and geochemical responses of the white laminae.
The core chronology is based on six AMS radiocarbon dates performed on terrestrial plant macrofossils (Table 1). They were conducted in the Lyon Radiocarbon Laboratory (Lyon, France) and Beta Analytics Laboratory (Miami, FL, USA). In addition, the chronology of the last 150 years is based on short-lived radio-isotopes (210Pb, 137Cs) measured via gamma spectrometry in the underground laboratory of Modane (LSM-CNRS/CEA, Modane, France). Analyses were made on contiguous 0.5 cm-thick samples of 0.8 to 1.7 g dried sediment using a high-efficiency, well-type Ge detector for 24 to 72 h (depending on sample activities). First, the excess 210Pb was calculated as the difference between the activities of the total 210Pb and 226Ra [41]. Then, the 210 Pb chronology was derived for both lakes using the Constant Rate of Supply Model [42], which accommodates variations in the sedimentation rate. Finally, results from radiocarbon and short-lived radio-isotopes were combined with Clam [43] to produce two age–depth models using linear interpolation between dates (Figure 3).

Table 1.
Radiocarbon ages of wood twigs. The calibrated ranges were obtained using Clam and the calibration curve IntCal13 [43].
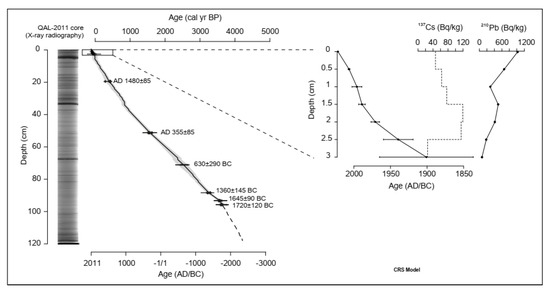
Figure 3.
Age–depth models based on radiocarbon dates and short-lived radio-isotope measurements.
3.1. Non-Destructive Sedimentological Analyses (Figure 2)
Initial core analyses of QAL-2011 include macroscopic descriptions and X-ray radiographs based on 256 grey levels, where intense black corresponds to higher X-ray densities (Scopix system, EPOC laboratory, University of Bordeaux, France) [44]. Afterwards, magnetic susceptibility (MS) measurements were performed on split cores with a GEOTEK multi-sensor core logger at a millimeter resolution. Then, elemental analyses were realized with an X-ray microfluorescence core scanner (XRF, AVAATECH system, EDYTEM laboratory, University of Savoie/Mont Blanc, France) at a resolution of 2 mm in two distinct runs. Titanium (Ti), a conservative element and a marker of detrital fluxes [45], is expressed in this study in peak area counts to illustrate relative variations. Finally, bulk mineralogy was determined by X-ray diffraction (XRD) using a D8 Advance diffractometer (Brucker).
3.2. Destructive Sedimentological Analyses (Figure 2)
The core QAL-2011 core was sampled in 0.5 cm slices. Samples were analyzed for grain size (GS) measurements after treatment with a hydrogen peroxide solution (H2O2, 30%) to digest organic matter. GS was determined using a laser diffraction particle analyzer (LS230 Beckman-Coulter) and presented in GS classes according to the granulometric scale (<4 µm; 4–16 µm; 16–63 µm; >63 µm).
Total carbon (TC) and nitrogen (TN) contents were measured using a Vario MAX CNS analyzer (Elementar). As the carbonate fraction is negligible in these sediments due to granitic catchments [21,29], we assume that TC corresponds to total organic carbon (TOC). It is, therefore, possible to access the relative contribution of lacustrine and terrestrial organic matter (OM) in sediments via the TOC/TN atomic ratio [46].
To improve the identification of sedimentary micro-structures, regions of interest (ROIs) were selected based on the initial description and the results of geophysical and geochemical core logging. Selected ROIs cover sediment transitions, including larger laminae at 32.2 cm. One thin section was sampled from these ROIs and examined with a polarized light microscope. Quantitative organic petrography (QOP) [47] was performed on the ROIs. After eliminating mineral phases with hydrochloric and hydrofluoric treatments, particles were inventoried and counted according to their shape, color, and reflectance using transmitted and reflected light microscopy [48]. Red amorphous particles (rAP), grey amorphous particles (gAP), and lignocellulosic fragments (LCF) are described following a classification used in lake sediments [49,50,51].
3.3. Pollen and Non-Pollen Palynomorphs Analyses
Sediment samples of 1 cm3 were treated following standard pollen preparation procedures, including HCl, NaOH, sieving at 250 µm, HF, acetolysis, and mounting in glycerine jell [52]. Pollen and NPP were identified at ×400 and ×630 magnification via reference to published illustrations, morphological keys [53,54,55,56], and laboratory reference collections. A minimum of 400 dry-land pollen grains were counted per sample.
The taxonomical determination of Betula pollen has relied on morphometrical observations [57,58]. These authors agree that the average diameter of Betula glandulosa (dwarf birch) is below 20 µm, while the pollen of Betula pubescens (white birch) is generally regarded above this size. Corroded Betula pollen grains have been classified as independent pollen types. These grains, belonging to both Betula species, show a degraded granulated-like pattern on the exine surface and a lack of vestibulum walls in the inner part of the pore.
A pollen diagram was constructed using Tilia software [59,60], and percentages were calculated as percentages of total land pollen, which excludes aquatic plants, exotic pollen such as Pinus and other vegetation not found in Greenland, undetermined pollen, ferns, moss, NPPS, and local pollen taxa such as Cyperaceae. Corroded Betula pollen was also excluded as it was considered to be likely reworked material from the lake catchment. Finally, the percentages of excluded taxa were calculated regarding the total land pollen sum [61].
3.4. Numerical Analysis
CONISS [59] assisted with the biostratigraphic zonation of the pollen diagram following the square root transformation of percentage data. To summarize vegetation changes and define plant communities, a principal component analysis (PCA) was performed on the relative abundances of pollen and NPPs, with correlation matrices using only taxa exceeding 1% in at least three samples.
4. Results
4.1. Core Chronology
Core QAL-2011 covers the last four millennia. Its age–depth model is quite linear (Figure 3) but shows steps, especially over the first 30 cm, due to an increasing number of instantaneous events. The mean sediment accumulation rate (SAR) is 0.3 mm year−1, and the average confidence interval is 160 years when not considering the extrapolated section of the model unconstrained by radiocarbon dating (below 90 cm, in black dotted lines; Figure 3). The calculated excess 210Pb drops sharply over the first cm then decreases slightly until it is absent after a depth of 3 cm. A peak of 137Cs between 1.5 and 2.5 cm (Figure 3) is interpreted as corresponding to the maximum fallout following atmospheric nuclear weapon tests in AD 1963.
4.2. Lithology, Physical, and Chemical Properties of the Laminated Facies
Three stratigraphic units (SU1 to SU3) are identified in the core QAL-2011 (Figure 2).
The first (SU1, from 118 to 95 cm; ca. 2300–1700 BC) is characterized by brownish silty sediment (10% of the particles are in the GS class > 63 µm; 35% are in the GS classes 63–16 µm and 16–4 µm, respectively; and finally, 20% are in the GS class < 4 µm). SU1 is interrupted by five thin white laminae closely spaced at 117 cm, 113.9 cm, 113.4 cm, 110.4 cm, and 100.9 cm, respectively (Figure 2). MS is the only parameter constant throughout SU1 (around 100 × 10−5 SI). On the contrary, density and Ti content show a slight reduction at the SU1 base (from 1.3 to 1.1 g/cm3 for density and from 10,000 to 9000 peak area for Ti), whereas TOC slightly increases (from 4 to 8%). Finally, the TOC/TN mean value remains around 13 in SU1.
The second stratigraphic unit (SU2, from 95 to 32.5 cm; 1700 BC–1100 AD) is darker due to its higher TOC content (ca. 8%). It is defined by dark brown silty sediment (12% of the particles are in the GS class > 63 µm; 33% are in the GS class 63–16 µm; 36% are in the GS class 16–4 µm; and 19% are in the GS class < 4µm). This sedimentary unit is interrupted by four white laminae at 81 cm, 77.2 cm, 66.8 cm, and 36.7 cm, respectively (Figure 2). At SU2, the MS values remain stable at ca. 100.10–5 SI, except for a peak at 66.8 cm (150.10–5 SI). Density values show variations around 1.1 g.cm3. Despite slight fluctuations in the white laminae, the mean Ti, TOC contents, and TOC/TN ratio show stable values of around 9000 (peak area), 8%, and 13, respectively.
The last sedimentary unit (SU3, from 32.5 cm to the top of the sequence; from 1100 AD) is characterized by a light brown sandy, silty sediment (the coarse fraction is twice as high as in SU1 and SU2 with an average of 19% of the particles being in the GS class > 63 µm; 30% are in the GS class 63–16 µm; 34% are in the GS class 16–4 µm; and 17% are in the GS class < 4 µm). SU3 contains a maximum of 18 white laminae, generating abrupt shifts in all parameters (Figure 3). Indeed, the background sediment shows increases in the MS, density, Ti content, and TOC/TN ratio to values of ca. 125.10–5 SI, 1.2 g.cm3, 10,000 (peak area), and 13.5, respectively.
White laminae, present along the core QAL-2011, varied between 2.5 and 0.1 cm thick, making naked-eye identification difficult (Figure 2). Therefore, we focused our analysis on the X-ray radiography to identify the thin laminae. Particularly well-defined in this high-resolution image, white laminae appear in intense black, whereas background sediment is represented by a light-grey color. Laminae have higher MS, densities, and TOC/TN ratios (with maximum ca. 450.10–5 SI, 1.7 g.cm−3, and 16, respectively). They are also rich in Ti (up to ~20,000 in the peak area) and coarse fractions (maximum value of ca. 25 % in the >63 µm massic class). Inversely, they are distinguished by much lower TOC (minimum value of ca. 1.5%). XRD tests indicate that background sediment and laminae comprise quartz, feldspaths, and phyllosilicates. Based on the physical and geochemical properties, all white laminae are similar. Thin-section analyses of the thickest lamina (between 32.2 cm and 34 cm, Figure 3) show a normal grading of clastic grains (fining upward, Figure 3) and an organic fraction composed of ca. 70% red amorphous particles (rAP) and lignocellulosic fragments (LCF) from the soil and upper vegetation debris [46].
4.3. Pollen Diagram
Two pollen zones were defined according to the cluster analysis, with two subzones being identified in the upper pollen zone (Figure 4).
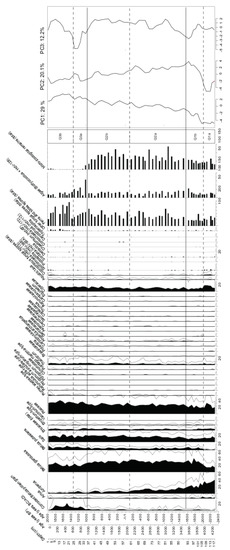
Figure 4.
Percentage diagram of pollen and non-pollen palynomorphs (NPP) in core QAL–2011 and scores for PCA axes 1, 2, and 3.
Pollen zone Q1 comprises samples between 117 cm and 9 cm in depth and records the timespan between 2300 and 1500 BC. The surrounding landscape appears to have been dominated by dwarf shrubs and heath; however, this zone marks a progressive change in pollen assemblages from juniper cover in Q1a (from 40 to 20%) to birch forest in Q1b (Betula glandulosa, from 10 to 40%) and Betula pubescens (5–10%). Herbaceous taxa are dominated by Poaceae (20–30%) and Cyperaceae (10–20%), with regular occurrences of Thalictrum alpinum, Plantago maritima, Angelica archangelica, Brassicaceae, Polgonum vivparum, and Rumex acetosa-type. In addition, coprophilous fungi spores (mainly Sporormiella/HdV-113-Podospora/Hdv-368 Sordariaceae/HdV-55 A and B) suggest the presence of wild herbivores (probably caribou) in the surroundings. Among other NPPs, algae (Botryococcus, Spirogyra, and Pediastrum, among others) and animal biotic remains (e.g., Filinia and dinocyst) were found in this pollen zone and pollen zone Q2.
Pollen zone Q2 (93–37 cm/ca.1500 BC–900 AD) is first characterized in Q2a (93–61 cm/1500–100 BC) by a cover dominated by Betula glandulosa (c. 35%) and, to a lesser extent, Betula pubescens (5–10%) with the presence of Salix (15%) and Ericaceae. Juniperus slightly decreases and has steady values in Q2b (10%). There is no significant change in herbaceous vegetation. In pollen zone Q2b (61–35 cm/100 BC-1000 AD), Betula glandulosa (30–35%) and Salix (10–15%) are the dominating shrub taxa. Juniperus and Ericaceae reach ~5% each, and Betula pubescens reach ~6%. Poaceae pollen dominates the herb taxa and accounts for 27% of the pollen assemblages. Rare occurrences of Sporormiella (HdV-113) and Sordaria (HdV-55 A and B) spores are witnessed along this pollen zone.
The upper pollen zone (Q3) comprises the upper 29 cm of the sequence and records the timespan between circa 1100 cal. AD to the present time. Sub-zone Q1a (25–23 cm; ca. 1000–1350 AD) shows a slight increase in Poaceae (35%). Conversely, Betula glandulosa pollen decreases through this sub-zone, attaining 10% of the pollen abundance. Corroded Betula pollen grains, present in small quantities in all zones, increased abruptly (10%) in this sub-zone. Several herb pollen taxa associated with landscape opening and disturbed soils increase. Some taxa in particular increase; Plantago maritima and Rumex acetosa-type reach 3% representation in some samples, and Ranunculus acris-type reaches 1%. The non-pollen palynomorphs (NPP) assemblage shows substantial changes. While some fern spores increase, an abrupt interruption of the zoological micro-remains record is reported in this sub-zone (mainly Neorhabdocoela, Filinia, Thecamoeba, and other dinoflagellates). Coprophilous fungal spores do not show any significant change in this zone. Sub-zone Q1a (25–1 cm; ca. 1350 AD to present time) features a decrease in Poaceae concomitant with an increase in Betula glandulosa and Betula pubescens pollen percentages. The occurrence of corroded Betula pollen peaks at almost 20% and decreases abruptly at the end of this sub-zone, while Juniperus records the lowest values in the sequence. Ruderal taxa such as Rumex acetosa-type, Potentilla, and Ranunculus acris-type are also present. Sporormiella spores also show an increasing trend at the end of this sub-zone.
4.4. PCA Result
The three first PCA axes account for 61.3% of the variance in the dataset (Figure 4 and Figure 5). Both PC1 (29%) and PC2 (20.1%) capture millennial-scale variability with an abrupt shift in the vegetation composition at ~2000 BC (from zone Q1 to Q2) but opposite trends afterwards (figure with PC scores). Taxa that are negative along PC1 (Juniperus, Alnus, Volvocacea) exhibit a sharp decrease around 2000 BC, followed by a 4000-year-long decreasing trend in zone Q2 and Q3. B. pubescens display the opposite trend with positive values. Taxa negative along PC2 show a similar drop in abundance at ~2000 BC, followed by an increasing trend in zone Q2 and Q3 (Ericaceae and Cyperaceae) and/or maximum abundances in zone Q3 (Sporormiella, coprophilous fungal spores). B. glandulosa shows positive loadings along this axis. Taxa that are positive along PC1 and negative along PC2 show no marked shift around 2000 BC but steadily increasing trends (Salix, ferns, Poaceae) and/or maximum abundances in zone Q3 (Plantago maritima, Thalictum, and other fungal spores).
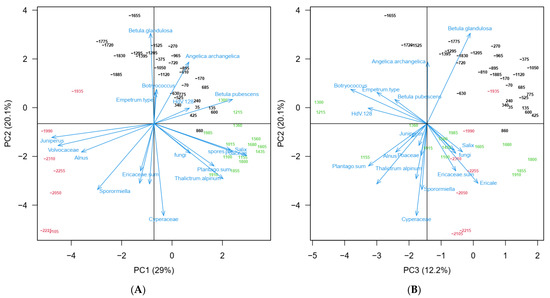
Figure 5.
(PCA biplots): Biplots of the PCA analysis of the relative abundance of selected pollen and NPPs in core QAL-2011: (A) axis 2 vs. axis 1. (B) axis 2 vs. axis 3.
While PC1 and PC2 capture variability related to long-term ecological and climatic changes. The third axis of the PCA (12.2%) could be related to land use during the Norse period (zone Q3a).
5. Discussion
5.1. 2300–1500 BC: Transition from Holocene Thermal Maximum to Neoglacial
Between 2300 and 1500 BC, Lake Qallimiut is characterized by the accumulation of brownish silty deposits with laminae. These laminae described in core QAL-2011 show properties of terrestrial inputs (high MS, density, and Ti content; low TOC and grain size over 63 µm) [61]. They contrast with the background sedimentation except for their mineralogical composition, suggesting that material was deposited into the lake during different hydrological regimes. In general, low TOC indicates the predominance of mineral matter. A high TOC/TN ratio and the predominance of rAP and LCF particles indicate material reworked from the catchment areas [49,62,63,64]. In other studies, all these biogeochemical parameters were used to distinguish flood deposits in the sediment records [42]. However, the presence of hyperpycnal flood deposits [46,65] is difficult to demonstrate as these layers could also be interpreted as a result of peaks in erosion from the catchment.
PC1 and PC2 axes capture variability related to long-term ecological and climatic changes. Warming conditions during the Holocene Thermal Maximum [31] probably allowed for a substantial expansion of Juniperus communis from 6000 BC [11,29]. Peak warmth in Greenland appears to have occurred between 8000 and 5000 BP, and similar climate conditions occurred at Lake Igaliku, 35 km north of Qallimiut [29,31]. The accumulation of organic matter probably gradually promoted the development of thicker soils. Soil development and a wetter climate [29] allowed for a transition from juniper to glandular birch (Betula glandulosa) around 2500 BC. Then, white birch (Betula pubescens) flourished in the most sheltered places to the detriment of juniper. Between 2500 and 1000 BC, Lake Igaliku was also marked by increased erosion, with more soil organic matter inputs.
5.2. 1500 BC–1000 AD: The Pre-Landnam Landscape
The vegetation history was remarkably stable. Birch and willow represent nearly 50% of the total land pollen, a value also witnessed in SW Greenland sites such as Lake Igaliku [20,21] and Lake Vatnahverfi [33] for the pre-landnám period. Data from Lake Qallimiut corroborate those from other studies regarding the development of open woodland in the Vatnhaverfi region before the arrival of the Norse [33]. Betula pubescens pollen also evidences the presence of birch in the area. Considering that the pollen values hardly exceed 10% at Lake Qallimiut, the spread of tree birch in this area of Vatnahverfi occurred to a lesser extent than in the sheltered locations to the north, such as Saqqaa and Saqqaat Tasia [34]. This feature is most likely a result of more oceanic climate conditions at Lake Qallimiut, located in the south of the sub-oceanic low-Artic zone [37], where climate conditions constrain the development of tree birch cover. These conditions may have constrained the establishment of human settlement and subsequent land use, as few wood resources were available at this site.
Land use indicators found at Lake Qallimiut before the landnám are most likely the result of the long-distance atmospheric transport of pollen. For instance, Rumex acetosa-type, which is considered to have grown in Greenland exclusively after the arrival of the Norse [11,66], may include pollen from Oxyria digyna, a common herb growing in Greenland with similar morphological traits. Regarding the NPPs, the occurrence of coprophilous fungal spores such as Sporormiella and Sordaria indicates the presence of herbivorous mammals, likely caribou, in this period. Dung-related spores before the landmán have also been found at Igaliku [20], along with low concentrations of fecal biomarkers [66,67].
5.3. 1000–1350 BC: Norse Farming Impact?
Farming activities at Lake Qallimiut [9,40] could have modified the lake sedimentation, particularly the thickness of the deposits inventoried [68]. Indeed, livestock trampling and tree and shrub cover reduction due to grazing and the creation of fodder parcels potentially favored soil erosion. At first sight, pollen data reveal a scant human impact during this period. From 1000 BC, the retreat of dwarf Betula and Salix scrub and a slight increase in Poaceae, Plantago maritima, Rumex acetosa–type, and Cichorioideae mark the onset of a more open landscape. From 1200 AD, the regrowth of Betula, Juniperus, Salix, and Empetrum nigrum suggests weaker farming activities in the surroundings. The numerical analysis also shows significant changes during the Norse period: the third axis of the PCA may be related to land use (zone Q3a). The decrease in B. glandulosa and Ericaceae, responding positively along this axis, reflects the opening of the landscape after 1000 AD in favor of B. pubescens, Plantago maritima, and Thalictrum, which spread between 1000 and 1300 AD. The algae, Botryococcus, and HdV.128 also respond negatively, suggesting that increased nutrient inputs to the lake waters may have caused changes in the phytoplankton communities.
The duration of human impacts evidenced at Lake Qallimiut (from 1100 to 1300 AD) is relatively short compared to other sites of the Eastern Settlement [33]. According to several investigations performed in northern Vatnahverfi [34,35,36], the spread of Norse activities started as early as the 10th century, a chronology that matches the date of Erik the Red’s arrival in around 985 AD. Despite this early activity, land use seems to have been delayed by around 50–100 years at sites such as the Mountain Farm, located 5 km away from the coast at 260 m asl [33]. Lake Qallimiut could also be compared with Lake Igaliku [20]. This pollen diagram shows clearance but also more intense pastoral pressure. Although there is no farm in the lake’s catchment area, the lake was probably at the center of the pastoral area, explaining the good representation of coprophilous fungi spores and bile acid markers [66].
According to our data, local farming activities performed by the Norse communities that lived on farms E77, E771, E180, and E311 impacted the environment. Two farms were established in the Lake Qallimiut catchment area. The nearest, E77 (north of the lake), was a small farm dependent on a bigger one, and the more distant E164 was a medium farm. According to the functional inventory of buildings at these two sites [9], they supported a relatively limited number of sheep and goats herded when not stalled and fed during the winter. On the other hand, ruins E77A could correspond to a large farmstead, possibly in connection with sites E180 and E311 [9,38]. In this case, summer pastures may have been located mainly along the fjord and less around the lake, explaining the progressive vanishing of human impact between 1200 to 1300 AD.
5.4. From Demise to Modern Agriculture
The last signs of human activity in the pollen records are often difficult to identify because anthropogenic taxa, such as Plantago maritima, Rumex acetosa-type, Cichorioideae, or Ranunculus acris, are present in the area centuries after the presence of the Norse settlers. This feature is common at other sites of the Eastern Settlement, where ruderal plants are continuously recorded from the Middle Ages to the present [11,12,20] due to successful establishment after human abandonment. However, from 1200 to 1300 AD, land use seems to decrease slightly with the regeneration of shrub cover. This chronology of land use is quite similar to Igaliku, a site in the inner fjords.
Around 1300 AD, local Greenlandic air summer temperatures seemed to be the coolest recorded during the last millennium [24]. Major glacial advances in south, east and west Greenland and Baffin Island were inventoried during these intervals [68,69,70,71,72]. At a global scale, lower air temperatures, thicker and longer-lasting snow cover, and increased storm frequency defined the LIA [73,74]. Archaeological data suggest a settlement reorganization from a dispersed pattern across the inner and outer fjords to a more concentrated settlement on the inner fjords from the 13th century [40]. Palynological studies suggest decreased grazing pressure and abandonment of the Vatnahverfi region between the late fourteenth and early fifteenth centuries [33,34]. Lake Qallimiut and the surrounding Norse farms are in the outer fjords. Their abandonment may have occurred earlier than other Vatnahverfi sites but not much earlier than in Igaliku, located near Gardar, the center of the Eastern Settlement in the inner fjords. However, sediment records give insights into the timing of agro-pastoral activities, not the site’s abandonment by settlers, which may have persisted despite the cooling of the Little Ice Age. The decline in agricultural production was likely compensated for by seal hunting and fishing, as is indicated by the carbon isotope analyses of Norse bones from the region [4], suggesting a long and forced adaptation of the Norse to harshening climate conditions rather than a sharp collapse.
Today, two farms are partly outside the catchment. However, the anthropogenic signal seems more substantial than during the medieval period. This contrast is due to a possible extension of hay fields and sheep grazing directly around the lake.
6. Conclusions
Lake Qallimiut offers 4300 years of environmental history in south Greenland. The chronology and trends of the vegetation dynamics are comparable to the results observed at Lake Igaliku. The sequence starts at the transition between the HTM and Neoglacial periods with a shift from juniper to birch pollen abundance. Climate change is the primary driver of vegetation changes until the last millennium AD. Signs of grazing pressure are recorded between 2300 and 1800 BC, during the Norse period, and in the modern period. The pollen results suggest a short period of intensive land use around Lake Qallimiut from the middle of the 11th century to the end of the 13th century, with a progressive decline between 1200 and 1300 AD. Many Norse archaeological sites’ surroundings have been surveyed; however, the lake was perhaps not the very heart of the pastoral area. An examination of settlement patterns suggests that Lake Qallimiut may have been outside the summer pasture zone of the closest Norse farms during the 13th century. Tracks to summer pastures could have been along the fjord, excluding Lake Qallimiut from the pastoral zone. Modern farming activities in the lake catchment are recorded and support the previous interpretation of a medieval pastoral zone partly outside the lake’s catchment area.
Author Contributions
Conceptualization, E.G., A.C., T.G., C.M. and V.B.; methodology, E.G., formal analysis, A.C., T.G. and C.M.; investigation, E.G., A.C., T.G., C.M., H.R. and V.B.; writing—original draft preparation, E.G., A.C. and T.G.; writing—review and editing, E.G., A.C., T.G., C.M., H.R. and V.B.; Please refer to the CRediT taxonomy for term explanations. All authors have read and agreed to the published version of the manuscript.
Funding
This work received financial support from the University of Bourgogne, the University of Franche-Comté, the Centre National de la Recherche Scientifique (CNRS), the French Polar Institute (IPEV), the “Green Greenland” CEP&S Project (ANR-10-CEPL-0008), the InterArctic (ANR-17-CE03-0009), and the Belmont-Forum NICH-Arctic project (ANR-20-AORS-0003).
Data Availability Statement
The data will be uploaded to dat@ubfc.
Acknowledgments
We would particularly like to thank Christian Koch Madsen (Greenland National Museum) for the discussion on settlement patterns around Lake Qallimiut. We thank Christophe Mavon for the 210Pb and 137Cs analyses and the OREAS project for funding. We also thank Maxime Mermet for the Geotek multi-sensor core logger analyses, Marguerite Perrey for her help with the grain size analysis, Delphine Charpentier for the XRD analysis, Anne-Lise Develle for the XRF analysis realized at the EDYTEM laboratory, and Bianca Perren and Christophe Petit for their assistance in the field. We also thank Marielle Hatton for her help with the preparation of the QOP analysis in the ISTO laboratory.
Conflicts of Interest
The authors declare no conflict of interest.
References
- Serreze, M.C.; Barry, R.G. Processes and impacts of Arctic amplification: A research synthesis. Glob. Planet. Change 2011, 77, 85–96. [Google Scholar] [CrossRef]
- Sørensen, M.; Gulløv, H.C. The Prehistory of Inuit in Northeast Greenland. Arct. Anthropol. 2012, 49, 88–104. [Google Scholar] [CrossRef]
- Jones, G. The Norse Altlantic Saga; Oxford University Press: New York, NY, USA, 1986; 337p. [Google Scholar]
- Arneborg, J.; Lynnerup, N.; Heinemeier, J.; Møhl, J.; Rud, N.; Sveinbjörnsdóttir, Á.E. Norse Greenland dietary economy ca. AD 980-ca. AD 1450: Introduction. J. North Atl. 2012, sp3, 1–39. [Google Scholar] [CrossRef]
- Arneborg, J.; Lynnerup, N.; Heinemeier, J. Human diet and subsistence patterns in Norse Greenland AD c. 980—AD c. 1450, Archaeological interpretations. J. North Atl. 2012, sp3, 119–133. [Google Scholar] [CrossRef]
- Gulløv, H.C. Nunarput, vort land–Thule kulturen 1200–1900. In Grønlands Forhistorie; Gulløv, H.C., Ed.; Gyldendal: Copenhagen, Denmark, 2004; pp. 281–341. [Google Scholar]
- Dugmore, A.; McGovern, T.; Vesteinsson, O.; Arneborg, J.; Streeter, R.; Keller, C. Cultural Adaptation, Compounding Vulnerabilities and Conjunctures in Norse Greenland. Proc. Natl. Acad. Sci. USA 2012, 109, 3658–3663. [Google Scholar] [CrossRef]
- Austrheim, G.; Asheim, L.-J.; Bjarnason, G.; Feilberg, J.; Fosaa, A.M.; Holand, Ø.; Høegh, K.; Jónsdóttir, I.S.; Magnuússon, B.; Mortensen, L.E.; et al. Sheep grazing in the North-Atlantic region—A long term perspective on management, resource economy and ecology. Mus. Nat. Hist. Archaeol. Rep. Zool. Ser. 2008, 3, 1–82. [Google Scholar]
- Madsen, C.K. Pastoral Settlement, Farming and Hierarchy in Norse Vatnahverfi, South Greenland. Ph.D. Thesis, Faculty of Humanities, University of Copenhagen, Copenhagen, Denmark, 2014; 440p. [Google Scholar]
- Jackson, R.; Arneborg, J.; Dugmore, A.; Madsen, C.; McGovern, T.; Smiarowski, K.; Streeter, R. Disequilibrium, adaptation, and the Norse settlement of Greenland. Hum. Ecol. 2018, 46, 665–684. [Google Scholar] [CrossRef]
- Fredskild, B. Studies in the vegetational history of Greenland. Medd. Om Grønland 1973, 198, 1–245. [Google Scholar]
- Fredskild, B. Paleobotanical investigations of some peat deposits of Norse age at Qagissiarssuk, South Greenland. Medd. Om Grønland 1978, 204, 1–41. [Google Scholar]
- Fredskild, B. Erosion and vegetational changes in South Greenland caused by agriculture. Geogr. Tidsskr. 1992, 92, 14–21. [Google Scholar] [CrossRef]
- McGovern, T. Climate correlation and causation in Norse Greenland. Arct. Anthropol. 1991, 28, 77–100. [Google Scholar]
- Lynnerup, N. Paleodemography of the Greenland Norse. Arct. Anthropol. 1996, 33, 122–136. [Google Scholar]
- Dugmore, A.J.; Church, M.J.; Buckland, P.C.; Edwards, K.J.; Lawson, I.; McGovern, T.; Panagiotakopulu, E.; Simpson, I.A.; Skidmore, P.; Sveinbjarnardottir, G. The Norse landnam on the North Atlantic islands, an environmental impact assessment. Polar Rec. 2005, 41, 21–37. [Google Scholar] [CrossRef]
- Commisso, R.G.; Nelson, D.E. Correlation between modern plant [delta]15N values and activity areas of Medieval Norse farms. J. Archaeol. Sci. 2008, 35, 492–504. [Google Scholar] [CrossRef]
- Buckland, P.C.; Edwards, K.J.; Panagiotakopulu, E.; Schofield, J.E. Palaeoecological and historical evidence for manuring and irrigation at Garðar (Igaliku), Norse Eastern settlement, Greenland. Holocene 2009, 19, 105–116. [Google Scholar] [CrossRef]
- Arneborg, J. Norse Greenland: Research into abandonment. In Medieval Archaeology in Scandinavia and Beyond: History, Trends and Tomorrow; Aarhus Universitetsforlag: Aarhus, Denmark, 2015; pp. 257–271. [Google Scholar]
- Gauthier, E.; Bichet, V.; Massa, C.; Vannière, B.; Petit, C.; Richard, H. Pollen and non-pollen palynomorph evidence of medieval farming activities in Greenland. Veg. Hist. Archaeobot. 2010, 19, 427–438. [Google Scholar] [CrossRef]
- Massa, C.; Bichet, V.; Gauthier, E.; Perren, P.; Mathieu, O.; Petit, C.; Monna, F.; Giraudeau, J.; Losno, R.; Richard, H. A 2500 Years Record of Natural and Anthropogenic Soil Erosion in South Greenland. Quat. Sci. Rev. 2012, 32, 119–130. [Google Scholar] [CrossRef]
- Perren, B.B.; Massa, C.; Bichet, V.; Gauthier, É.; Mathieu, O.; Petit, C.; Richard, H. A paleoecological perspective on 1450 years of human impacts from a lake in southern Greenland. Holocene 2012, 22, 1025–1034. [Google Scholar] [CrossRef]
- Bichet, V.; Gauthier, E.; Massa, C.; Perren, B.; Richard, H.; Petit, C.; Mathieu, O. The history and impacts of farming activities in south Greenland: An insight from lake deposits. Polar Rec. 2013, 49, 210–220. [Google Scholar] [CrossRef]
- Millet, L.; Massa, C.; Bichet, V.; Frossard, V.; Belle, S.; Gauthier, E. Anthropogenic versus climatic control in a high-resolution 1500-year chironomid stratigraphy from a South Western Greenland lake. Quat. Res. 2014, 81, 193–202. [Google Scholar] [CrossRef]
- Westergaard-Nielsen, A.; Bjørnsson, A.B.; Jepsen, M.R.; Stendel, M.; Hansen, B.U.; Elberling, B. Greenlandic sheep farming controlled by vegetation response today and at the end of the 21st Century. Sci. Total Environ. 2015, 512, 672–681. [Google Scholar] [CrossRef] [PubMed]
- Kaufman, D.S.; Ager, T.A.; Anderson, N.J.; Anderson, P.M.; Andrews, J.T.; Bartlein, P.J.; Brubaker, L.B.; Coats, L.L.; Cwynar, L.C.; Duvall, M.L.; et al. Holocene thermal maximum in the western Arctic (0–180 W). Quat. Sci. Rev. 2014, 23, 529–560. [Google Scholar] [CrossRef]
- Vinther, B.M.; Buchardt, S.L.; Clausen, H.B.; Dahl-Jensen, D.; Johnsen, S.J.; Fisher, D.A.; Koerner, R.M.; Raynaud, D.; Lipenkov, V.; Andersen, K.K.; et al. Holocene thinning of the Greenland ice sheet. Nature 2009, 461, 385–388. [Google Scholar] [CrossRef] [PubMed]
- Gajewski, K. Impact of Holocene climate variability on Arctic vegetation. Glob. Planet. Change 2015, 133, 272–287. [Google Scholar] [CrossRef]
- Massa, C.; Perren, B.; Gauthier, E.; Bichet, V.; Petit, C.; Richard, H. A 10-ka record of Environmental Change from Lake Igaliku, South Greenland. J. Palaeolimnol. 2012, 48, 241–258. [Google Scholar] [CrossRef]
- Kobashi, T.; Menviel, L.; Jeltsch-Thömmes, A.; Vinther, B.M.; Box, J.E.; Muscheler, R.; Nakaegawa, T.; Pfister, P.L.; Döring, M.; Leuenberger, M.; et al. Volcanic influence on centennial to millennial Holocene Greenland temperature change. Sci. Rep. 2017, 7, 1441. [Google Scholar] [CrossRef]
- Kaufman, D.S.; Schneider, D.P.; McKay, N.P.; Ammann, C.M.; Bradley, R.S.; Briffa, K.R.; Miller, G.H.; Otto-Bliesner, B.L.; Overpeck, J.T.; Vinther, B.M.; et al. Recent warming reverses long-term arctic cooling. Science 2009, 325, 1236e–1239e. [Google Scholar] [CrossRef]
- Moritz, R.E.; Bitz, C.M.; Steig, E.J. Dynamics of recent climate change in the Arctic. Science 2002, 297, 1497–1502. [Google Scholar] [CrossRef]
- Ledger, P.M.; Edwards, K.J.; Schofield, J.E. Vatnahverfi: A green and pleasant land? Palaeoecological reconstructions of environmental and land-use change. J. North Atl. 2014, sp6, 29–46. [Google Scholar] [CrossRef]
- Ledger, P.M.; Edwards, K.J.; Schofield, J.E. A multiple profile approach to the palynological reconstruction of Norse landscapes in Greenland’s Eastern Settlement. Quat. Res. 2014, 82, 22–37. [Google Scholar] [CrossRef]
- Ledger, P.M.; Edwards, K.J.; Schofield, J.E. Shieling activity in the Norse eastern settlement: Palaeoenvironment of the ‘Mountain farm’, Vatnahverfi, Greenland. Holocene 2013, 23, 810–822. [Google Scholar] [CrossRef]
- Edwards, K.J.; Schofield, J.E.; Mauquoy, D. High Resolution Paleoenvironmental and Chronological Investigations of Norse Landnam at Tasiusaq, Eastern Settlement, Greenland. Quat. Res. 2008, 6, 1–15. [Google Scholar] [CrossRef]
- Feilberg, J. A Phytogeographical Study of South Greenland Vascular Plants; Museum Tusculanum Press: Copenhagen, Denmark, 1984; Volume 15. [Google Scholar]
- Cappelen, J.; Jorgensen, B.V.; Laursen, E.V.; Stannius, L.S.; Thomsen, R.S. The Observed Climate of Greenland with Climatological Standard Normals, 1961–1990; DMI Technical Report No. 00-18; Danish Meteorological Institute: Copenhagen, Denmark, 2001; 152p. [Google Scholar]
- Cappelen, J. Weather Observations from Greenland 1958–2013. Observations Data with Description; DMI Technical Report No. 14-08; Danish Meteorological Institute: Copenhagen, Denmark, 2014; 24p. [Google Scholar]
- Madsen, C.K.; Arneborg, J.; Heide, P.B.; Smiarowski, K. Norse Coastal Farms; Field Report in the South West Vatnahverfi Peninsulan; Department of Danish Middle Age and Renaissance: Copenhagen, Denmark, 2009; 96p. [Google Scholar]
- Appleby, P.G. Chronostratigraphic techniques in recent sediments. In Tracking Environmental Change Using Lake Sediments: Basin Analysis, Coring, and Chronological Techniques; Springer: Dordrecht, The Netherlands, 2001; pp. 171–203. [Google Scholar]
- Appleby, P.G.; Oldfield, F. The calculation of lead-210 dates assuming a constant rate of supply of unsupported 210Pb to the sediment. Catena 1978, 5, 1–8. [Google Scholar] [CrossRef]
- Blaauw, M. Methods and code for ‘classical’ age-modelling of radiocarbon sequences. Quat. Geochronol. 2010, 5, 512–518. [Google Scholar] [CrossRef]
- Migeon, S.; Weber, O.; Faugeres, J.-C.; Saint-Paul, J. SCOPIX: A new X-ray imaging system for core analysis. Geo-Mar. Lett. 1998, 18, 251–255. [Google Scholar] [CrossRef]
- Arnaud, F.; Révillon, S.; Debret, M.; Revel, M.; Chapron, E.; Jacob, J.; Giguet-Covex, C.; Poulenard, J.; Magny, M. Lake Bourget regional erosion patterns reconstruction reveals Holocene NW European Alps soil evolution and paleohydrology. Quat. Sci. Rev. 2012, 51, 81–92. [Google Scholar] [CrossRef]
- Meyers, P.A.; Ishiwatari, R. Lacustrine organic geochemistry—An overview of indicators of organic matter sources and diagenesis in lake sediments. Org. Geochem. 1993, 20, 867–900. [Google Scholar] [CrossRef]
- Graz, Y.; Di-Giovanni, C.; Copard, Y.; Laggoun-Défarge, F.; Boussafir, M.; Lallier-Vergès, E.; Baillif, P.; Perdereau, L.; Simonneau, A. Quantitative palynofacies analysis as a new tool to study transfers of fossil organic matter in recent terrestrial environments. Int. J. Coal Geol. 2010, 84, 49–62. [Google Scholar] [CrossRef]
- Combaz, A. Les palynofaciès. Rev. Micropaléontologie 1964, 7, 205–218. [Google Scholar]
- Simonneau, A.; Chapron, E.; Vannière, B.; Wirth, S.B.; Gilli, A.; Di Giovanni, C.; Anselmetti, F.S.; Desmet, M.; Magny, M. Mass-movement and flood-induced deposits in Lake Ledro, Southern Alps, Italy: Implications for Holocene palaeohydrology and natural hazards. Clim. Past 2013, 9, 825–840. [Google Scholar] [CrossRef]
- Simonneau, A.; Chapron, E.; Garçon, M.; Winiarski, T.; Graz, Y.; Chauvel, C.; Debret, M.; Motelica-Heino, M.; Desmet, M.; Di Giovanni, C. Tracking Holocene glacial and high-altitude alpine environments fluctuations from minerogenic and organic markers in proglacial lake sediments (Lake Blanc Huez, Western French Alps). Quat. Sci. Rev. 2014, 89, 27–43. [Google Scholar] [CrossRef]
- Foucher, A.; Salvador-Blanes, S.; Evrard, O.; Simonneau, A.; Chapron, E.; Courp, T.; Cerdan, O.; Lefèvre, I.; Adriaensen, H.; Lecompte, F.; et al. Increase in soil erosion after agricultural intensification: Evidence from a lowland basin in France. Anthropocene 2014, 7, 30–41. [Google Scholar] [CrossRef]
- Fægri, K.; Iversen, J. Textbook of Pollen Analysis; Wiley: Chichester, UK, 1989. [Google Scholar]
- Reille, M. Pollen et Spores d’Europe et d’Afrique du Nord; Laboratoire de Botanique Historique et Palynologie: Marseille, France, 1992. [Google Scholar]
- van Geel, B. Non-pollen palynomorphs. In Tracking Environmental Change Using Lake Sediments (Terrestrial, Algal and Silicaceous Indicators); Smol, J.P., Birks, H.J.B., Last, W.M., Eds.; Kluwer: Dordrecht, The Netherlands, 2001; Volume 3, pp. 99–119. [Google Scholar]
- van Geel, B.; Aptroot, A. Fossil ascomycetes in Quaternary deposits. Nova Hedwig. 2006, 82, 313–329. [Google Scholar] [CrossRef]
- Beug, H.-J. Leitfaden der Pollenbestimmung fur Mitteleuropa und Angrenzende Gebiete; Pfeil: München, Germany, 2004. [Google Scholar]
- Caseldine, C. Changes in Betula in the Holocene record from Iceland—A palaeoclimatic record or evidence for early Holocene hybridisation? Rev. Palaeobot. Palynol. 2001, 117, 139–152. [Google Scholar] [CrossRef]
- Mäkelä, E. The Holocene history of Betula at Lake lilompolo, Inari Lapland, northeastern Finland. Holocene 1998, 8, 55–67. [Google Scholar] [CrossRef]
- Grimm, E.C. CONISS: A FORTRAN 77 Program for Stratigraphically Constrained Cluster Analysis by the Method of Incremental Sum of Squares. Comput. Geosci. 1987, 13, 13–35. [Google Scholar] [CrossRef]
- Grimm, E.C. Tilia Software; Illinois State Museum, Research and Collection Center: Springfield, IL, USA, 1991. [Google Scholar]
- Blackford, J.J.; Innes, J.B. Linking current environments and processes to fungal spore assemblages, surface NPM data from woodland environments. Rev. Palaeobot. Palynol. 2006, 141, 179–187. [Google Scholar] [CrossRef]
- Chapron, E.; Arnaud, F.; Noël, H.; Revel, M.; Desmet, M.; Perdereau, L. Rhone River flood deposits in Lake Le Bourget, a proxy for Holocene environmental changes in the NW Alps, France. Boreas 2005, 34, 404–416. [Google Scholar] [CrossRef]
- Di-Giovanni, C.; Disnar, J.R.; Bichet, V.; Campy, M.; Guillet, B. Geochemical characterization of soil organic matter and variability of a postglacial detrital organic supply (Chaillexon Lake, France). Earth Surf. Process. Landf. 1998, 23, 1057–1069. [Google Scholar] [CrossRef]
- Simonneau, A.; Doyen, E.; Chapron, E.; Millet, L.; Vannière, B.; Di Giovanni, C.; Bossard, N.; Tachikawa, K.; Bard, E.; Albéric, P.; et al. Holocene land-use evolution and associated soil erosion in the French Prealps inferred from Lake Paladru sediments and archaeological evidences. J. Archaeol. Sci. 2013, 40, 1636–1645. [Google Scholar] [CrossRef]
- Mulder, T.; Alexander, J. The physical character of subaqueous sedimentary density flows and their deposits. Sedimentology 2001, 48, 269–299. [Google Scholar] [CrossRef]
- Guillemot, T.; Zocatelli, R.; Bichet, V.; Jacob, J.; Massa, C.; Le Milbeau, C.; Richard, H.; Gauthier, E. Evolution of pastoralism in Southern Greenland during the last two millennia reconstructed from bile acids and coprophilous fungal spores in lacustrine sediments. Org. Geochem. 2015, 81, 40–44. [Google Scholar] [CrossRef]
- Guillemot, T.; Bichet, V.; Gauthier, E.; Zocatelli, R.; Massa, C.; Richard, H. Environmental responses of past and recent agro-pastoral activities on south Greenlandic ecosystems through molecular biomarkers. Holocene 2017, 27, 783–795. [Google Scholar] [CrossRef]
- Larsen, N.K.; Kjær, K.H.; Olsen, J.; Funder, S.; Kjeldsen, K.K.; Nørgaard-Pedersen, N. Restricted impact of Holocene climate variations on the Southern Greenland ice sheet. Quat. Sc. Rev. 2011, 130, 3171–3180. [Google Scholar] [CrossRef]
- Young, N.E.; Schweinsberg, A.D.; Briner, J.P.; Schaefer, J.M. Glacier maxima in Baffin Bay during the Medieval Warm Period coeval with Norse settlement. Sci. Adv. 2015, 1, e1500806. [Google Scholar] [CrossRef]
- Jomelli, V.; Lane, T.; Favier, V.; Masson-Delmotte, V.; Swingedouw, D.; Tinterknecht, V.; Schimmelpfennig, I.; Brunstein, D.; Verfaillie, D.; Adamson, K.; et al. Paradoxial cold conditions during the medieval climate anomaly in the Western Arctic. Sci. Rep. 2016, 6, 32984. [Google Scholar] [CrossRef] [PubMed]
- Grove, J.M. The initiation of the ‘Little Ice’ ‘Age’ in regions round the North Atlantic. Clim. Change 2001, 48, 53–82. [Google Scholar] [CrossRef]
- Nesje, A.; Dahl, S.O.; Matthews, J.A.; Berrisford, M.S. A 4500-yr record of river floods obtained from a sediment core in Lake Atnsjøen, eastern Norway. J. Paleolimnol. 2000, 25, 329–342. [Google Scholar] [CrossRef]
- Lamoureux, S. Five centuries of internannual sediment yield and rainfall-induced erosion in the Canadian High Arctic recorded in lacustrine varves. Water Resour. Res. 2000, 36, 309–318. [Google Scholar] [CrossRef]
- Bøe, A.G.; Dahl, S.O.; Lie, O.; Nesje, A. Holocene river floods in the upper Glomma catchment, southern Norway, a high-resolution multiproxy record from lacustrine sediments. Holocene 2006, 16, 445–455. [Google Scholar] [CrossRef]


Disclaimer/Publisher’s Note: The statements, opinions and data contained in all publications are solely those of the individual author(s) and contributor(s) and not of MDPI and/or the editor(s). MDPI and/or the editor(s) disclaim responsibility for any injury to people or property resulting from any ideas, methods, instructions or products referred to in the content. |
© 2023 by the authors. Licensee MDPI, Basel, Switzerland. This article is an open access article distributed under the terms and conditions of the Creative Commons Attribution (CC BY) license (https://creativecommons.org/licenses/by/4.0/).