1. Introduction
The 2016 Kumamoto earthquake sequence (KES) includes a series of earthquakes that began with a moment magnitude 6.2 event on the Hinagu Fault on 14 April 2016 (epicentral depth of about 11 km), followed by another foreshock of moment magnitude 6.0 on the Hinagu Fault at on 15 April 2016, and a larger moment magnitude 7.0 event on the Futagawa Fault on 16 April 2016 beneath Kumamoto City, Kumamoto Prefecture on Kyushu, Japan (epicentral depth of about 10 km). These events are the strongest earthquakes recorded in Kyushu during the modern instrumental era. The earthquakes resulted in substantial damage to infrastructure including buildings, cultural heritage sites (e.g., Kumamoto Castle), roads and highways, slopes, and river embankments due to earthquake-induced landsliding and debris flows. Surface fault rupture produced offset and damage to roads, buildings, river levees, and an agricultural dam [
1].
Immediately following the 2016 KES, researchers from the United States and associated with the Geotechnical Extreme Events Reconnaissance Association (GEER) were organized and deployed to the region to investigate and document geotechnical effects and performance during the KES. These US researchers joined with a team of Japanese researchers to thoroughly document the geotechnical aspects from the earthquake sequence [
1]. The authors of this study were members of that GEER team and participated in the reconnaissance. In 2017, we returned to Kumamoto to perform additional research related to the dearth of observed soil liquefaction evidence and effects during the KES.
Although soil liquefaction was widely predicted by subject-matter experts in the immediate aftermath of the 2016 KES, subsequent field reconnaissance showed a remarkable dearth of evidence of soil liquefaction in most parts of the Kumamoto Plain. The purpose of this study is to investigate the nature as to why soil liquefaction did not occur as prevalently during the 2016 KES as predicted by subject-matter experts. This investigation includes a literature review assessment of the known liquefaction characteristics of certain volcanic clay minerals, and also includes a series of undrained cyclic triaxial shear tests on specimens from select sites in Kumamoto. Finally, an assessment is made as to the validity of current liquefaction triggering models used commonly by geotechnical engineers today with regard to select sites in Kumamoto and their observed liquefaction/non-liquefaction effects.
1.1. Regional Geology
The geological history of Kyushu Island is storied with many different phases of development. Pre-Creaceous Period Kyushu Island was composed chiefly of carbonate and marine sediments [
2]. However, during the Creataceous Period, the inner side (i.e., western side) of the island began accumulating non-marine volcanic sediment. The outer side (i.e., the eastern side) of the island began experiencing volcanism, but mostly maintained its marine sedimentation [
3] (Takai, 1963).
During the Neogene Period, volcanic sedimentation began on both inner and outer sides of Kyushu Island [
3]. The Pleistocene Period was eclipsed by a complex mix of volcanism, terrace deposits, and soft and unconsolidated sediments. Large pyroclastic flows from volcanoes like Mount Aso repeatedly coated large areas of Kyushu Island [
4]. Coarse clastics, or weathered rocks, are dominant in non-volcanic sediments, but volcanic sediments are intercalated with layers of ash and marine sediments [
4]. Quaternary Period sediments were few relative to pyroclastic deposition [
4]. Current day Kyushu is primarily composed of older, weathered volcanic soils called “shirasu” on the outer side along with marine sediments and weathered rock. The soils on the inner side predominately originate from the massive Mount Aso volcano.
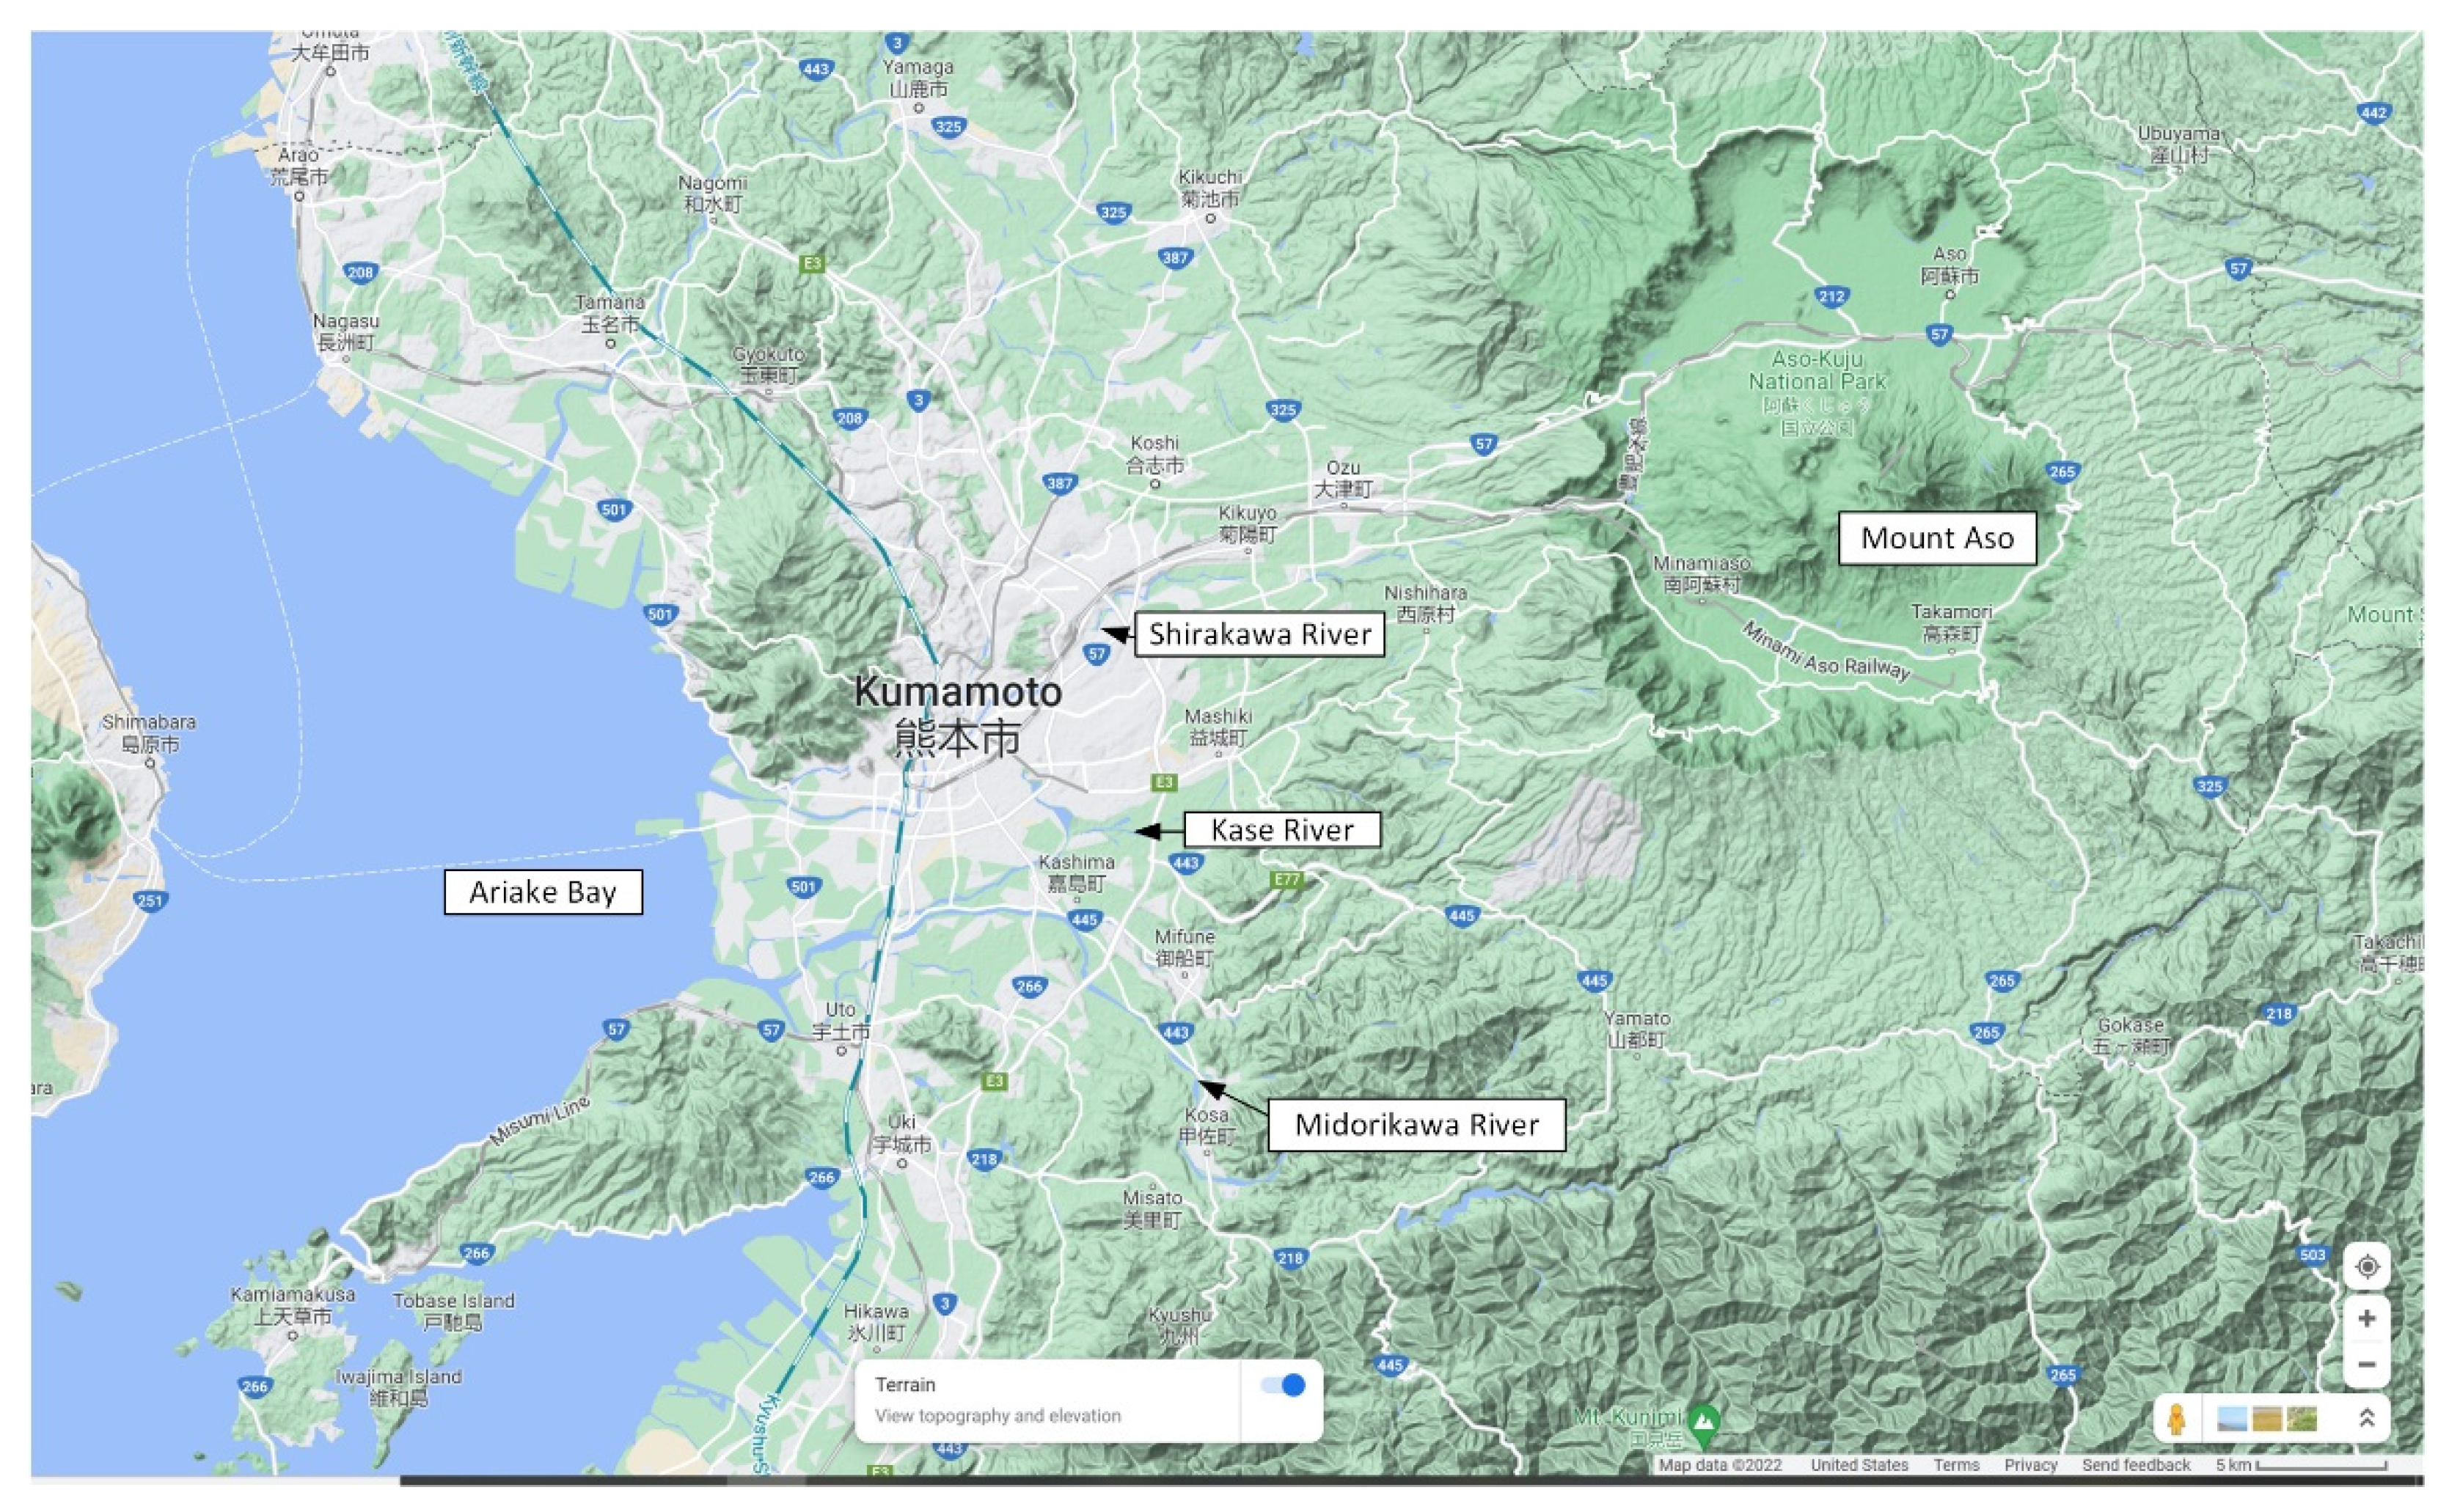
The Kumamoto Plain (see
Figure 1), located on the inner side of Kyushu Island, is a young alluvial deposit located between Mount Aso and Ariake Bay (also known as Shimabara Bay). Kumamoto city receives around 1000–1500 mm of rainfall per year and has high groundwater levels. High precipitation in the Mount Aso caldera forms the Shirakawa River, which flows down east to west through Kumamoto City. The Midorikawa and Kase Rivers flow east to west through the southern portion of the plain. The Midorikawa River flows through southern volcanic soils and from the Median Zone, thus carrying metamorphic rock, marine sediments, sandstone, and volcanic sediments [
2]. The gravel beds of the Midorikawa River are composed primarily of welded tuff, a volcanic deposit from the slopes of Mount Aso [
5]. A significant amount of sandstone sand along the river banks has also been identified and mapped [
5]. The Kase River is an amalgamation of many small streams on the Aso terrace and cuts through sandstone and mudstone deposits [
2]. Both the Midorikawa River and Kase River have a considerable amount of non-volcanic alluvium. The Shirakawa, Midorikawa, and Kase Rivers regularly flood and deposit suspended fine clay, silt, sand, and organic matter on the Kumamoto Plain, which is also considered to be a floodplain.
The Kumamoto Plain is underlain primarily by pyroclastic flow deposits and ash falls from Mount Aso. Four massive pyroclastic flows occurred from 90,000 to 300 years ago and make up the bulk of the sediment on the Kumamoto Plain [
6]. The pyroclastic deposits and secondary alluvial sediments of the most recent pyroclastic flow approximately 300 years ago comprise the bulk of the upper surface of the Kumamoto Plain [
6]. Most ash fall from Mount Aso was deposited to the east of the caldera, but the pyroclastic flows reached the coast to the west and the Ariake Sea. There are regular ash falls and eruptions from Mount Aso, though most of them are minor [
7]. The last eruption of Mount Aso is classified as ongoing, and the main cone still emits ash and smoke. The volcano discharges a regular volume of lava on the order of 1.5 cubic kilometers every thousand years, renewing the Aso Caldera with volcanic material. The most recent major Aso ash fall occurred in 1979 when tephra damaged crops in three adjacent prefectures including the Kumamoto Plain [
8].
1.2. Regional Tectonic Setting
The Futagawa–Hinagu fault zone (see Figure 4) is the primary tectonic mechanism in the Kumamoto Plain. The fault zone is created from the east-west compression of the Philippine Sea plate and the north-south extension of the Central Kyushu rift [
9]. The Futagawa-Hinagu fault zone is an unusual extensional system associated with normal faulting and active volcanism. The Futagawa and Hinagu faults separate the north movement from the south and have an oblique, strike slip and normal-down-to-north slip movement. To the south of the Futagawa and Hinagu faults, the uplifted Mesozoic subduction-related sediment have been dragged toward the southwest, extending the Kagoshima peninsula in that direction and creating the upland Kyushu Mountain region and southern boundary to the Kumamoto basin. Normal displacement along the Futagawa and Hinagu system represents southern boundary of the extensional rift zone of Central Kyushu, and the right-lateral strike-slip component of motion represents a continuation of compressional stresses driven by Quaternary Median tectonic transform [
1]. Structurally, Futagawa and Hinagu faults strike NE and dip NW at angles of 60 to 80 degrees [
9]. The Kumamoto Plain is reported to have a subsidence rate of 0.45 mm/year in the eastern part and 0.90 mm/year in the western part [
10].
The Kumamoto Plain experienced a major earthquake of seismic intensity five or greater based on the Japanese scale in 1889. Unusual soil alterations from the earthquake, which researchers later concluded was liquefaction, was reported in former river channels and, to a lesser extent, in natural levees. Liquefaction seems to have been a minor concern in the earthquake given the high intensity ground motions. Most damage that was documented was associated with structural collapse and fire [
11,
12,
13]. The most geologically vulnerable zone to soil liquefaction during the 2016 earthquake was observed to have been the anthopogenic-filled former river channels [
1]. These river channels, prior to being filled, were flowing in the center of Kumamoto City, near the historic Kumamoto Castle.
1.3. Volcanic Soils of the Kumamoto Plain
The primary geologic materials of the Kumamoto Plain are pyroclastic flow deposits, welded tuff, andesite basalt, and ash fall with the addition of mudstone, metamorphic rocks, and sandstone for the southern half of the Kumamoto Plain [
2,
6,
14]. These materials form an angular matrix with volcanic glass forming the infill. Many other minerals may also be mixed into this matrix. Sandy loam topsoil of the Kumamoto Plain is primarily composed of non-colored volcanic glass, plagioclase, plant opal, and pumice with secondary composition of allophane with a relatively high amount of organic matter [
15]. Pumaceous or volcanic soils from the Kumamoto Plain were observed to be crushable with high shear resistance and particle angularity, thus demonstrating a higher natural resistance to soil liquefaction [
1,
16,
17,
18]. Several previous studies performed on crushable volcanic soils have observed similar properties and discussed their impacts on conventional liquefaction initiation laboratory testing procedures [
19,
20,
21]. Common in situ methods like the standard penetration test (SPT) and the cone penetration test (CPT) have been observed to under-predict the undisturbed crushable soils’ shear resistance and ability to resist soil liquefaction [
21].
Clay minerals allophane and imogolite are commonly found in the topsoil of the Kumamoto Plain and are the youngest weathered products of volcanic soils in the Kumamoto Plain. Allophane and imogolite are commonly underlain by another clay mineral: halloysite. Older weathered clays are either comprised of kaolinite or Ariake Bay quick clays [
15]. Volcanic ash soils can initially weather to either non-allophanic or allophanic material. In high rainfall and drainage areas, primary material desilication occurs, which leads to the formation of 2:1 Al/Si allophane and its cousin, imogolite [
22]. If the soil is not well drained, the silicates are not able to leech out of the material, and the secondary constituents of the volcanic ash soil may become smectite. In other cases, less desilication results in the formation of halloysite or 1:1 Al/Si allophane.
1.3.1. Allophane and Imogolite
Allophane is a non-crystalline, colloidal, alumino-silicate with SiO
2/Al
2O
3 ratios between one and two. Allophane may seem amorphous but has shapes like hollow spheres, though there is still some variation depending on type and location of the soil [
23]. Allophane is extremely small, even for a clay, making it difficult for scientists to determine its exact mineral structure. With time, allophane begins to conglomerate and form imogolite tubes. Imogolite is a colloidal, jelly-like clay mineral with a tubular structure similar to that found with allophane [
24]. Allophanic clays refer to soils that form allophane, imogolite, and halloysite, as opposed to smectite.
Allophane soils have a texture that is slippery, greasy, and soapy. They are distinct from the texture of montmorillonite, kaolinite, or halloysite soils. Allophanic soils also have uniquely high moisture content. Allophane can hold moisture contents as high as 150 to 200% due to the hollow nature of the microscopic soil structure [
25]. Allophanic clays have a bulk density between 2.5–2.7 g per cubic centimeter, which is similar to other minerals. Allophane and imogolite wet mineral density can vary between 1.8 to 2.9 g per cubic centimeter, thus making it difficult to determine the presence of allophane and imogolite through the measure of particle density alone [
26]. The area directly east (i.e., uphill) of the Kumamoto Plain is largely comprised of allophanic clays [
27,
28].
Volcanic soils also tend to include high amounts of organic matter and are typically layered within organic matter [
25]. Both non-allophanic and allophanic soils are referred to as andosols in Japan. The word andosol comes from the Japanese word “An” meaning black and “do” meaning soil. Young Andosols with low allophane content have a color that is dictated by parent material and organic matter. Andosol low particle density is due to the porous nature of the material, which helps to develop non-crystalline materials and soil organic matter [
25]. The few sand boils that were encountered in Kumamoto following the 2016 KES were comprised of dark black soils, which are indicate they were volcanically derived, likely representing ash and organic material [
1]. Black colored andosols comprise the top layer of the Kumamoto Plain, with increasing thickness the closer to the Aso Caldera.
Allophanic soils are known to undergo irreversible changes when dried. The severity of the drying effect is extreme for allophane dominant soils, but less so for halloysite dominant soils. Air-dried halloysite will experience minor changes to Atterberg limits and gradation properties but will remain relatively similar to the pre-dried properties. Air-dried allophane will result will experience major chances to soil index properties and is considered unreliable for characterizing the properties of the moist in situ soil. Any geotechnical testing that does not account for these potential permanent changes to the allophanic soils could significantly misrepresent the actual properties of the soil [
29].
1.3.2. Halloysite
Halloysite is the resilication and recrystallization of allophane and imogolite and has properties more akin to conventional clay minerals [
30]. Halloysite is sticky to the touch like any other typical clay, rather than soapy and greasy like allophane. The clay mineral is tubular and formed from the spheres and strands of allophane and imogolite. Halloysite begins its formation hydrated with water inside its tube-like structure, just like allophane. With time and heat, the water inside the structure may evaporate and the halloysite may become meta-halloysite [
22]. Once meta-halloysite unrolls completely, it becomes kaolinite clay.
Halloysite formations have no apparent strong correlation with depth or age [
31,
32]. The estimated age of the youngest hydrated halloysite found in Kyushu is approximately 9000 years old, and it was found in the Aso Caldera at a depth of approximately 2 m. A different sample of halloysite from the southern part of Kyushu at a depth of approximately 2.5 m was tested and determined to have been deposited over 30,000 years ago [
33]. This stark difference in age demonstrates the manner that two similar soils deposited at approximately the same depth can have such different age. Generally, allophane is close to the surface, while halloysite is deposited deeper. Halloysite is less plastic than allophane and generally has much lower Atterberg limits and moisture contents [
29].
1.4. The 2016 Kumamoto Earthquake Sequence
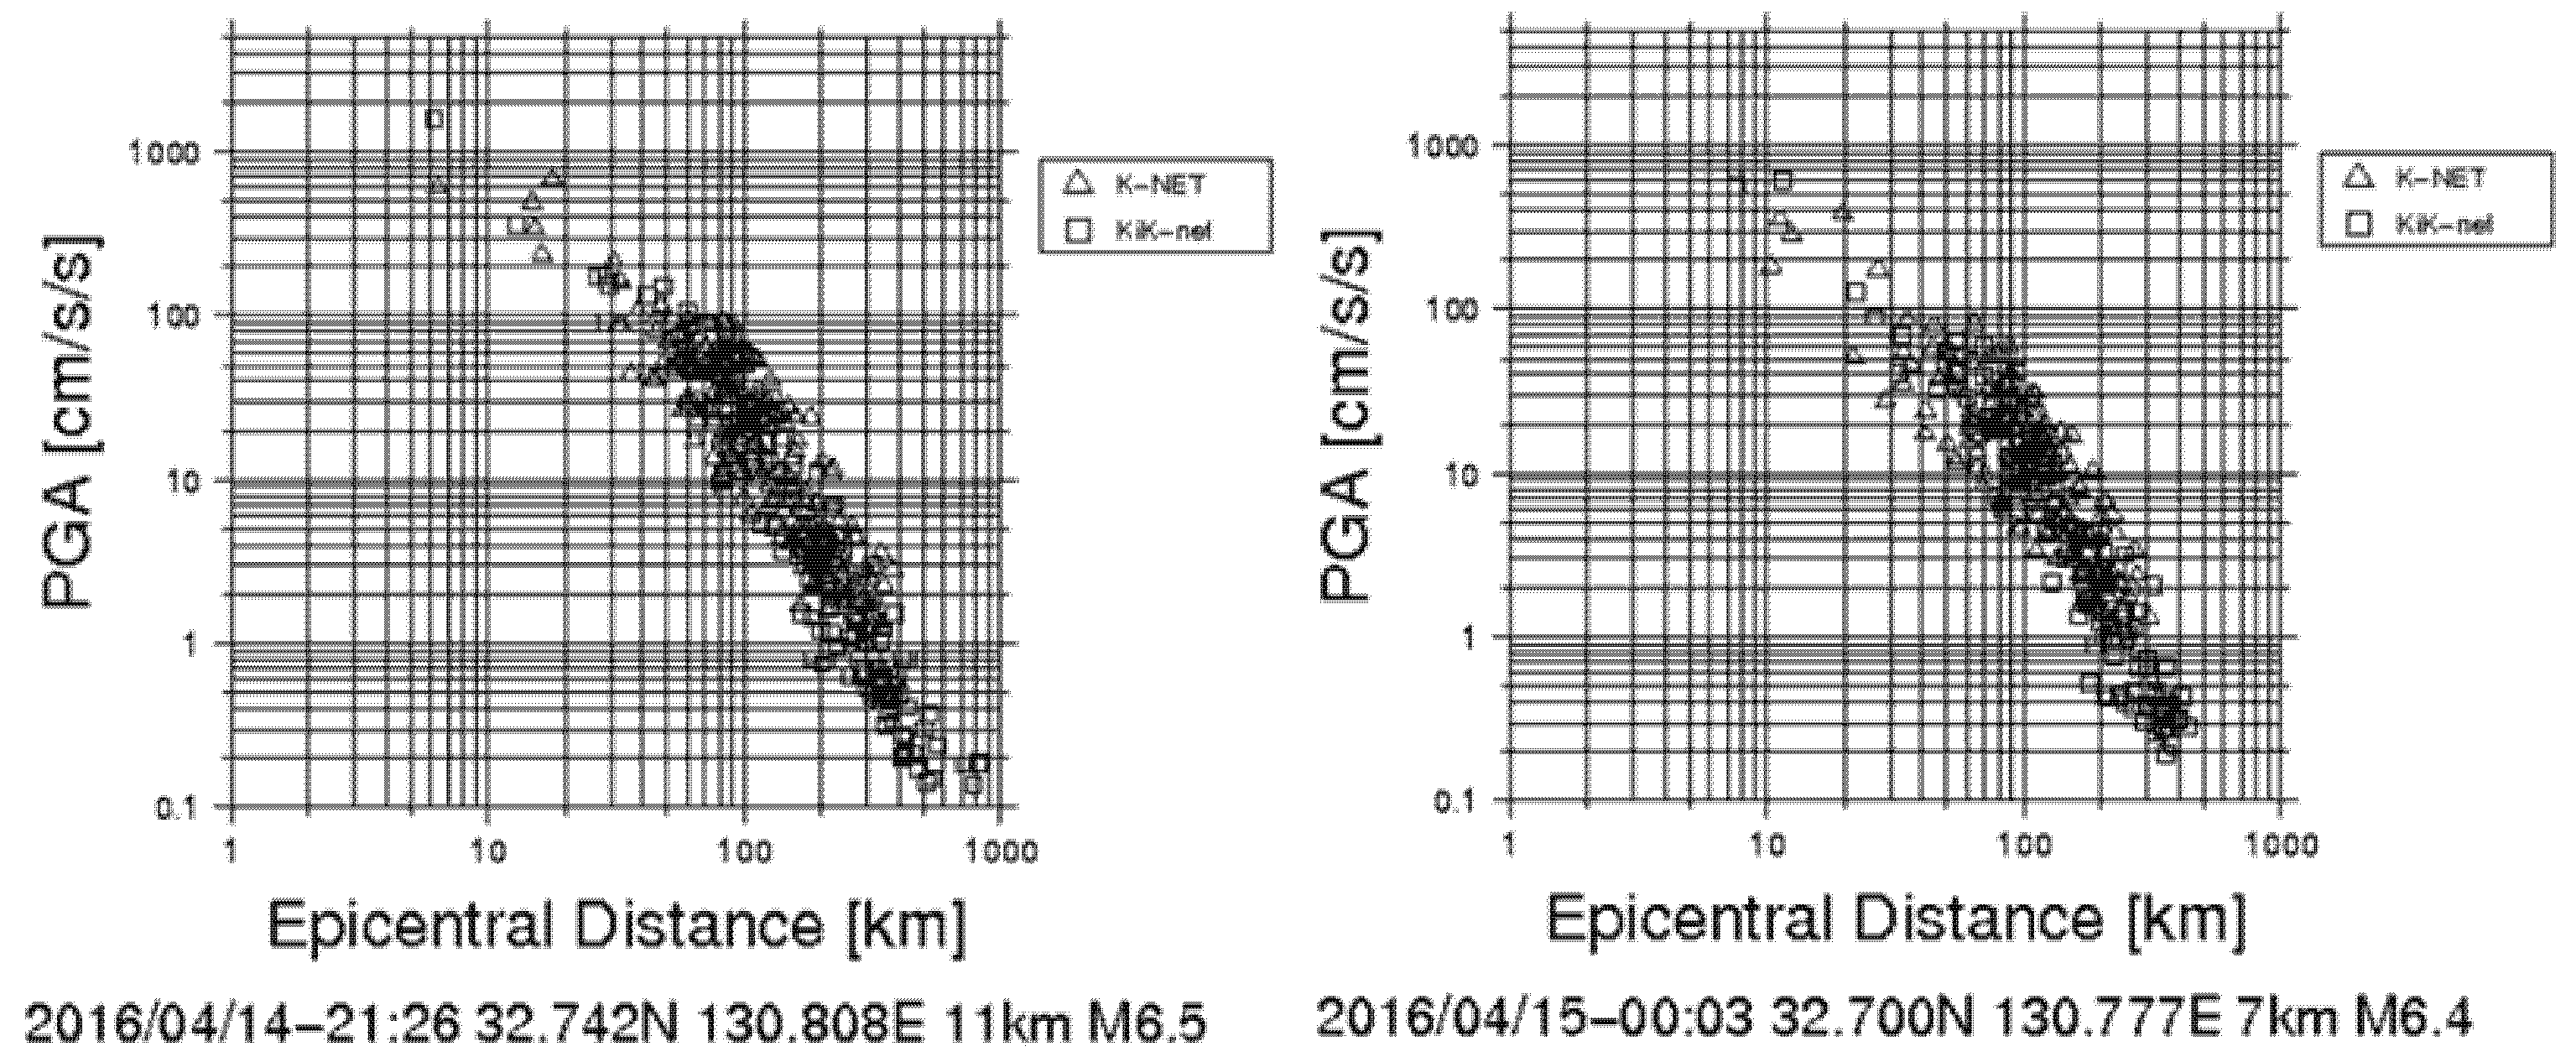
The 2016 Kumamoto Earthquake Sequence (KES) occurred during April of 2016, beginning with two large foreshocks of moment magnitude, Mw 6.2 and 6.0. These foreshocks caused substantial damage and primed the area for the Mw 7.0 mainshock. Many smaller aftershocks occurred but will not be described here. The three larger earthquakes of the KES each produced high intensity ground motions, with recorded PGAs ranging from 0.2 g to 1.2 g during the mainshock. Ground motions and accelerations were accessed on publicly available Japanese strong-motion seismograph networks (K-NET, KiK-net).
The Japanese local magnitude (
Mj) is different than the moment magnitude computed and reported by the U.S. Geological Survey (USGS). The Japanese use a model specifically calibrated to the region to compute their local magnitude, while the USGS gives magnitudes that are useful in comparing the earthquake to other earthquakes around the world [
34]. For this paper, we will use the USGS-calculated moment magnitude, though some of the figures provided by Japanese sources are labeled with the Japanese-computed local magnitude.
1.4.1. Foreshocks
Two sizeable foreshocks of
Mw = 6.2 (
Mj = 6.5) and
Mw = 6.0 (
Mj = 6.4) occurred as part on of the 2016 KES on 14 and 15 April, respectively. The focus of the first foreshock was at 32.74 N 130.81 E at a depth of 11 km below the ground surface [
1]. The faulting mechanism of this first foreshock was a right-lateral strike-slip mechanism with a maximum recorded PGA of 1.08 g. The focus of the second foreshock was at 32.70 N 130.78 E at a depths of 7 km below the ground surface [
1]. The faulting mechanism of the second foreshock was also a right-lateral strike-slip mechanism with maximum recorded PGA of 0.81 g.
Figure 2 presents the attenuation trends of the recorded motions for the two foreshock events.
1.4.2. Mainshock
The
Mw = 7.0 (
Mj = 7.3) mainshock occurred on 16 April at 32.75 N 130.76 E and a depth of 12 km [
1]. Numerous aftershocks occurred following the mainshock, and researchers theorize that many small inactive faults were reactivated by the event [
35]. The maximum recorded PGA was 1.18 g. Kumamoto City, the Aso Caldera, and the Kumamoto Plain were significantly impacted by the mainshock and experienced ground motion intensities between 5.5 and 6.5 on the Japanese intensity scale. Intensities of 6.0 and greater on the Japanese scale are characterized by difficulty in standing during the shaking with most indoor furniture toppling over and structural components such as walls sustaining damage and, in some cases, failing [
1].
Table 1 summarizes the recorded ground motions from the KES mainshock for surrounding ground motions stations.
Figure 3 presents the attenuation trends of the recorded motions for the mainshock event. The ground motions recording stations listed in
Table 1, along with the epicenter locations and mapped fault zones for the Futagawa and Hinagu faults are presented in
Figure 4.
1.5. Observed Soil Liquefaction Evidence and Damage from the 2016 KES
In the days immediately following 2016 KES mainshock, an engineering reconnaissance team was organized by the Geotechnical Extreme Events Reconnaissance Association (GEER), which is sponsored by the US National Science Foundation. This team represented a joint Japanese–American effort and was comprised of researchers from both countries. Three of the authors were members of that team [
1]. Initial evidence emerging from the preliminary “virtual” reconnaissance efforts suggested that surface manifestations and subsequent infrastructure damage from soil liquefaction was likely to be encountered throughout much of Kumamoto and the surrounding area. First, as shown in
Table 1, the ground motions recorded by the earthquake were more than sufficient to generate cyclic shear ratios (CSRs) large enough to trigger soil liquefaction in even moderately susceptible soils. Second, team members understood that the Kumamoto Plain contained large amounts of young (i.e., Holocene) alluvial deposits and shallow groundwater. These soils are among the most susceptible to earthquake-induced soil liquefaction [
36]. Third, preliminary investigation of publicly available soil boring logs throughout the Kumamoto Plain largely indicated substantial amounts of saturated and loose to medium-dense “fine sand” soil (translated from Japanese) as evidenced by recorded SPT blowcounts in the range of 4 to 20 hammer blows per 0.3 m. Fourth, a publicly available liquefaction hazard map of the region [
17] indicated that the entire Kumamoto Plain had an extremely high liquefaction hazard, as demonstrated in
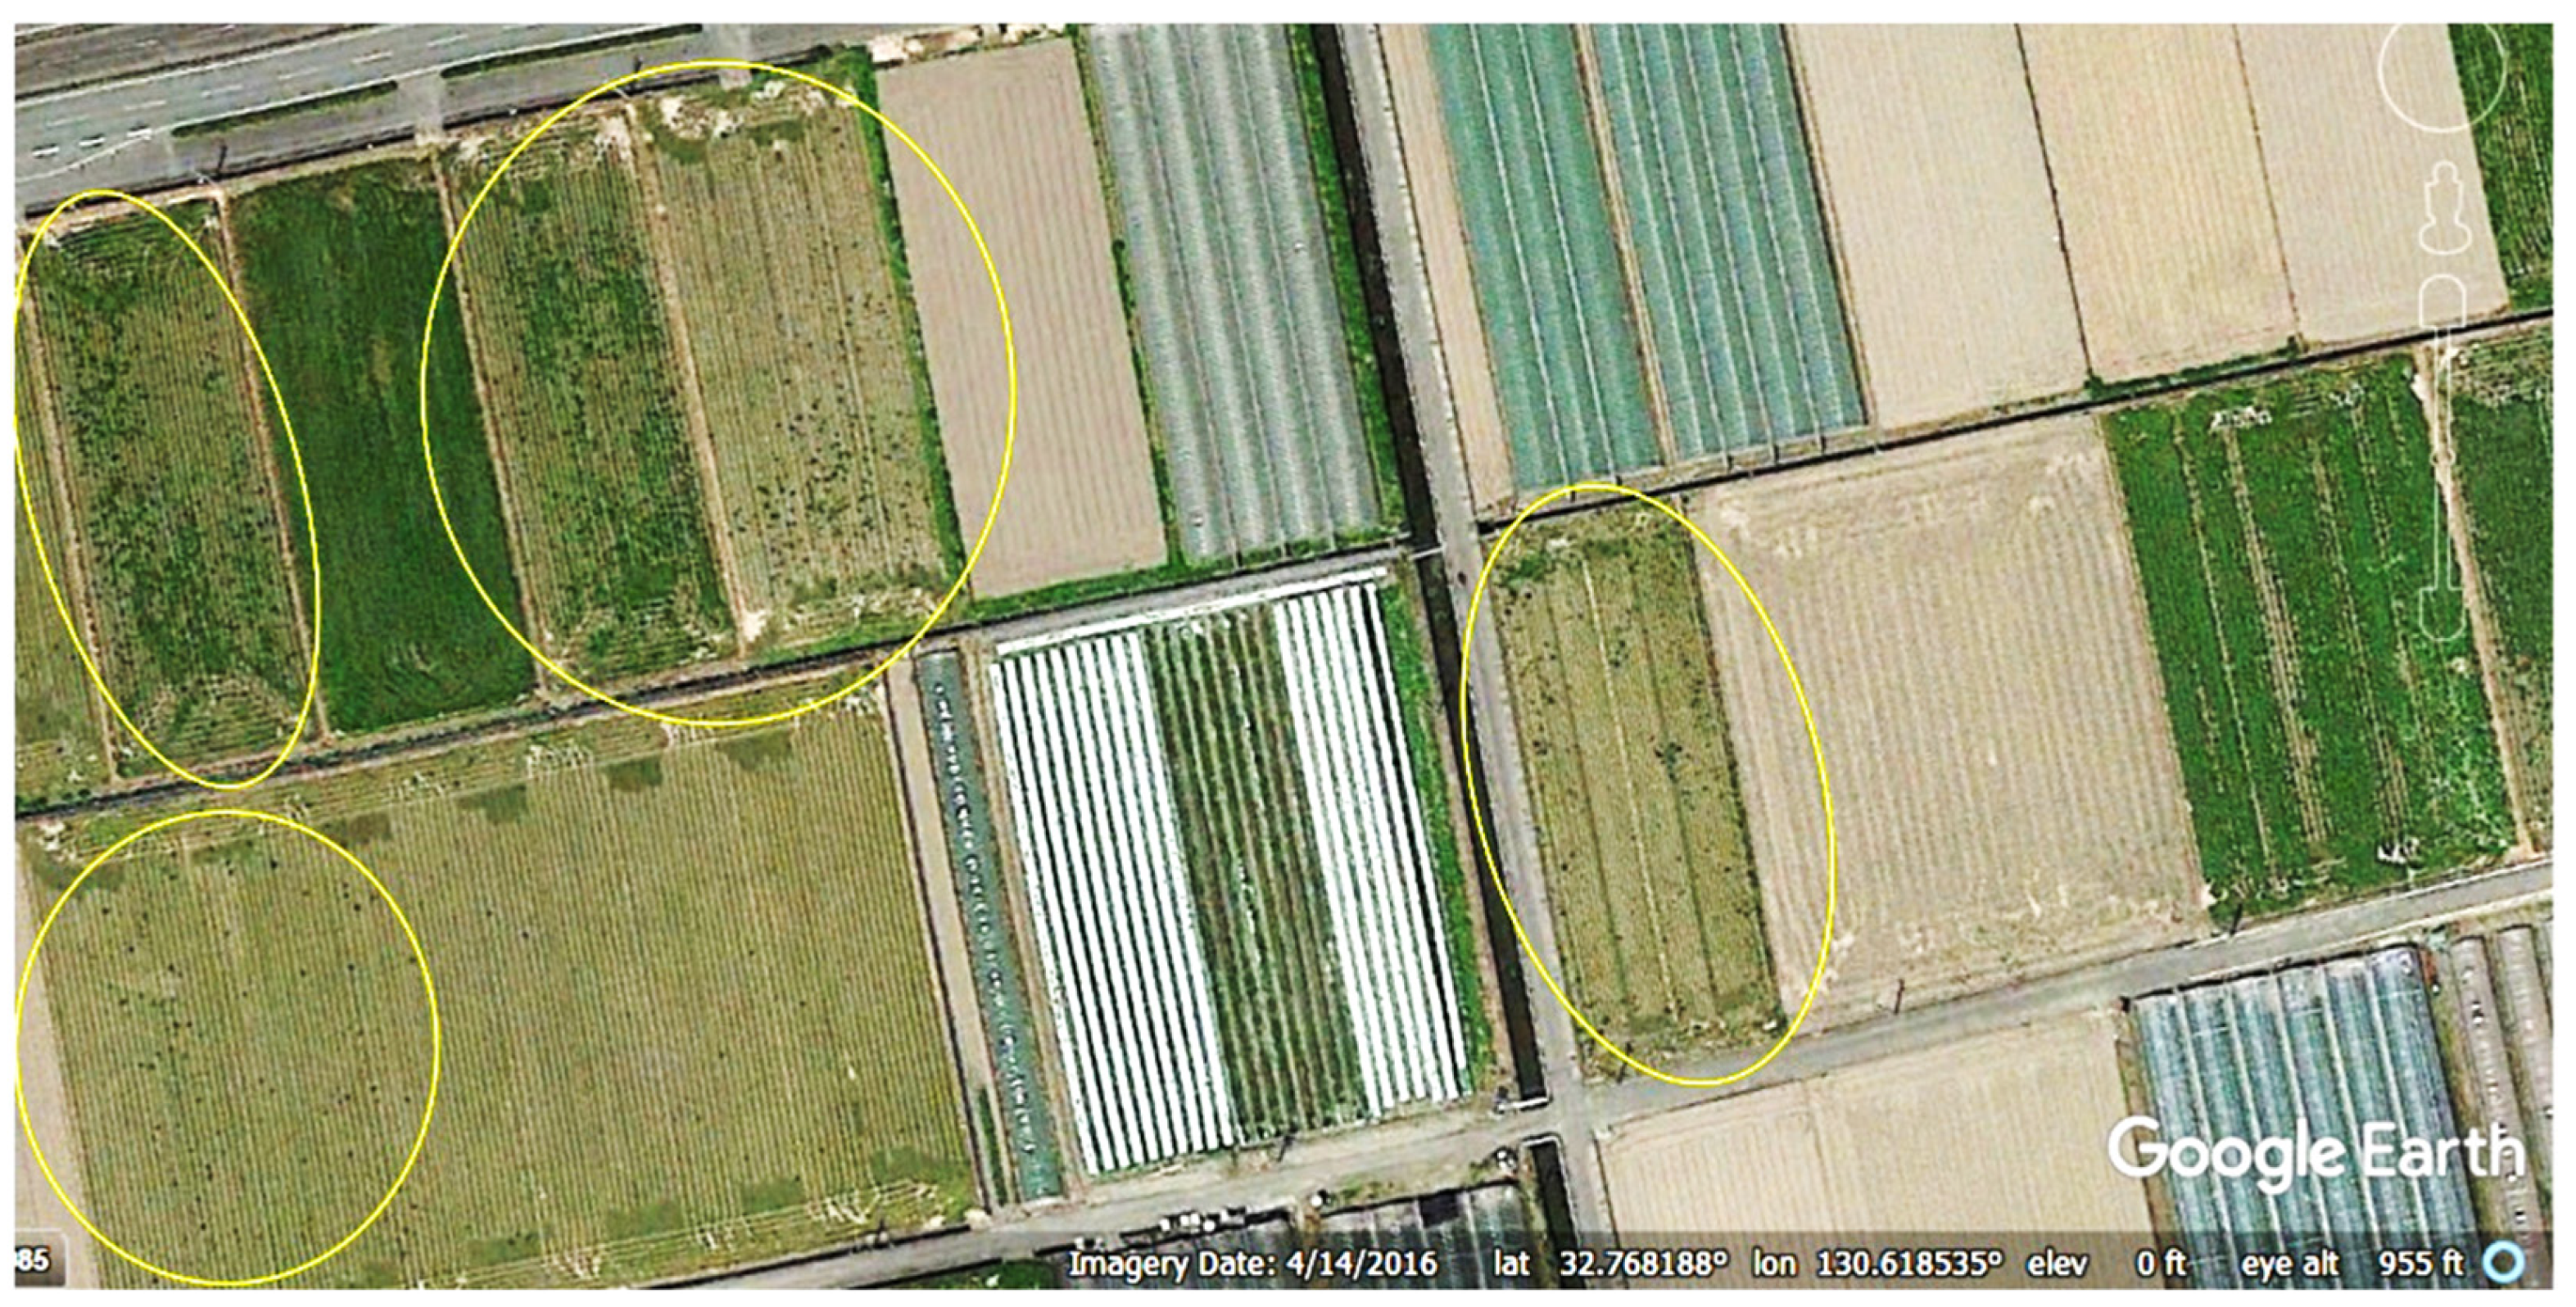
Figure 5. Finally, post-event aerial and satellite imagery showed several curious and small black circles scattered throughout the fields in the Kumamoto Plain and in the Mount Aso crater, as demonstrated in
Figure 6. These circles were identified as possible sand boils and evidence of surface manifestation of liquefaction. Field investigation later revealed these circles to be bundled and burned rice stalks corresponding with the end of the recent rice harvest in the area [
1].
Once the GEER reconnaissance team was on the ground in Kumamoto, it was surprised to find very little visible evidence of soil liquefaction [
1]. Other reconnaissance groups were also surprised to find less evidence of soil liquefaction than they anticipated based on their preliminary investigation [
17,
38]. Even in Mashiki Town, which is located near ground motion station KMMH16 in
Figure 4 and that felt the largest recorded ground motions from the KES mainshock, very few surficial manifestations of liquefaction were observed—mostly limited to areas of backfilled pipelines and manholes [
39]. Mukunoki et al. identified several locations of possible liquefaction based on aerial photographs following the KES mainshock [
17]. However, field reconnaissance by their group confirmed liquefaction evidence and damage at the ground surface at only a small fraction of their identified locations (
Figure 7). The field locations where liquefaction was confirmed are shown as red dots in
Figure 7.
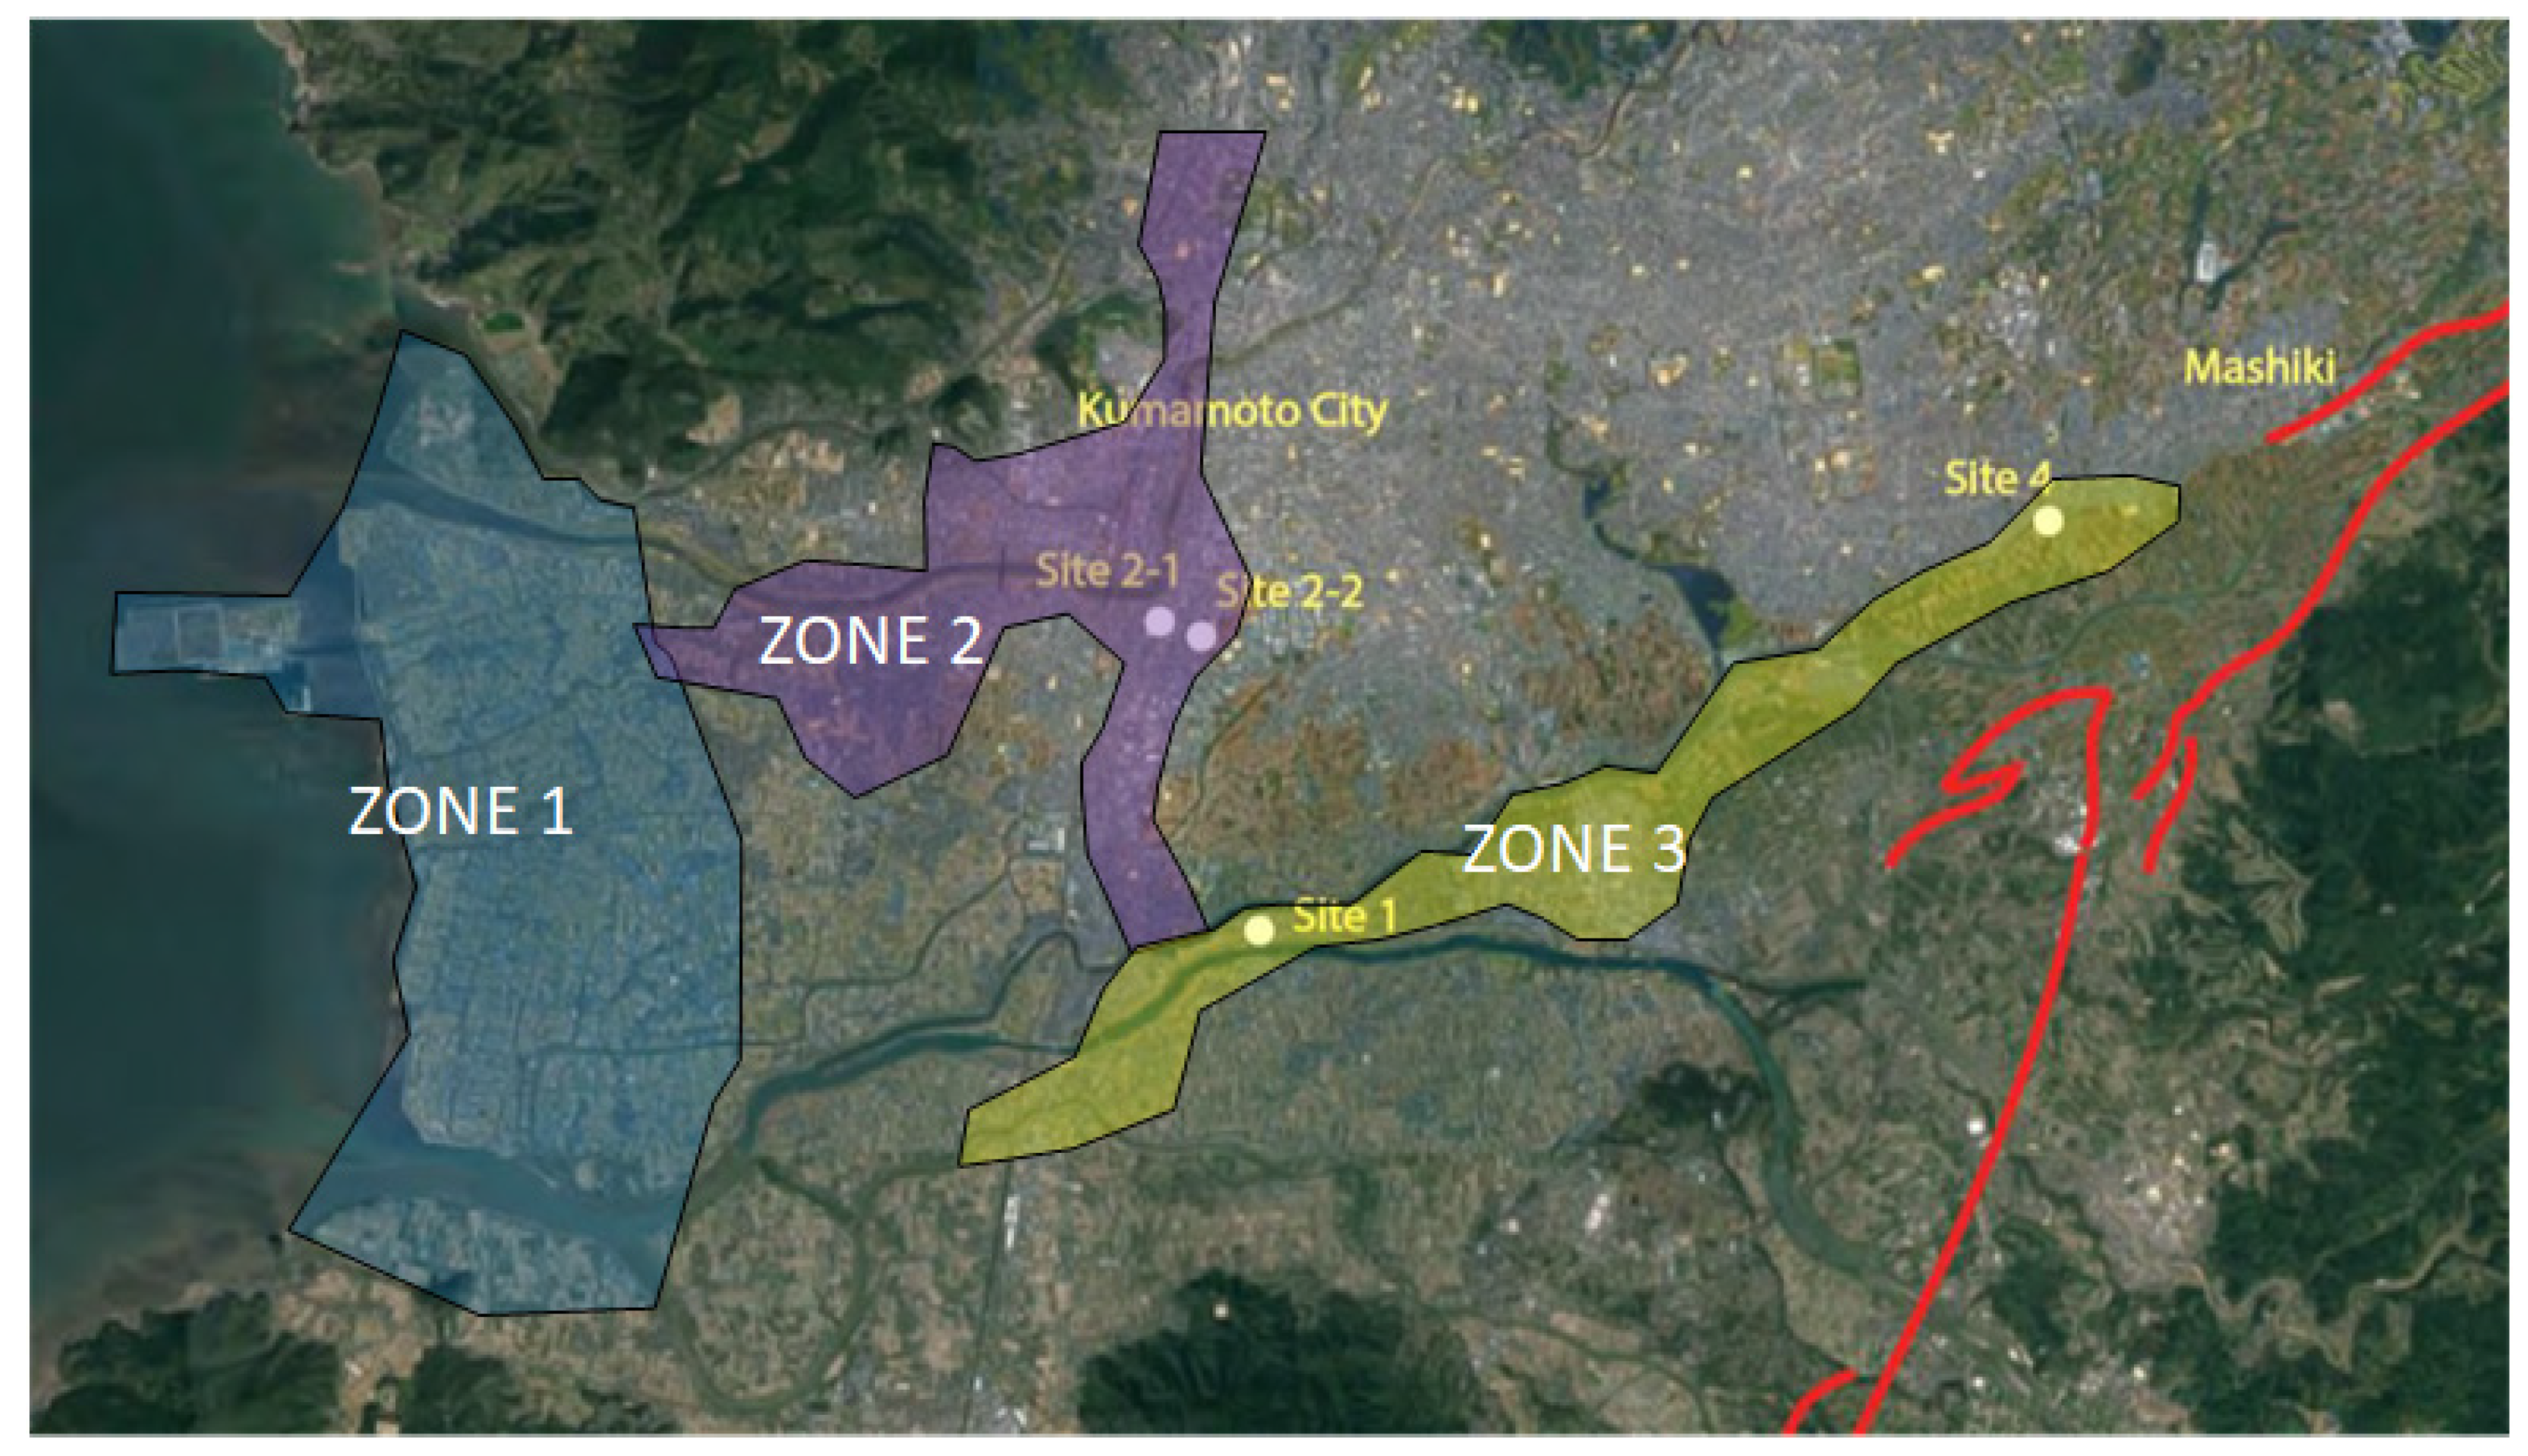
Anderson [
40] delineated three zones where liquefaction effects from the 2016 KES were largely observed. Those zones and their attributes are briefly summarized below.
1.5.1. Zone 1: Anthropogenic Island and Reclaimed Coastline of Kumamoto
The reclaimed coastal areas of the Kumamoto Plain is filled with loosely compacted hydraulic fill composed of sand and silty sand, underlain by Ariake Bay clays. The area’s development is largely limited to residential homes and small businesses given the poor foundational attributes of the soil. During the 2016 KES, the reclaimed land had little confirmed liquefaction due to the high fines content and medium plasticity of the soils, regardless of the sandy nature of the soil. The soil in Zone 1 is soft and mixed with calcitic soils such as seashells; the soil is likely composed of recycled seabed materials. The estimated PGA in Zone 1 was approximately 0.5 g [
1], which is certainly strong enough to trigger substantial liquefaction in the presence of susceptible soils. Prior to the 2016 KES, this area of the Kumamoto Plain was predicted to experience extremely high liquefaction in a major earthquake, as shown in
Figure 5. Liquefaction that was observed in this zone was largely limited to the sandy deposits at the mouths of the Shirakawa and Midorikawa Rivers. Publicly available boring logs showed mostly medium and fine sand deposits. In addition, these areas contain many engineered sea walls that were likely constructed with clean sands and gravels, which are more susceptible to liquefaction.
1.5.2. Zone 2: Ancient River Channels in Kumamoto City
Several ancient river channels liquefied in Kumamoto City, in line with accounts of the 1889 Kumamoto Earthquake, which describe ancient river channels near the castle liquefying [
12]. The largest N-S liquefaction channel, shown in Zone 2 in
Figure 7, has no official records indicating it was a former river channel. Ultimately, the Japanese Ministry of Land, Infrastructure, Transport and Tourism has concluded that the area was an ancient river that was filled in during the Edo Period, roughly 400 years ago [
41]. Existing boring logs of areas on the liquefied strip show poorly graded sand and medium sand, which differ from the high plasticity and fines content indicated in boring logs located near, but not on, the liquefied strip [
42]. The material of this liquefied strip appears to be fill material, which is supported by historical markers that mention a bridge in the area and a large irrigation channel that runs south along what would be the ancient river’s length. Available historical evidence suggest that this area is an ancient river [
1,
16]. There appear to be two other possible ancient river channels: one located to the west of the major liquefied strip in Zone 2, and one located to the north.
1.5.3. Zone 3: Rivers to the South of Kumamoto City
Liquefaction along the levees and fields of the Shirakawa River was mostly absent, which reflects the dominant influence of volcanic soils that have a lower susceptibility to liquefaction triggering. Levees and fields along the Kase and Midorikawa Rivers showed much more minor liquefaction, which reflects the influence of the other non-volcanic deposits.
Only one lateral spread was encountered by the authors and their colleagues during post-event reconnaissance, though a few cases of lateral spreading were located by Japanese researchers [
1,
40]. Lateral spread was neither severe nor widespread, and most levee damage observed during post-event reconnaissance can be attributed to ground motions and general subsidence. Lateral spreading that occurred in Kumamoto was very minor compared to other lateral spread events in Japan such as the 2011 Tohoku, 1995 Kobe, and the 1964 Niigata Earthquakes [
43,
44,
45]. Most levee damage was repaired within a few weeks after the earthquake and was not observed by the authors nor their team [
1,
41]. The dearth of observed lateral spread failures given the many miles of waterways, alluvial sand deposits in the Kumamoto Plain, and the very strong ground motions is truly astounding.
Japanese researchers found surface evidence of liquefaction at the intersection of the Yakata, Kiyama, and Akizu Rivers. [
39]. These three rivers converge to form the Kase River, which flows through the Kumamoto Plain between the Shirakawa and Midorikawa Rivers. The area at the river convergence had a residential neighborhood that experienced moderate liquefaction induced tilting of homes. One lateral spread occurred over a small section of the Akizu River and was confirmed to be due to an anthropogenically-filled river channel in the area [
39]. Over the last 40 years, many of the rivers in the Kumamoto Plain, and especially the Kase River, have been rerouted and engineered for flood protection. For example, many of the rivers along the Kumamoto Plain used to meander but have since been widened and straightened in the present day. Due to major river alterations, recycled fill material seems to have been used to refill the old river channels. Overall, liquefaction in the southern Kumamoto Plain was limited to instances of minor liquefaction on levees with most minor liquefaction occurring on adjacent rice fields and residential neighborhoods.
2. Materials and Methods
To investigate the possible causes of the over-prediction of soil liquefaction from the 2016 KES, the authors returned to Kumamoto in 2017 to investigate four different sites with various liquefaction observations following the earthquakes. This section describes the data that were obtained from the field, the methods of exploration, the laboratory testing performed, and the liquefaction triggering analysis that was performed based on the results of the field exploration.
2.1. Site Selection
Four sites were selected based on the presence (or lack of) surface evidence of liquefaction. A site vicinity map of the four sites is shown in
Figure 8.
Sites 2-1 and 2-2 were chosen to test Zone 2 (i.e., the liquefied river channels). Sites 1 and 4 were chosen to test Zone 3 (i.e., the liquefied levees and fields in the south of the Kumamoto plain). Site 1 was chosen because of its proximity to liquefied farm fields, but no surface manifestation of liquefaction was observed at the site. This neighborhood experienced no liquefaction and was located on a natural levee. Site 2-1 was chosen because it experienced the most severe liquefaction in Kumamoto city. Site 2-2 was located nearby to site 2-1 and suffered no obvious liquefaction damage. Site 4 was located on a former river channel on the Akizu River that has now been transformed into a backyard farming plot. The site is located close to the epicenter and was chosen because liquefaction evidence was observed at the site in the form of ground cracking typically consistent with lateral spread displacement.
Table 2 summarizes the location of the selected sites [
46].
2.2. Site Characterization Methods
At each of the four sites, we performed a SPT, an adjacent CPT, and laboratory index testing of soil samples that included sieve analysis and Atterberg limit tests. All field testing and index testing was performed by Tokyo Soils and Research. Visual classifications were performed in Japanese in the field during the borings and were later translated to English.
In addition to in situ geotechnical testing and laboratory index testing, several soil samples from Site 2-1 were obtained with a piston sampler, sealed, and sent to the geotechnical testing laboratory at University of Colorado at Boulder for testing in a consolidated-undrained cyclic triaxial shear device at a loading frequency of 1 Hz. More details regarding this testing are described in Anderson [
40] and Anderson et al. [
46].
2.3. Assessment of Standard Liquefaction Susceptibility and Triggering Methods to the Kumamoto Soils
To better understand how liquefaction was overpredicted by experts immediately following the 2016 KES, we sought to assess the accuracy of current liquefaction triggering prediction methods against the observed surface manifestations at the four selected and characterized sites in Kumamoto. First, the soils at each site were evaluated for liquefaction susceptibility. For SPT data, two methods based on compositional criteria [
47,
48] were used. For CPT data, the susceptibility criteria of Youd et al. [
49] was used with the soil behavior type index,
Ic. Soil layers that were not susceptible to liquefaction triggering based on these criteria were removed from the analysis. Next, liquefaction triggering was assessed [
40] using the Boulanger and Idriss deterministic triggering method for the SPT [
50] and the NCEER method for the CPT [
49]. Since the time this study was performed, other liquefaction triggering procedures were introduced in the literature e.g., [
51,
52]. Future studies may look to evaluate the soundings and borings from these sites using these newer procedures. The software CLiq [
53] was used to analyze the CPT soundings for liquefaction susceptibility and triggering. A summary of the results will be provided in the following section.
Estimates of ground surface maximum acceleration,
were required for to perform the liquefaction triggering analysis. Based on the initial shake maps of the event [
1] and the proximal ground motion recording stations summarized in
Table 1, we assigned values of 1.0 g to
for Sites 1 and 4, and we assigned values of 0.5 g to
for Sites 2-1 and 2-2 at the time of this study. More recent shake maps will likely show values that differ from these approximated values, but those differences are likely to be less than 10%. Furthermore, at ground motions greater than 0.5 g, variations of 10% in
are unlikely to yield any substantial differences in the observed triggering results.
3. Results
3.1. Site Characterization and Lab Testing Results
3.1.1. Site Characterization at Site 1
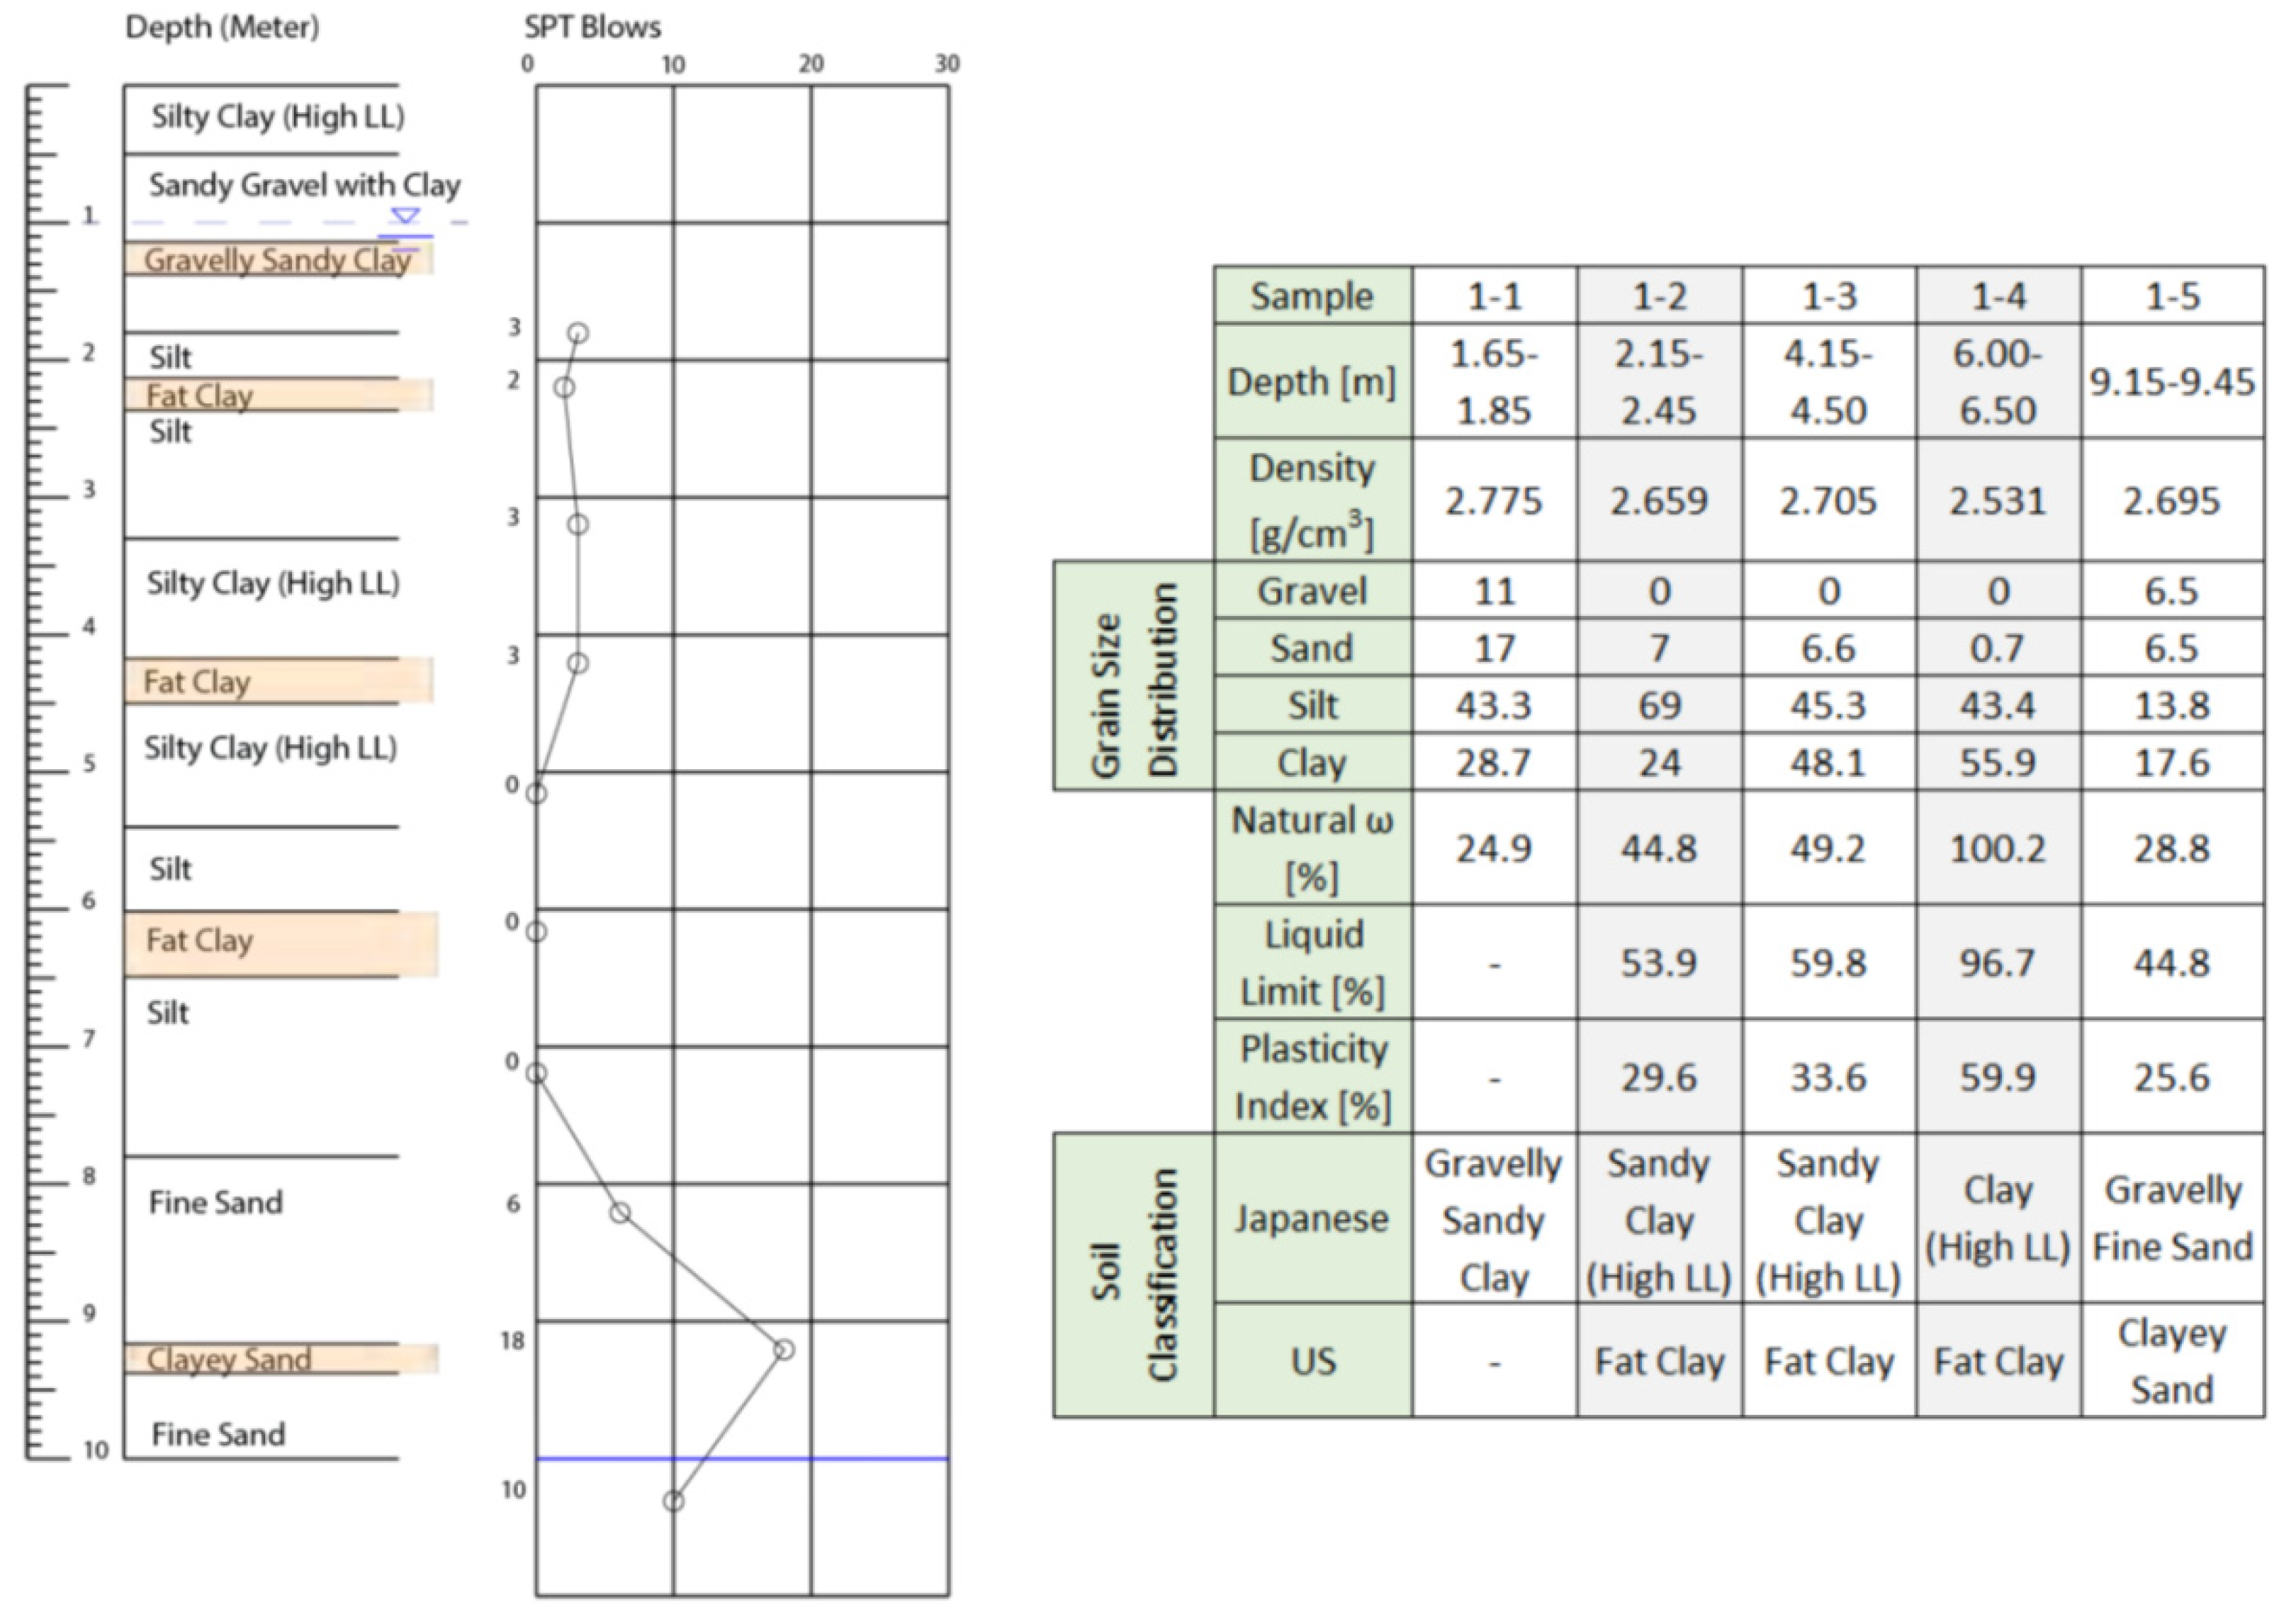
The energy and overburden-corrected SPT profile and laboratory index test results for Site 1 are presented in
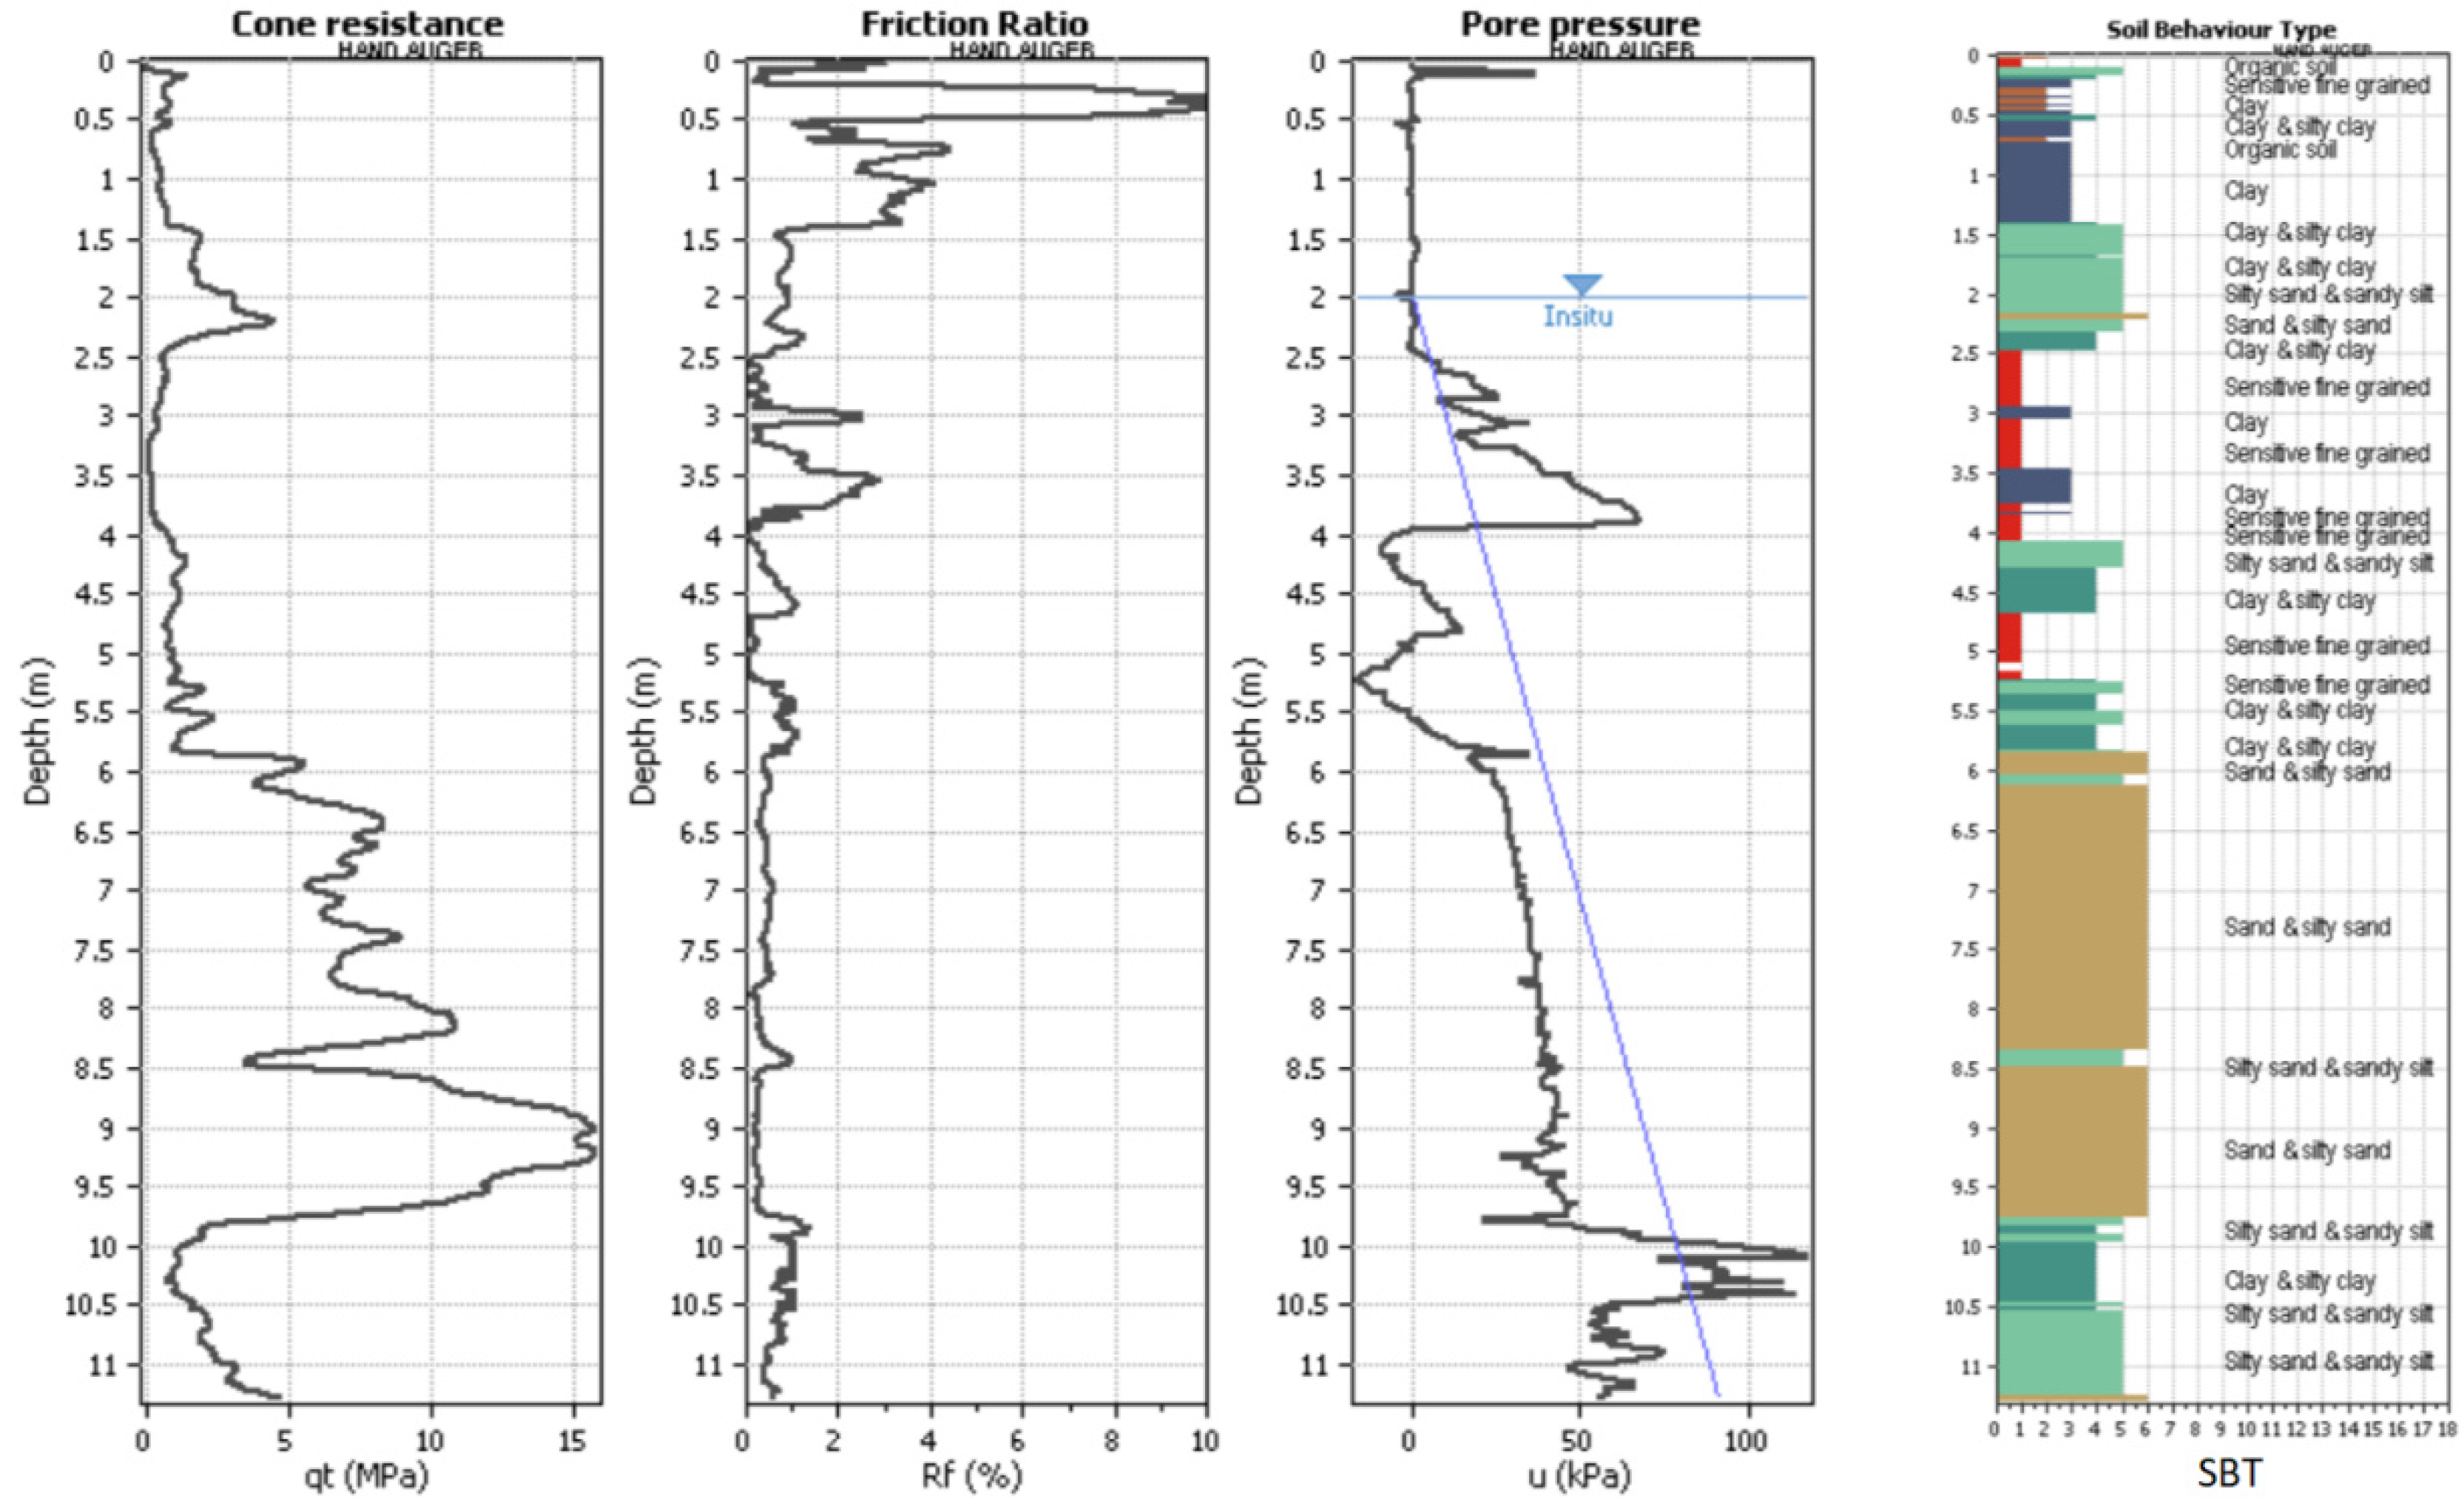
Figure 9. The soil boring predominantly shows soil layering with alternating bands of high plasticity clay, silt, and fine sand. The adjacent CPT sounding results and resulting soil behavior type (SBT) plot are presented in
Figure 10. Of particular interest and concern are the significant amounts of soil characterized as “Sensitive Fine Grained,” which demonstrate the incredibly soft and compressible nature of the clayey sediments in the soil profile.
3.1.2. Site Characterization at Site 2-1
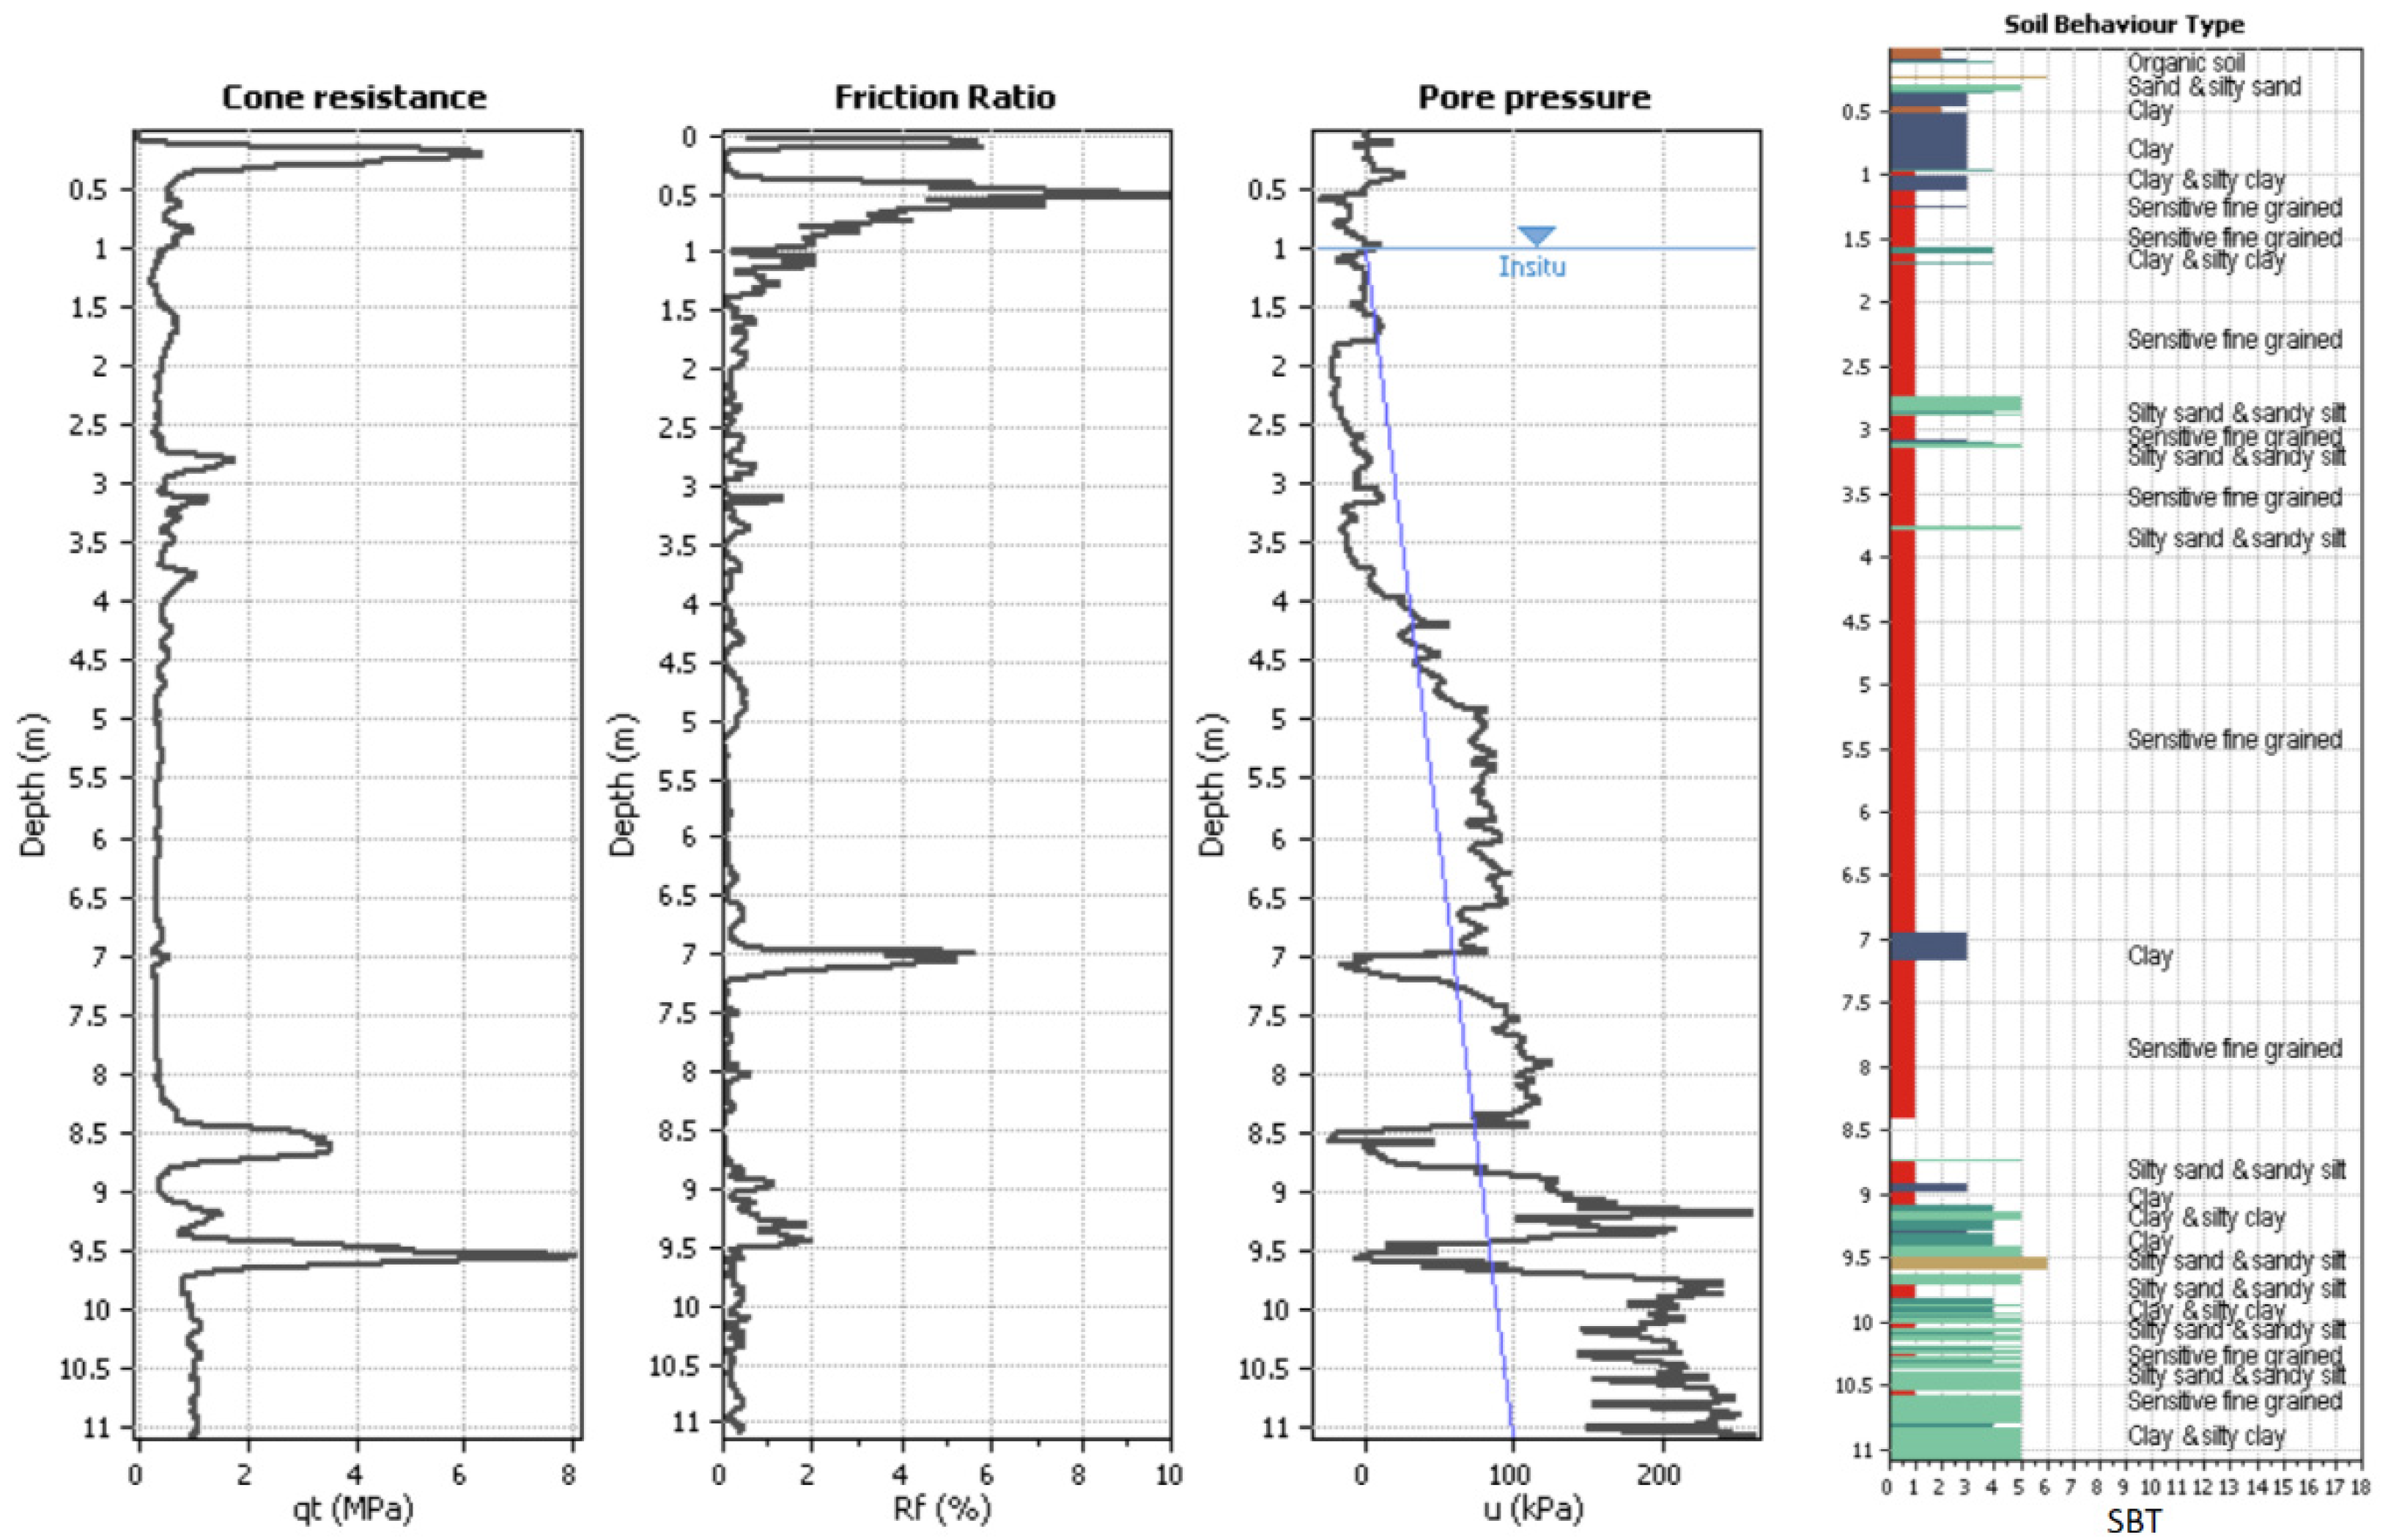
The energy and overburden-corrected SPT profile and laboratory index test results for Site 2-1 are presented in
Figure 11. The soil boring predominantly shows much higher amounts of loose to medium-dense sand than at Site 1, which is consistent with the surface manifestations of liquefaction at the site. The adjacent CPT sounding and resulting soil behavior type (SBT) plot are presented in
Figure 12. Like the soil boring, the CPT sounding significantly more sand content than in the CPT at Site 1.
Cyclic undrained triaxial testing was also performed on minimally disturbed soil specimens from Site 2-1, obtained with a piston sampler. We acknowledge that such sampling methods are not ideal in sandy soils, and it is likely that our collected samples were somewhat disturbed as a result. Nevertheless, our intention in the sampling was to obtain a precursory idea of the liquefaction resistance of the Kumamoto soils in a controlled laboratory environment. In some specimens that were mainly sand with no cohesion, water was drained from the plastic tubes to generate temporary capillary forces (negative pore water pressure) in the sand specimen. These temporary forces minimized sample disturbance during transportation and trimming. The soil specimens that had some cohesion were produced in the laboratory by first carefully pulling the soil from the plastic tubes. After being vertically extruded from the tube, each intact specimen was cut with a thin sharp edge to a height of two sample tube diameters, according to ASTM D5311. The diameter of the triaxial specimen obtained in this way was not reduced by trimming. It remained the same as it was after the extrusion. The specimen then was slid carefully onto the fine-grained porous stone with filter paper fixed onto the triaxial cell pedestal. The top porous stone was placed on the top of the specimen with filter papers, and a membrane was placed around it by means of a membrane stretcher and vacuum. The vacuum was then released so that the membrane became slightly pressed against the specimen and also grasped both porous stones. The triaxial top cap was first mounted by fixing it on the rigid columns located inside the cell, and the top specimen cap was then lowered onto the top porous stone already sitting on the specimen. Finally, the cell was closed and sealed by vacuum grease. Then, the triaxial cell was transferred from the preparation table to the cyclic testing frame. Here, the cell was fixed to the base of the frame and attached to the vertical actuator and transducer, volume change burette, and pore water pressure transducer then the triaxial cell was filled with de-aired.
After the soil specimens were prepared based on the procedure mentioned above, the specimens were slowly flushed with fresh de-aired water from the bottom to the top of the specimen. After the flushing stage, back-pressure saturation was conducted. Back pressure and cell pressure increments equal to 20 kPa and an initial mean effective stress equal to 20 kPa were used at saturation stage until the pore pressure coefficient B reached a value of 0.95 or higher. Volume and height changes were recorded for each specimen during both the flushing and back pressure saturation stages using an external LVDT, which was securely connected to the axial actuator and piston rod. The volumetric strain was measured precisely for each specimen during the flushing and back pressure saturation stages using a calibrated electronic volume measuring apparatus. The time interval required to achieve saturation ranged from 1 to 2 h depending on the fines content of the tested soil. After back pressure saturation, the specimens were subjected to isotropic mean effective stress equal to 100 kPa and were used in all the undrained cyclic tests. The time required to complete the isotropic compression stage was about 1 h and when both the volume change and vertical strain reached the critical state.
The cyclic strain-controlled tests were conducted in the sinusoidal mode with the servo-hydraulic closed loop system with calibrated digital instrumentation for measuring load, displacement, and pressure. These tests were conducted following the specifications of ASTM D5311 and BS 1377. During Cyclic axial loading, a cyclic load was applied to the saturated specimens and the variation of axial stress, excess pore water pressure, and axial strain of the specimen were continuously recorded during cyclic loading. The intensity of the cyclic load was varied in such a way as to produce a wide range of cyclic stress ratios that simulate or mimic the cyclic stress ratios that the soil exposed in the field and corresponding number of cycles required to cause initial liquefaction. It should be noted that initial liquefaction occurs when the excess pore water pressure becomes equal to the initial consolidation stress of the specimen. The cyclic loading in the cyclic triaxial tests was applied with frequency equal to 1 Hz.
All cyclic triaxial tests were conducted in strain-controlled mode because (1) strain-controlled tests cause less water content redistribution in soil samples before initial liquefaction occurs and provides more realistic predictions of in situ pore pressures than those obtained from stress-controlled tests; and (2) stress-controlled triaxial tests are less accurate due to the development of different strains during compression and extension phases. They also increase strains as the number of cycles progresses, which makes the determination of shear modulus and damping ratio values more difficult.
The results of the triaxial cyclic shear tests from Site 2-1 are presented in
Figure 13. The star in the figure represents our best estimate of the peak cyclic stress ratio (CSR) that the native soil was exposed to during the 2016 KES. The line in the figure represents the best-fit trendline for approximating the liquefaction triggering boundary. Based on our interpretation of the test, the native soil is located very near to the regressed liquefaction triggering boundary, further providing laboratory evidence that the majority of the soils at Site 2-1 either liquefied or were very close to liquefying. Additional undrained cyclic shear tests from Site 2-1 could be performed in future research to further test our observations made here based on our minimally disturbed samples. Ideally, frozen and cored samples of soil should be tested in future research.
3.1.3. Site Characterization at Site 2-2
The energy and overburden-corrected SPT profile and laboratory index test results for Site 2-2 are presented in
Figure 14. The soil boring shows predominantly very soft, thinly-bedded sediments comprised of clay, silt, and fine sand in the upper 6 m of soil. Underlying that soft soil is more uniform sand and silty sand that is medium dense. The adjacent CPT sounding and resulting soil behavior type (SBT) plot are presented in
Figure 15. Note that at Site 2-2, where there were no surface manifestations of liquefaction, the more uniform sand is below a depth of 6 m and is capped by fine-grained soil layers. Comparatively, the soils at Site 2-1, which were observed to have liquefied, show the more uniform sand/silty sand at depths shallower than 6 m below the ground surface.
3.1.4. Site Characterization at Site 4
The energy and overburden-corrected SPT profile and laboratory index test results for Site 4 are presented in
Figure 16. The adjacent CPT sounding and resulting soil behavior type (SBT) plot are presented in
Figure 17. Both the SPT and CPT testing show a substantial amount of organic, sensitive fine-grained soils at Site 4. Based on compositional criteria alone [
47,
48], these soils were not susceptible to soil liquefaction. Therefore, it is likely that the ground cracking that was assumed to be liquefaction-induced lateral spread at Site 4 was caused instead by cyclic softening of the soils and a slope stability failure. Future studies on this particular site could explore that possibility.
3.2. Summary of Liquefaction Susceptibility and Triggering Results Using Standard Methods
3.2.1. Susceptibility and Triggering Results at Site 1
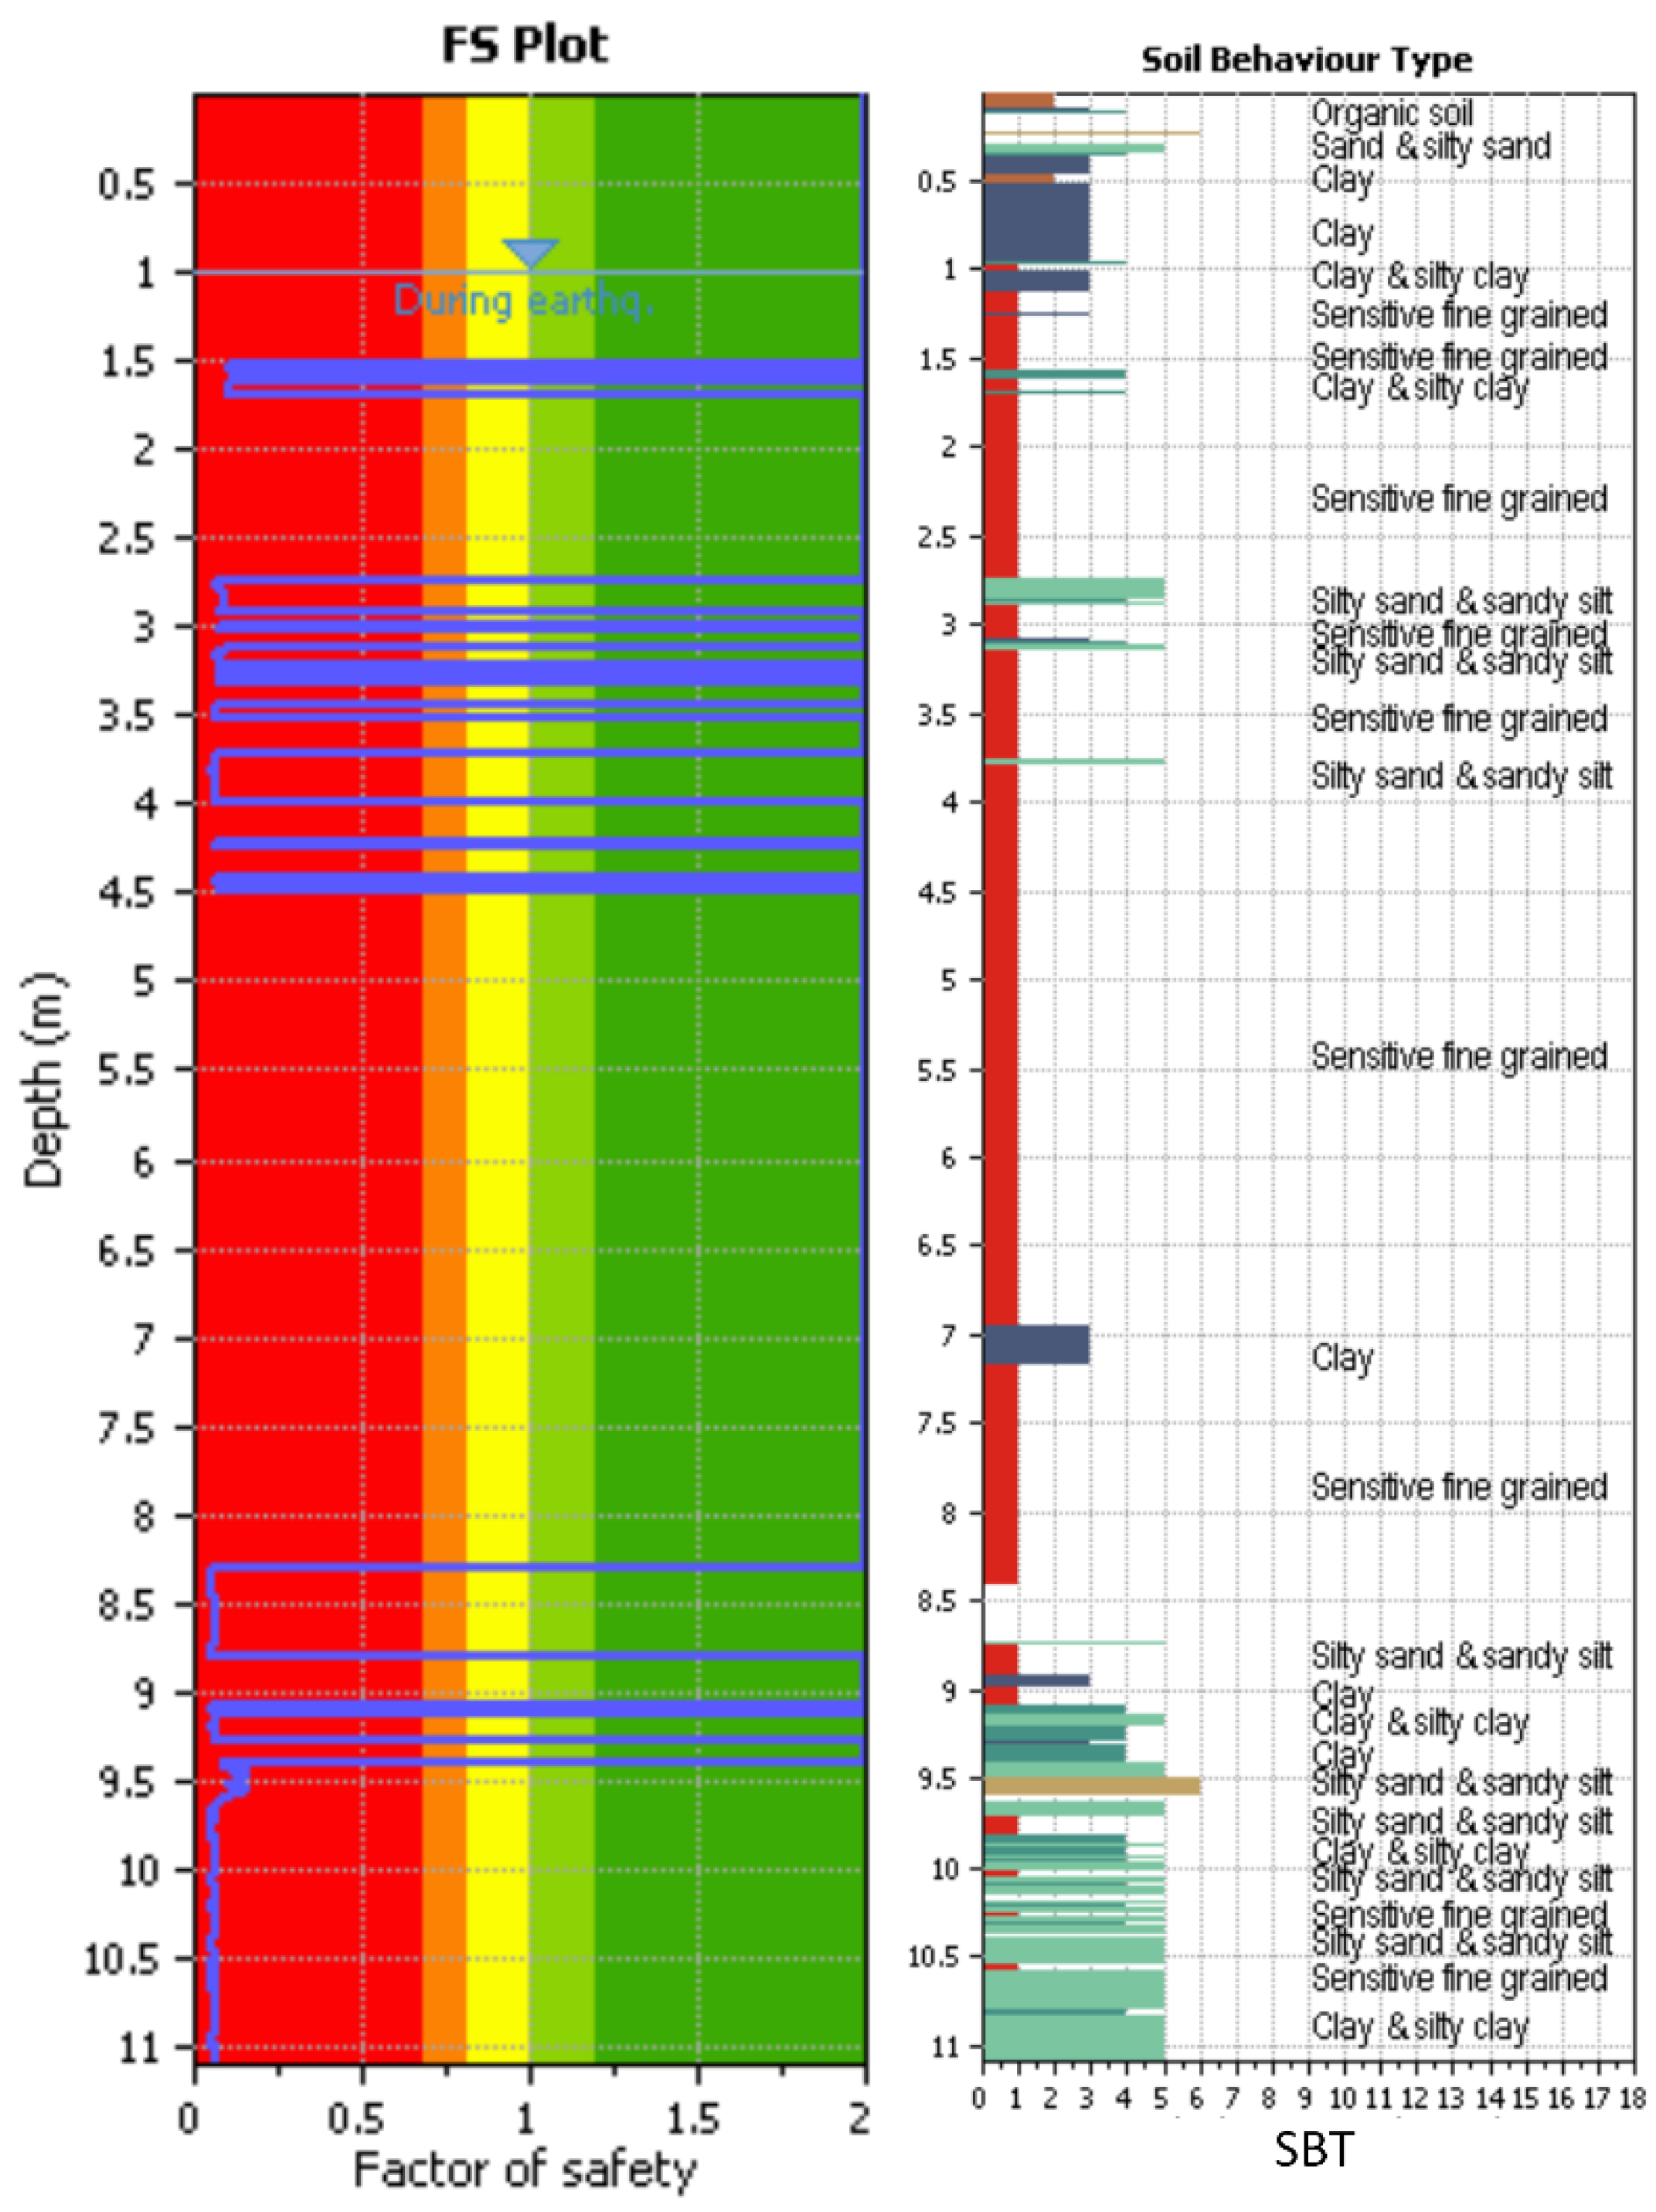
Evaluation of the compositional criteria for the soils in encountered in the boring performed at Site 1 showed that none of the encountered soils were susceptible to liquefaction triggering based on the susceptibility criteria selected for this study. As such, a liquefaction triggering analysis was not performed for the boring, and no liquefaction was predicted for the site based on the boring and SPT results.
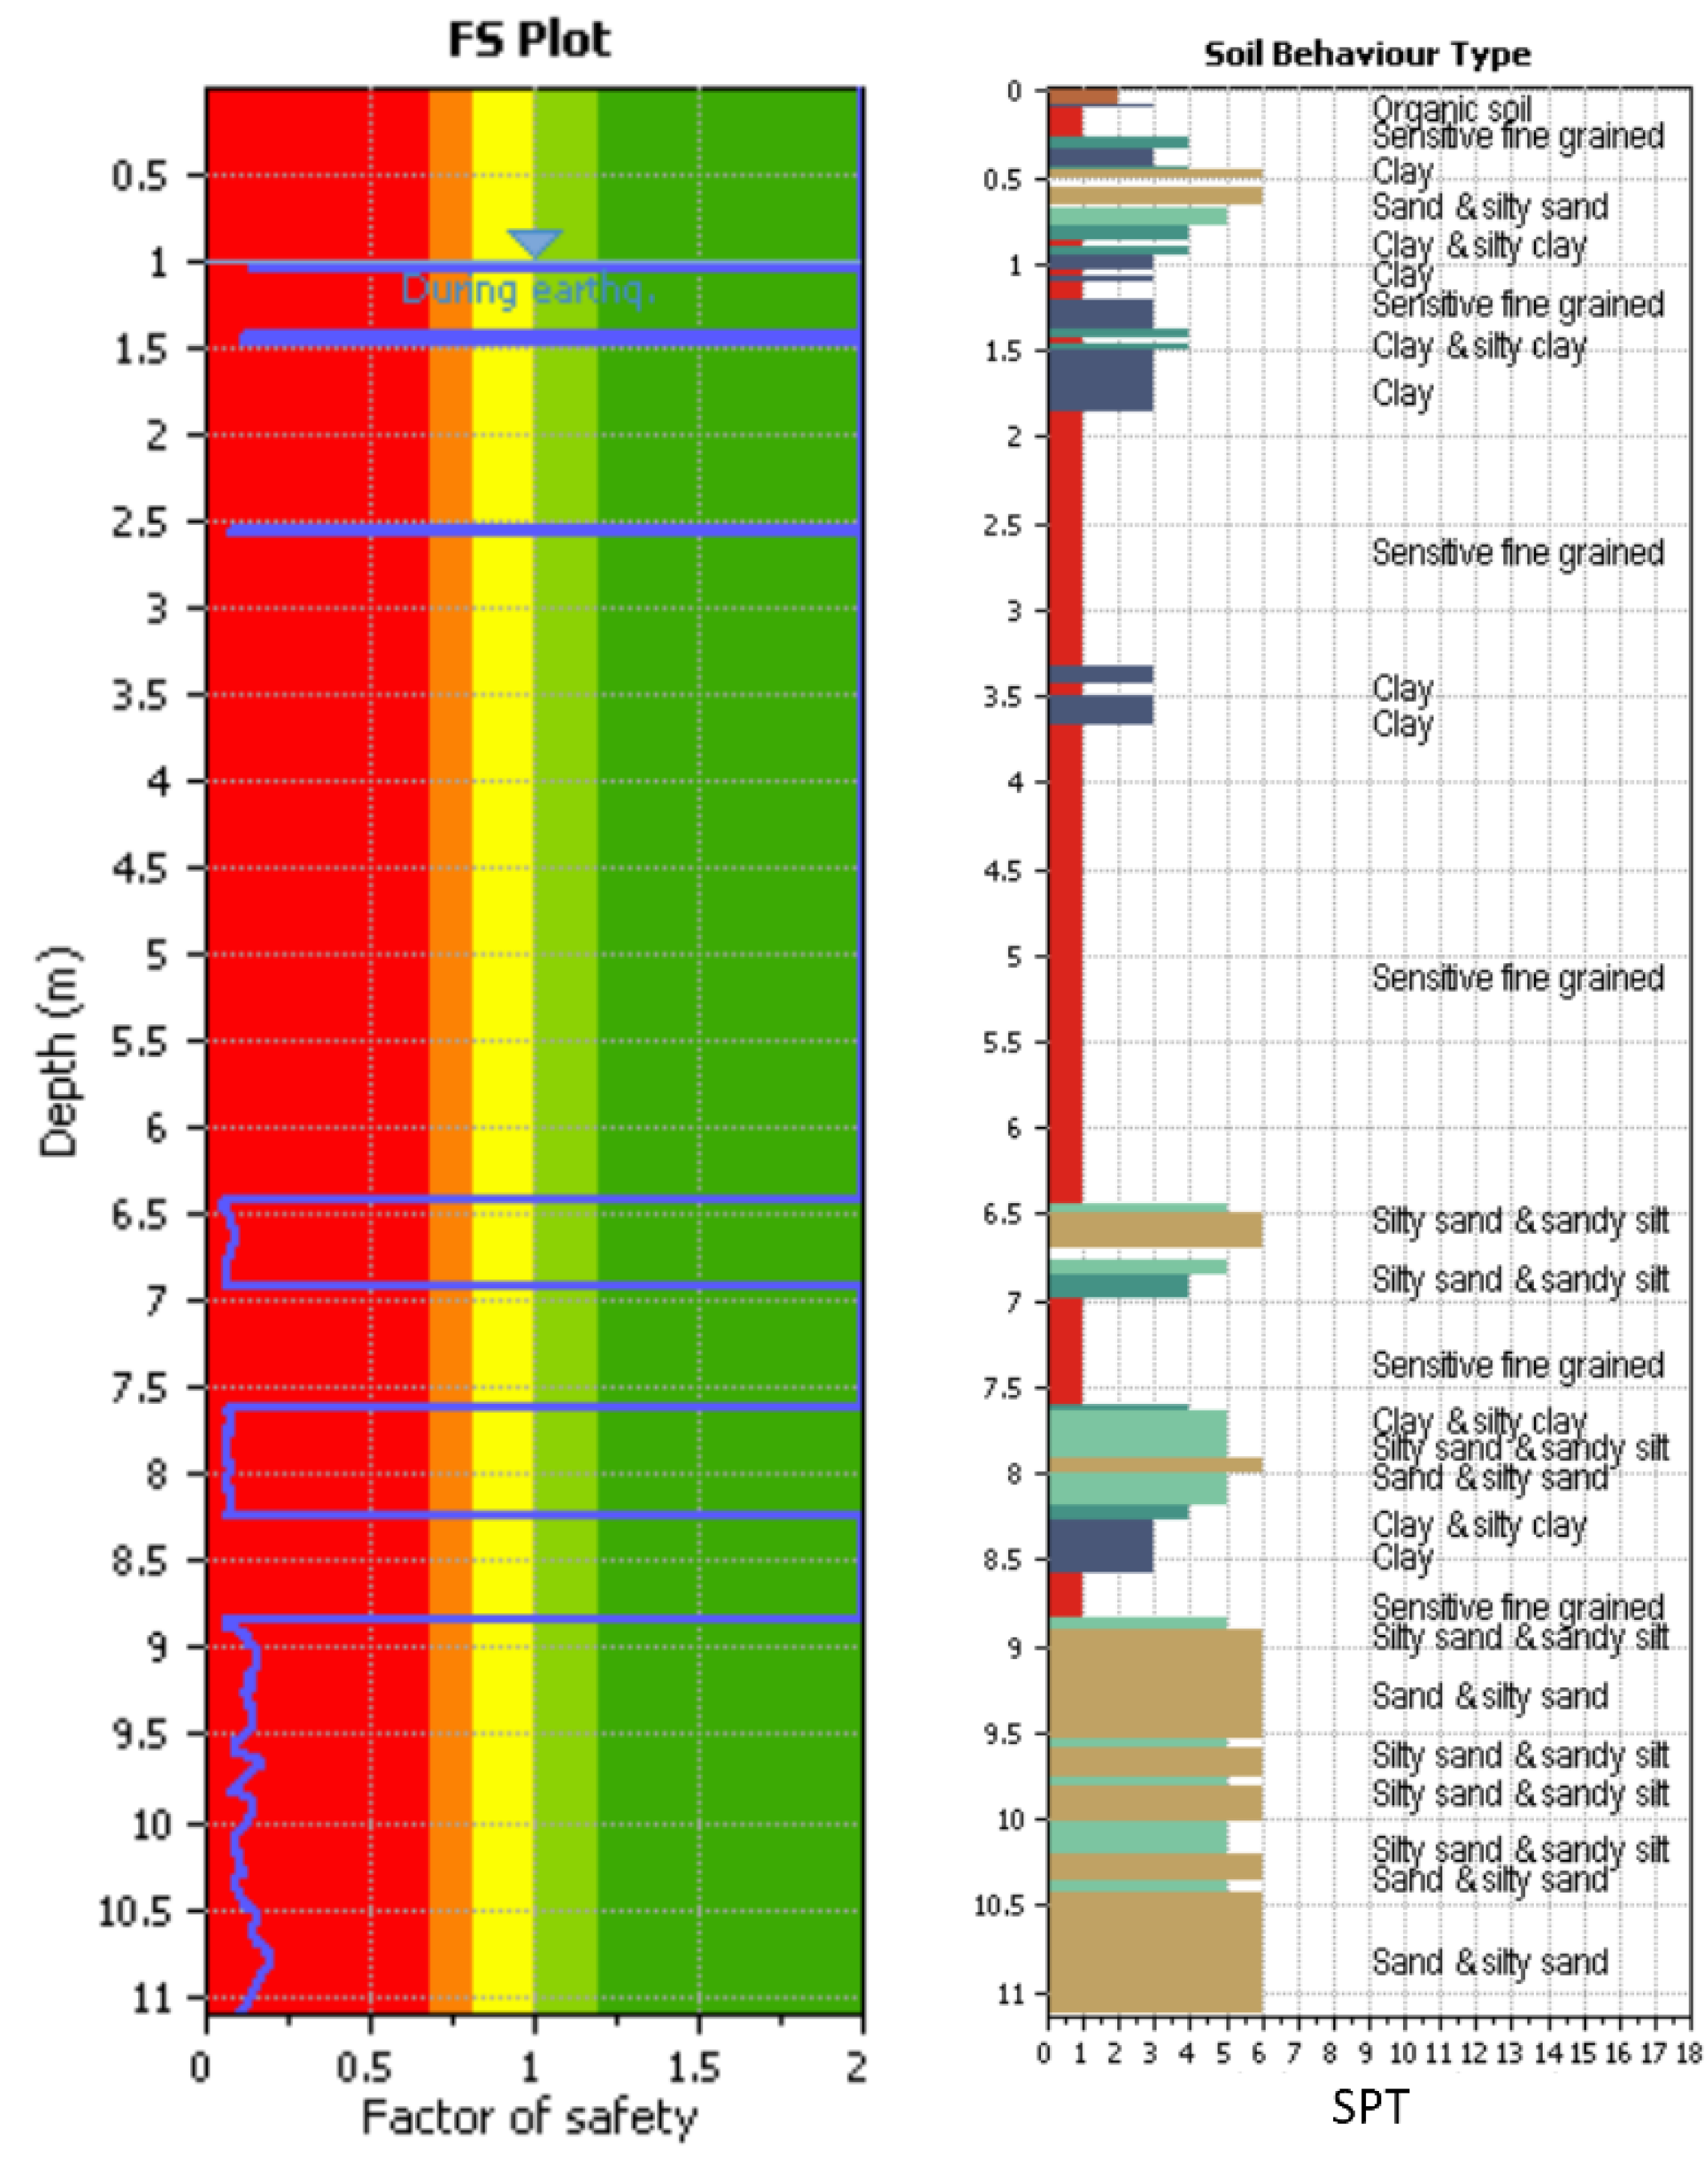
Evaluation of susceptibility and triggering using the CPT sounding from Site 1 yielded a different outcome. Layers predicted to have been susceptible to liquefaction and triggered are shown in the factor of safety (FS) plot in
Figure 18. The corresponding SBT plot from the CPT sounding is also shown for reference of the soil layering. As is shown in
Figure 18, little liquefaction is predicted in the clayey and sensitive fine-grained soils at depths shallower than 6 m. However, significant liquefaction triggering is predicted for depths greater than 6 m. No surface manifestations of liquefaction were observed at Site 1, and the site was therefore classified as a “No Liquefaction” site. However, it is possible that liquefaction occurred at depths greater than 6 m, but no surface manifestations were observed due to the thick and plastic non-liquefied soil cap. Assessment of the site using the Ishihara surface manifestation prediction method [
54] predicted no surface manifestations of liquefaction at the site.
The result of this assessment of conventional methods for predicting susceptibility and triggering therefore showed the predictions match the observed surface behavior related to liquefaction manifestation at Site 1.
Site 1 is in the Inubuchi village, which is built on a natural levee with adjacent farmland is built on a flood plain. The boring log for Site 1 shows that the natural levee is extremely soft and plastic which explains its resistance to liquefaction. The soft clay deposits should not be the Ariake Bay deposits, since the deposits are located deeper down. Publicly available local boring logs suggested that the rice fields are layered with sand, gravels, and fill materials. Major river course alterations that occurred during the 1960s and 1970s in Kumamoto significantly altered the natural sediments of the plain due to loose deposition of excess soil [
40].
3.2.2. Susceptibility and Triggering Results at Site 2-1
Evaluation of the compositional criteria for the soils in encountered in the boring performed at Site 2-1 showed that soils from a depth of 2 m to 7 m below the ground surface were susceptible to liquefaction triggering. The triggering analysis predicted factors of safety less than 1.0 at depths from 2.0 m to 5.5 m below the ground surface. A liquefied layer over 3 m thick at a shallow depth of 2.0 m below the ground surface is predicted to produce significant ground surface damage from liquefaction [
51], which matches the observations documented at the site [
1].
Susceptibility and triggering results from the CPT sounding from Site 2-1 are shown in
Figure 19. The results show a good match with the SPT results, predicting significant liquefaction at depths between 2.0 m and 6.5 m below the ground surface.
The results of this assessment of conventional methods for predicting susceptibility and triggering match the observed surface manifestations at Site 2-1.
Site 2-1 is deeply underlain by silts and clays, which are likely highly weathered by-products of the Aso-4 pyroclastic flow and Ariake Bay clays. Above these fine-grained materials is a 5 m-thick layer of poorly graded sand/silty sand, which is unusual for the area. Native sands in the Kumamoto Plain generally have a significant of fines content. Other nearby boring logs off the liquefied strip beneath Site 2-1 show sand layers with a large amount of fines present. Overlying this poorly graded sand deposit is a 1 m volcanic ash fall deposit and some thin surficial flood deposits.
3.2.3. Susceptibility and Triggering Results at Site 2-2
Evaluation of the compositional criteria for the soils in encountered in the boring performed at Site 2-2 showed that soils from a depth of 6 m to 10 m below the ground surface were susceptible to liquefaction triggering. The triggering analysis predicted factors of safety less than 1.0 at depths from 6 m to 10 m below the ground surface. A high plasticity non-liquefied layer of 6 m would likely prevent any surface manifestation of liquefaction. Only minor surface manifestations would be predicted for this site using the Ishihara criteria [
54], which slightly overpredicts the observations documented at the site [
1].
Susceptibility and triggering results from the CPT sounding from Site 2-2 are shown in
Figure 20. The results show a good match with the SPT results below a depth of 6 m below the ground surface but show more predicted liquefaction in the upper crust of soil in the thinner lenses of silty sand and silty clay.
The deeper soil layers above the Aso-4 flows and Ariake Bay clay sediments at Site 2-2 are composed of 4 m of silty sand mixed with some gravel. Above this is a layer of clayey sand about 2 m thick. This site is also located on a natural levee. Recall that Site 2-2 is nearby to Site 2-1, which showed substantial surface liquefaction effects. The same poorly graded sand/silty sand layer is observable at both sites, but it is slightly thinner and approximately 4 m deeper at Site 2-2. Therefore, it is very possible that the same layer liquefied at Site 2-2 but was sufficiently deep to not show evidence of surface manifestation.
3.2.4. Susceptibility and Triggering Results at Site 4
Evaluation of the compositional criteria for the soils in encountered in the boring performed at Site 4 showed that no soils encountered in the boring were susceptible to liquefaction triggering based on the compositional criteria used in this study [
47,
48]. Therefore, no liquefaction triggering analysis was performed with the SPT data.
Susceptibility and triggering results from the CPT sounding from Site 4 are shown in
Figure 21. The results show predicted liquefaction in many of the thinly interbedded sediments between depths of 2.5 m and 4.5 m but is unlikely that such thinly interbedded material would contribute to surface manifestations of liquefaction [
55]. More significant liquefaction was predicted at depths greater than 8.5 m below the ground surface. With a non-liquefied cap of more than 8 m thickness, it would be unlikely that surface effects would manifest at the site even if liquefaction did trigger.
Because of the proximity to the Aso terraces, the soils at Site 4 are more heavily influenced by the Aso Caldera. At a depth of 9 m is the Aso-4 pyroclastic flow deposit, which at this proximity to the Caldera is relatively near to the surface compared to other sites on the Kumamoto Plain. Above this flow deposit is a thick layer of peat. Above the peat is a young deposit of volcanic sediment. The river has been extensively altered in the last 40 years, being widened and redirected [
40]. Recycled materials from the adjacent floodplain were used to fill in this area and were most likely clayey and organic, making compaction difficult.
The observed cracks in the ground at Site 4 showed some minor ejecta of clayey sand and silt, suggesting that, at least locally, liquefaction did occur at Site 4 [
1]. Whether soil liquefaction and lateral spread were the causes of the observed ground deformations and cracking remains unknown. The peat underlying the site was extremely soft at the time of our exploration. It is likely that the peat further softened due to the strong cyclic loading during the 2016 KES, potentially causing a localized slope stability failure. Limit equilibrium analysis of such a scenario suggests that a slope stability failure is a possible cause for the observed ground deformations at the site [
40], but there is currently insufficient information available to conclusively state the cause of the deformations. Regardless, this study demonstrates that little to no surface manifestations of liquefaction would have been predicted at Site 4; however, surface manifestations were visible, and therefore current prediction methods did not match the observed surface evidence.
4. Discussion
The liquefaction and susceptibility analysis performed as part of this study suggest that conventional methods for the SPT likely would have predicted more accurately the observed results of liquefaction triggering in the volcanically derived soils of the Kumamoto Plain following the 2016 KES. The CPT-based methods were much more likely to overpredict the surface manifestation of liquefaction at the observed sites. However, we emphasize that this study did not report the potential overprediction of liquefaction-induced ground settlement or bearing capacity failure, which would have been significant using conventional design methods, even for liquefaction predicted at deeper depths. We did not investigate these effects from liquefaction because their investigation would have required the collection of more data (e.g., geotechnical explorations and laboratory testing) directly adjacent or beneath affected structures, which we did not have the time, budget, or authorizations to collect. Therefore, even the SPT-based methods likely would have overpredicted the impacts from liquefaction at all these sites except Site 2-1.
Naturally deposited sand with low SPT penetration resistance is typical throughout the Kumamoto Plain. Nearly every publicly available boring log for sites in the Kumamoto Plain contained in the KuniJiban, which is the Japanese public boring log database, shows significant amounts of loose, saturated sand in the log. Most of these public boring logs examined by the authors show soil profiles with thick, loose sand layers like those recorded at Site 2-1. However, no surface manifestations of liquefaction were observed at any of these boring locations during the GEER field reconnaissance following the 2016 KES [
1]. Given the nature of the a priori geotechnical available to the public at the time of the 2016 KES, it is understandable why the engineering community believed the soil liquefaction risk in Kumamoto to be so high.
The low SPT penetration resistances in the publicly available boring logs may be the result of soil crushability. Additionally, geological maps roughly indicate around 10 m of sand and silt that encompass the surface of the Kumamoto Plain [
17]. The sandy soils that were encountered in the test holes in this study usually had high fines content and plasticity. If the test holes from this study are in any way representative of other soil deposits in the Kumamoto Plain, that would explain the lack of significant liquefaction in these sandy deposits. The high fines content would have been the product of rapid weathering volcanic glass.
Figure 22 presents a map of liquefied sites as noted by Mukonoki et al. [
17] overlain with geomorphology [
40]. Circled areas represent areas with former river channels that were anthropogenically filled. The most significant evidence of soil liquefaction in the Kumamoto Plain was observed at sites underlain by these anthropogenically filled former river channels. Sites that are underlain by natural levees and floodplains showed only sporadic pockets of minor liquefaction evidence. This observation is consistent with Oya’s observations regarding liquefaction susceptibility of geomorphological features [
56].
The northern half of the Kumamoto Plain had almost no liquefaction, whereas the southern half of the plain had many instances of minor liquefaction. The northern half of the plain is composed of volcanic sediments which rapidly weather and generate fines. The southern half of the plain experienced more minor liquefaction, which makes sense given the presence of metamorphic rocks, sandstone, and mudstone in addition to volcanic soils.
Finally, a simple but important reason why liquefaction was over-predicted following the 2016 KES was confusion over Japanese public boring logs. Publicly available Japanese boring logs typically do not show laboratory index test data (i.e., sieve analysis) from the bore hole. The few logs that did include laboratory test results showed a very high level of fine-grained materials and plasticity, even for sand. Thus, the publicly available boring logs cloaked the high fines content of the sandy soils.
There are also regional differences in how boring logs are recorded and soils are classified. In primarily coarse-grained soils, fines content seems to be less emphasized in Japan than in the Unified Soil Classification System (USCS). The classification “Fine sand” was widely written on boring logs but is not defined under either the Japanese classification system or the USCS. Fine sand seems to correlate to clayey sand and medium sand to silty sand, at least based on the boring logs developed in this study. Japanese publicly available boring logs should be used with caution for inferring liquefaction severity unless the full index testing data are available. International researchers were likely misled by the term “Fine Sand” to believe that the soil was more susceptible to liquefaction than it actually is.
5. Conclusions
The Kumamoto earthquake sequence of 2016 was predicted by many geotechnical subject-matter experts to cause extensive and severe soil liquefaction throughout the Kumamoto Plain [
1]. Immediately following the earthquakes, a joint American–Japanese GEER team was deployed to the area to investigate. The Japanese and American engineers were surprised to observe mostly minor and sporadic surface evidence of liquefaction. A subsequent study by the authors to investigate further the possible reasons for the paucity of soil liquefaction during the 2016 KES was undertaken and summarized in this paper. The principal findings from this study are summarized as follows:
SPT and CPT testing predicted liquefaction reasonably well at site 2-1, a former river channel that was filled with sand. Other anthropogenically filled river channels experienced similar liquefaction, but naturally filled river channels showed no signs of liquefaction.
Liquefaction was over-predicted for sandy deposits that were naturally placed. Volcanic soils, especially prevalent in the northern half of the Kumamoto Plain, were observed in our study to have medium-to-high fines content, moderate to high plasticity, and high organic content. These properties likely contributed to the increased resistance to soil liquefaction. Likewise, the crushable nature of the volcanic soils may have led to artificially low penetration resistance readings for the SPT and CPT. The crushability and metastable structure of the volcanic soils also certainly would have contributed (perhaps even dominated) the resistance of the soil to liquefaction triggering as has been observed in previous studies by other researchers. The less volcanic soils of the southern half of the Kumamoto Plain experienced much more sporadic minor liquefaction. Volcanically derived sands in general also showed a higher resistance to liquefaction based on our cyclic triaxial results on minimally disturbed samples.
The observed ground cracking at Site 4 was originally determined to be a lateral spread but may instead be a seismic-induced slope stability failure. The combination of seismic loading, organic soils, and a pyroclastic flow layer at a depth of 10 m, which acted as a slip plane, resulted in a low factor of safety for the embankment.
Publicly available Japanese boring logs rarely include laboratory index testing and likely have very different soil classifications than those of the Unified Soil Classification System. Much of the predicted liquefaction severity in the Kumamoto Plain immediately following the 2016 KES was due to interpreting the loose “Fine Sand” shown on the logs to be susceptible to soil liquefaction. For the case of liquefaction assessment, field in situ testing should always be supplemented with laboratory index data to assess liquefaction susceptibility.
Misclassification of burned rice stalks from satellite and aerial imagery as possible liquefaction sand boils was also another reason for the over-prediction of liquefaction following the 2016 KES.
Finally, prior research has shown that volcanically derived sediments, particularly those with high fines content, higher levels of crushability, and higher amounts of organic content have higher resistances to seismically induced soil liquefaction. This study did not measure or quantify the potential amount that grain crushability or the potential for the soil to be unsaturated due to the high organic content contributed to the soil’s apparent resistance to liquefaction during the 2016 KES because those properties were beyond the scope of our research and funding. These topics would be valuable to assess in a future study.
Author Contributions
Conceptualization, D.J.A. and K.W.F.; methodology, R.E.K., S.D., and K.W.F.; validation, K.W.F., R.E.K., and S.D.; formal analysis, D.J.A. and M.B.; investigation, D.J.A., K.W.F., and R.E.K.; data curation, D.J.A. and M.B.; writing—original draft preparation, D.J.A. and K.W.F.; writing—review and editing, K.W.F., R.E.K., and S.D.; visualization, D.J.A. and K.W.F.; supervision, K.W.F. and R.E.K.; project administration, K.W.F.; funding acquisition, K.W.F. and S.D. All authors have read and agreed to the published version of the manuscript.
Funding
Field exploration work and laboratory testing for this research was supported by the U.S. National Science Foundation under Grant No. CMMI-1727594. The work of the GEER Association, in general, is based upon work supported in part by the NSF under Grant No. CMMI-1266418. Support for the participation of students in the reconnaissance effort was provided by the NSF through Grants No. 1454431 and 1743159.
Data Availability Statement
Data described in this study are available upon electronic request to the corresponding author.
Acknowledgments
We would like to thank members of the GEER reconnaissance team that contributed to the collection of data and observations from Kumamoto in 2016, particularly Brad Wham (CU Boulder), Nicolas Oettle (AECOM), Jenny Ramirez Calderon (CU Boulder), Samantha Guillies (CU Boulder), and Dallin Briggs (BYU). We also thank Hazarika (Kyushu University), Ishihara (Chuo University), Kokusho (Chuo University), Tokimatsu (Tokyo Institute of Technology), Konagai (Yokohama National University), Yasuda (Tokyo Denki University), Kuraoka (JSCE), the Japanese Society of Civil Engineering (JSCE) and the Japanese Geotechnical Society (JGS) for assisting in the planning of this reconnaissance effort. Thanks are extended to Yasunori Kimura (Japan Water Works Association) and Kumamoto City Waterworks and Sewage Bureau representatives Hirofumi Nakashima and Hitoshi Fujimoto for providing valued information about municipal utility damage and recovery efforts. Colleagues at Kubota Corp, including Toshio Toshima, Satoshi Suenaga, Takeshi Hara, Mitsuo Hayashi, and Kohei Ikeda, are acknowledged for providing valuable guidance and information before, during, and after the reconnaissance mission. The GEER Association is made possible by the vision and support of the NSF Geotechnical Engineering Program Directors: Richard Fragaszy and the late Cliff Astill. GEER members also donate their time, talent, and resources to collect time-sensitive field observations of the effects of extreme events. Any opinions, findings, and conclusions or recommendations expressed in this material are those of the authors and do not necessarily reflect the views of the NSF. Any use of trade, firm, or product names is for descriptive purposes only and does not imply endorsement by the U.S. Government.
Conflicts of Interest
The authors declare no conflict of interest. The funders had no role in the design of the study; in the collection, analyses, or interpretation of data; in the writing of the manuscript; or in the decision to publish the results.
References
- Kayen, R.; Dashti, S.; Kokusho, T.; Hazarika, H.; Franke, K.; Oettle, N.; Wham, B.; Ramirez, J.; Briggs, D.; Guillies, S.; et al. Geotechnical Aspects of the 2016 Mw 6.2, Mw 6.0, and Mw 7.0 Kumamoto Earthquakes; GEER Report No. GEER-048; GEER Association: Tokyo, Japan, 2016; 163p. [Google Scholar] [CrossRef]
- Naito, K. “GeoMap Navi.” Geological Survey of Japan. AIST 2014, 3, 83–86. Available online: https://gbank.gsj.jp/geonavi/geonavi.php#12,32.75836,130.77161 (accessed on 15 September 2017).
- Takai, F. Geology of Japan, 1st ed.; University of Tokyo Press: Tokyo, Japan, 1963; 282p. [Google Scholar]
- Hashimoto, M. (Ed.) Geology of Japan (Developments in Earth and Planetary Sciences 08) 1990th Edition; Terra Scientific Publishing Company: Tokyo, Japan, 1991; 260p. [Google Scholar]
- Ideue, M.; Watanabe, S. A Study on the River-Bed Gravel of Midori River in Kumamoto as Materials for Teaching Science–A Link between Elementary Science Teaching Materials with a Welded Tuff as a Key; University of Kumamoto Repository, Natural Science Department: Kumamoto, Japan, 2012; pp. 47–56. [Google Scholar]
- Geological Society of Japan. Seamless Geological Map. 2018. Available online: https://gbank.gsj.jp/seamless/seamless2015/2d/index.html?lang=en (accessed on 15 September 2017).
- Saito, R. The Regularity of the Eruption of Volcanoes in Japan. Kumamoto J. Sci. 1968, 7, 105–123. [Google Scholar]
- Japan Meteorological Agency. National Catalogue of the Active Volcanoes in Japan, 4th ed. 2013. Available online: https://www.data.jma.go.jp/svd/vois/data/tokyo/STOCK/souran_eng/volcanoes/084_asosan.pdf (accessed on 15 September 2017).
- Okumura, K. Earthquake Geology of the 14 and 16 April 2016 Kumamoto Earthquakes. Kumamoto Earthquake Investigation: A Preliminary Report. 2016. Available online: https://www.google.com/url?sa=t&rct=j&q=&esrc=s&source=web&cd=&cad=rja&uact=8&ved=2ahUKEwi996bU65j8AhVFmVYBHc0GBq0QFnoECAoQAQ&url=https%3A%2F%2Fs21.q4cdn.com%2F920789611%2Ffiles%2Fdownload_library%2Fscientech%2FKumamoto-Earthquake-Investigation-Preliminary-Report.pdf&usg=AOvVaw3kPCpHO-kQIG-edkKFnkS1 (accessed on 20 November 2016).
- Ishizaka, S.; Iwasaki, Y.; Hase, Y.; Watanabe, K.; Iwauchi, A.; Taziri, M. Subsidence rate and sediments of the last interglacial epoch in the Kumamoto Plain, Japan. Quat. Res. 1995, 34, 335–344. [Google Scholar] [CrossRef] [PubMed][Green Version]
- Kuribayashi, E.; Tatsuoka, F. Brief Review of Soil Liquefaction during Earthquakes in Japan. Soils Found. Jpn. Geotech. Soc. 1975, 15, 81–92. [Google Scholar] [CrossRef] [PubMed]
- Akiyoshi, T.; Fuchida, K. Kumamoto Earthquake in 1889. Hist. Stud. Civ. Eng. 1998, 18, 245–252. [Google Scholar] [CrossRef]
- Wakamatsu, K. Recurrence of liquefaction at the same site induced by 2011 Great East Japan Earthquake compared with previous earthquakes. In 15th World Conference on Earthquake Engineering; Sociedade Portuguesa de Engenharia Sismica (SPES): Lisbon, Portugal, 2012. [Google Scholar]
- Ogo, K.; Hazarika, H.; Kokusho, T.; Matsumoto, D.; Ishibashi, S.; Sumartini, W. Analysis of liquefaction of volcanic soil during the 2016 Kumamoto Earthquake based on boring data. Lowl. Technol. Int. 2018, 19, 245–250. [Google Scholar]
- Kanno, I.; Honjo, Y.; Arimura, S.; Kuwano, Y. Characteristics and classification of an unirrigated anthropogenic-alluvial soil found in the Kumamoto Plain. Soil Sci. Plant Nutr. 1965, 11, 14–23. [Google Scholar] [CrossRef][Green Version]
- Bhattacharya, S.; Hyodo, M.; Nikitas, G.; Ismael, B.; Suzuki, H.; Lombardi, D.; Goda, K. Geotechnical and infrastructural damage due to the 2016 Kumamoto earthquake sequence. Soil Dyn. Earthq. Eng. 2018, 104, 390–394. [Google Scholar] [CrossRef]
- Mukunoki, T.; Kasama, K. Reconnaissance report on geotechnical damage caused by an earthquake with JMA seismic intensity 7 twice in 28 h, Kumamoto, Japan. Soils Found. 2016, 56, 947–964. [Google Scholar] [CrossRef]
- Licata, V.; d’Onofrio, A.; Silvestri, F.; Olivares, L.; Bandini, V. A laboratory investigation on the cyclic liquefaction resistance of pyroclastic soils. Volcan. Rocks Soils 2015, 141, 2. [Google Scholar]
- Lazcano, S. Experiences in pumice soil characterization by surface wave analysis. In Proceedings of the Fifth International Conference on Recent Advances in Geotechnical Earthquake Engineering and Soil Dynamics, San Diego, CA, USA, 24–29 May 2010; Missouri University of Science and Technology: Rolla, MO, USA, 2010. [Google Scholar]
- Wesley, L.D. Determination of specific gravity and void ratio of pumice materials. Geotech. Test. J. 2001, 24, 418–422. [Google Scholar]
- Orense, R.P.; Pender, M.J.; Tai, A. Undrained cyclic shear strength of crushable sands. Int. J. Geotech. Eng. 2014, 8, 426–430. [Google Scholar] [CrossRef]
- Gieseking, J.E. Soil Components: Vol. 2: Inorganic Components; Springer Science & Business Media: Berlin, Germany, 2012. [Google Scholar]
- Henmi, T.; Wada, K. Morphology and composition of allophane. Am. Mineral. 1976, 61, 379–390. [Google Scholar]
- Naganori, Y.; Shigenori, A. Imogolite in some ando soils. Soil Sci. Plant Nutr. 1962, 8, 22–29. [Google Scholar]
- Shoji, S.; Nanzyo, M.; Dahlgren, R.A. Genesis of volcanic ash soils. Dev. Soil Sci. 1993, 21, 37–71. [Google Scholar]
- Maeda, T.; Takenaka, H.; Warkentin, B.P. Physical properties of allophane soils. Adv. Agron. 1977, 29, 229–264. [Google Scholar]
- Saigusa, M.; Matsuyama, N. Distribution of allophanic Andosols and non-allophanic Andosols in Japan. Tohoku J. Agric. Res. 1998, 48, 75–83. [Google Scholar]
- Takahashi, T.; Shoji, S. Distribution and classification of volcanic ash soils. Glob. Environ. Res. Engl. Ed. 2002, 6, 83–98. [Google Scholar]
- Wesley, L. Some basic engineering properties of halloysite and allophane clays in Java, Indonesia. Géotechnique 1973, 23, 471–494. [Google Scholar] [CrossRef]
- Wada, K. Minerals formed and mineral formation from volcanic ash by weathering. Chem. Geol. 1987, 60, 17–28. [Google Scholar] [CrossRef]
- Nagasawa, K. Weathering of volcanic ash and other pyroclastic materials. Dev. Sedimentol. 1978, 26, 105–125. [Google Scholar]
- Sudo, T.; Takahashi, H. Shapes of Halloysite Particles in Japanese Clays. Clays Clay Miner. 1955, 4, 67–79. [Google Scholar] [CrossRef]
- Aomine, S.; Wada, K. Differential weathering of volcanic ash and pumice, resulting in formation of hydrated halloysite. American Mineralogist. J. Earth Planet. Mater. 1962, 47, 1024–1048. [Google Scholar]
- United States Geological Survey. Why Do USGS Earthquake Magnitudes Differ from Those Published by Other Agencies? 2019. Available online: https://www.usgs.gov/faqs/why-do-usgs-earthquake-magnitudes-differ-those-published-other-agencies?qt-news_science_products=0#qt-news_science_products (accessed on 19 February 2019).
- Kato, A.; Nakamura, K.; Hiyama, Y. The 2016 Kumamoto earthquake sequence. Proc. Japan Acad. Ser. B 2016, 92, 358–371. [Google Scholar] [CrossRef] [PubMed]
- Youd, T.L.; Perkins, D.M. Mapping of liquefaction severity index. J. Geotech. Eng. 1987, 113, 1374–1392. [Google Scholar] [CrossRef]
- Kumamoto City. Liquefaction Hazard Map of Kumamoto City. 2014. Available online: https://www.city.kumamoto.jp/common/UploadFileDsp.aspx?c_id=5&id=2121&sub_id=2&flid=39134 (accessed on 15 June 2022). (In Japanese).
- Goda, K.; Campbell, G.; Hulme, L.; Ismael, B.; Ke, L.; Marsh, R.; Sammonds, P.; So, E. The Kumamoto Japan Earthquakes of 14 and 16 April 2016: A Field Report by EEFIT; The Institute of Structural Engineers: London, UK, 2017. [Google Scholar] [CrossRef]
- Kiyota, T.; Ikeda, T.; Konagai, K.; Shiga, M. Geotechnical Damage Caused by the 2016 Kumamoto Earthquake, Japan. ISSMGE Int. J. Geoengin. Case Hist. 2017, 4, 78–95. [Google Scholar]
- Anderson, D.J. Understanding Soil Liquefaction of the 2016 Kumamoto Earthquake. Master’s Thesis, Dept. Civil Env. Eng., Brigham Young University, Provo, UT, USA, 2019; 122p. [Google Scholar]
- Ministry of Land, Infrastructure, Transport, and Tourism (MLIT), Kyushu Division. Midorikawa and Shirakawa Levee Management Committee Report. 2017. Available online: http://www.qsr.mlit.go.jp/kumamoto/site_files/file/river/midorikawasirakawateiboutyousaiinkai/houkokusyo.pdf (accessed on 12 July 2018).
- Enomoto, T.; Kubo, K. Liquefaction damage survey in the southern district of Kumamoto City due to the Kumamoto earthquake in 2016. Geotech. Eng. J. 2016, 11, 399–409. [Google Scholar]
- Hamada, M. Large ground deformations and their effects on lifeline: 1964 Niigata Earthquake. Proceedings, Case Studies of Liquefaction and Lifeline Performance During Past Earthquakes. Jpn. Case Stud. 1992, 1, 31–33. [Google Scholar]
- Ishihara, K. Geotechnical aspects of the 1995 Kobe earthquake. Fourteenth International Conference on Soil Mechanics and Foundation Engineering. In Proceedings of the International Society for Soil Mechanics and Foundation Engineering, Hamburg, Germany, 6–12 September 1997; Volume 4. [Google Scholar]
- Tokimatsu, K.; Suzuki, H.; Katsumata, K.; Tamura, S. Geotechnical Problems in the 2011 Tohoku Pacific Earthquakes. In Proceedings of the International Conference on Case Histories in Geotechnical Engineering, Chicago, IL, USA, 4 May 2013. [Google Scholar]
- Anderson, D.; Franke, K.W.; Dashti, S.; Badanagki, M.; Kayen, R. The over-prediction of liquefaction in alluvially deposited volcanic sediments. In Earthquake Geotechnical Engineering for Protection and Development of Environment and Constructions—Silvestri & Moraci; ISSMGE: Rome, Italy, 2019; pp. 1122–1129. [Google Scholar]
- Bray, J.D.; Sancio, R.B. Assessment of the liquefaction susceptibility of fine-grained soils. J. Geotech. Geoenviron. Eng. 2006, 132, 1165–1177. [Google Scholar] [CrossRef]
- Idriss, I.M.; Boulanger, R.W. Soil Liquefaction During Earthquakes; EERI Monograph MNO-12: Oakland, CA, USA, 2008; 235p. [Google Scholar]
- Youd, T.L.; Idriss, I.M.; Andrus, R.D.; Arango, I.; Castro, G.; Christian, J.T.; Dobry, R.; Finn, W.D.L.; Harder Jr, L.F.; Hynes, M.E.; et al. Liquefaction resistance of soils: Summary report from the 1996 NCEER and 1998 NCEER/NSF workshops on evaluation of liquefaction resistance of soils. J. Geotech. Geoenviron. Eng. 2001, 127, 817–833. [Google Scholar] [CrossRef]
- Boulanger, R.W.; Idriss, I.M. Probabilistic standard penetration test-based liquefaction-triggering procedure. J. Geotech. Geoenviron. Eng. 2012, 138, 1185–1195. [Google Scholar] [CrossRef]
- Cetin, K.O.; Seed, R.B.; Kayen, R.E.; Moss, R.E.S.; Bilge, H.T.; Ilgac, M.; Chowdhury, K. The use of the SPT-based seismic soil liquefaction triggering evaluation methodology in engineering hazard assessment. Soil Dyn. Earthq. Eng. 2018, 5, 1556–1575. [Google Scholar] [CrossRef] [PubMed]
- Saye, S.R.; Olson, S.M.; Franke, K.W. Common-origin approach to assess level-ground liquefaction susceptibility and triggering in CPT-compatible soils using ΔQ. J. Geotech. Geoenviron. Eng. 2021, 147, 04021046. [Google Scholar] [CrossRef]
- Geologismiki. CLiq V3.0 Software. 2022. Available online: https://geologismiki.gr/products/cliq/ (accessed on 22 June 2022).
- Ishihara, K. Stability of natural deposits during earthquakes. In Proceedings of the 11th International Conference on Soil Mechanics and Foundation Engineering, San Francisco, CA, USA, 12–16 August 1985; ISSMGE: London, UK, 1985; pp. 321–376. [Google Scholar]
- Youd, T.L. Application of MLR Procedure for Prediction of Liquefaction-Induced Lateral Spread Displacement. J. Geotech. Geoenviron. Eng. 2018, 144, 04018033. [Google Scholar] [CrossRef]
- Oya, M. Geomorphological Maps of Alluvial Plains and their Utilization for Mitigation of Natural Hazards. Geogr. Rev. Jpn. Ser. B 1995, 68, 218–242. [Google Scholar] [CrossRef]
| Disclaimer/Publisher’s Note: The statements, opinions and data contained in all publications are solely those of the individual author(s) and contributor(s) and not of MDPI and/or the editor(s). MDPI and/or the editor(s) disclaim responsibility for any injury to people or property resulting from any ideas, methods, instructions or products referred to in the content. |
© 2022 by the authors. Licensee MDPI, Basel, Switzerland. This article is an open access article distributed under the terms and conditions of the Creative Commons Attribution (CC BY) license (https://creativecommons.org/licenses/by/4.0/).


 ,
, 


