Abstract
Blasting in clay soil in the field of anchoring and foundation of objects and structures has its benefits in construction and geotechnical practice. The foundations of the method lay in the fact that a shock wave is generated when the explosive charge is detonated. The shock wave, with high pressure at the wavefront, causes the natural structure of the clay soil to be destroyed, and a spherical expansion in the clay mass is formed. The presented research is focused on determining the shape and volume of the resulting expansion in test blasts performed with several types of explosives. An application named Borehole was developed to determine the resulting spherical expansion formed after the detonation of an explosive charge with the integration of the GNSS method of measurement, depth camera, and laser. The application Borehole calculates expansion volume based on the coordinates obtained with the GNSS and the laser-obtained distance of the formed expansion and provides a graphical interpretation in 2D and 3D views. Additionally, when developing the application Borehole, compatibility with CAD tools was considered, primarily for better verification and a more detailed graphical interpretation of 3D views. The developed method allows for simple determination of the volume and dimension of the spherical expansion in clay soil with acceptable accuracy for the design and building of geotechnical structures constructed above and underground.
Keywords:
explosive charge; clay soil; spherical expansion; GNSS; borehole camera; laser; application 1. Introduction
There are geotechnical methods that can successfully improve the geotechnical properties of soft soils. However, a method that utilizes the detonation energy produced after activating an explosive charge below the ground surface may also be used. This method of improving soft soil is called explosive compaction (EC). It is a soft soil improvement method in which detonation compresses the soft soil layers. The method has been tested and implemented worldwide, where it has been proven that using explosives improves the density, stability, and strength of soil [1,2,3,4,5,6,7].
This paper provides the results of blasting in soft soil, which demonstrate the possibilities of anchor and strain applications to structures built on soft soil. The use of anchors in soft soils reduces the cost of supporting wall construction near buildings and roads, the foundation of tall towers, chimneys, water pipes, etc. It is cheaper, and it increases the security of creating the primary support system in the most demanding conditions of underground chamber excavation [4,6,8,9,10].
Studies conducted in 2015 are a continuation of the research carried out in the late 1980s and early 1990s [8,9,10]. The detonation of a certain amount of explosive located in the borehole of clay soil results in a limited expansion, mainly in a quasi-spherical shape. The volume of the resulting expansion depends on the mass of the explosive charge and on the geotechnical parameters of the clay soil [4,5,6,10,11,12,13,14,15,16,17,18].
In the available literature, no research has been found that defines the impact of explosive properties on the creation of spherical expansion in soft rock after blasting. No study was found on the technique to determine the shape and volume of the resulting spherical extension.
Blasting designing software is available for designing and modelling surface and underground blasting. Software dealing with blast field design, drilling geometry, explosives, and initiation systems is applied to relate to the blast efficiency, fragmentation, and environmental influences for rock blasting. Clay soil blasting is a special blasting technology that is not processed by standard blasting software. Blasting for the development of spherical expansions in clay soil is not a massively applied technology. For that reason, it is not thoroughly researched in design or performance.
The literature on methods of measuring and calculating the volume of expansion in soft soil has been studied, which mentions methods of measurement and 3D visualization of the boreholes. It is primarily meant for 3D visualization of natural discontinuities in rock.
Following the above, the paper of Wu and Pollard (2002) [19] was studied. A method developed in the paper provides visualization in 3D distributions of subsurface natural fracture networks with the help of images. The resulting images can be connected by certain interpolations and approximations from one dimension (1D) in the borehole to a 3D representation in the borehole [4,6,17,18].
The method of classification and characterization of rock structures derived from geophysical methods was published in Schepers et al. (2001) [20]. The presented method uses seismic velocities and reflectivity measured to determine the weak zones in solid formations [4,6,17,18].
The development of the BoreIS application has also been studied [21]. The BoreIS application was developed as an extension to ESRI’s ArcScene three-dimensional (3D) GIS environment. The work of the application is manipulated by interactive manipulation of terms in complex queries, and masking by lithology or formation helps geologists find spatial patterns in their data [4,6,17,18].
Following on the above, the research presented in this paper shows the development of an application that calculates and draws in 3D the volume of the resulting extensions in clay soil. A method for integrating GNSS measurements and data obtained with a borehole camera and laser is also developed [4,6,17,18].
2. Case Study
The most recent geotechnical field research was carried out during 2014, 2015 [10], and 2016 [4,5,6,7,18] in the field Cukavec II, where clay has been exploited for more than 50 years, near the City of Varaždin (see Figure 1). During the research, modern blasting methods, instruments, and software were used to measure, analyze, and process the research data.
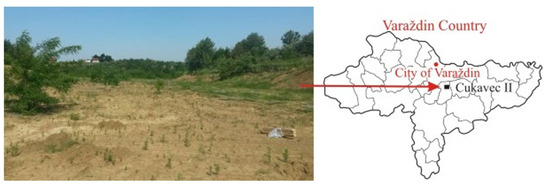
Figure 1.
The geographical position of the Cukavec II [4].
The structure of the deposit is dominated by kaolinite, quartz, feldspar, and chlorite, and the granulometric composition shows that the mineral raw material contains about 75% clay component, while the rest is silt. The geotechnical properties of the clay soil were determined as part of the research. Cohesion c, internal friction angle φ, and volume weight γ were determined. Cohesion is c = 23.4 KN/m2, internal friction angle φ = 19.8°, and volume weight γ = 18.7 KN/m3 [4,7]. Spherical cavity blasting is rare in hard rocks. Namely, the effect of smaller explosive charges on spherical cavities is, in principle, different than continuously filled boreholes in mining and blasting operations. Detonation of smaller explosive charges crushes the material in proximity of the activated explosive charge. With the increased distance from the explosive charge, the released energy is not enough for crushing materials but still impacts it [4,11,12,14].
Test blasts were performed with 48 blast holes 131 mm in diameter and with a hole depth of 2.0–3.0 m. Two types of civil explosives were used: ANFO explosive Pakaex and ammonium nitrate powder explosive Permonex V19. The harge mass varied from 0.2 up to 1.6 kg. Explosive charge activation was performed with a nonelectric initiation system, and the stemming length was 0.5 m, composed of 0/4 mm grain sand. Explosive mass per borehole charge has been determined according to previous research, and presented data for boreholes MB 37 and MB 22 represent application to function. The expansions generated by the explosive charges on the Cukavec II were different in shape and size. The spherical expansion was obtained with explosives Permonex V19 and Pakaex. Table 1 shows the specifications from the manufacturer of Pakaex and Permonex V19.

Table 1.
Specifications from the manufacturer of Pakaex and Permonex V19 [4,6,14,17,18,22].
A method has been developed to determine the shape and calculate the resulting expansion volume, which is an integration of the GNNS method [4,6,17,18,23,24,25], a borehole camera [26], and a laser (Figure 2) [27].
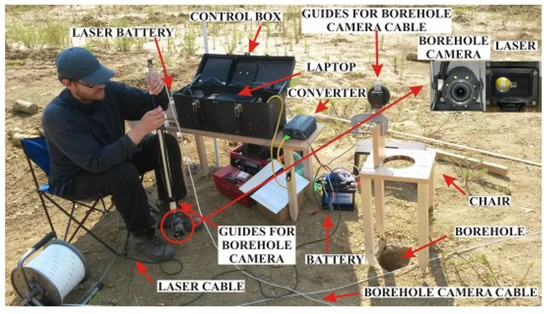
Figure 2.
Developed integrated borehole camera laser system [4].
During the research, an application was developed that—based on GPS coordinates of the boreholes and the depth of the boreholes obtained by the depth camera and on the distance from the borehole wall obtained by the laser—could draw and calculate the resulting expansion in the clay soil [4,6].
The borehole camera rotates clockwise a full 360°, with 45° recording intervals. The measurements give closed circles at certain depth levels for which the surfaces can be calculated. The application based on the obtained surfaces and the known depths of the characteristic circular profiles calculates the volume of the entire borehole with spherical expansion and draws the whole borehole with the resulting expansion in 2D and 3D views. For double-checking measured data and for a more detailed 3D view, the developed software is compatible with AutoCAD Civil 3D [4,6,17,18,28].
3. Development of the Application for Calculation of 2D and 3D Views
3.1. System Architecture
Web application Borehole [4,29] is implemented in a multi-layer architecture based on Java EE 7.0 standard [30]. The whole system logic is stored in the business layer, which is implemented according to the specification EJB 3.1.
The application benefits from object relation mapping, specifically Hibernate [31], for communication with the data layer, i.e., database, from which the application is independent. The current version of the application is running on a PostgreSQL 9.4 database; however, any other database can be used.
For the presentation layer, the modern server components of the Primefaces 5.2 framework were used [32], based on Java JSF standard. For the reports, Jasper reports [33] version 5.2.0 has been used.
The application can run on any application server that supports Java EE specifications. The test version of the application is running on an Apache TomEE application server, version 1.7.1 [34].
The application is scalable and open to many external systems interfaces. The system scalability can be vertical through stronger hardware or horizontal in the cluster. Openness toward external systems can be achieved through web services, communication through databases or file exchanges, MQ channels, other messaging services, etc.
The application uses the security mechanism of the Java EE framework, specifically the JAAS specification [35], which enables authentication and authorization on the level of application roles. In the test version of the application, authentication is set up in the configuration file of the application server. However, in a production environment this can be an active directory, LDAP, biometric security system, or something else. Regarding application roles for authorization, two basic roles exist: “admin“ and “user“. Each role can define different levels of access to specific options and functions of the application.
3.2. Functional Specification
The application supports a set of functions regarding the calculation and display of the borehole model after activation of explosive charge.
The functions that the application supports are as follows:
- borehole location,
- coordinates input for separate layers of the borehole (RTK GNSS measurement method),
- coordinates calculation of characteristic points of the borehole for each layer depth-wise,
- volume calculation of the complete borehole and resulting expansion after activation of the explosive charge.
All of this is supported by drawing a single layer of the borehole in the 2D model, as well as the resulting expansion and complete borehole in the 3D model.
For calculating the coordinates of a single layer of the borehole, first, by the characteristic cardinal points, the average of the two obtained distance values is calculated, which are collected by the measuring device (laser—EDS-c) during field investigations. The formula used in this calculation is standard arithmetic mean (Equation (1)). Furthermore, the height of the borehole is calculated as the difference between the height of the collar and the depth of the borehole (Equation (2)).
Calculation of arithmetic mean distance:
where:
—standard arithmetic mean [m]
Calculating the height of the tip of the borehole or the resulting expansion:
where:
—height of the borehole [m]
—height of the field [m]
—depth of the borehole [m]
The horizontal coordinate calculated is E, and the vertical coordinate N, according to Equations (3) and (4). Horizontal shift, ΔE, is calculated as a product of the average measured distance, , and sinus of the angle of the characteristic cardinal points, α. Vertical shift, ΔN, is calculated as a product of the average measured distance, , and cosine of the angle of the characteristic side of the world, α.
Calculation of horizontal coordinate E:
where:
ΔE—Horizontal shift of the coordinate E [m],
—average measured distance [m],
α—angle of the characteristic cardinal point (°).
Calculation of vertical coordinate N:
where:
ΔN—Vertical shift of the coordinate N [m].
Final coordinates are calculated as the sum of the initial horizontal coordinate, E0, which is obtained by GPS for the position of the borehole, horizontal shift, ΔE, and the sum of the initial vertical coordinate, N0, and vertical shift, ΔN. This calculation can be seen in Equations (5) and (6).
Calculating the final coordinates:
where:
E = E0 + ΔE [m],
N = N0 + ΔN [m],
E0—initial horizontal coordinate [m],
N0—initial vertical coordinate [m].
The application provides two templates for data input for the layer of the borehole. The first template has four basic cardinal points: N (0°), W (270°), S (180°), and E (90°). The second template has eight cardinal points: N (0°), NW (315°), W (270°), SW (225°), S (180°), SE (135°), E (90°), and NE (45°).
Saving data in the database goes into the data model. The user can create a new entry, fetch and edit an existing entry, or delete an entry that is no longer needed in the system. Before each of the described actions, there is a validation that all required information has been entered and that it comes from predicted data sets. Before storing the data, once again, the coordinate calculation is triggered.
The application enables printing calculated results in the form of a predefined report or can be exported in two different file types. The first export is simple and consists of an ordinal number, horizontal coordinate, vertical coordinate, and height of the borehole for all angles of the selected layer of the borehole.
The second export is more complex in DXF file format (Drawing Interchange Format) [36,37], which can be imported into AutoCAD Civil 3D application or a specific viewer of that format.
After the selection of the layer of the borehole, a standard 2D model is drawn. The application goes through a set of calculated coordinates and finds the minimum and maximum values. After that, each coordinate is evaluated between the minimum and maximum values (Equations (7) and (8)). The importance of evaluating is in the visibility of the model. Without standardization, the model preview is initially too small or too large.
Standardization of the coordinate values in the 2D model:
The resulting standardized coordinates are multiplied by the weights, which depend on screen resolution so that the image is within the initial frame of the image. Finally, each obtained coordinate is connected with a straight line between the two neighboring peaks. This gives an approximate cross-section of the borehole and the resulting expansion, ignoring irregular lines between the two neighboring peaks.
When selecting a borehole or the resulting expansion, the second option automatically calculates the approximate surface area of each layer (Equations (9)–(12)) and the volume of the complete borehole or resulting expansion (Equation (13)).
The surface area of the borehole or resulting expansion is calculated as the surface of the triangle between two neighboring coordinates, where the third peak is the middle of the borehole or resulting expansion in which a measuring instrument was released (depth camera and laser). After that, for the same part of the coordinates, the application calculates the semi-ellipsoid surface over the triangle base, which is made by two neighboring peaks, to approximate an incorrect curve connecting the two peaks. For the surface of the semi-ellipse, the first is calculated axis diameter a, from which we get the semi-axis, and in a way, that axis is divided by two. Semi-axis b is approximated in relation to the semi-axis a, in a way that semi-axis a is multiplied by the coefB = 0.05 and gives a coefficient for semi-axis b.
Through a series of empirical calculation checks through the AutoCAD Civil 3D tool and field investigations, the coefB = 0.05 was calculated and gave the most accurate approximation data. Finally, the ellipse surface is calculated as a product of semi-axis a, coefficient B, and mathematical constant π. The surface of the semi-ellipse is the surface of the ellipse divided by two. The sum of all triangles and the related semi-ellipse gives the total surface area of the borehole or the resulting expansion.
Calculating the surface of an individual layer:
The volume of the complete borehole or the resulting expansion is calculated in a simple way. The arithmetic mean of the sum of the surface of the two neighbor layers is taken and multiplied by the height between these two layers.
Calculating the volume of the complete borehole or the resulting expansion:
The application again enables simple and complex export (DXF) of the coordinates, but this time for the complete borehole or the resulting expansion. Also, it enables the drawing of the 3D model in a similar way to the 2D model that was created. The application first calculates standardized coordinates for all layers of the borehole. After that, the application draws specific 3D geometry, which enables two standard 3D models, dotted and linear. The same applies to drawing of the 3D model of the resulting expansion.
3.3. Technical Specification
In this section, a review of the used technology is given, including the way data are stored in a database and which algorithms and external libraries are used for calculations and drawing of the 2D and 3D models. The calculations themselves use basic mathematical operations (multiplication, division, addition, subtraction, trigonometry, square rooting, and exponentiation) and are embedded in basic Java language libraries. Below is a review of the tools that are not supported in JDK and the database model.
The database model in Figure 3 is simple and consists of three tables. Data related to the borehole or the resulting expansion are stored in the table “borehole“, and it holds data such as location, research time, type of explosive, amount of explosive, etc. Every borehole, along with the resulting expansion, is measured at different depths, and every depth coordinate for that layer is stored. To make this possible, the model predicts table “calculation_header“, which contains data about the layer and its depth. Every borehole and resulting expansion can have 0 or more measured depths. Every measured depth has 0 or more coordinates, depending on the chosen template. This data are stored in table “calculation_element“.
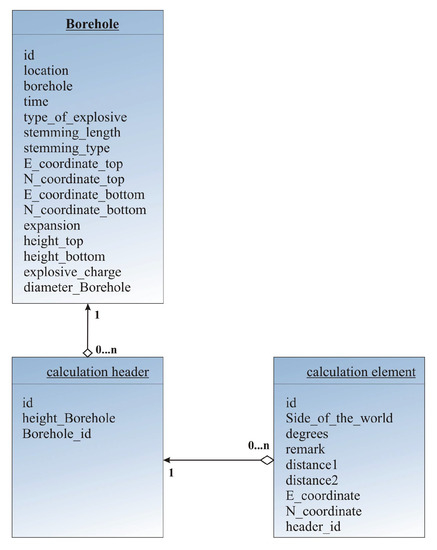
Figure 3.
Database model [4].
For drawing the 3D model, the application uses external, third-party libraries, such as: Java 3D utils [38] version 1.6.0, which allows us to define our own geometry to draw 3D objects; GlueGen [39] version 1.0, which is used for native function calls from C libraries that are a prerequisite for the use of AWT containers in which 3D models are drawn; and JOGL [40] version 1.0, which allows us to use the OpenGL®® API over a Java library and is further used for hardware support for drawing 3D model applications written in the Java programming language [4].
For data export in DFX format, a custom version of the Ycad library is used [41]. This library enables reading, viewing, and generating DXF format, which can be used in other tools that support DXF format, like AutoCAD Civil 3D.
3.4. User Guide
This section provides a user guide. The start point is the application screen, which explains how to use the individual application option.
The application uses a secure mechanism for user authentication. This means that a user who is not logged into the system through the username and password has no access to the application itself. The log in screen prompts the user to enter the username and password. If the username and the password are confirmed by the authentication system, the application grants the user access to the application.
The home screen of the application consists of a header that contains a menu that can be filtered through the authorization system and roles and logout action. When the menu is opened, the user can choose between two options. The first option is a calculation of the coordinates of the borehole or the resulting expansion, with the 2D preview of the layer of the borehole (option “Calculation“), and the second is a calculation of volume and preview of the 3D model (option “Surface“).
The first option of the application consists of a few parts. Data from one layer of the borehole or the resulting expansion, along with the distances in the selected coordinate system, are visible in Figure 4a,b. The user enters basic data about the borehole, such as location, research time, type of explosive, amount of explosive, etc. (Figure 4a). After that, for a specific layer defined by measurement depth, the user enters two measured distances by coordinates which can be four basic coordinates or eight cardinal point coordinates. The application calculates the average distance from the measuring device (laser, EDS-c). This distance is used in the formulas described in the section “Functional specification“ to acquire the borehole coordinates (Figure 4b).
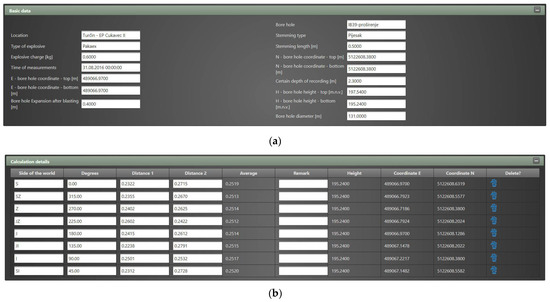
Figure 4.
(a) Basic data about the borehole. (b) Input and calculation of the coordinates of individual sections of the borehole [4].
Action “New calculation“ opens an empty input form that is ready for user data input for the layer of the borehole. Add row“ is an action for manually adding a new row at the end of the list of coordinates. The application supports any number of coordinates but gives two default templates for four basic cardinal points (“Template 4“) and eight cardinal points (“Template 8“). The action “Calculate“ is the most important action, which enables the calculation of the coordinates for a specific layer of the borehole or the resulting expansion, and it displays them to the screen; however, values are not stored in a database. Three actions follow for data export of coordinates for the layer of the borehole or the resulting expansion, which can then be imported into other applications, like CAD tools. The last action, “Report“, as shown in Figure 5, gives a preview of the basic data of the layer of the borehole or the resulting expansion, according to the user’s specifications. All entered layers of the borehole, or the resulting expansion, are stored in the database.
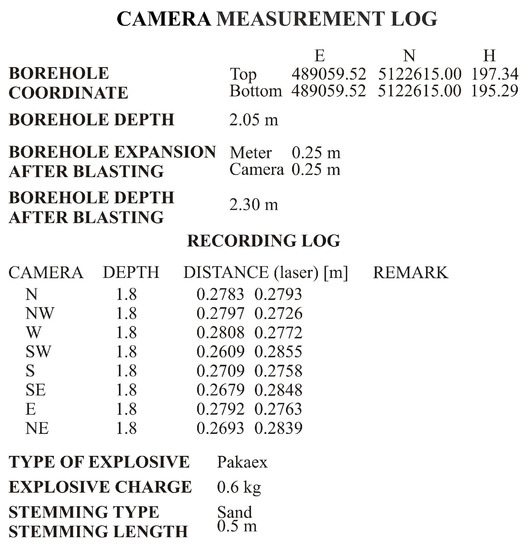
Figure 5.
Report example [4].
The application calculates volume in cubic meters, decimeters, and centimeters. Further, there are options for drawing a 3D model of the selected borehole or the resulting expansion. The application takes all coordinates of all layers depth-wise and draws a 3D model in three ways: dotted 3D model, linear 3D model, and triangulation 3D model. Additionally, the application enables data export of the coordinates in different file formats, which can be imported into other tools, like AutoCAD Civil 3D.
After the selection of the row of the borehole or the resulting expansion, the application fills the panel with data for all layers of the borehole or the resulting expansion and calculates surfaces for every layer. In the header of the table, the basic data of the layer are shown in Figure 6.
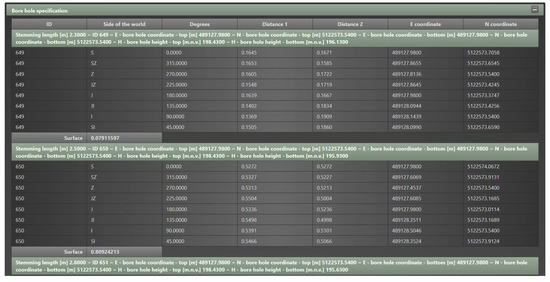
Figure 6.
Separate layers belong to specific boreholes [4].
The dotted diagram can be triggered from the action “3D model (dotted)“. This model shows a 3D preview of the borehole (Figure 7a) or the resulting expansion (Figure 7b) by layers, where red dots represent coordinates in space. Screen manipulation is done with the mouse as follows. If the left mouse button is pressed on the screen and movements are made in any direction, then the model rotates around the imagined center axis in the direction of the mouse movement. If the middle mouse button is held down, and actions are made down or right, then the model is zoomed in; and if actions are made up or left, then the model is zoomed out. By pressing the right mouse button and moving it in any direction, the model translates to that plane in the direction that the user has chosen.
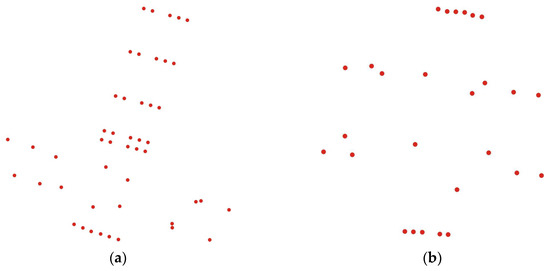
Figure 7.
(a) Dotted 3D model of the borehole; (b) Dotted 3D model of the resulting expansion of the borehole [4].
The 3D model that displays the borehole in Figure 8a or the resulting expansion segment in Figure 8b is a linear/triangulation model. Individual coordinates in space relate to straight lines to get a 3D model. Screen manipulation is equal to the dotted model. Users can get the model by triggering the action “3D model (linear)“. The application Borehole calculates and gives the volume based on the measured borehole, based on the measured coordinates and heights of the boreholes. Given that there were not enough funds to develop an application that works with more advanced 3D models, such as AutoCAD Civil 3D, the goal of the Borehole application was to develop a simpler 3D model that would numerically give the results as accurately as possible to AutoCAD Civil 3D. The visual 3D model was made so that the application Borehole would enable the import of recorded data in AutoCAD Civil 3D, allowing the most realistic 3D view.
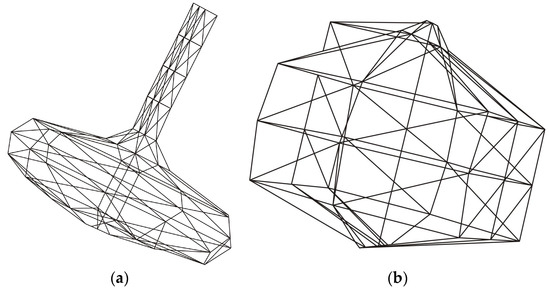
Figure 8.
(a) Linear 3D model of the borehole; (b) Linear 3D model of the resulting expansion of the borehole [4].
4. Use of the Application for Specific Examples in Geotechnical Practice
Since work in AutoCAD Civil 3D is essential in geotechnical practice, the application Borehole is defined in a way such that it also offers the export of borehole coordinates in AutoCAD Civil 3D. This could test the accuracy of the application with AutoCAD Civil 3D tools. Approximately 40 investigative boreholes were used to determine the accuracy of the application through a series of empirical calculations and checks and produced a constant coefB, which was 0.05 for the application; the most accurate approximation data were achieved. In addition to the integration of measured data with AutoCAD Civil 3D tools, a more accurate 3D view of the resulting expansion or full exploration borehole is gained.
In Table 2 are examples from a worksite, measured on the field with the integration of RTK GNSS (coordinates E, N, and H) measuring methods and the borehole camera and laser system for the purpose of obtaining 2D and 3D views, calculating the volume of the resulting expansion (Figure 9a,b and Figure 10a,b), and displaying the difference in calculation accuracy between the application “Borehole“ and AutoCAD Civil 3D [4,6,7,18,28].

Table 2.
Examples of the boreholes from the work site and the distinction between application Borehole and AutoCAD Civil 3D [4].
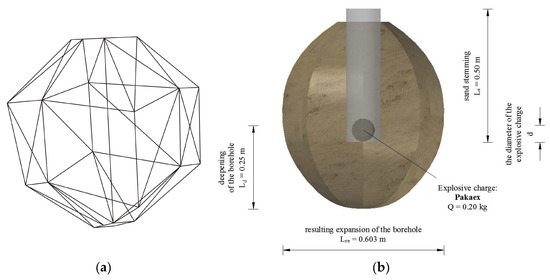
Figure 9.
Borehole MB37 (a) Linear 3D model of the resulting expansion, application Borehole; (b) 3D model of the resulting expansion, AutoCAD Civil 3D [4].
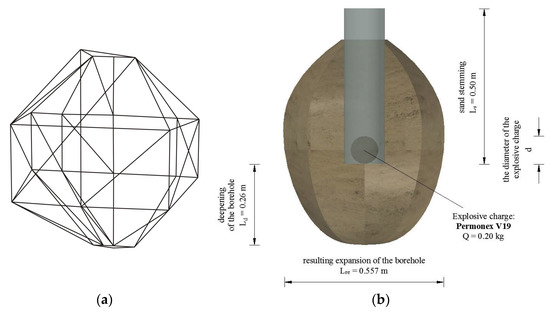
Figure 10.
Borehole MB22 (a) Linear 3D model of the resulting expansion, application Borehole; (b) 3D model of the resulting expansion, AutoCAD Civil 3D [4].
5. Discussion
From Table 2 and Figure 9a,b and Figure 10a,b, it can be concluded that the application Borehole calculates the volume of the resulting expansion with great accuracy compared to AutoCAD Civil 3D. It can also be concluded that the application Borehole will be widely used because it is free, uses open-source technology, and calculating the resulting spherical expansion is simple and quick. Given that the application Borehole was developed as part of the preparation of a doctoral dissertation, the newly designed application was tested on approximately 48 boreholes, and great importance was attached to the development of the calculation accuracy of the resulting spherical expansion. In more recent research, an attempt was made to determine the influence of meteorological parameters on explosive charges and stemming length predictions in clay soil during blasting using artificial neural networks [42]. One of the conclusions that emerged from the published article is that the data obtained from field research and later processed in the application Borehole are correct, i.e., the set concept of the application is valid [6,7,17,18,42]. All data obtained with the help of the application Borehole have been tested, and in all previously published papers, they meet the high standards of science.
In the future, the plan is to develop a better and more accurate 3D view of the resulting spherical extension to bring its 3D view closer to AutoCAD Civil 3D, which is currently one of the best applications in terms of 3D view. The application Borehole algorithm has been tested on clay with high plasticity, which is clay soil without a significant amount of water. Another part of the performed research showed that waterlogged clay soil blasting increases the expanded volume related to the clay soil without water.
6. Conclusions
Thanks to a well-established research plan, encouraging field and office results have been made. Notably, the work relates to blasting in soft rocks at different depths beneath the surface, forming spherical expansion.
In the available literature, the major problem was to measure and calculate expansion in clay soil. The subject research provided high-quality data, resulting in the idea to develop the application Borehole.
The application Borehole uses open-source technology and is developed to be compatible with similar commercial tools. The application Borehole is used to calculate borehole coordinates and the volume of spherical expansion and to draw the resulting spherical expansion in 2D and 3D view. The application is compatible with CAD tools and uses web technology and secure logging in from any computer, tablet, cellphone, or other similar device connected to the internet.
The presented measurement and data processing method to calculate the volume of resulting expansion can help designers and geotechnicians design and run overhead and underground structures in clay significantly more economically.
Engineers who use the application and the subject research can facilitate the construction of structural elements for anchoring foundations and retaining walls in clay soil. Combining the results of previous geotechnical research to determine soil properties that determine design requirements for anchoring, modelling the action of explosives in clayey soil and using the application Borehole to control the achieved effect and volume measurement can be applied. This research can also be applied to the constant stabilization of the slope in the clay material and the stabilization of various surface and underground structures, such as anchoring for slope stability, anchoring underground lining chambers, and anchoring piles of various tall buildings.
Author Contributions
Conceptualization, D.T., M.D. and I.D.; methodology, D.T. and M.D.; software, D.T.; validation, D.T., M.D. and I.D.; formal analysis D.T. and M.D.; investigation, D.T. and M.D.; resources, D.T. and M.D.; data curation, M.D., I.D. and D.J.; writing—original draft preparation, D.T. and M.D.; writing—review and editing M.D. and D.J.; visualization, D.T. and D.J.; supervision, M.D., I.D. and D.J.; project administration, D.T. All authors have read and agreed to the published version of the manuscript.
Funding
This research received no external funding.
Institutional Review Board Statement
Not applicable.
Informed Consent Statement
Informed consent was obtained from all subjects involved in the study.
Data Availability Statement
Data and information developed in this research are available by emailing the authors upon any reasonable request.
Acknowledgments
We would like to thank Mesec for his significant contribution to determining the blasting method, quantity, and type of explosive charge in the preparation of the doctoral dissertation of colleague Težak. We would also like to thank Mesec for the selfless advice he gave us while writing this article.
Conflicts of Interest
The authors declare no conflict of interest. The funders had no role in the design of the study in the collection, analyses, or interpretation of data in the writing of the manuscript or in the decision to publish the results.
References
- Gohl, W.B.; Jefferies, M.G.; Howie, J.A.; Diggle, D. Explosive Compaction: Design, Implementation and Effectiveness. Geotechnique 2000, 50, 657–665. [Google Scholar] [CrossRef]
- Li, Q.; Li, Y.; Dasgupta, G.; Song, D.; Qiao, L.; Wang, L.; Dong, J. Analysis of the Blasting Compaction on Gravel Soil. J. Chem. 2015, 2015, 642810. [Google Scholar] [CrossRef]
- Shakeran, M.; Eslami, A.; Ahmadpour, M. Geotechnical Aspects of Explosive Compaction. Shock. Vib. 2016, 2016, 6719271. [Google Scholar] [CrossRef]
- Težak, D. Influence of the Blasting Features on the Expansion in Clay Soil; University of Zagreb, Faculty of Mining, Geology and Petroleum Engineering: Zagreb, Croatia, 2018. [Google Scholar]
- Tezak, D.; Kranjcic, N.; Mesec, J. Integration of Global Navigation Satellite System (GNSS) and Borehole Camera for Purpose of Modeling the Blasting in Clay Soil. In Proceedings of the 18th International Multidisciplinary Scientific GeoConference SGEM 2018, Albena, Bulgaria, 2–8 July2018; pp. 513–520. [Google Scholar]
- Težak, D.; Stanković, S.; Kovač, I. Dependence Models of Borehole Expansion on Explosive Charge in Spherical Cavity Blasting. Geosciences 2019, 9, 383. [Google Scholar] [CrossRef]
- Težak, D.; Soldo, B.; Đurin, B.; Kranjčić, N. Impact of Seasonal Changes of Precipitation and Air Temperature on Clay Excavation. Sustainability 2019, 11, 6368. [Google Scholar] [CrossRef]
- Frgić, L.; Hudec, M.; Krsnik, J.; Krajcer, M.; Mesec, J. Underground Grounding by Anchoring in Soil. In Proceedings of the I Yugoslavian Symposium on Tunnels, Brijuni, Crioatia, 24 November 1988; pp. 293–298. [Google Scholar]
- Hudec, M.; Krsnik, J.; Abramović, V.; Frgić, L.; Krajcer, M.; Gotić, I.; Meštrić, M.; Mesec, J.; Fingerhut, L. Supporting with Anchors in Soft Rock and Soil. In Proceedings of the International Congress on Progress and Innovation in Tunnelling, Toronto, ON, Canada, 21–25 September 1989; pp. 111–117. [Google Scholar]
- Mesec, J.; Težak, D.; Grubešić, M. The Use of Explosives for Improvement of Clay Soils. Inženjerstvo Okoliša 2015, 2, 95–101. [Google Scholar]
- Sućeska, M. Eksplozije i Eksplozivi: Njihova Mirnodopska Primjena; Brodarski institut: Zagreb, Croatia, 2001; ISBN 9536017113. [Google Scholar]
- Dobrilović, M. Raspoloživa Energija Tlačnog Udarnog Vala Udarne Cjevčice i Njezina Primjena u Iniciranju Elektroničkog Detonatora; University of Zagreb, Faculty of Mining, Geology and Petroleum Engineering: Zagreb, Croatia, 2008. [Google Scholar]
- Dobrilović, M.; Bohanek, V.; Žganec, S. Influence of Explosive Charge Temperature on the Velocity of Detonation. Cent. Eur. J. Energetic Mater. 2014, 11, 191–197. [Google Scholar]
- Žganec, S.; Bohanek, V.; Dobrilović, M. Influence of a Primer on the Velocity of Detonation of ANFO and Heavy ANFO Blends. Cent. Eur. J. Energetic Mater. 2016, 13, 694–704. [Google Scholar] [CrossRef] [PubMed]
- Bakr, R.M. The Impact of the Unsupported Excavation on the Boundary of the Active Zone in Medium, Stiff and Very Stiff Clay. J. Civ. Environ. Eng. 2019, 9, 1–9. [Google Scholar]
- Soltani, A.; Deng, A.; Taheri, A.; Mirzababaei, M.; Vanapalli, S.K. Swell–Shrink Behavior of Rubberised Expansive Clays During Alternate Wetting and Drying. Minerals 2019, 9, 224. [Google Scholar] [CrossRef]
- Kovač, I.; Težak, D.; Mesec, J.; Markovinović, I. Comparative Analysis of Basic and Extended Power Models of Boreholes Expansion Dependence on Explosive Charge in Blasting in Clay Soil. Geosciences 2020, 10, 151. [Google Scholar] [CrossRef]
- Težak, D.; Kranjčić, N.; Đurin, B.; Juras, M. Integration of the GNSS Method and Borehole Camera to Model the Resulting Spherical Cavity Generated by the Main Charge Blast in Clay. Bull. Miner. Res. Explor. 2020, 163, 115–130. [Google Scholar] [CrossRef]
- Wu, H.; Pollard, D.D. Imaging 3-D Fracture Networks around Boreholes. Am. Assoc. Pet. Geol. Bull. 2002, 86, 593–604. [Google Scholar] [CrossRef]
- Schepers, R.; Rafat, G.; Gelbke, C.; Lehmann, B. Application of Borehole Logging, Core Imaging and Tomography to Geotechnical Exploration. Int. J. Rock Mech. Min. Sci. 2001, 38, 867–876. [Google Scholar] [CrossRef]
- McCarthy, J.D.; Graniero, P.A. A GIS-Based Borehole Data Management and 3D Visualization System. Comput. Geosci. 2006, 32, 1699–1708. [Google Scholar] [CrossRef]
- Ester, Z. Miniranje I: Eksplozivne Tvari, Svojstva i Metode Ispitivanja, 1st ed.; Rudarsko-Geološko-Naftni Fakultet: Zagreb, Croatia, 2005. [Google Scholar]
- Official Gazette (2004) Decision on Establishing Official Geodetic Data and Planar Projection of the Republic of Croatia, Official Journal of the Republic of Croatia, 110/2004, 114/2004 Zagreb Pribičević, B. Geodezija u Građevinarstvu; V.B.Z: Zagreb, Croatia, 2003; ISBN 9532012931. [Google Scholar]
- Pribicević, B. Geodezija u Građevinarstvu; V.B.Z: Zagreb, Croatia, 2003; ISBN 9532012931. [Google Scholar]
- Marjanović, M. CROPOS Hrvatski Pozicijski Sustav. Ekscentar 2010, 12, 28–34. [Google Scholar]
- Heavy Duty Geo Vision Borehole Camera. Available online: http://www.geovision.org/ (accessed on 15 November 2022).
- EDS-C. Available online: https://dimetix.com/En/c-Series/ (accessed on 15 November 2022).
- AutoCad Civil 3D. A.K.N. Available online: https://knowledge.autodesk.com/Support/Civil-3d?Search_type=browse&category=Getting%20started&cg=Getting%20Started&p=CIV3D&p_disp=Civil%203D&sort=score (accessed on 15 November 2022).
- Boras, D. Innovations of the University of Zagreb; University of Zagreb: Zagreb, Croatia, 2021. [Google Scholar]
- Java Platform Standard Edition 7 Documentation. Available online: http://docs.oracle.com/javase/7/docs/ (accessed on 15 November 2022).
- Hibernate ORM, D.-5.2. Available online: http://hibernate.org/orm/documentation/5.2/ (accessed on 15 November 2022).
- Prime User Interface. Available online: https://www.primefaces.org/ (accessed on 15 November 2022).
- Jaspersoft Community. Available online: https://community.jaspersoft.com/documentation?version=36816 (accessed on 15 November 2022).
- Apache TomEE. Available online: http://tomee.apache.org/documentation.html (accessed on 15 November 2022).
- Oracle Java Documentation, J.A. and A.S. (JAAS) R.G. Available online: https://docs.oracle.com/javase/8/docs/technotes/Guides/Security/Jaas/jaasrefguide.html (accessed on 15 November 2022).
- Autodesk. Available online: https://help.autodesk.com/View/OARX/2018/ENU/?Guid=GUID-235B22E0-A567-4CF6-92D3-38A2306D73F3 (accessed on 15 November 2022).
- Autodesk, D.R. Available online: https://help.autodesk.com/Cloudhelp/2018/ENU/AutoCAD-DXF/Files/Index.htm (accessed on 15 November 2022).
- MVN Repository, J. 3D U. Available online: https://mvnrepository.com/artifact/org.scijava/J3dutils (accessed on 15 November 2022).
- MVN Repository, G.R. Available online: https://mvnrepository.com/artifact/Net.Java.Dev.Gluegen/Gluegen-Rt (accessed on 15 November 2022).
- MVN Repository, J. Available online: https://mvnrepository.com/artifact/org.jogamp.jogl/jogl-all (accessed on 15 November 2022).
- MVN Repository, Y. 1.0.2. Available online: https://mvnrepository.com/artifact/ycad/ycad/1.0.2 (accessed on 15 November 2022).
- Leskovar, K.; Težak, D.; Mesec, J.; Biondić, R. Influence of Meteorological Parameters on Explosive Charge and Stemming Length Predictions in Clay Soil during Blasting Using Artificial Neural Networks. Appl. Sci. 2021, 11, 7317. [Google Scholar] [CrossRef]
Disclaimer/Publisher’s Note: The statements, opinions and data contained in all publications are solely those of the individual author(s) and contributor(s) and not of MDPI and/or the editor(s). MDPI and/or the editor(s) disclaim responsibility for any injury to people or property resulting from any ideas, methods, instructions or products referred to in the content. |
© 2022 by the authors. Licensee MDPI, Basel, Switzerland. This article is an open access article distributed under the terms and conditions of the Creative Commons Attribution (CC BY) license (https://creativecommons.org/licenses/by/4.0/).