
Influence of Surface Roughness and Particle Characteristics on Soil–Structure Interactions: A State-of-the-Art Review


Abstract
1. Introduction
2. Conventional Shear Tests
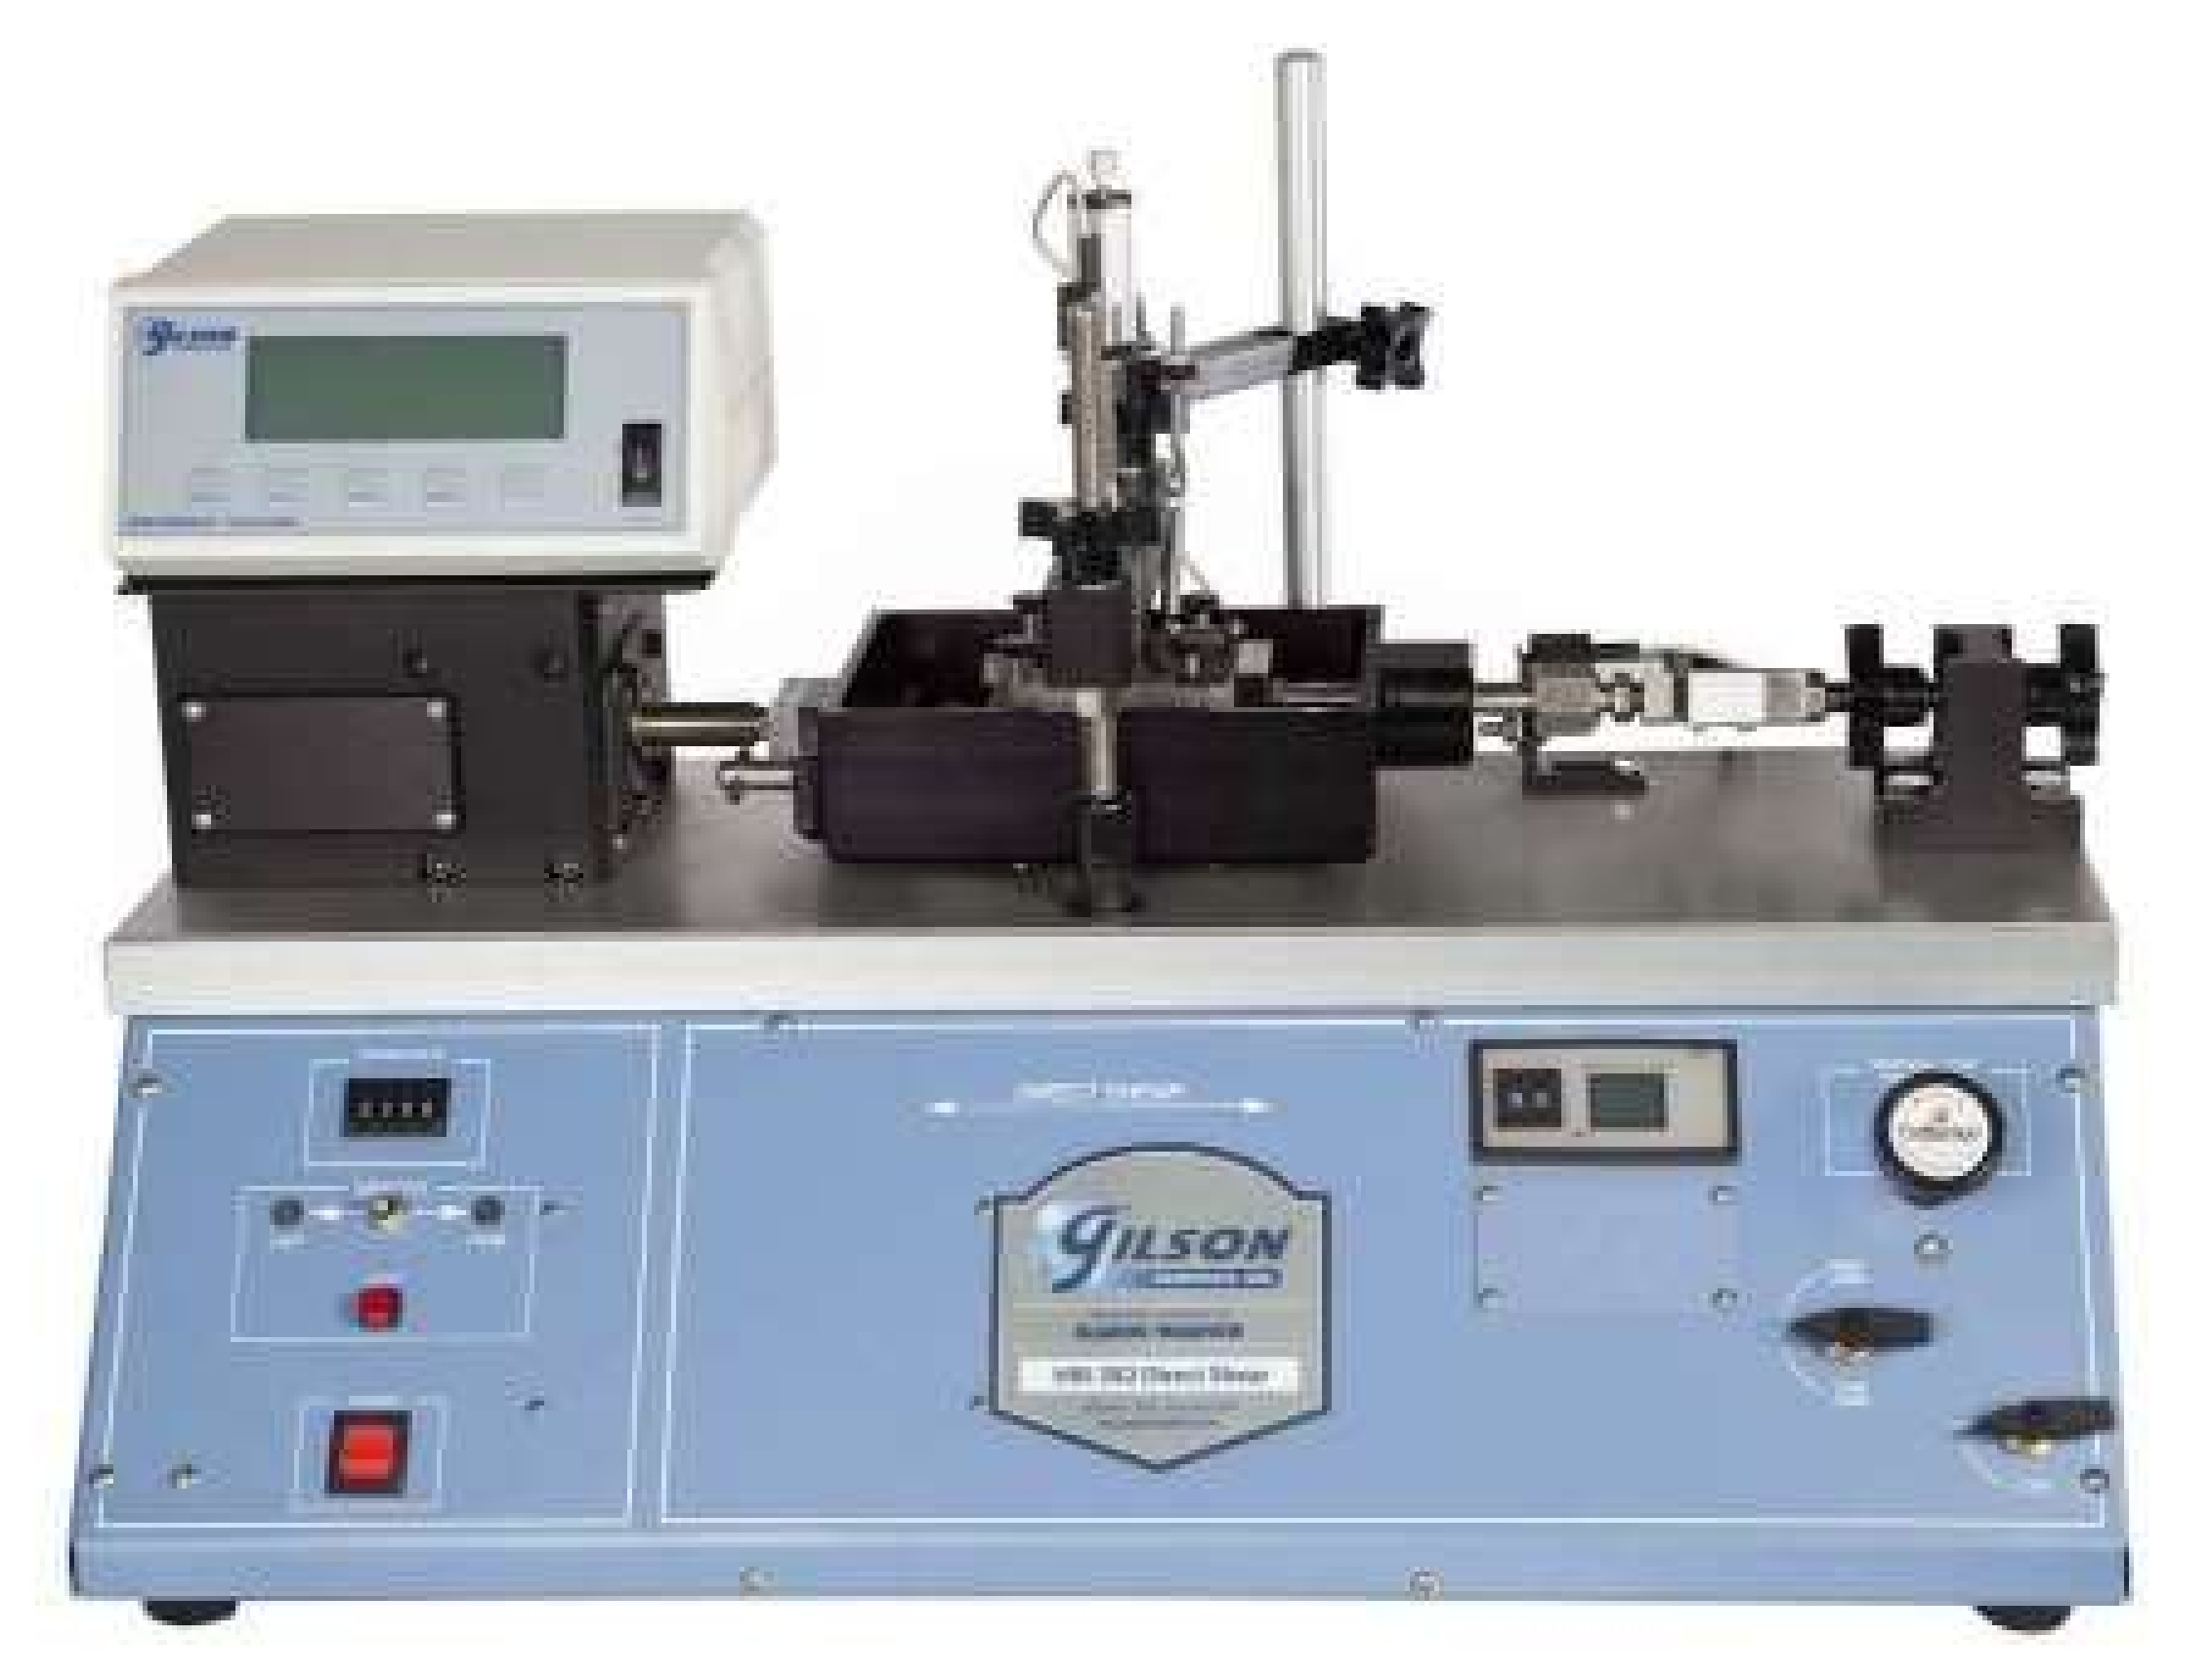
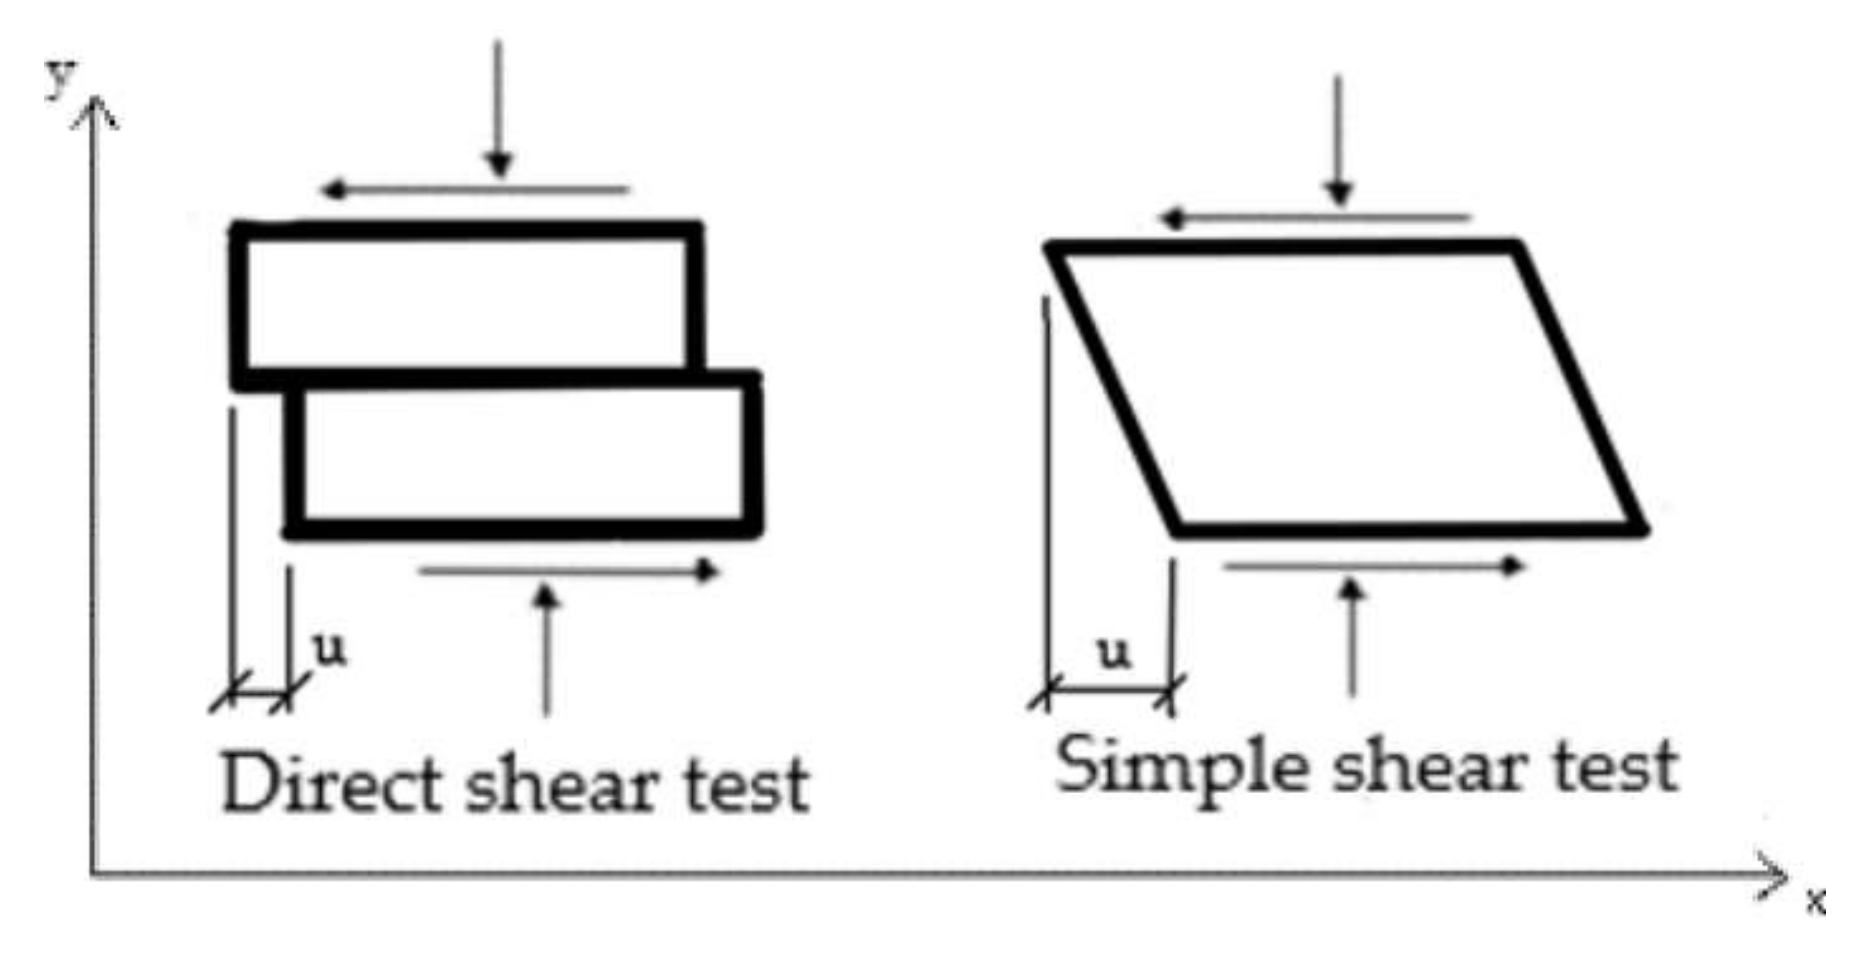
2.1. Direct Shear Test
- Place the top half of the shear box on the bottom one with two clamping screws fixed, as shown in Figure 3.
- Fix the retaining plate and the perforated grid plate, and the shearing force is perpendicular to a serration orientation of the plate.
- Fix the perforated grid plate and the loading pad on top, and then place the assembly into the water chamber; slot the end onto the pushrod.
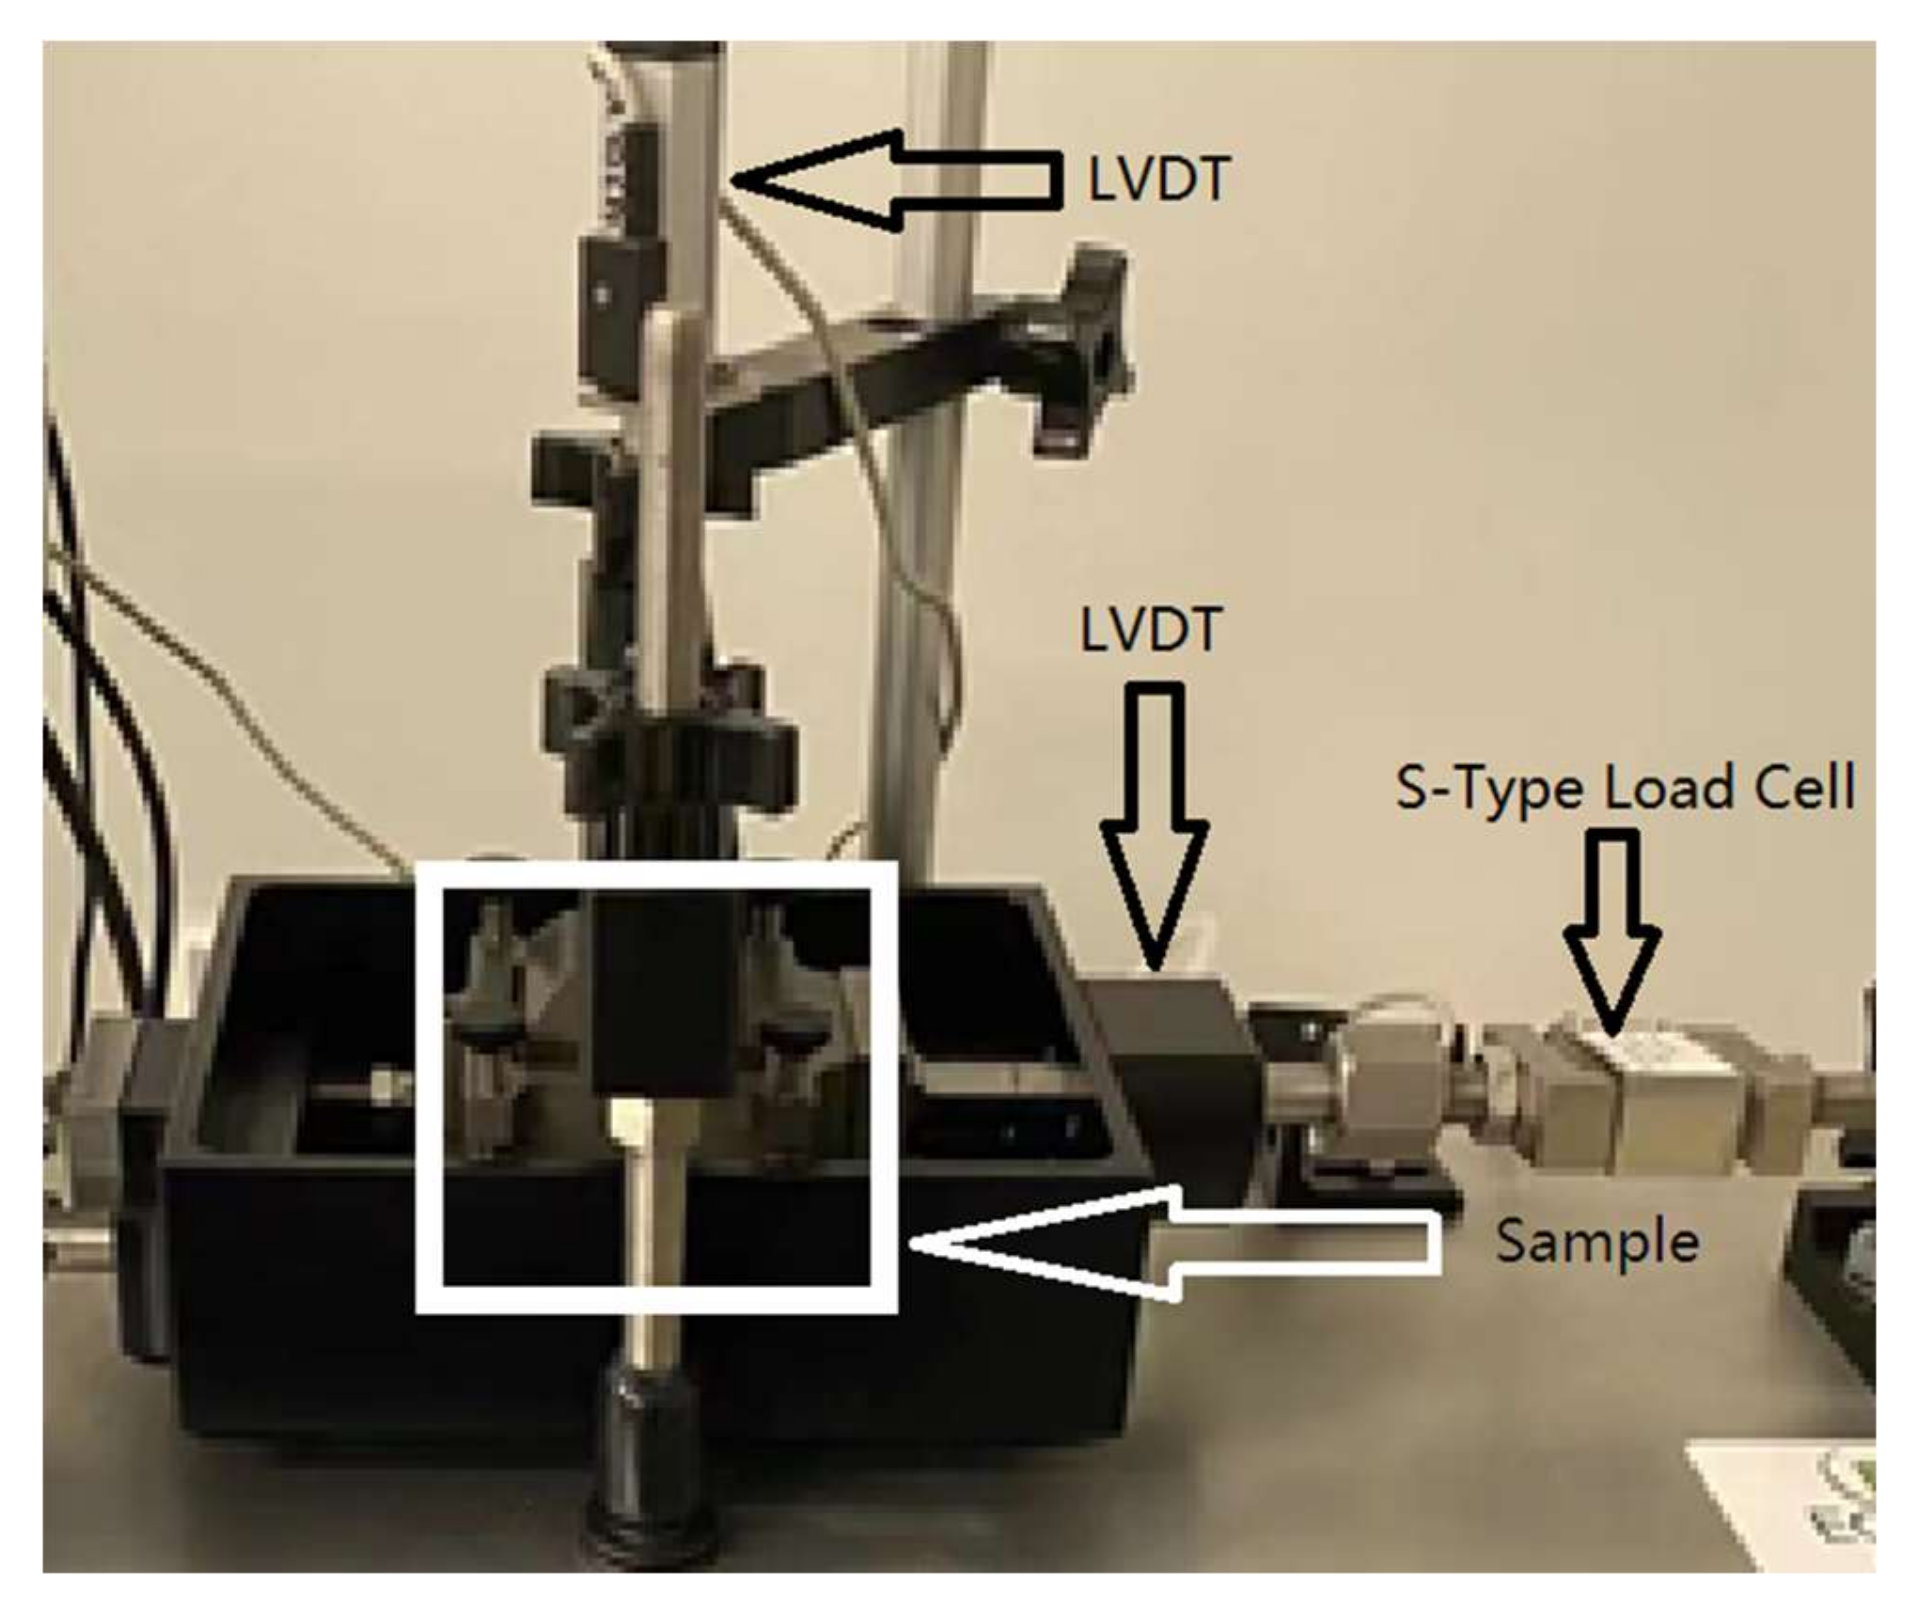
- Fix the horizontal and vertical LVDTs on the specific location.
- Apply normal stress and wait for consolidation to be completed (cohesionless soil is consolidated instantaneously).
- Shear the soil specimen with the constant rate (), which is determined by the sample’s hydraulic conductivity, and the formula is shown below [58].where:
- —estimated elapsed time to specimen failure in shearing apparatus;
- —consolidation with 50 percent under the maximum normal stress;
- —consolidation with 90 percent under the maximum normal stress;
- —estimated relative lateral displacement at failure, (for overconsolidated fine-grained soil), otherwise .
- S—shearing strength of soil (kPa);
- C—cohesion strength of soil (kPa);
- —normal effective strength (kPa);
- —internal friction angle (°).
2.2. Simple Shear Test
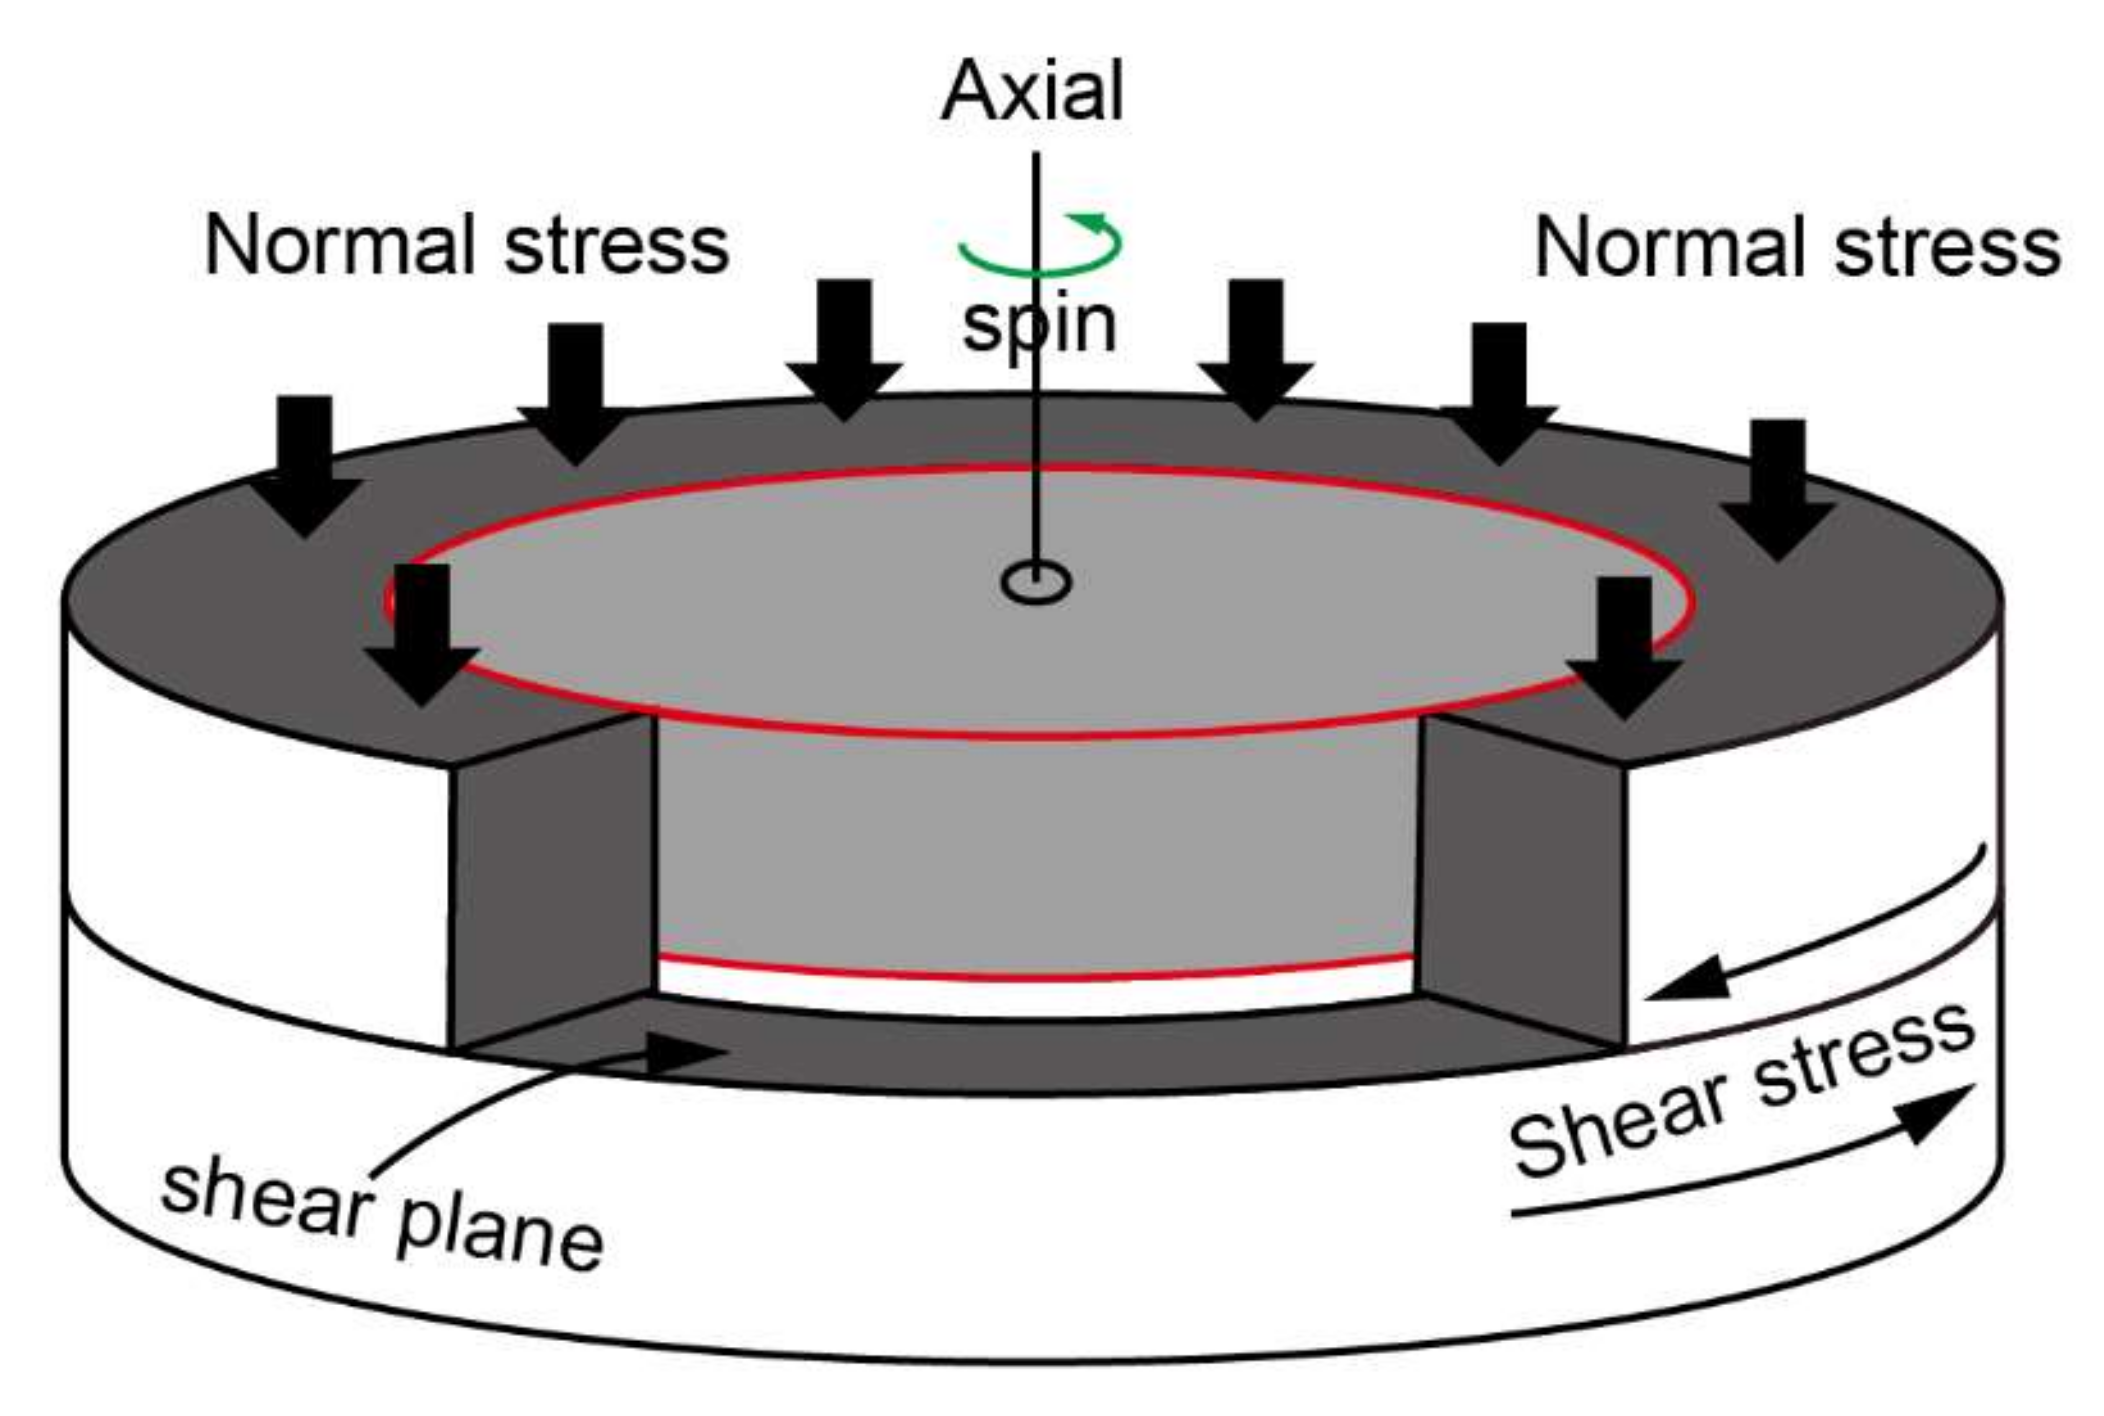
2.3. Ring Shear Test
3. Interface Shear Strength
3.1. Influence of Surface Roughness
3.1.1. Background
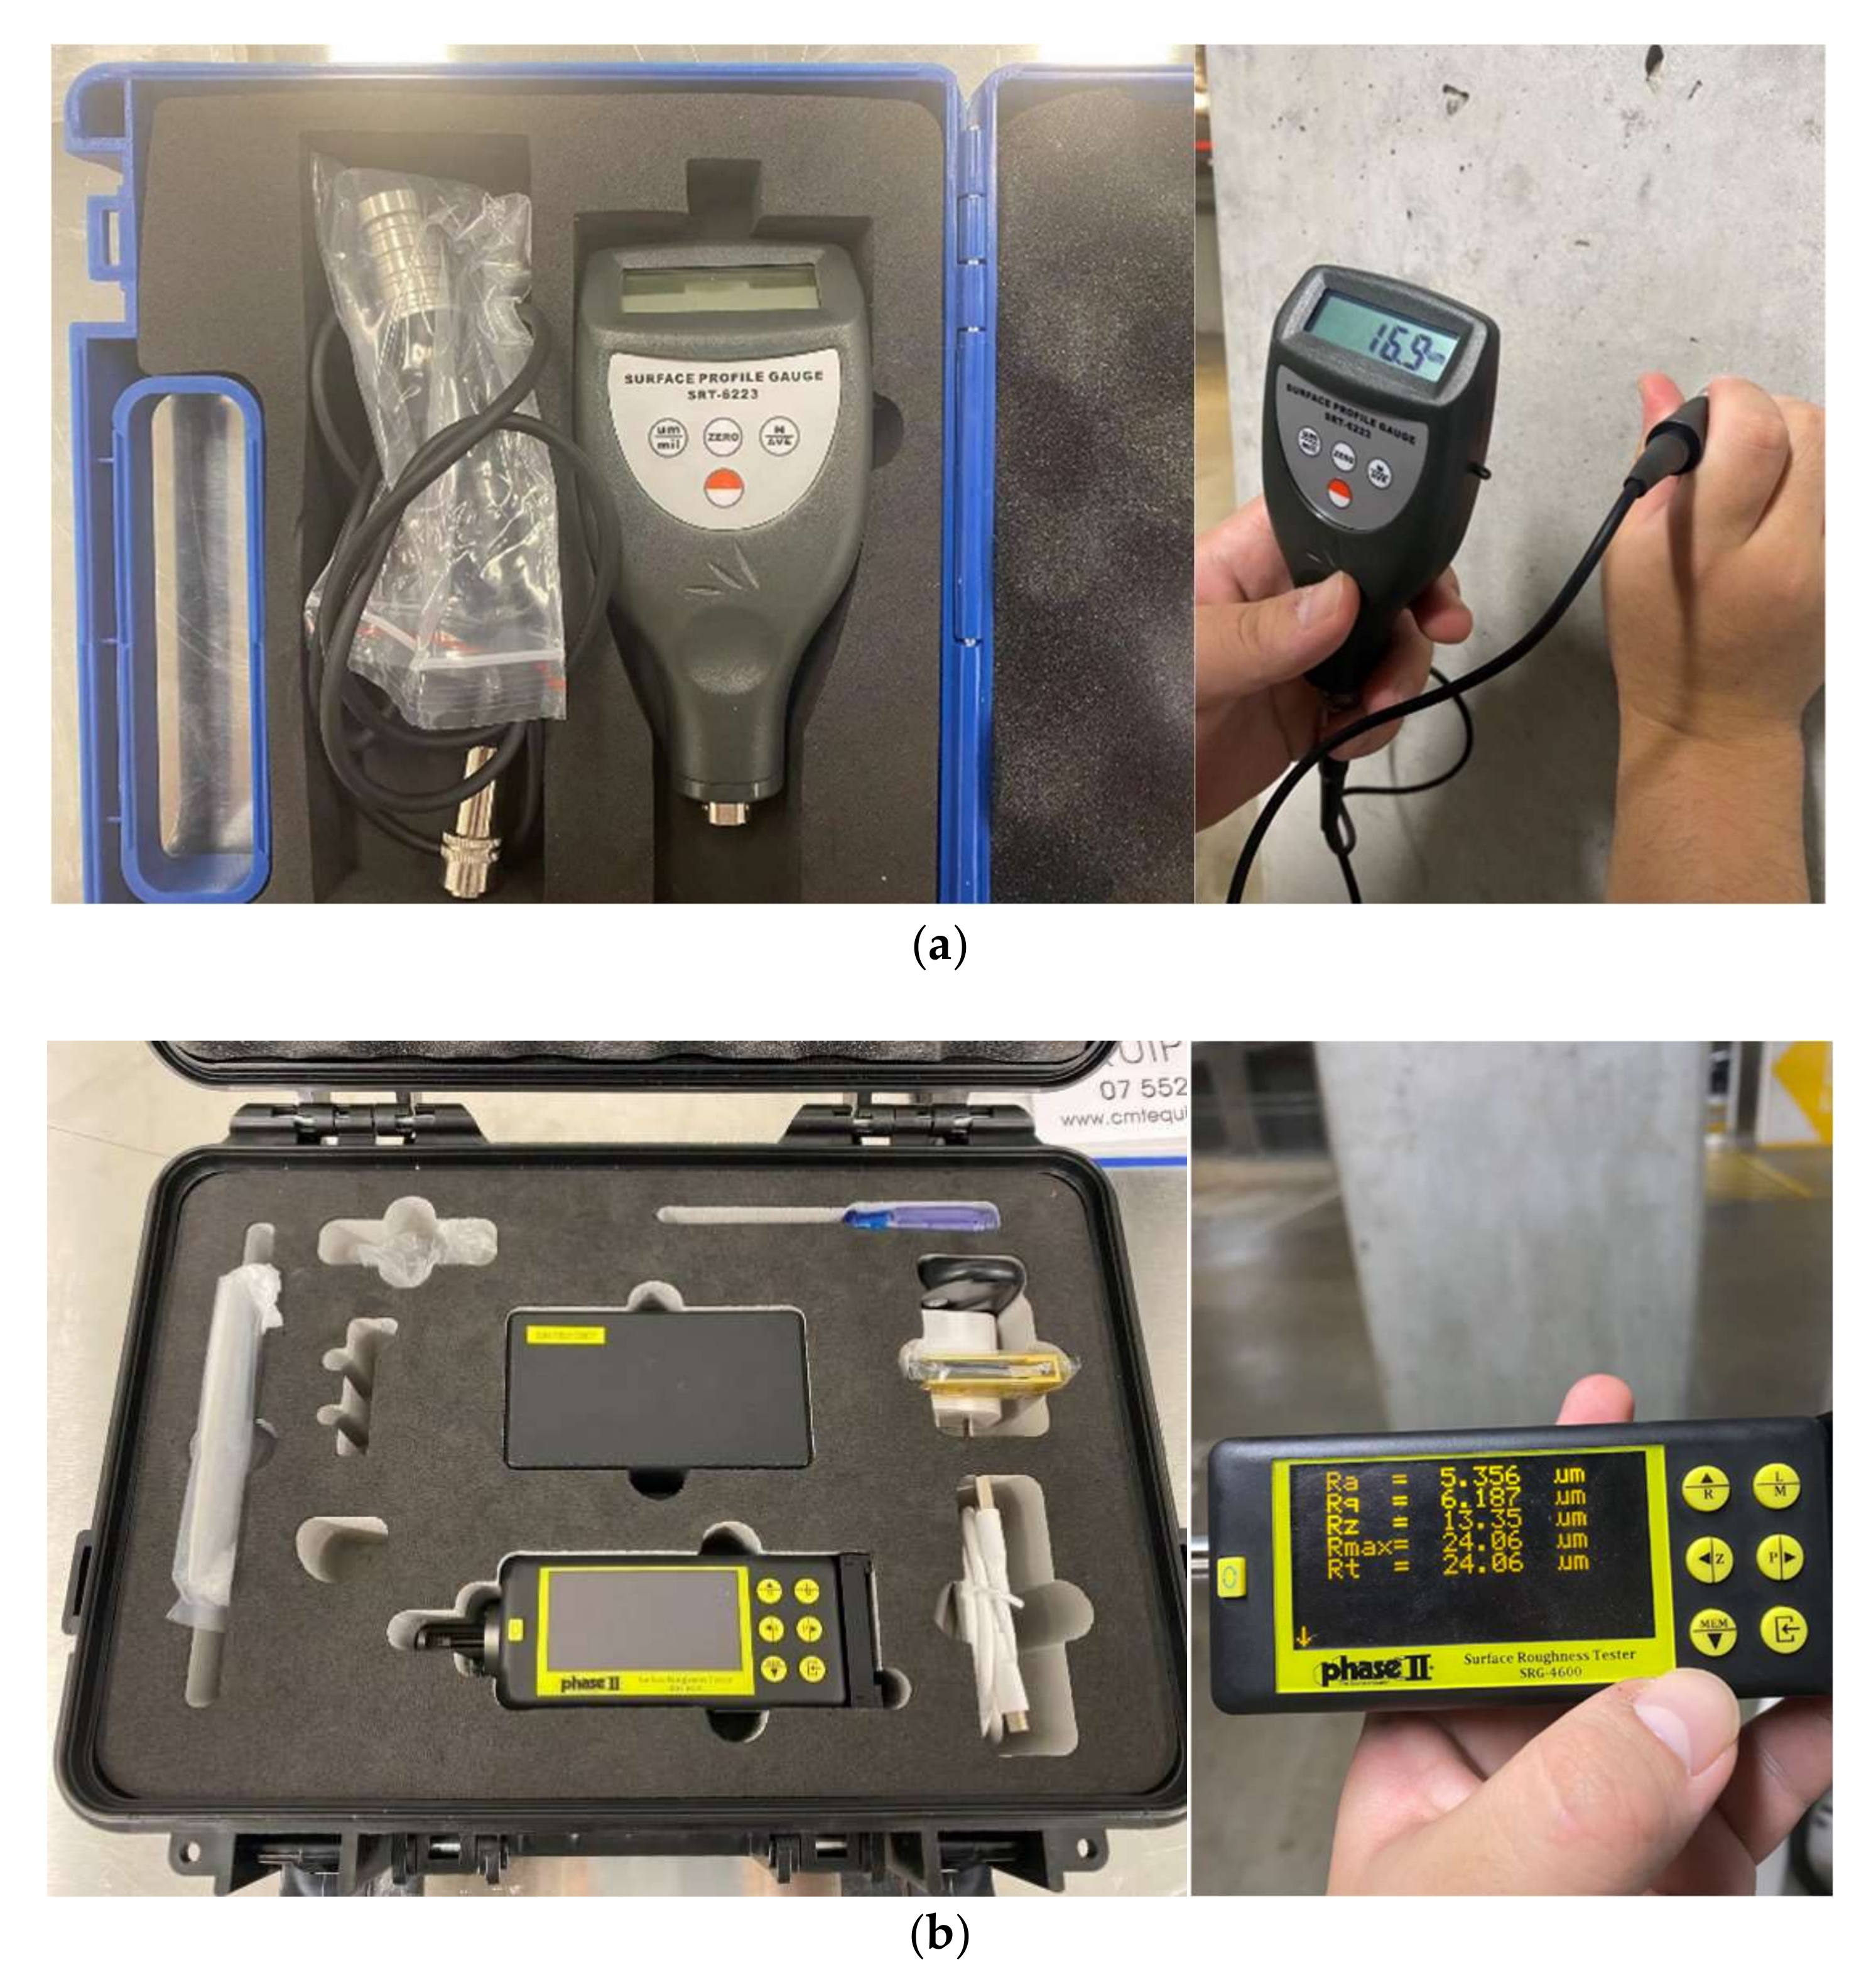
3.1.2. Roughness Measurement
3.1.3. Definition of Surface Roughness Form
3.2. Influence of Other Factors on Interface Behavior
3.2.1. Particle Angularity
- C—soil cohesion;
- Φ—soil internal friction angle;
- γ—soil unit weight;
- K—lateral earth pressure coefficient;
- h—soil cover from the ground level to the pipe crown;
- b—influencing soil width above the pipe.
3.2.2. Mean Particle Size
3.2.3. Surface Hardness
3.2.4. Particle Breakage
3.2.5. Confinement Condition
4. Potential Application of Particle Image Velocimetry (PIV) Technology for Research on Interface Friction
4.1. Background
4.2. Introduction
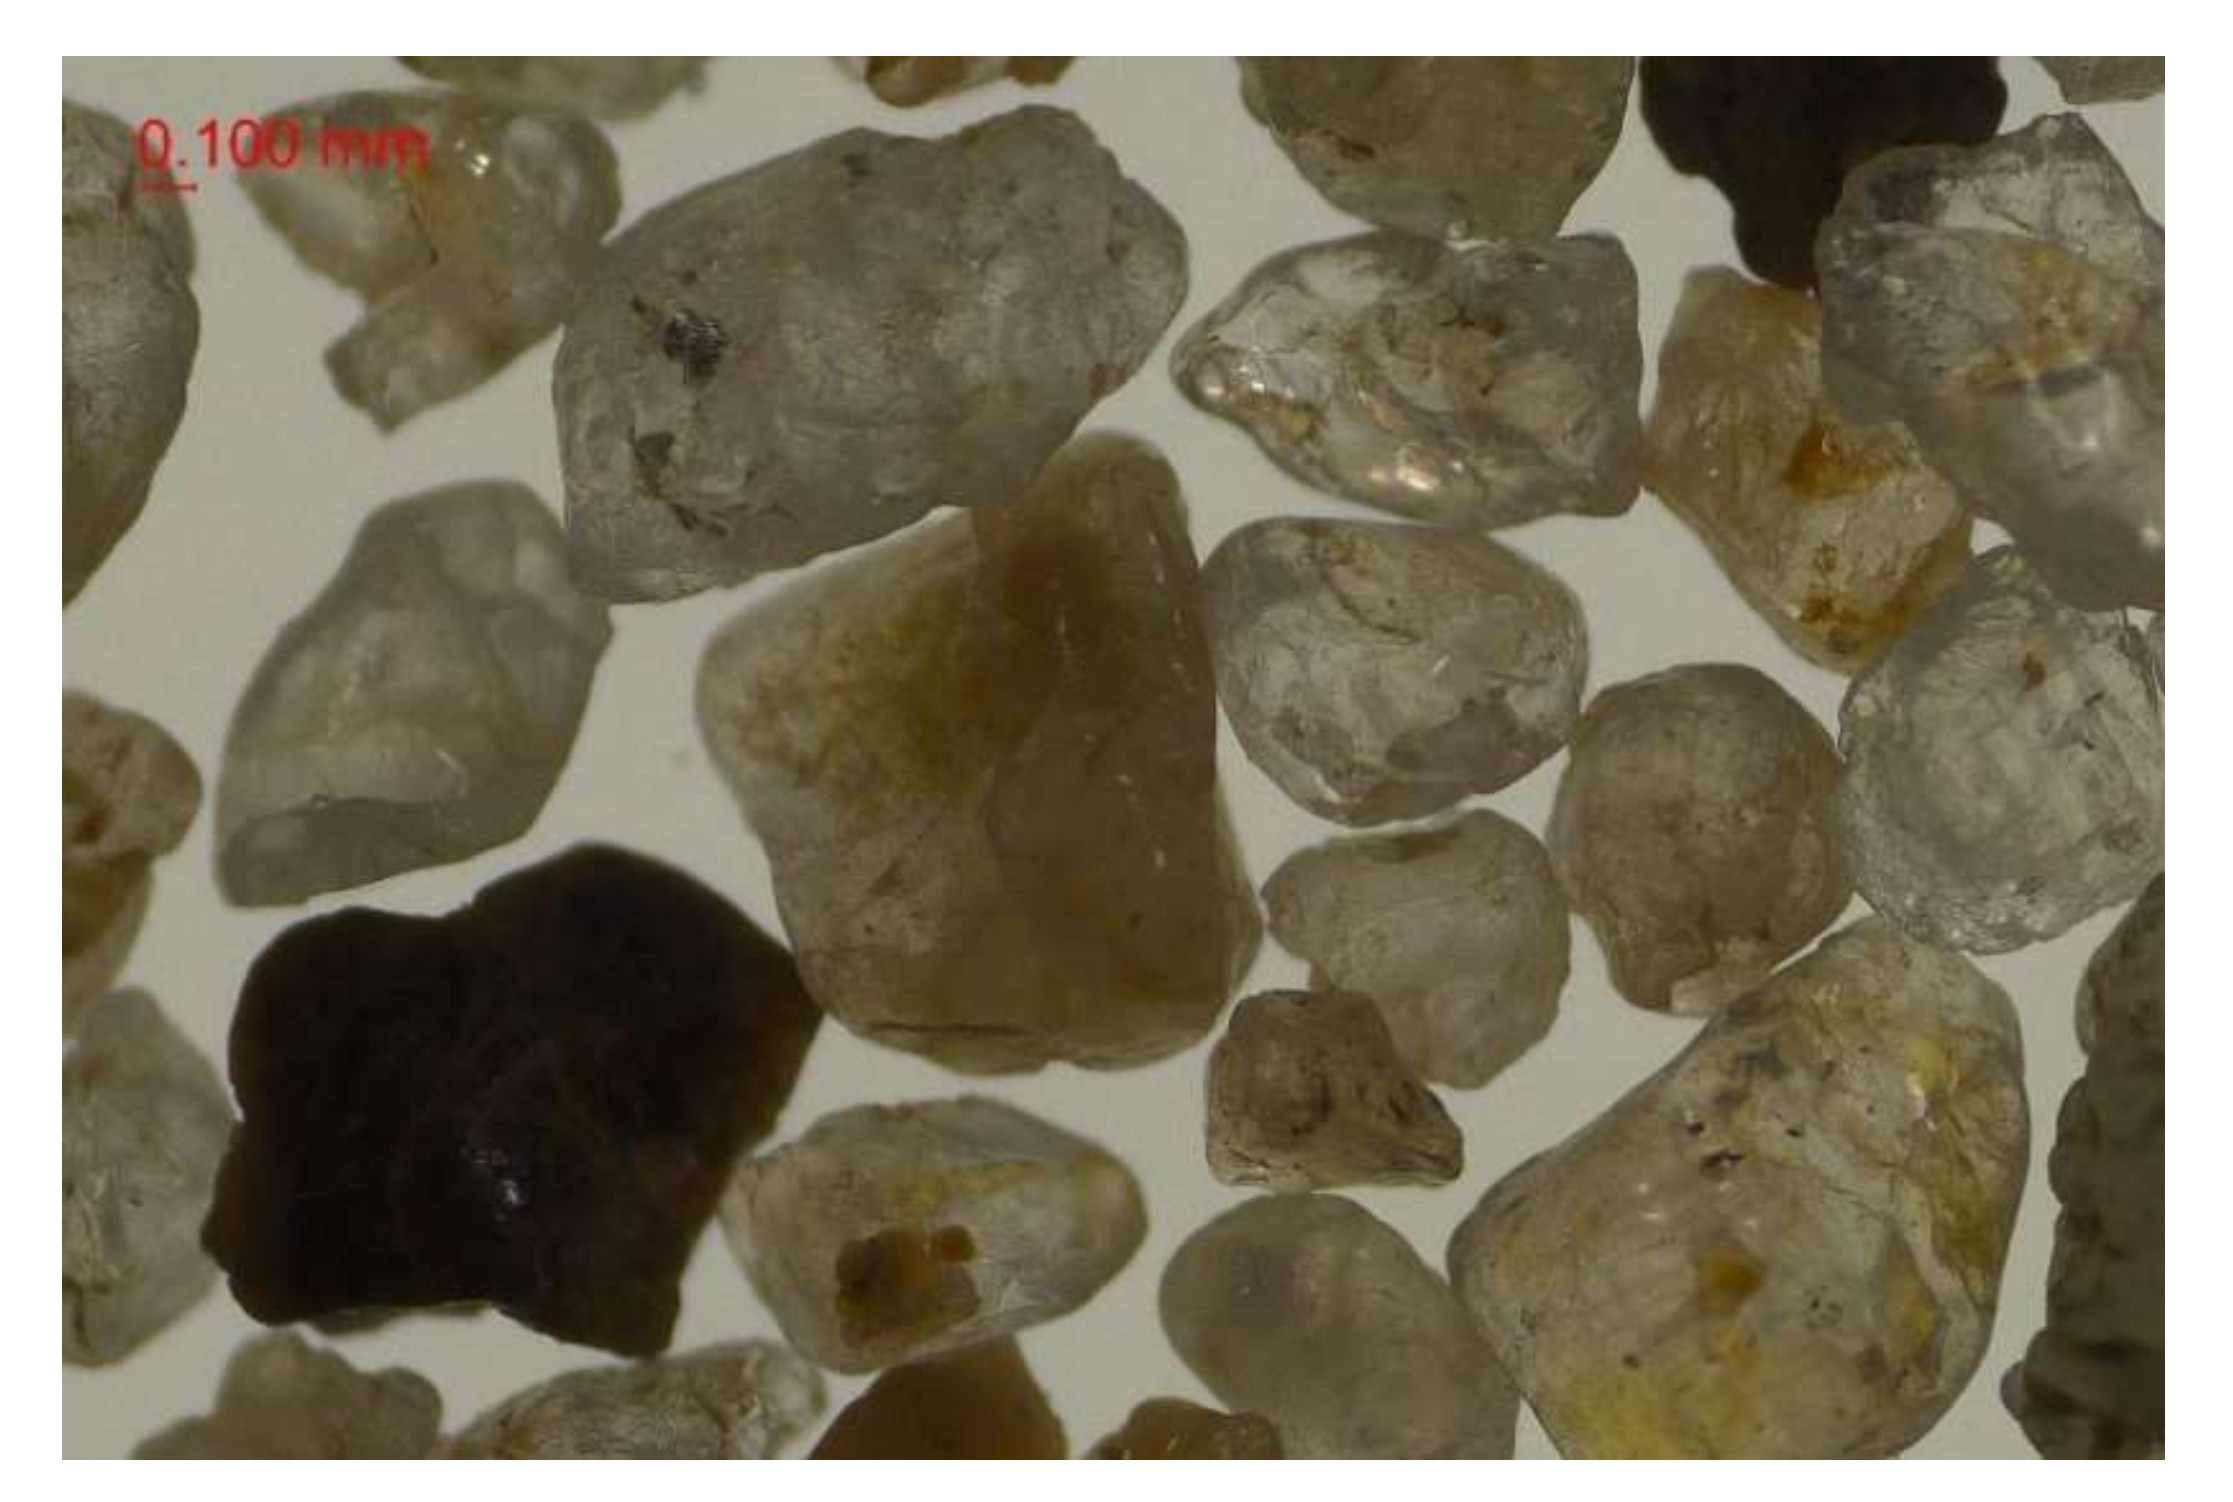
4.3. Tested Material
4.4. Equipment Setup
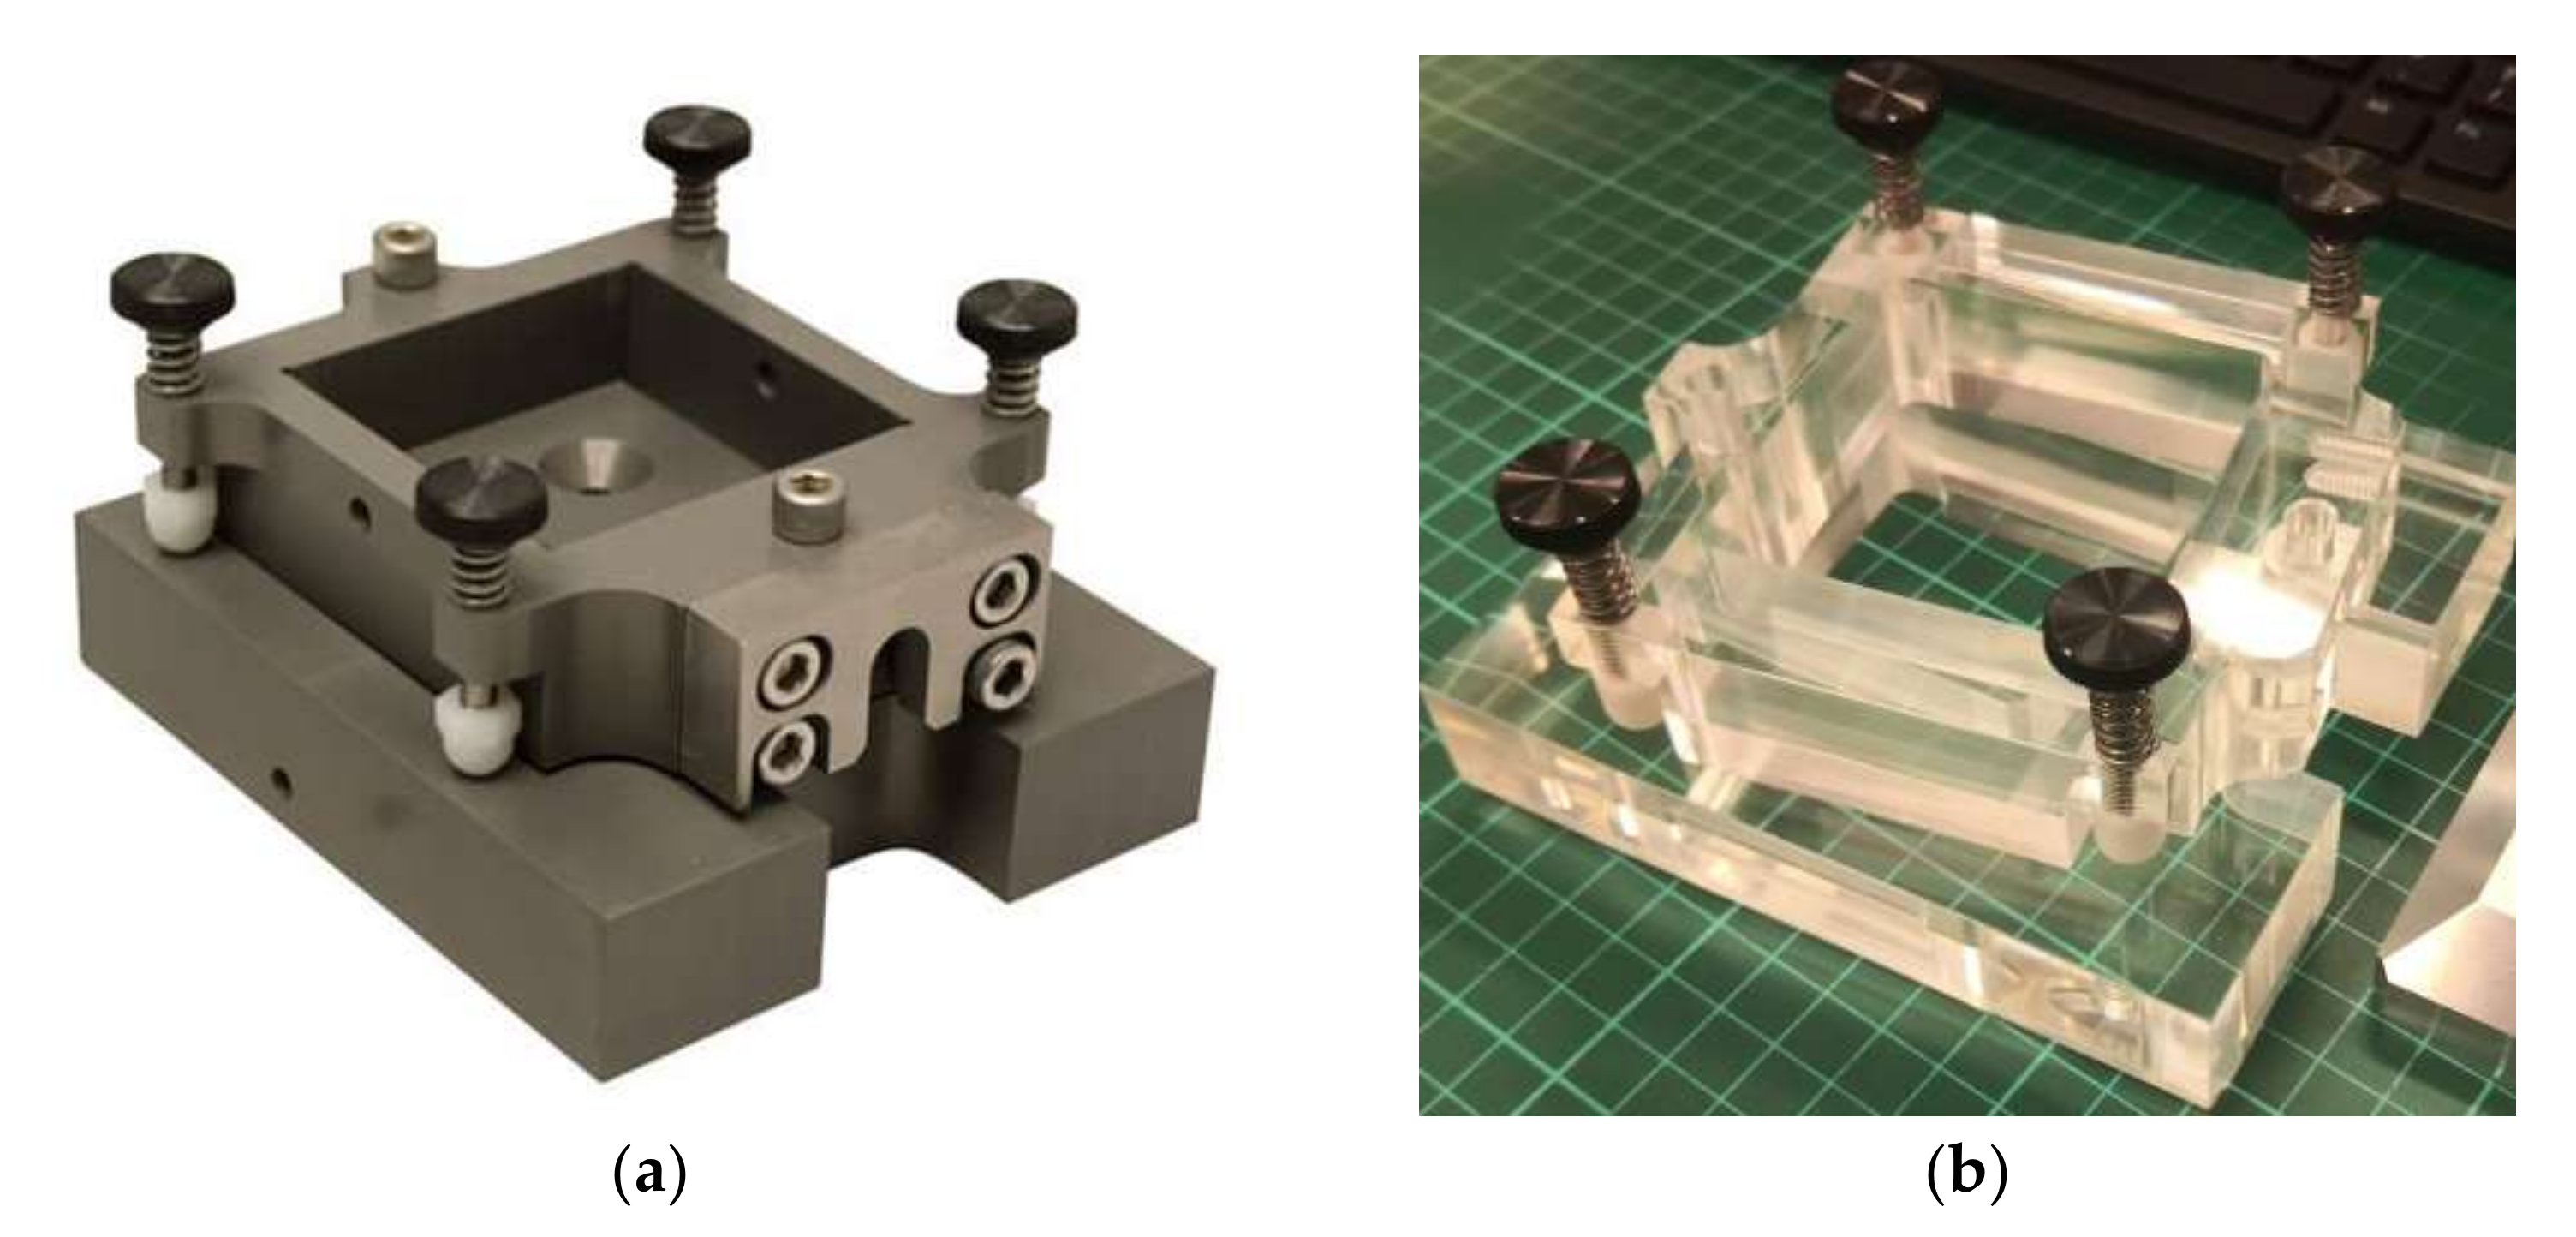
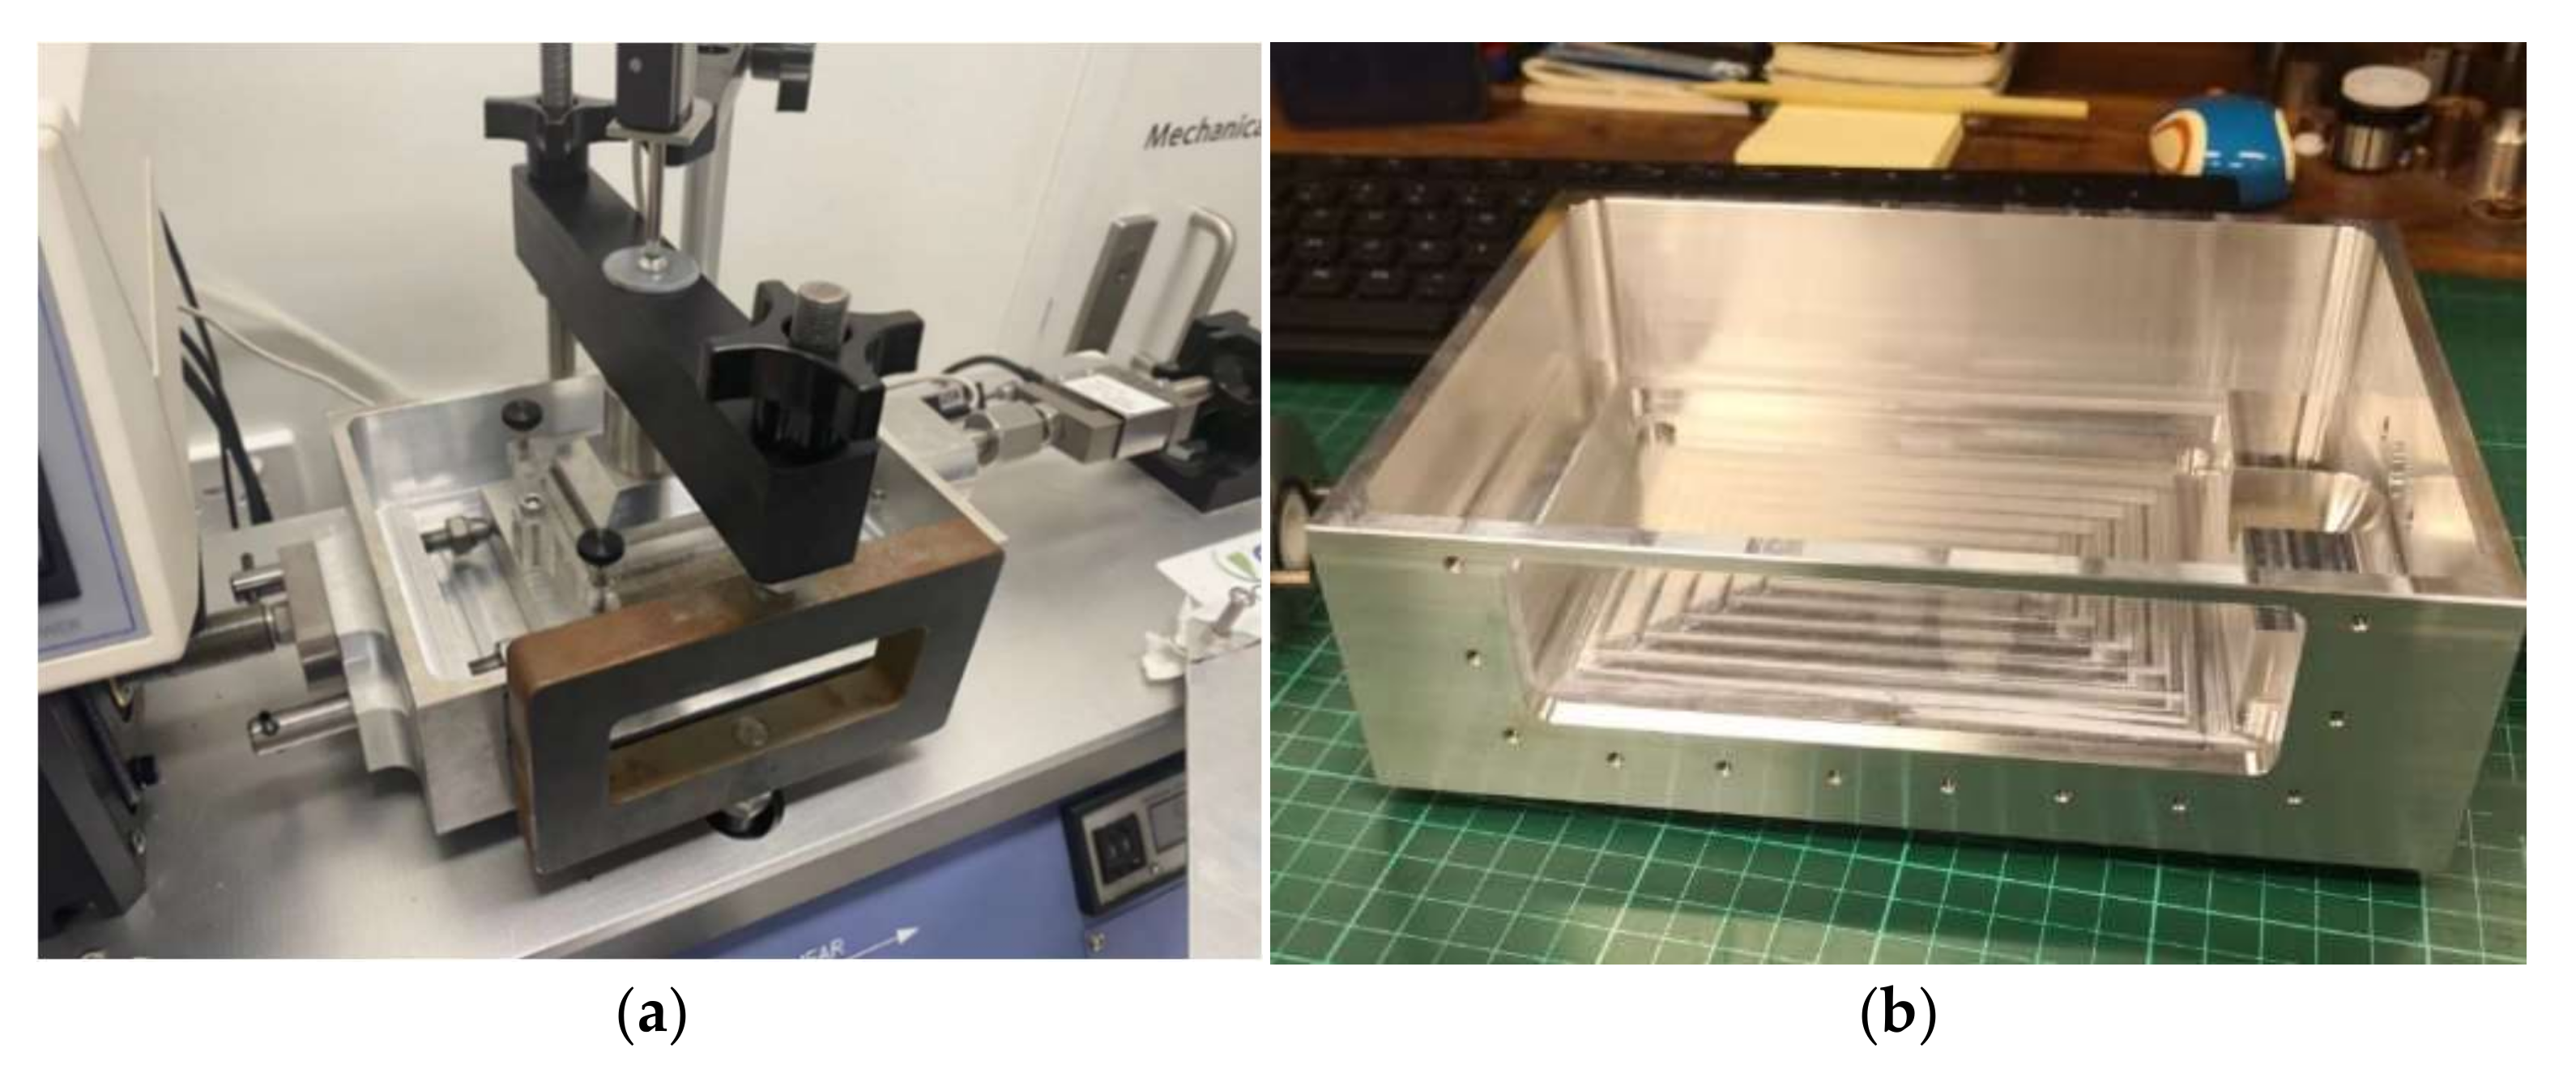
4.4.1. Transparent Shear Box
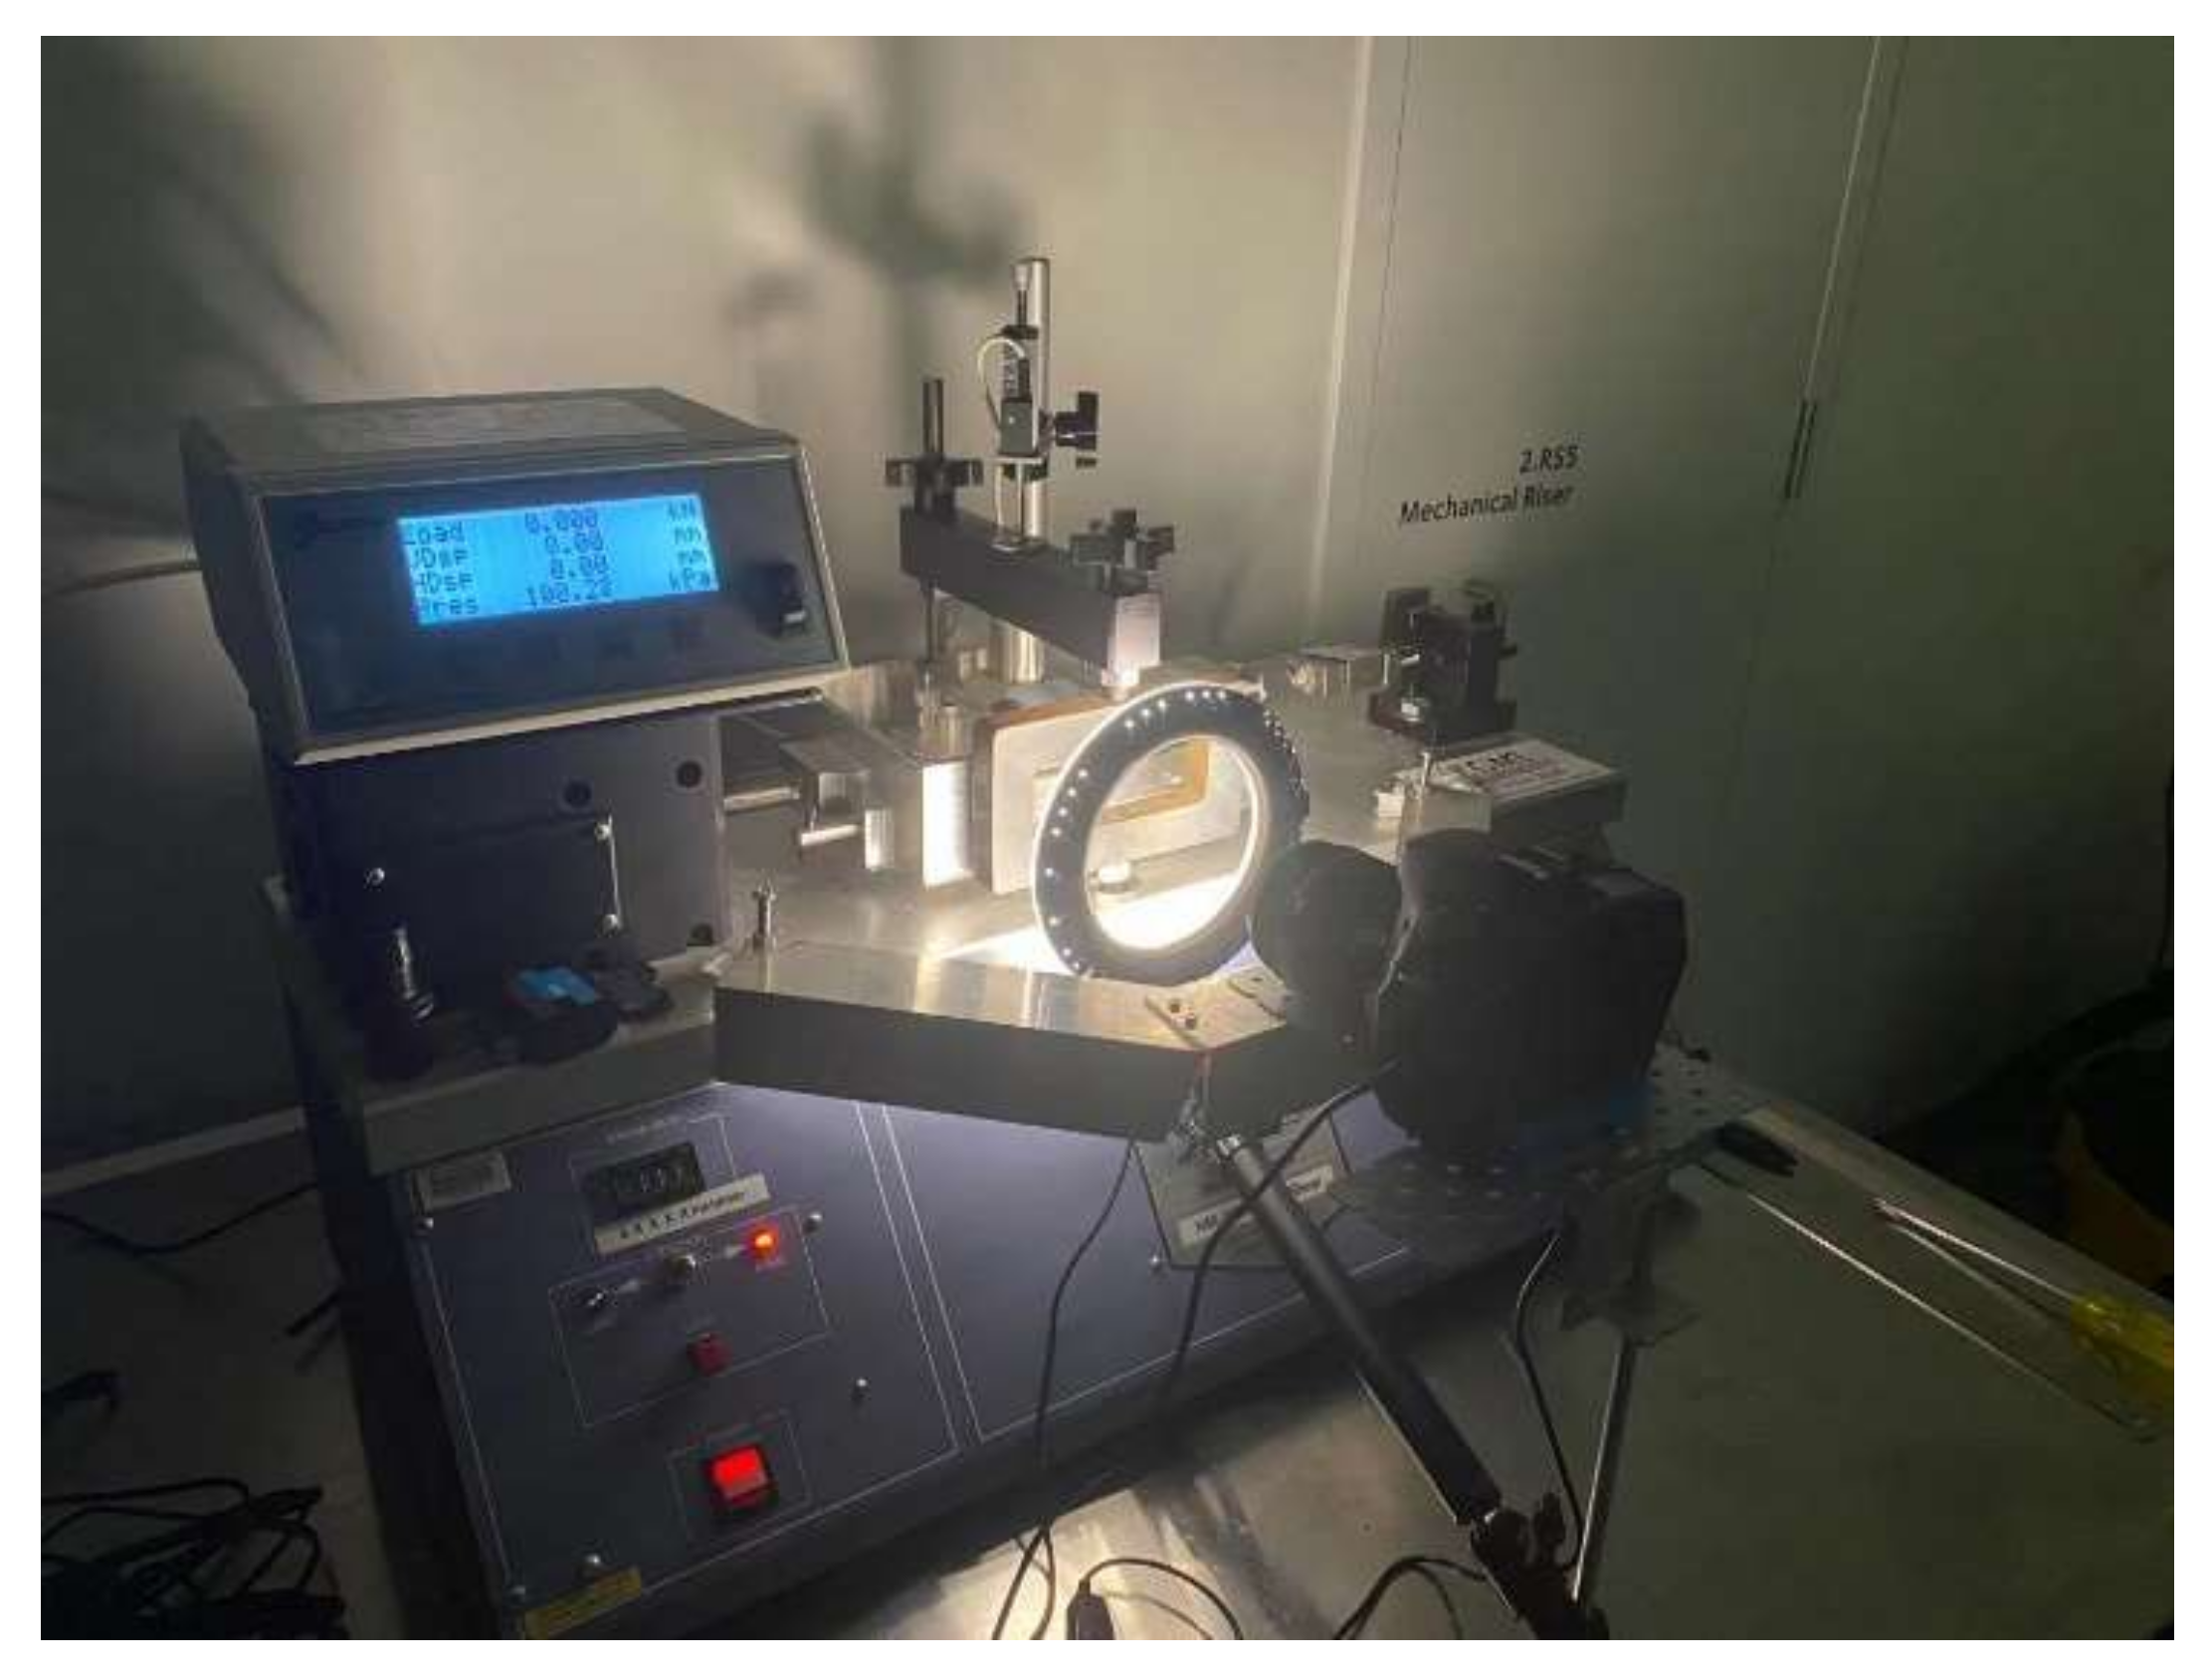
4.4.2. Camera and Illumination System
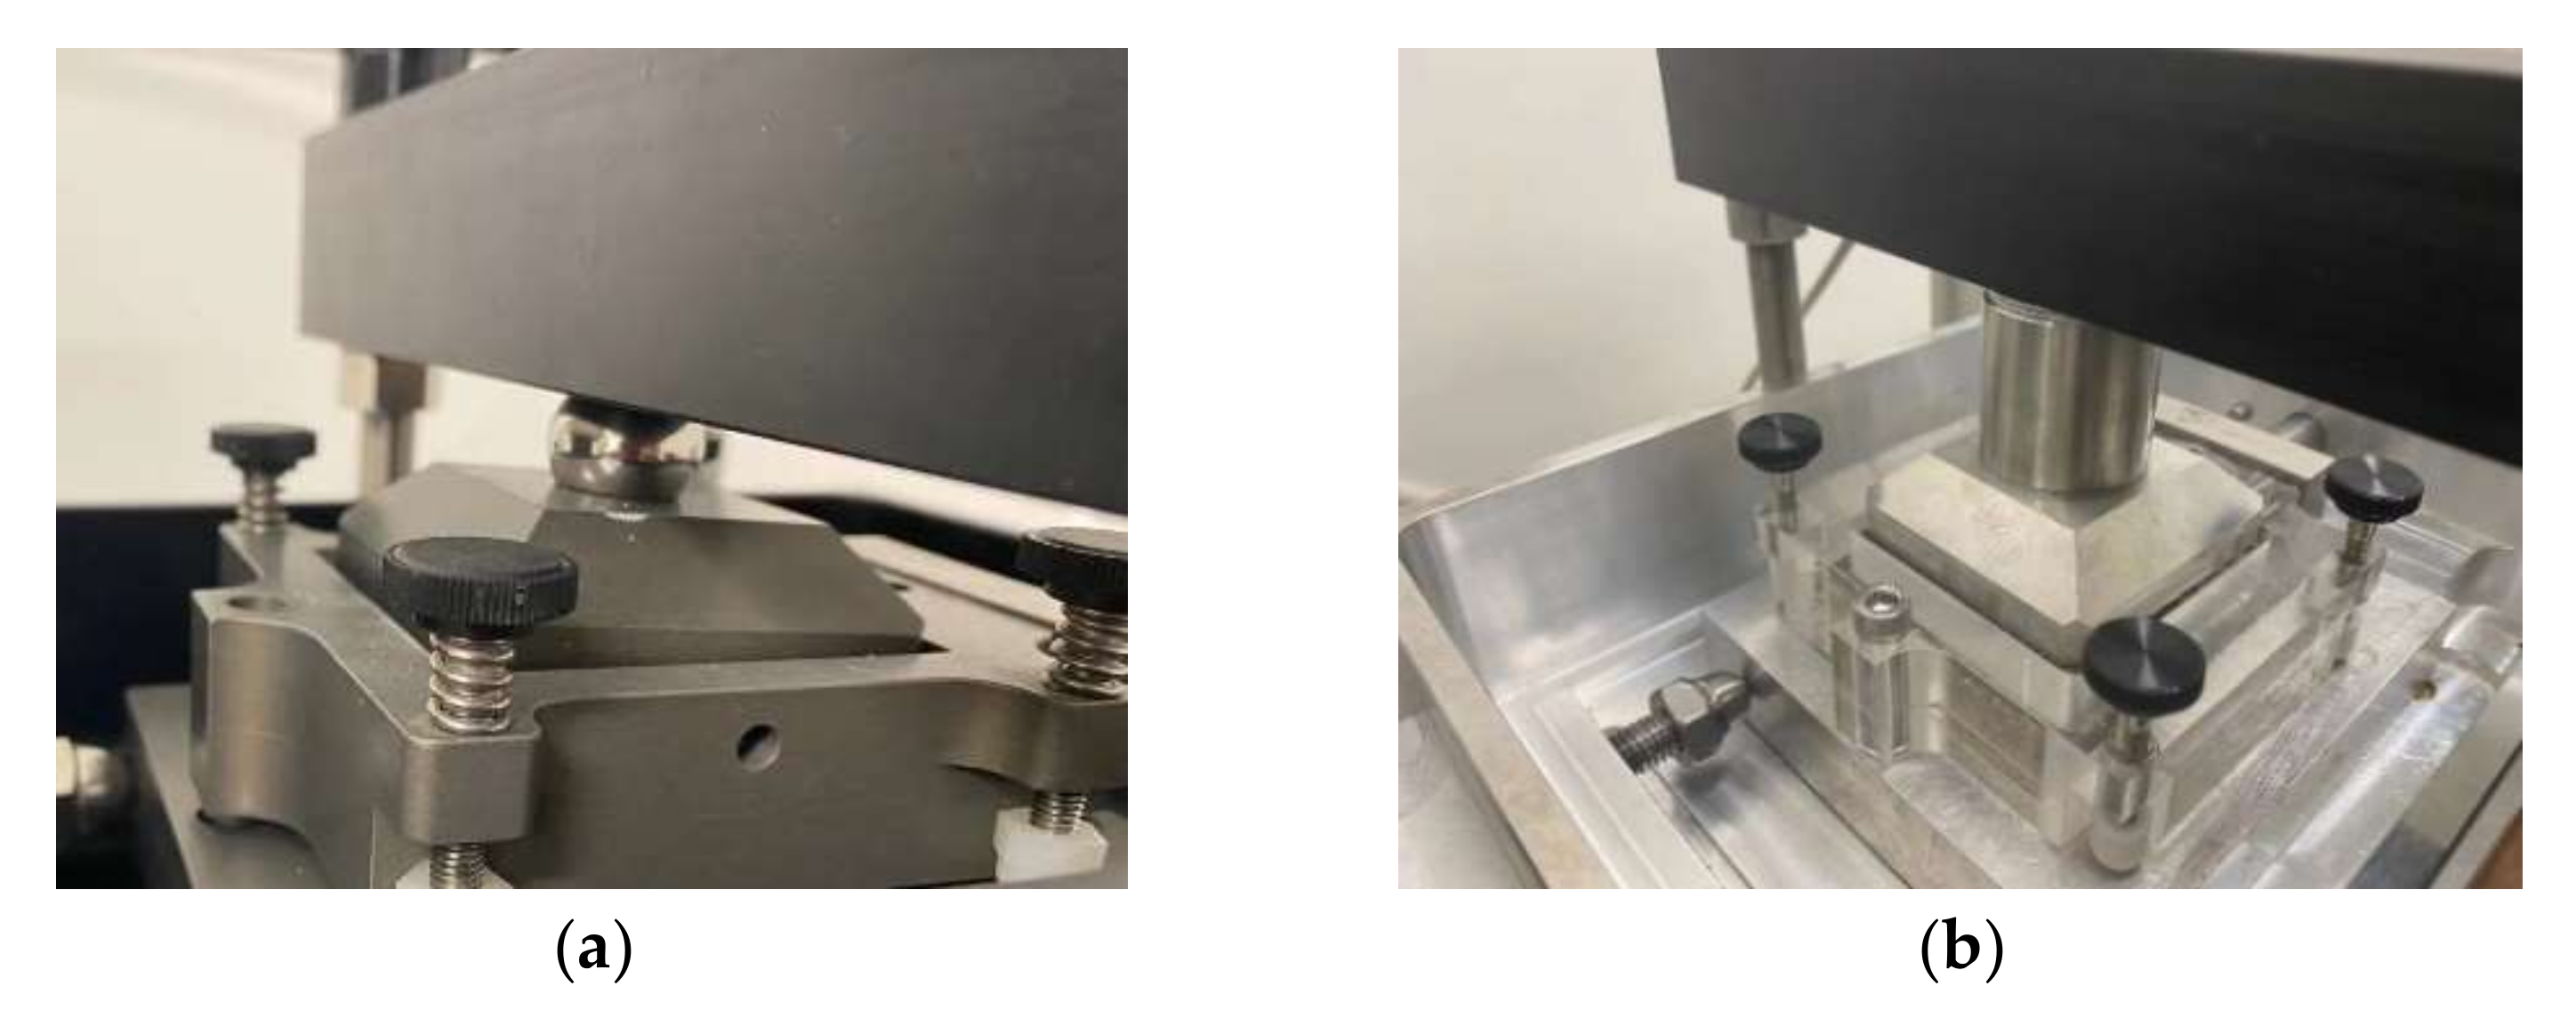
4.4.3. Modified Loading Frame
4.4.4. Procedure of Interface Direct Shear Test
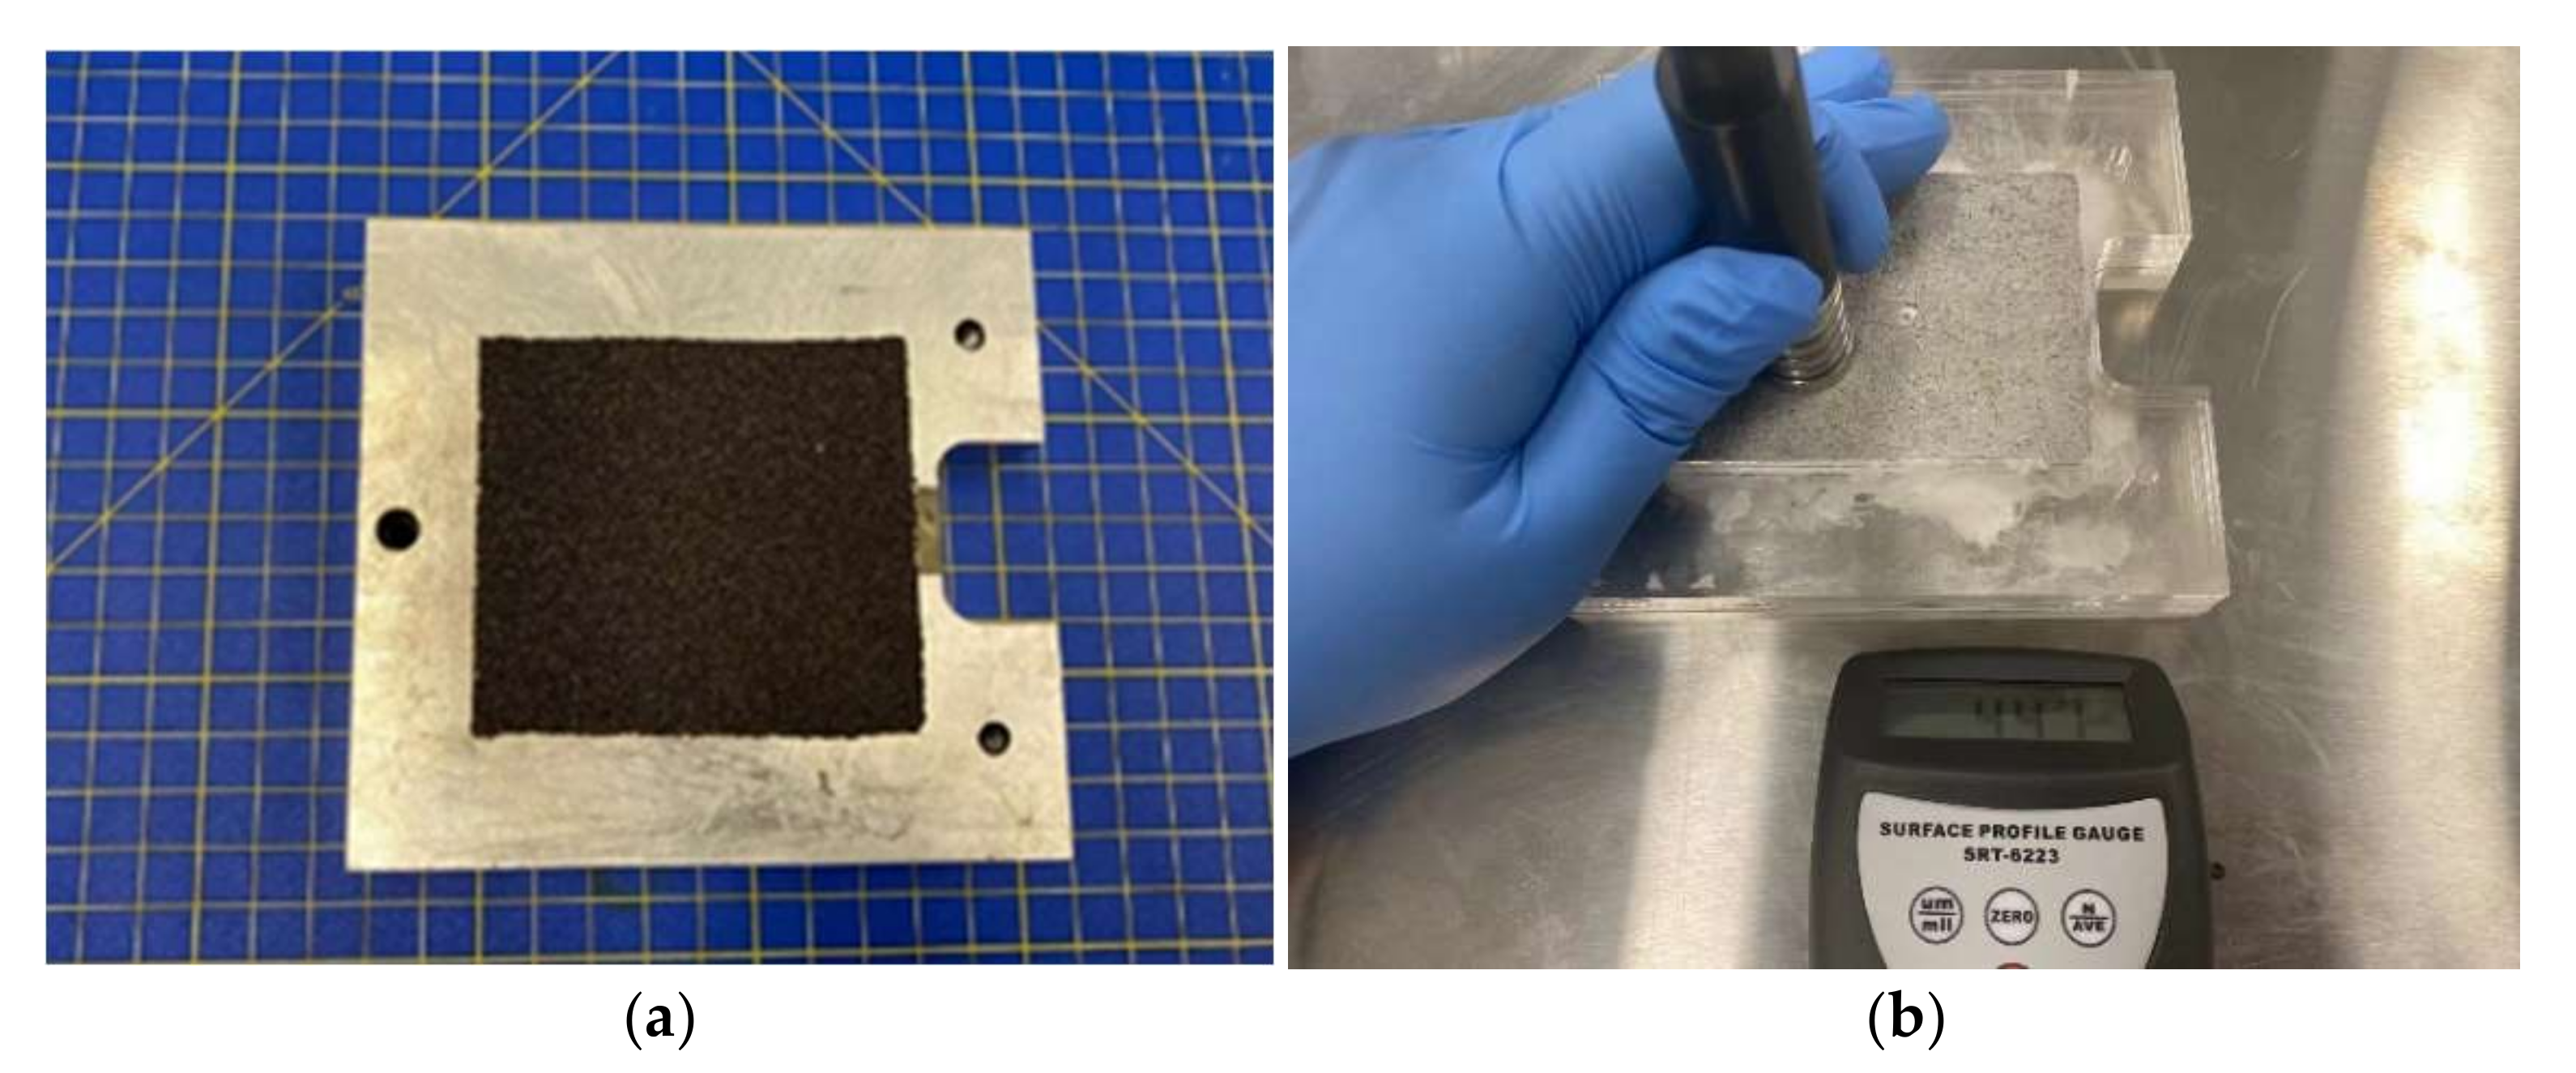
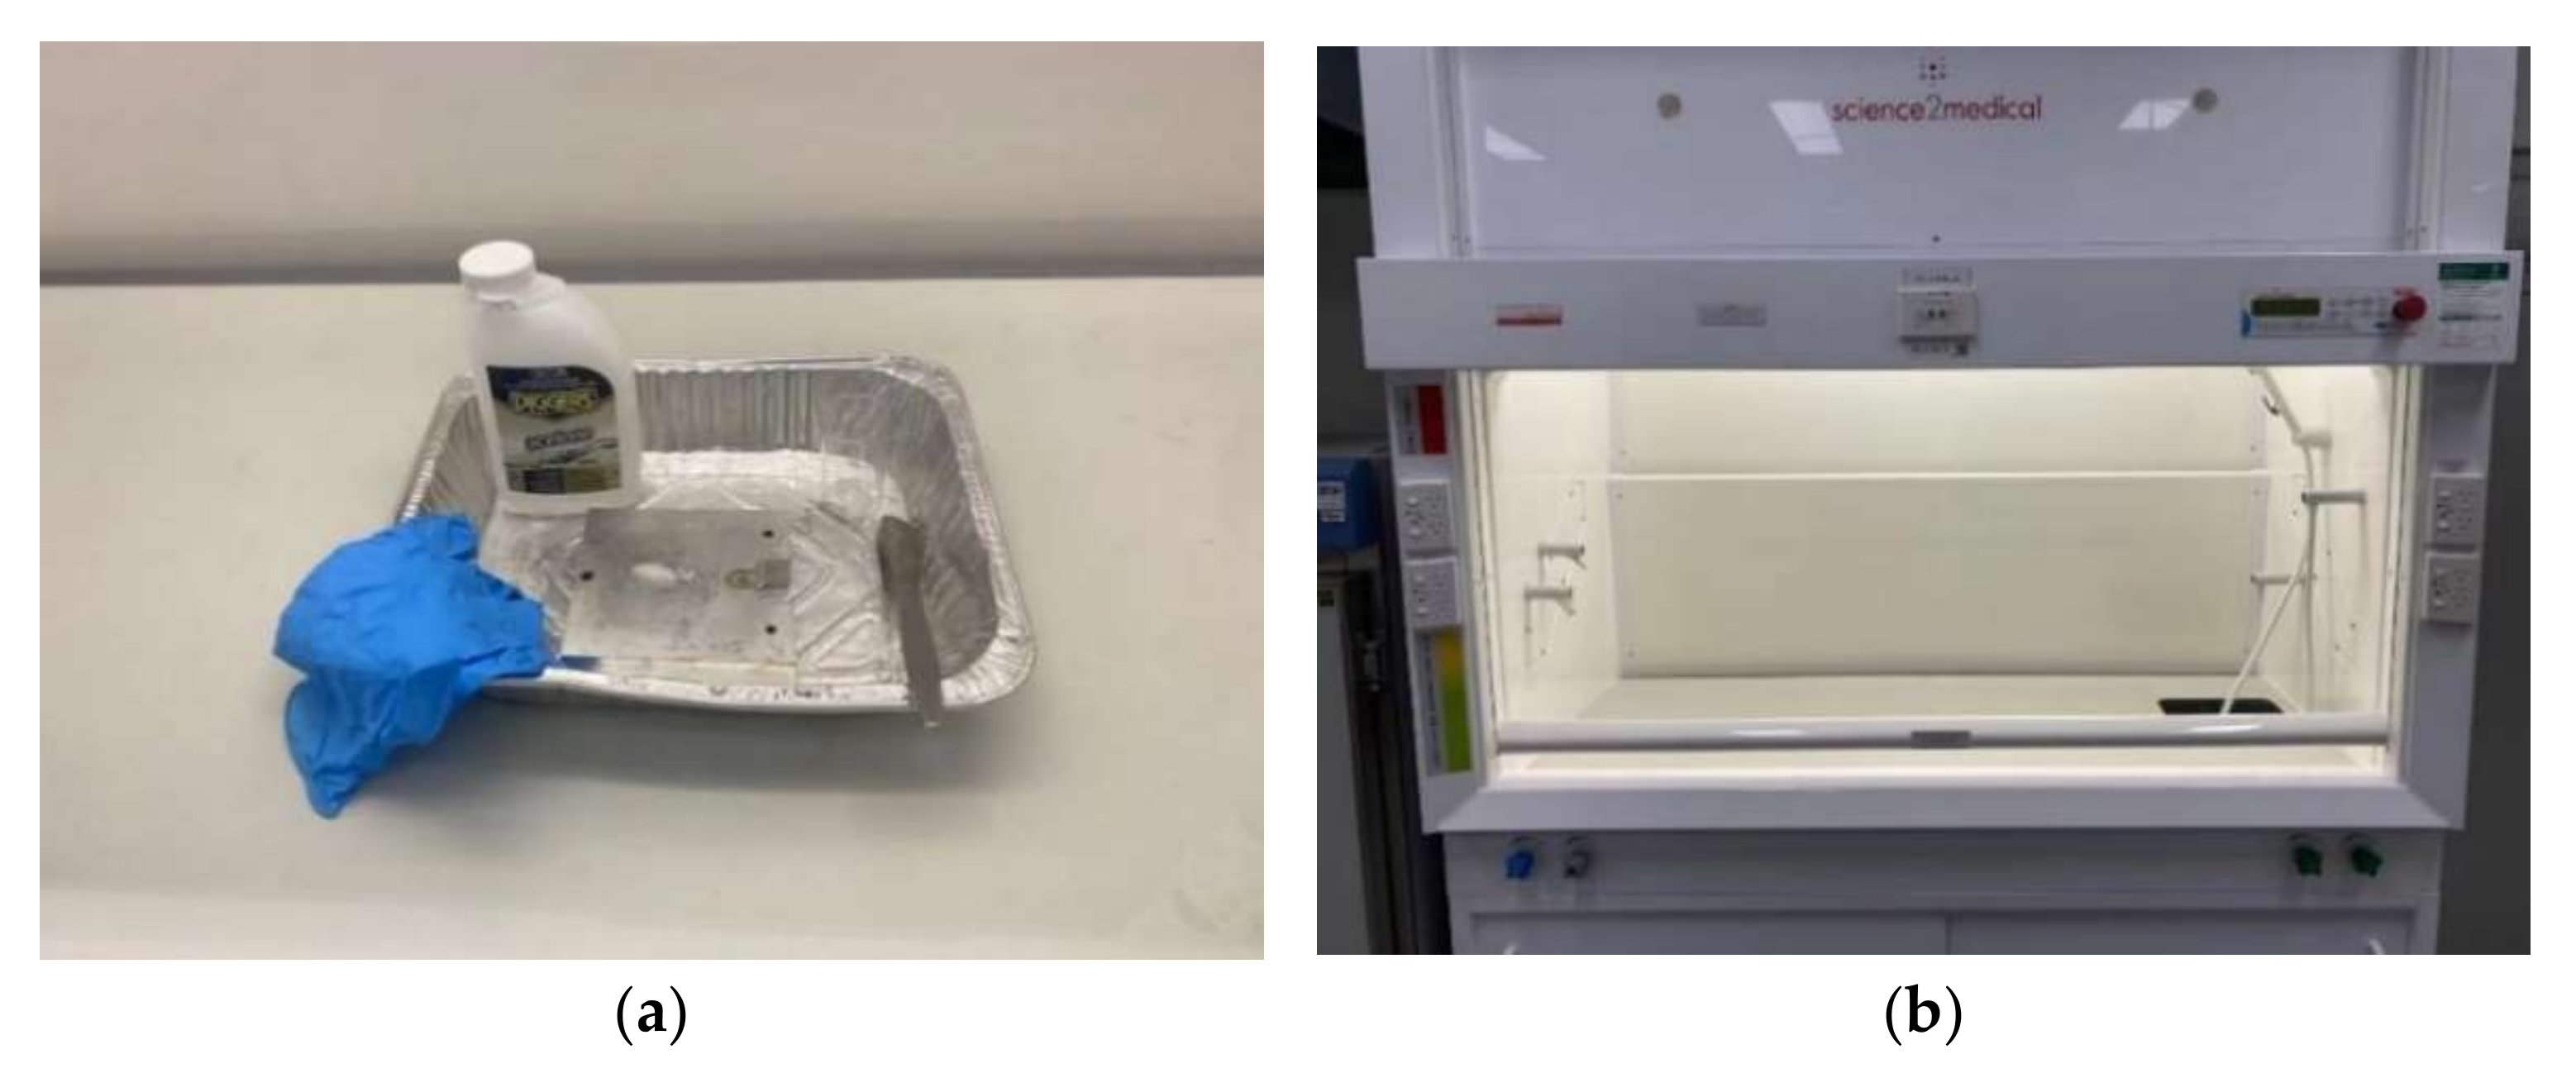
- For abrasive material, clean the modified bottom shear box with acetone in the fume cupboard (Figure 23), and stick the sandpaper on the modified bottom shear box with proper location.
- For reinforcing material, put the sample block into the modified bottom shear box.
- Adjust the lifting screw and clamping screws to suit the 0.6 mm steel plate between the top and bottom shear box, and remove the steel plates.
- Fix the base plate and the perforated grid plate, and the shearing force is perpendicular to a serration orientation.
- Fill the soil sample with 14.5-mm thickness with dry pluviation method or compaction method, and slightly put a porous stone on the sample.
- Clean the bottom shear box and water chamber.
- Measure the total weight of the shear box, and then place the assembly into the water chamber, slotting the end onto the pushrod.
- Fix the horizontal and vertical LVDTs on the specific location and return records to zero.
- Apply normal stress and wait until consolidation is completed (cohesionless soil is consolidated instantaneously).
- Remove clamping screws.
- Shear the soil specimen with the constant rate ().
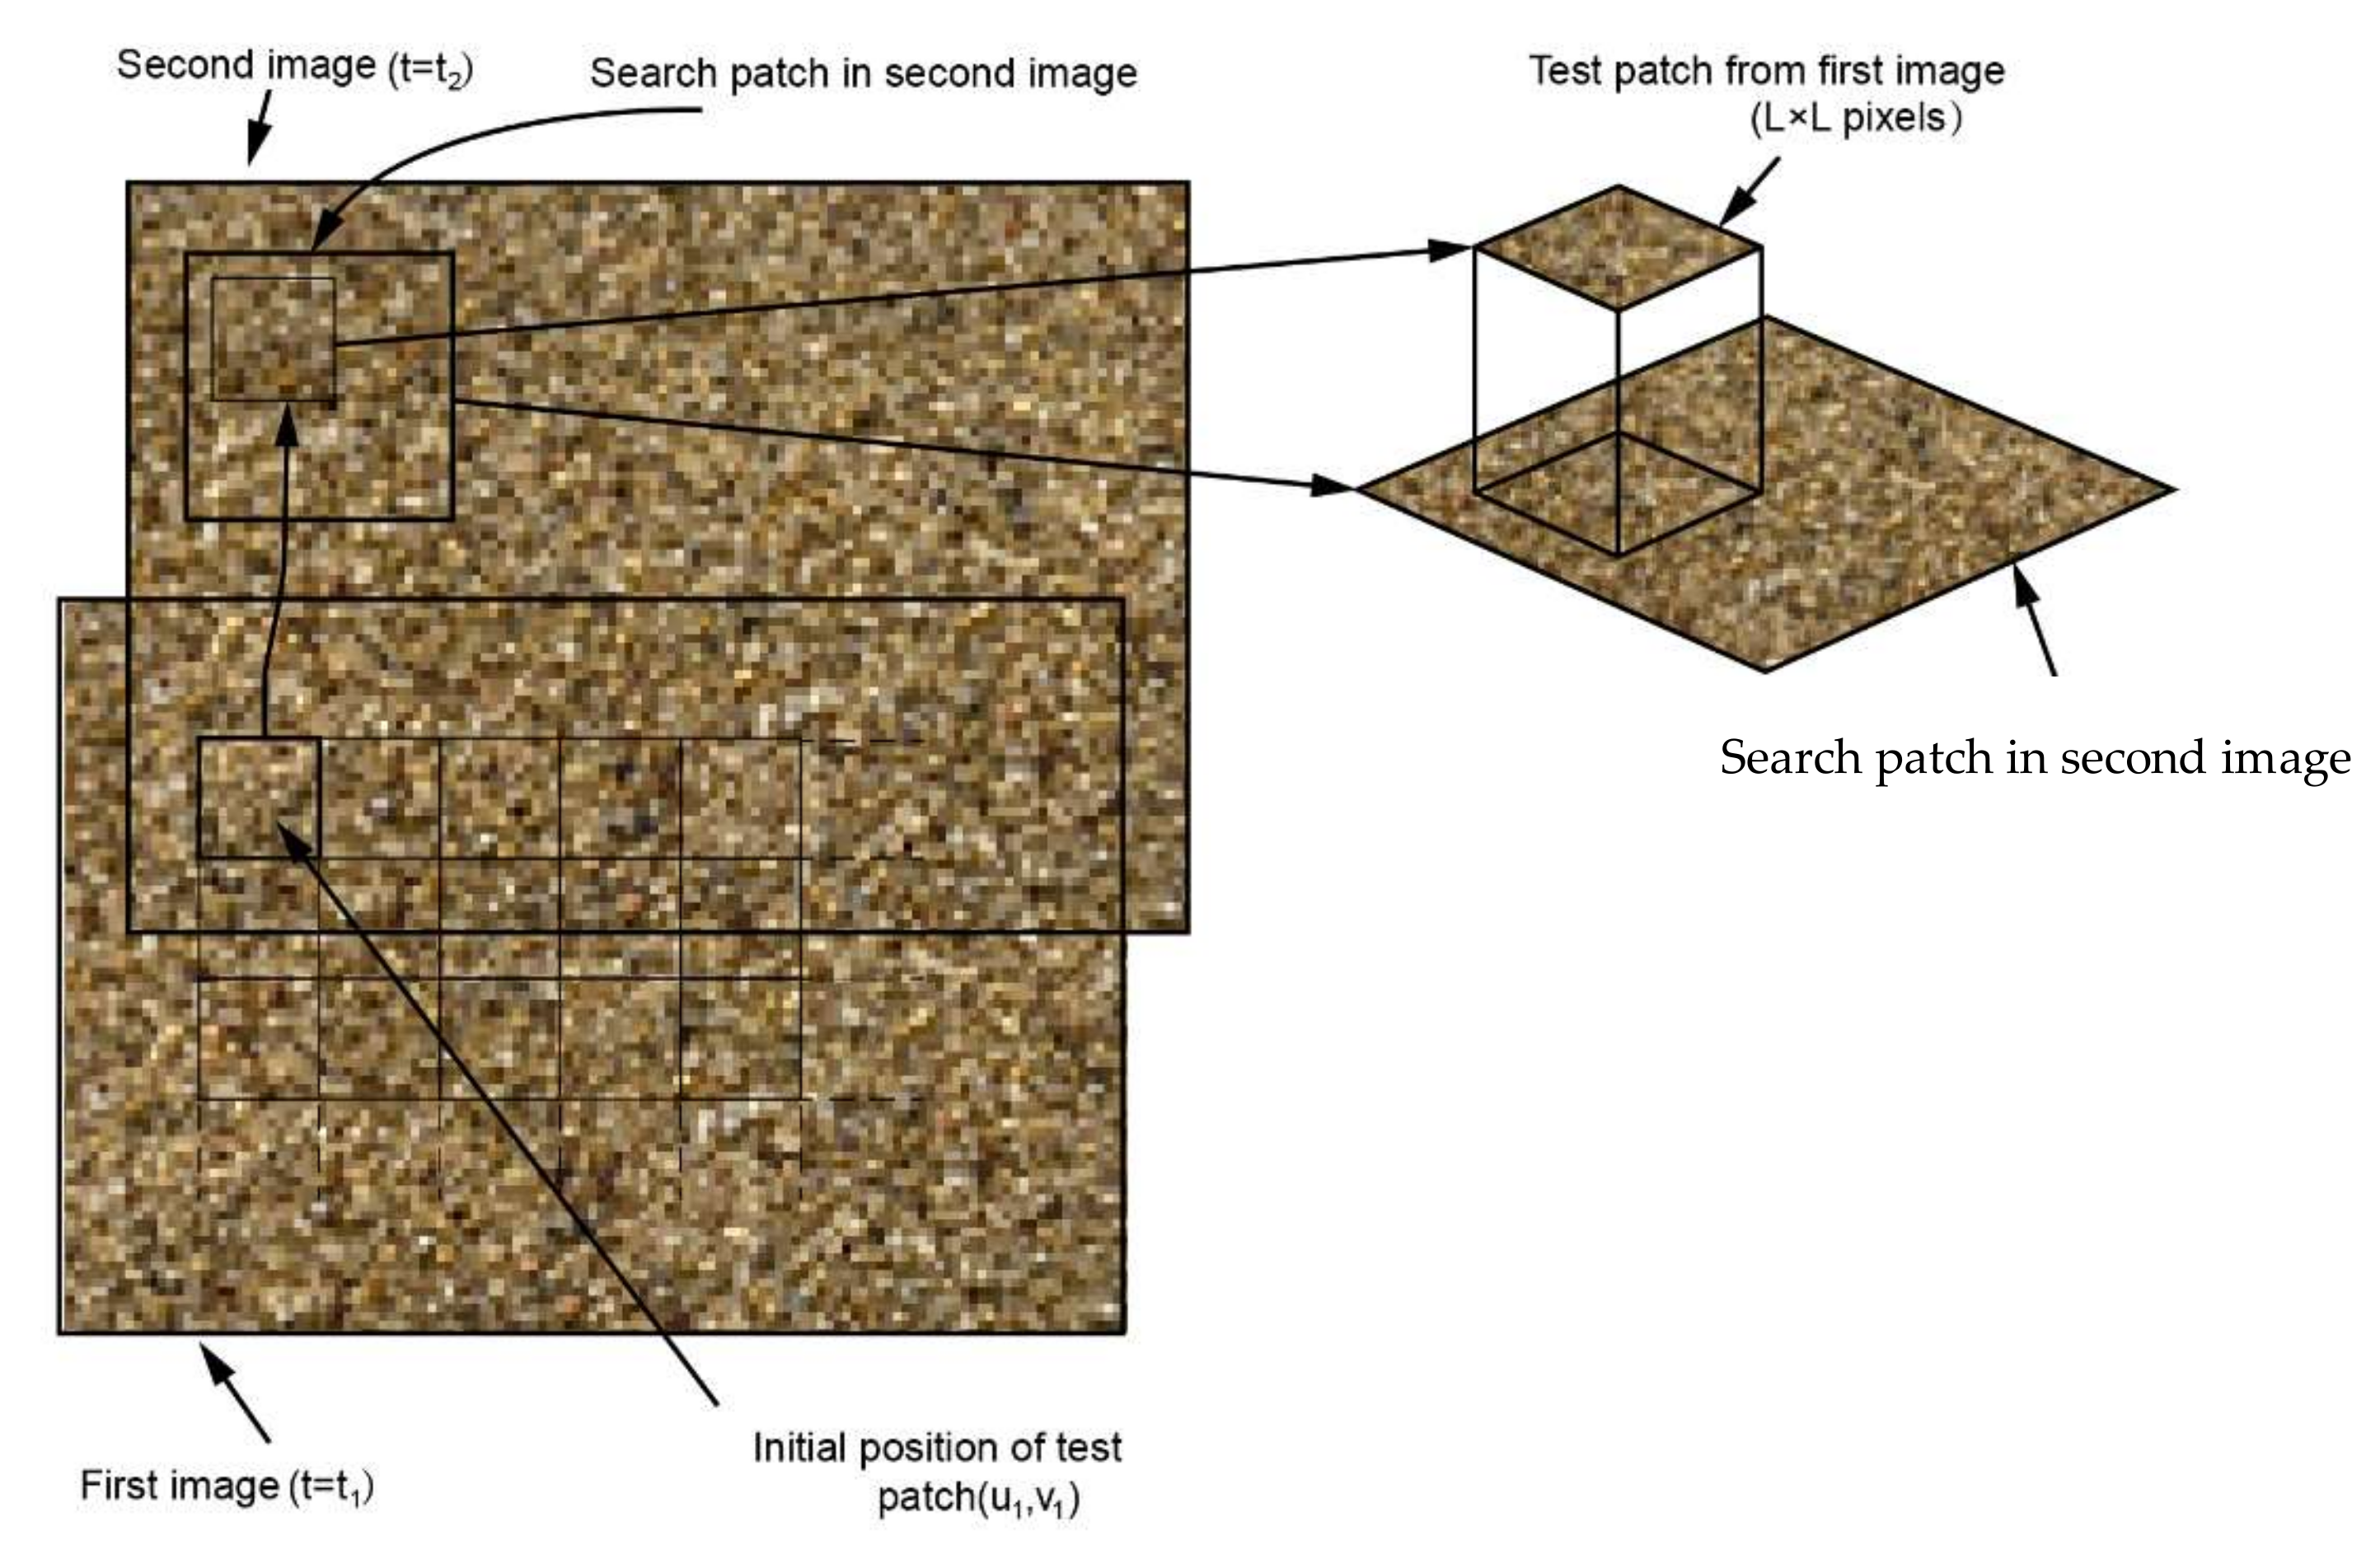
4.5. Application of PIV in Interface Shear Tests
5. Recent Advances in Shear Strength Characterization
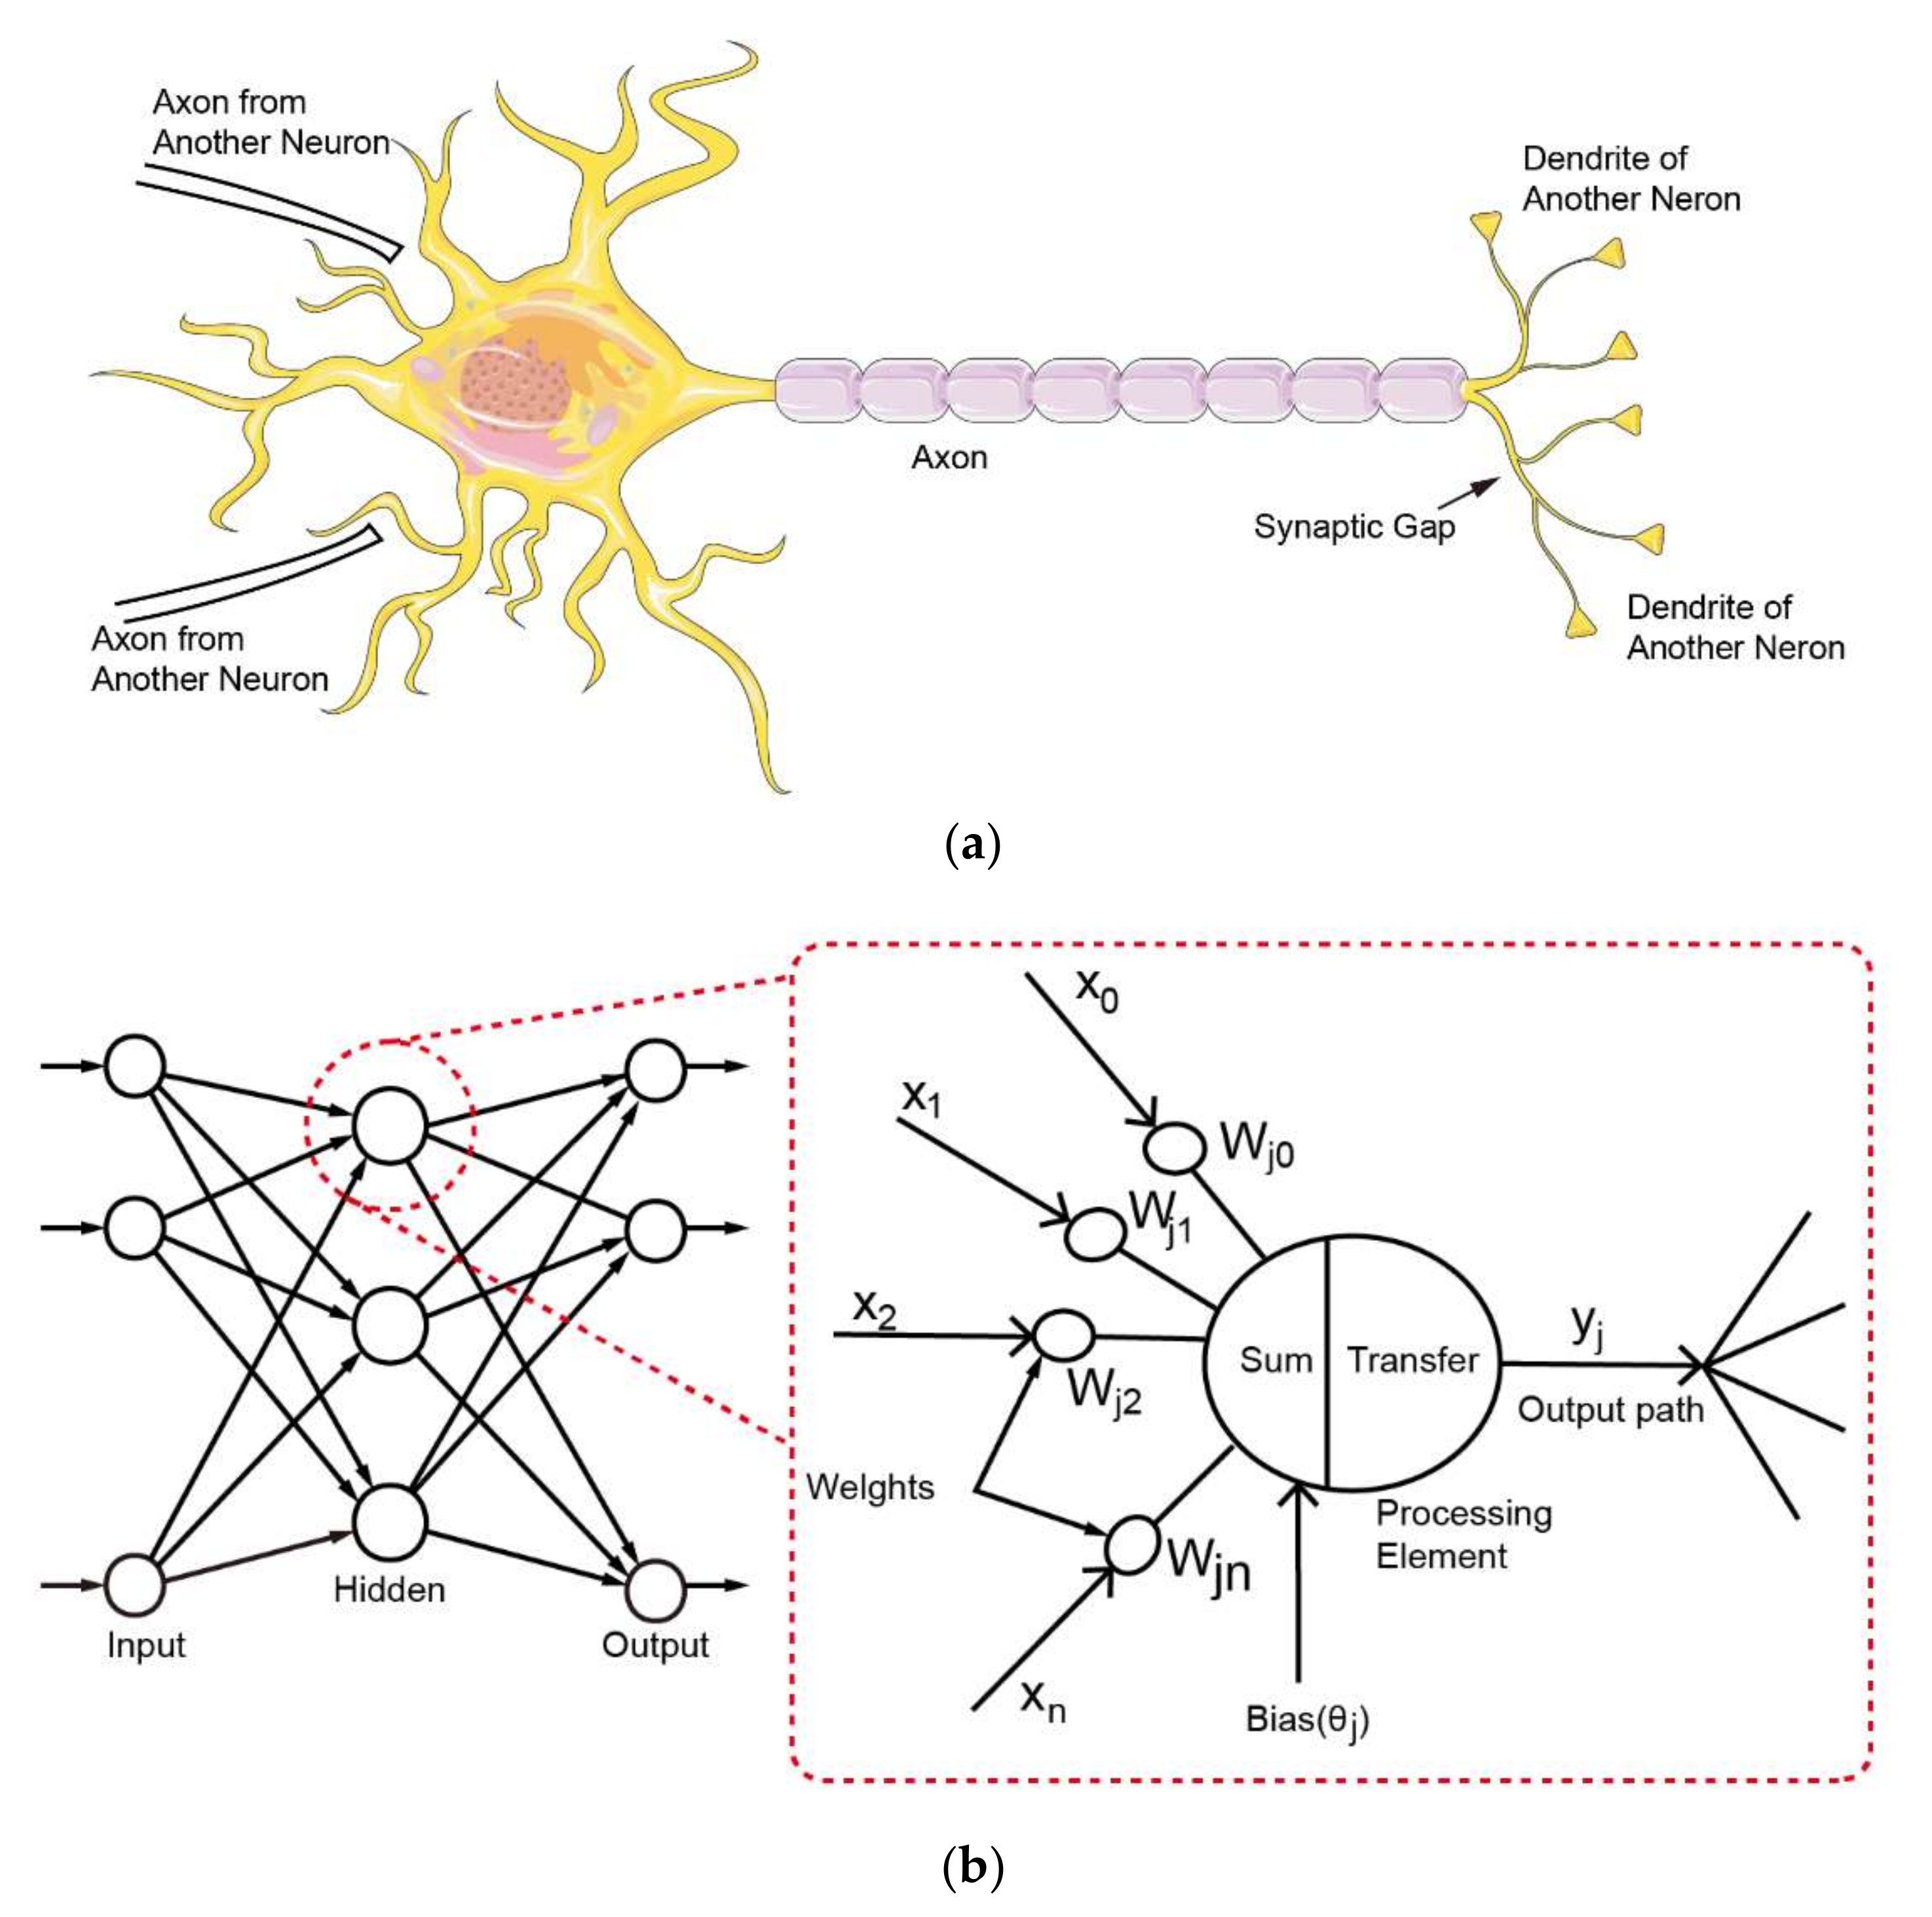
5.1. Neural Network
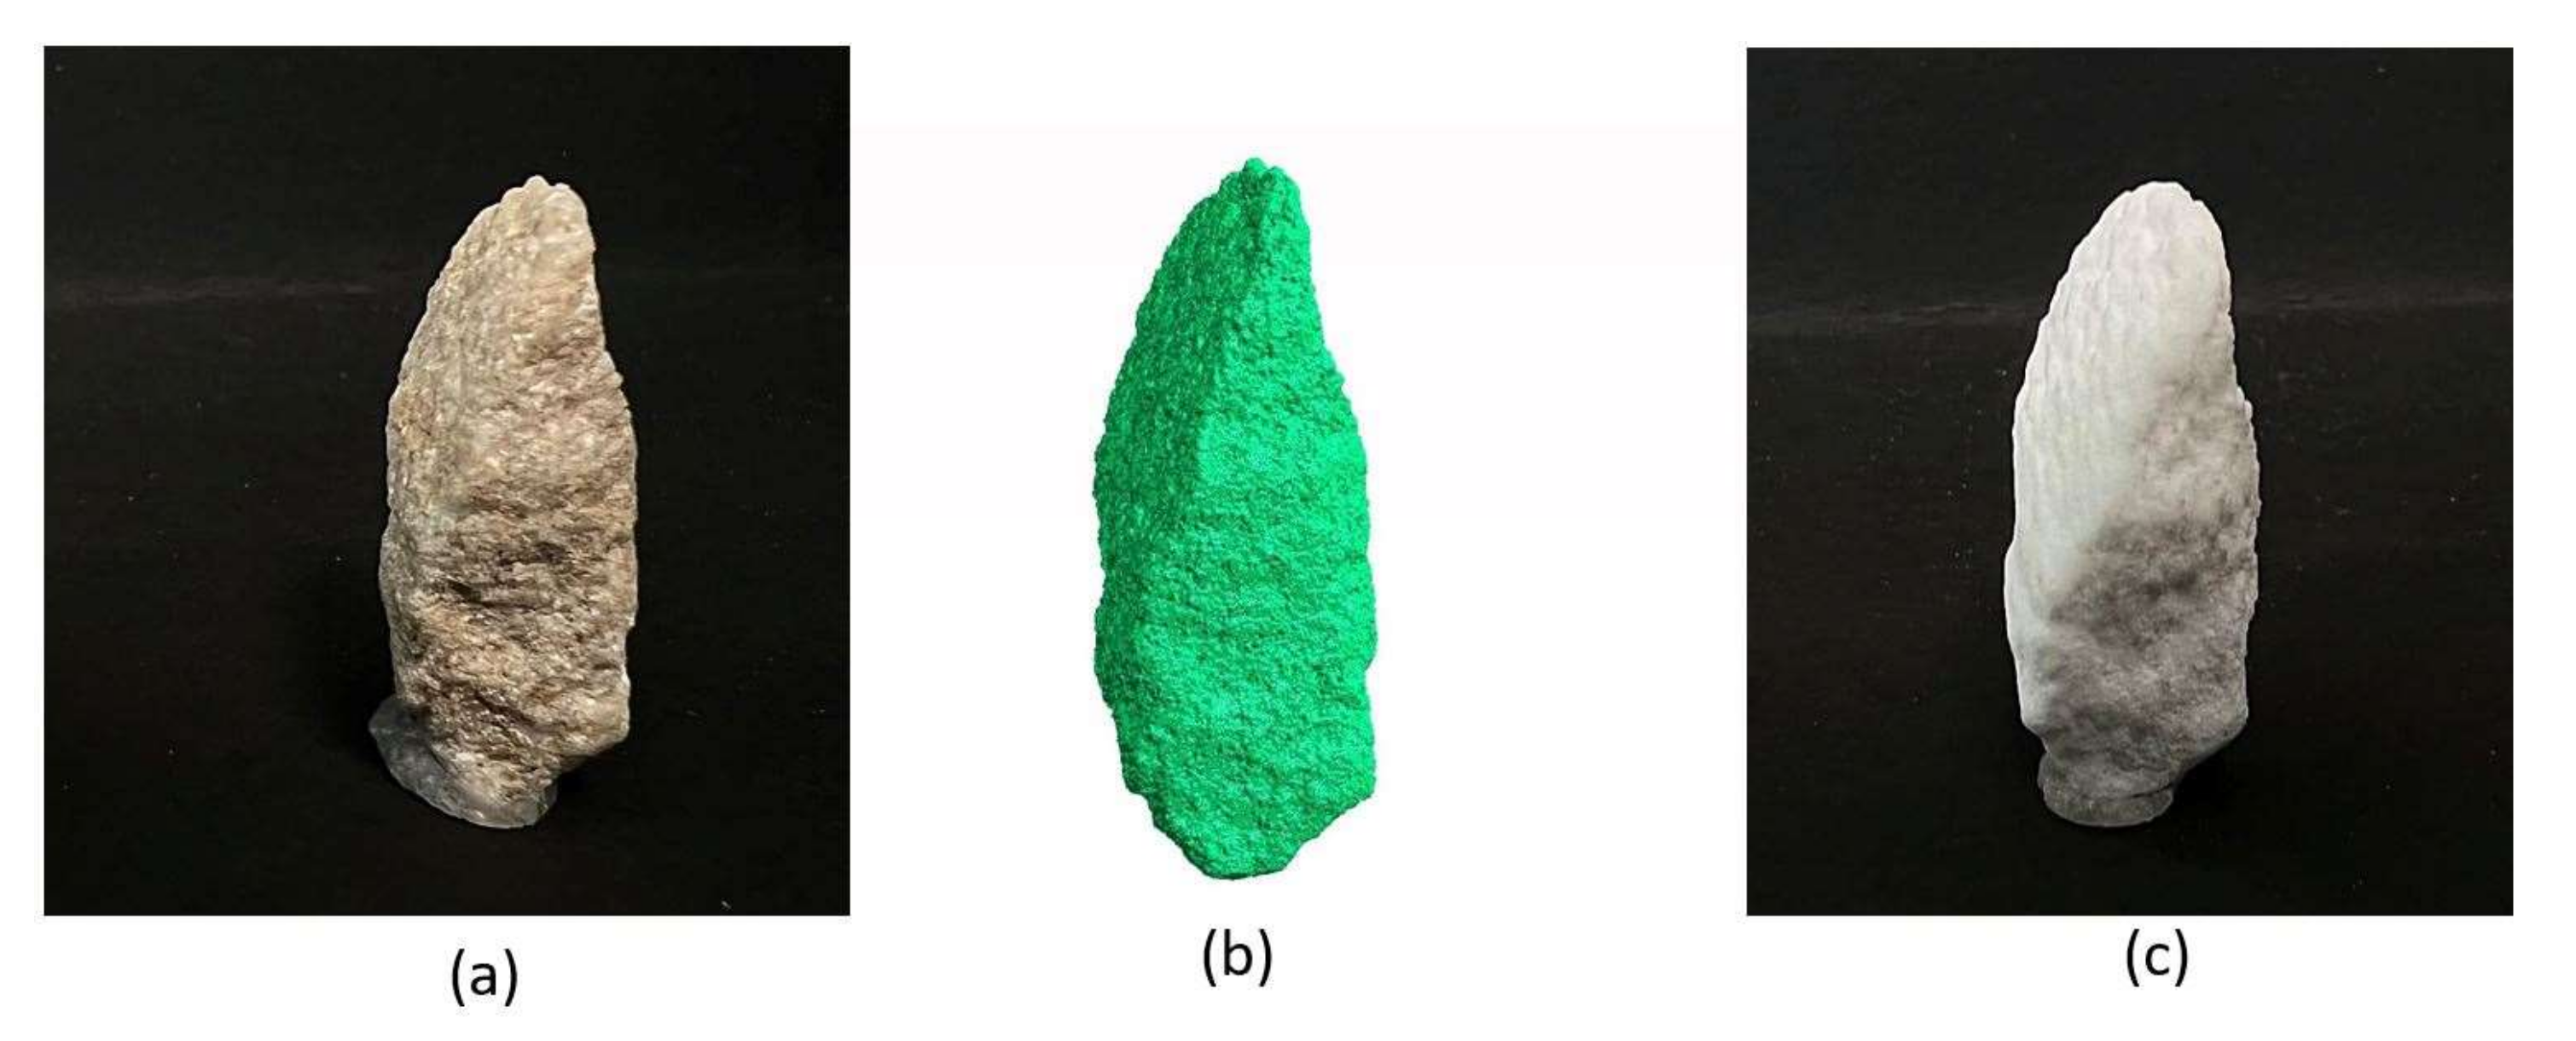
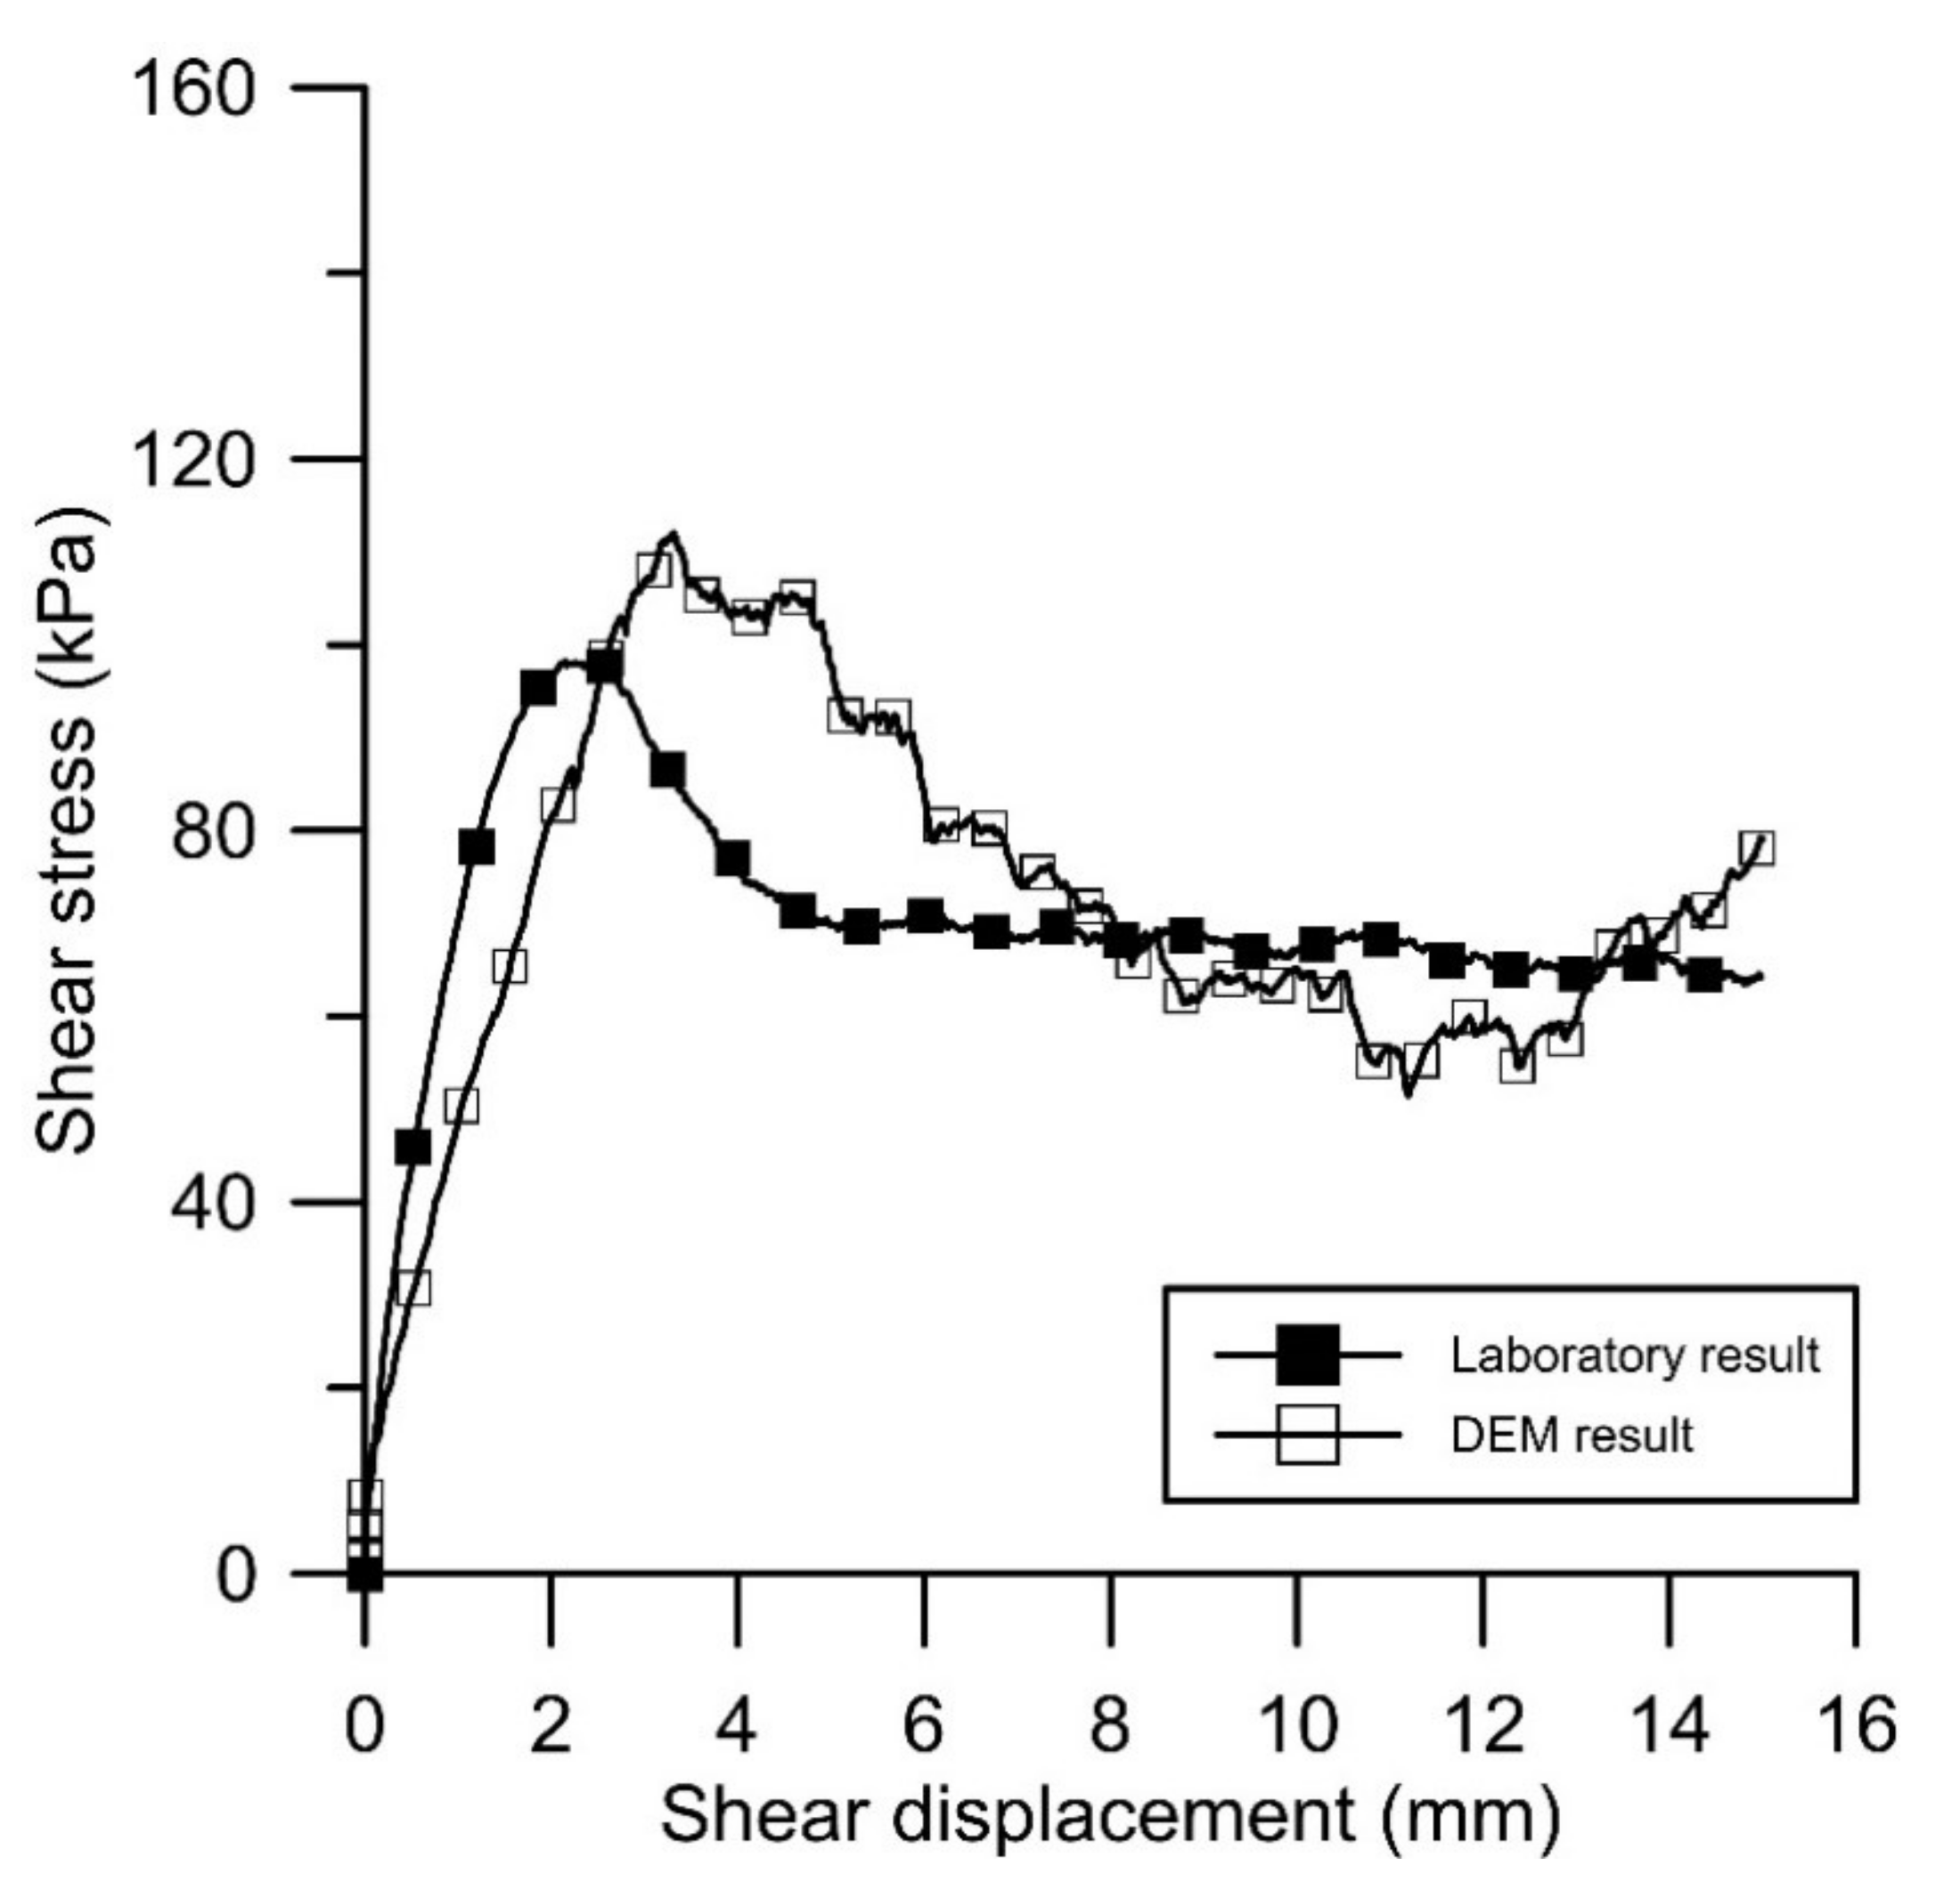
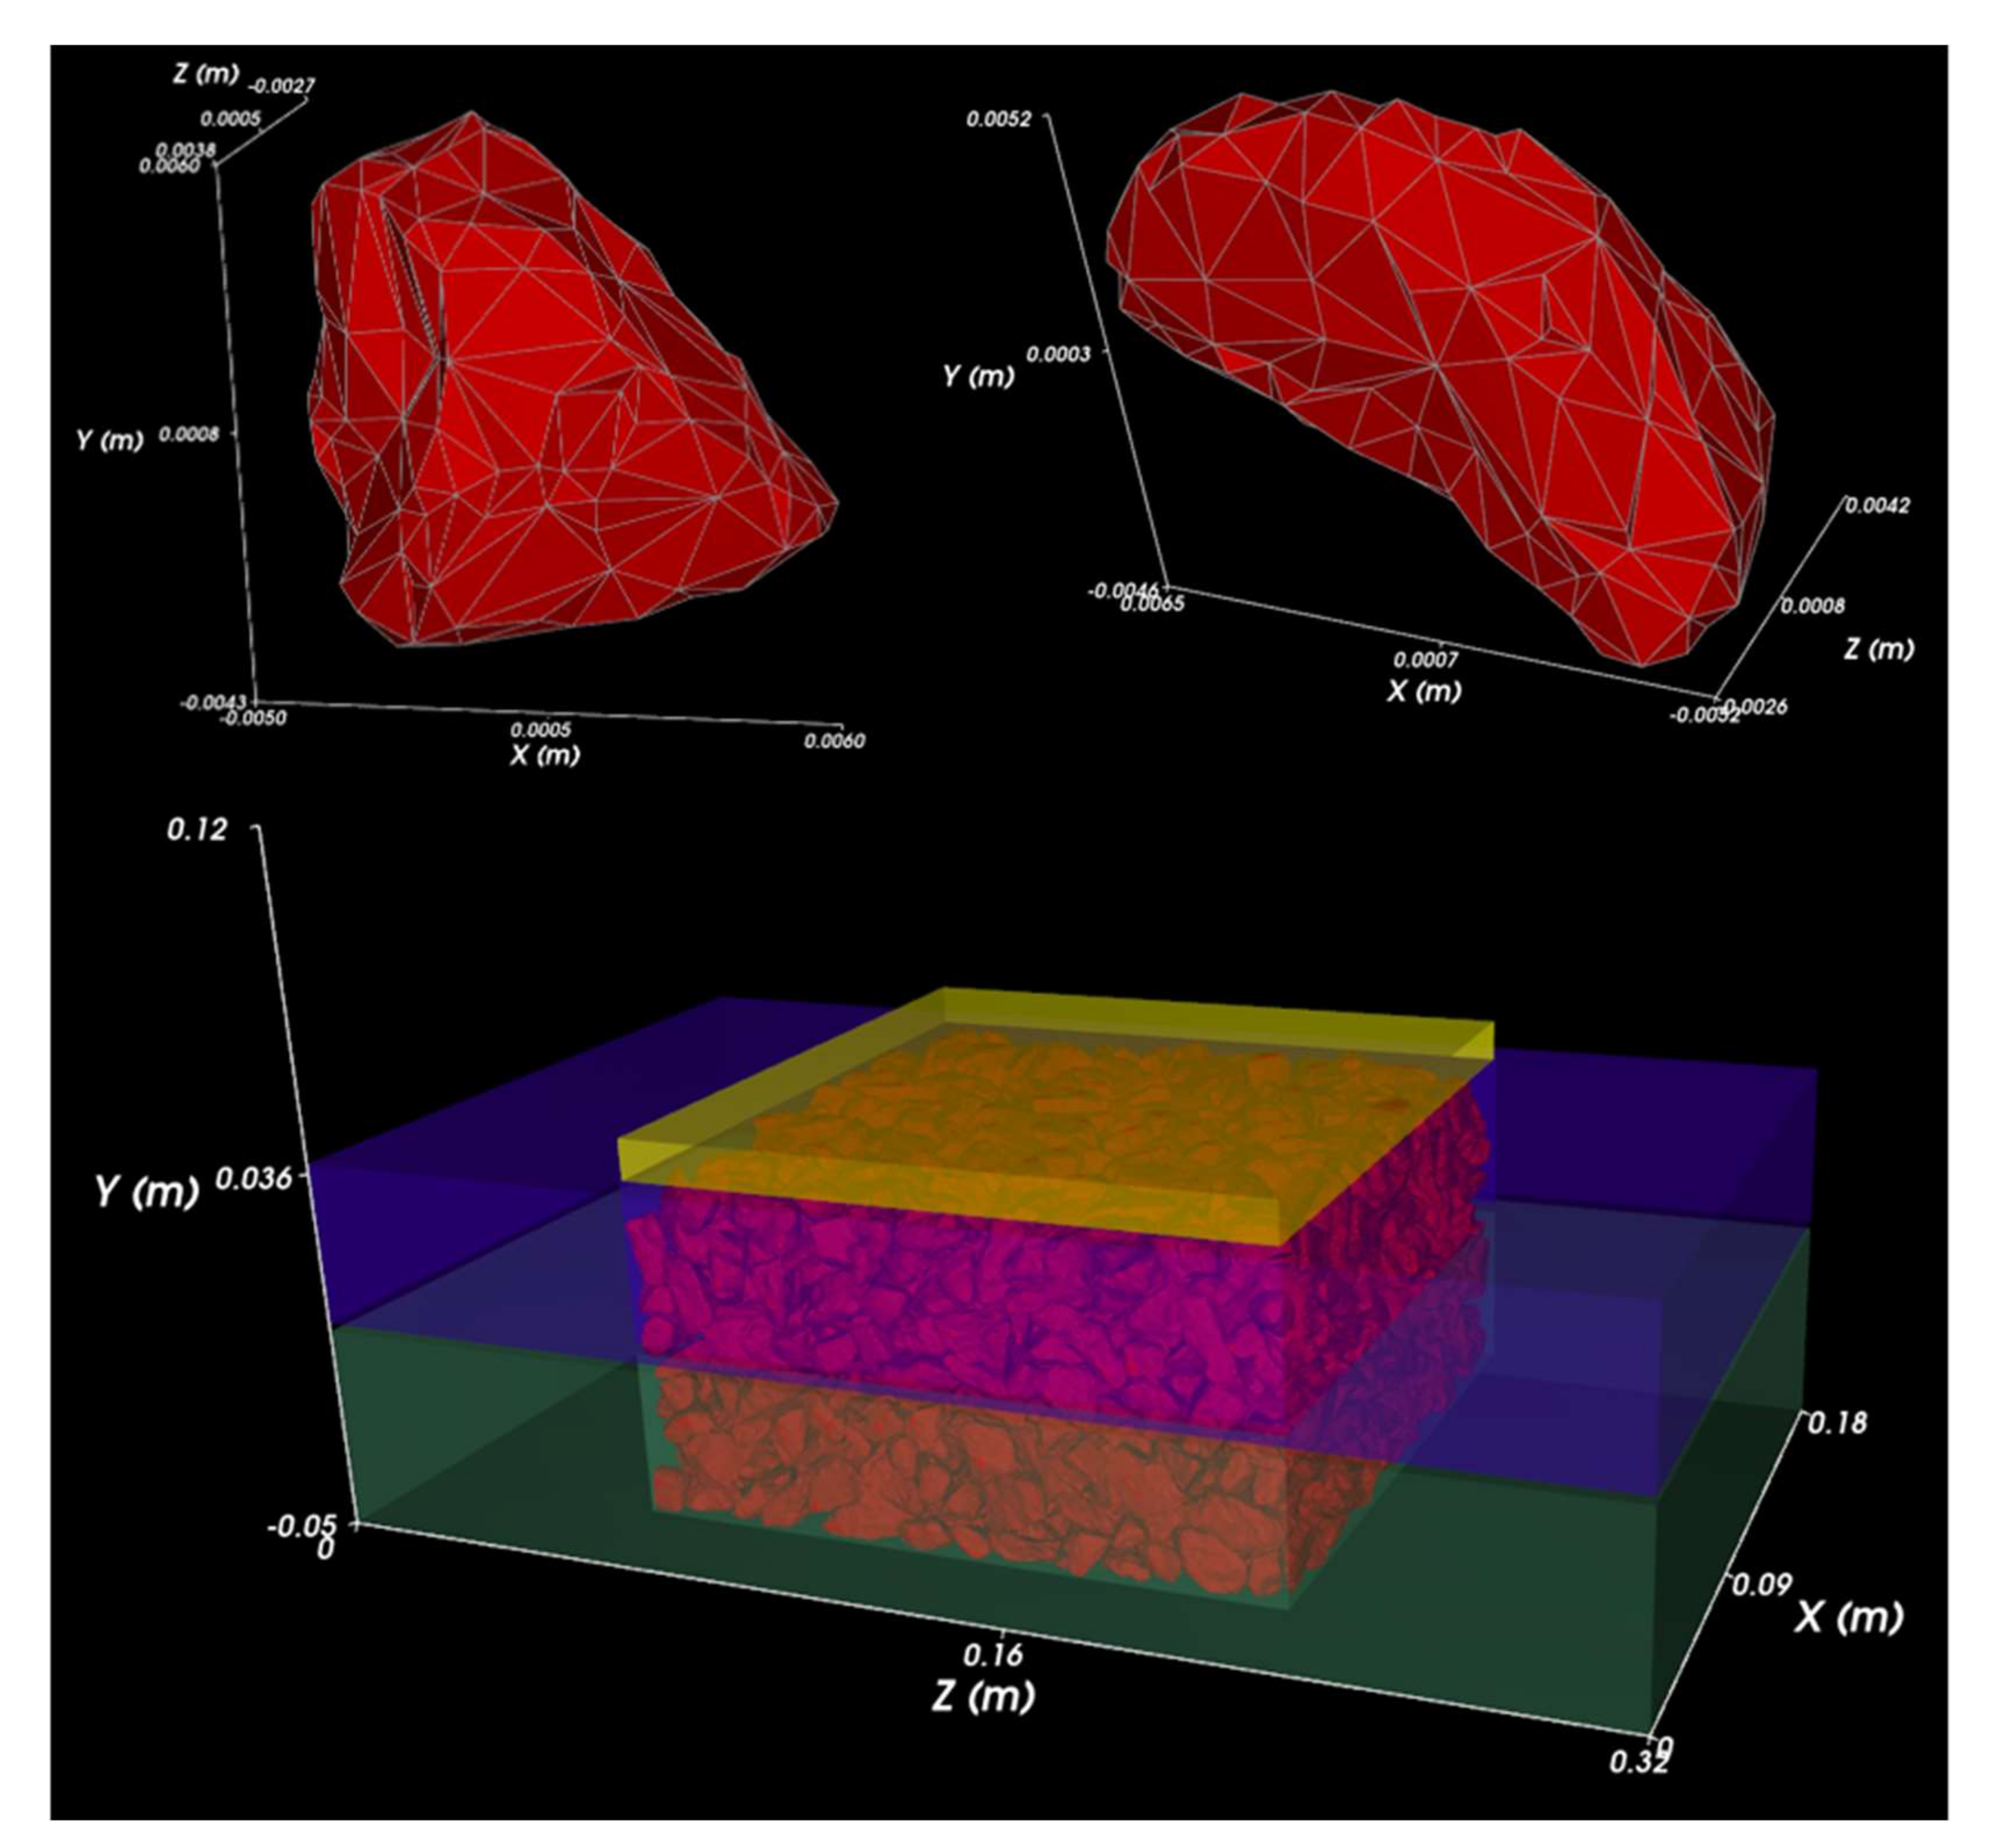
5.2. DEM and 3D Printing
5.3. Bayesian Method
6. Conclusions and Recommendations
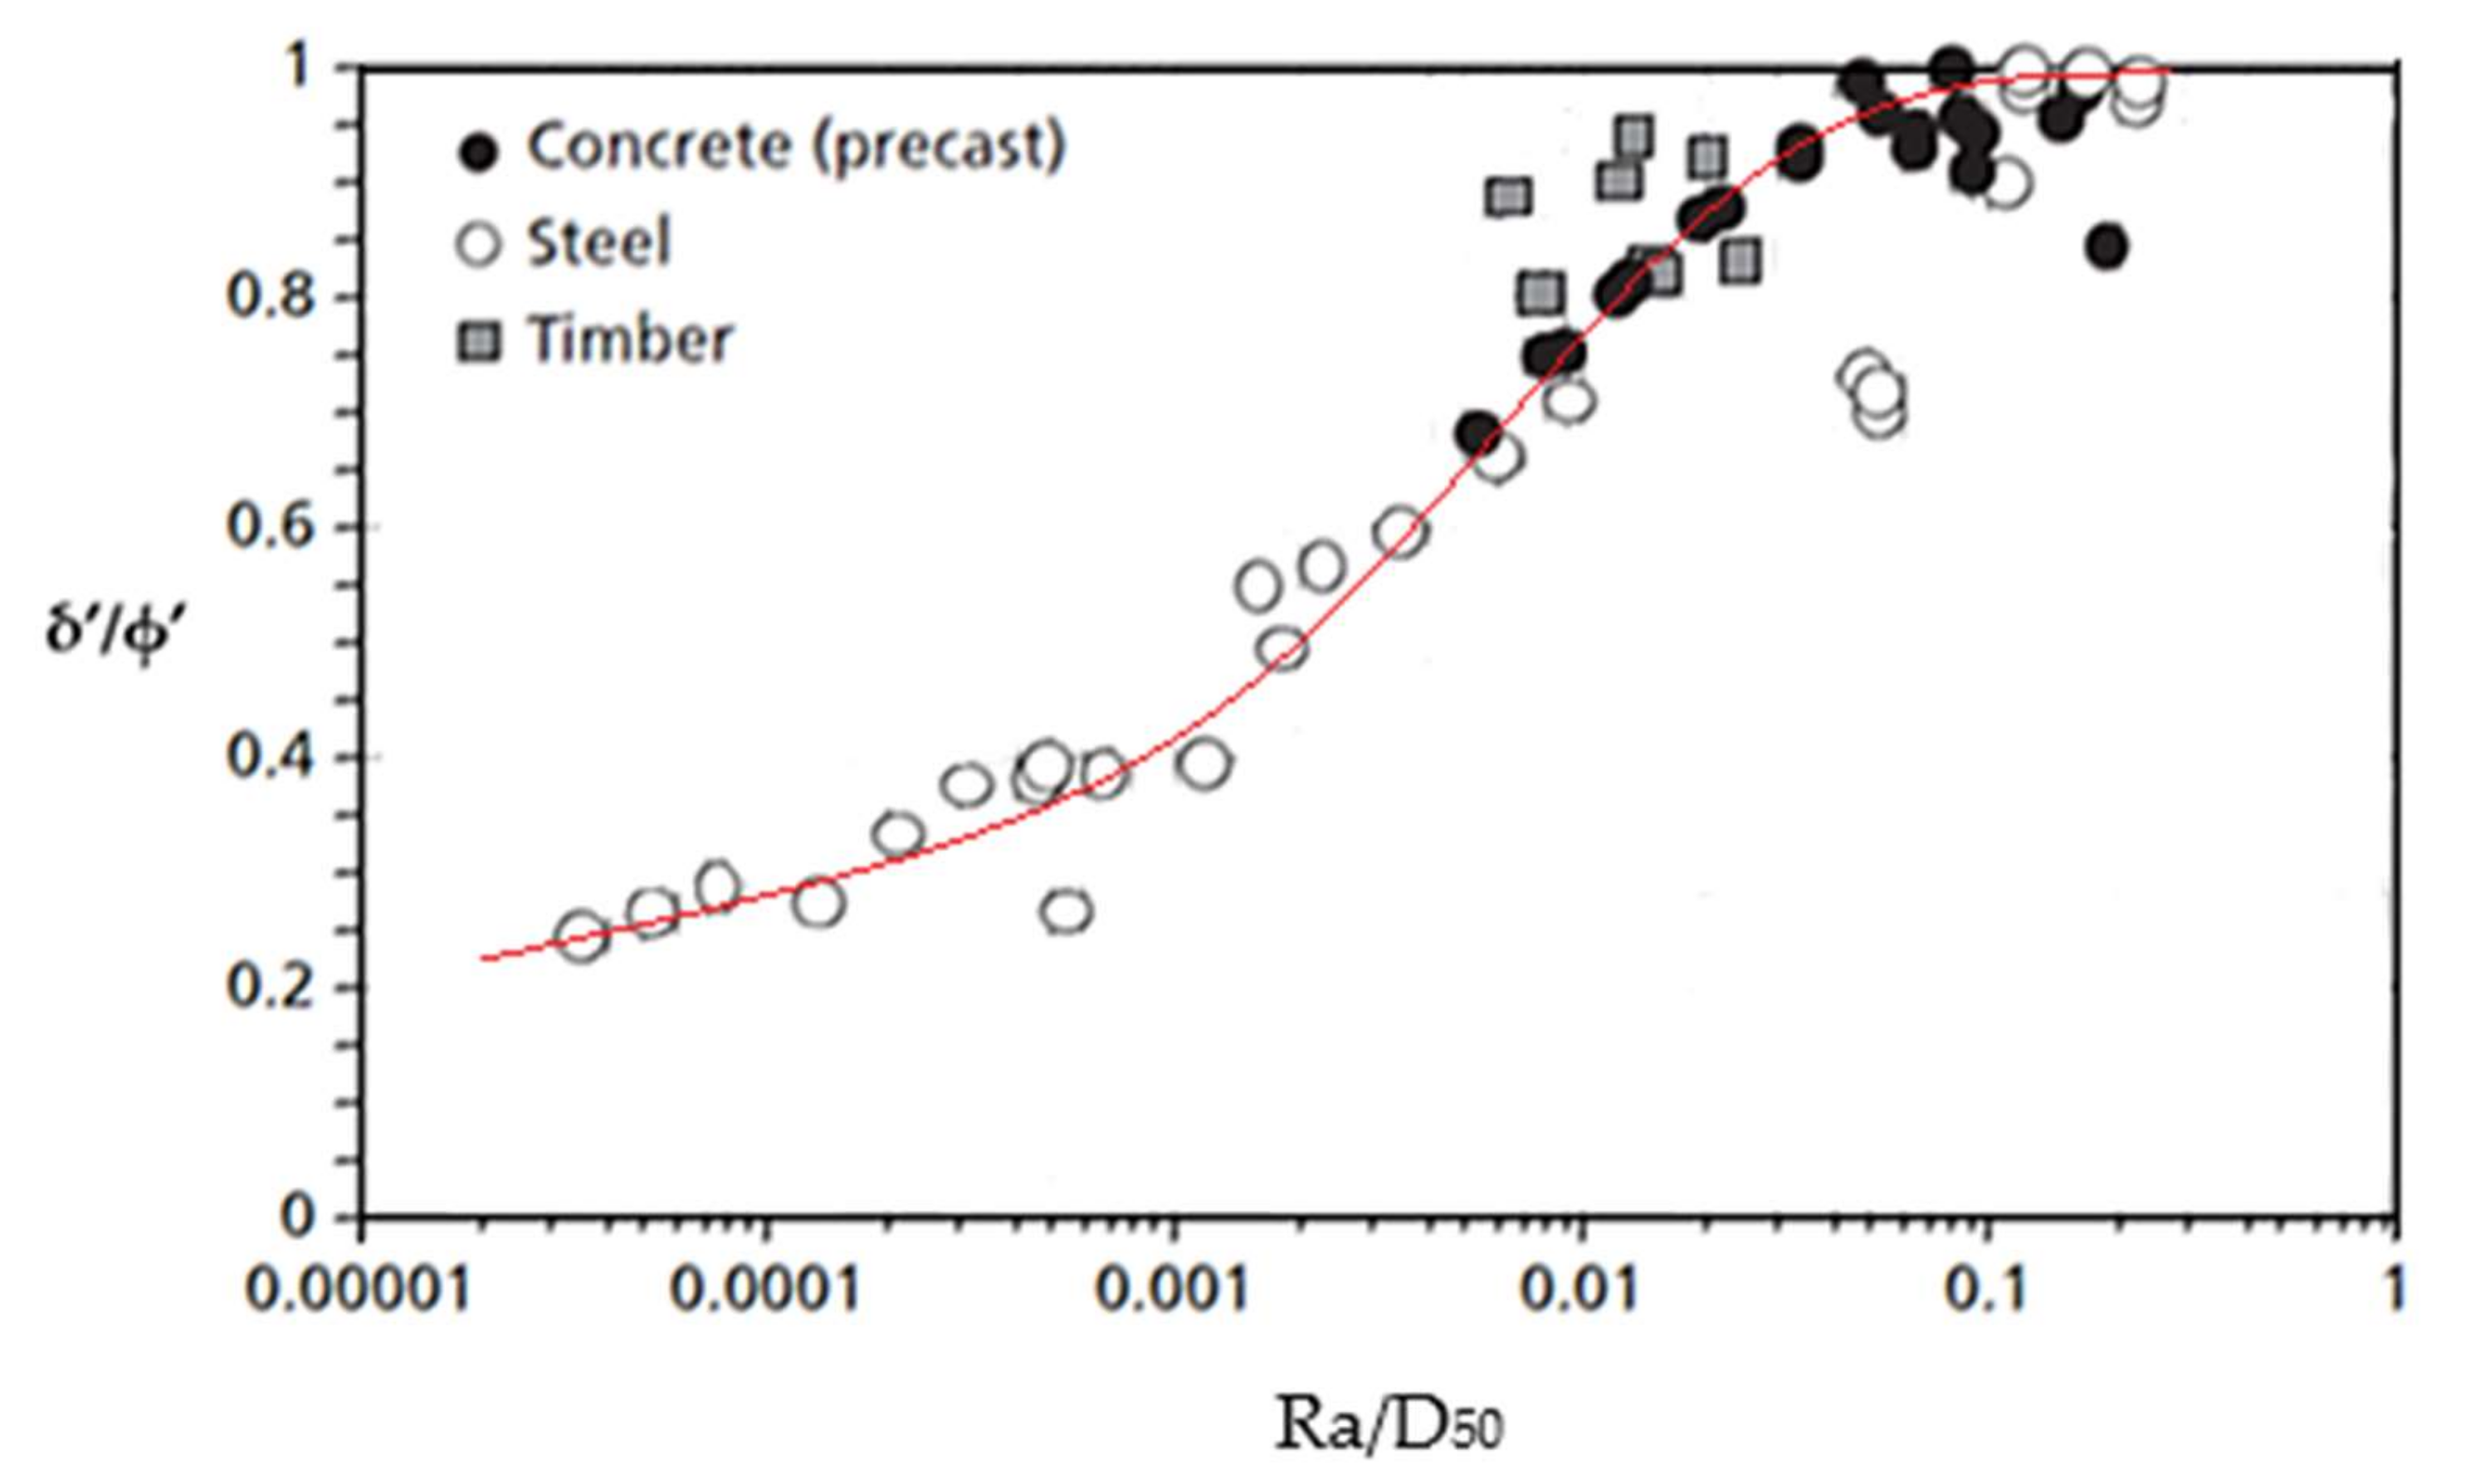
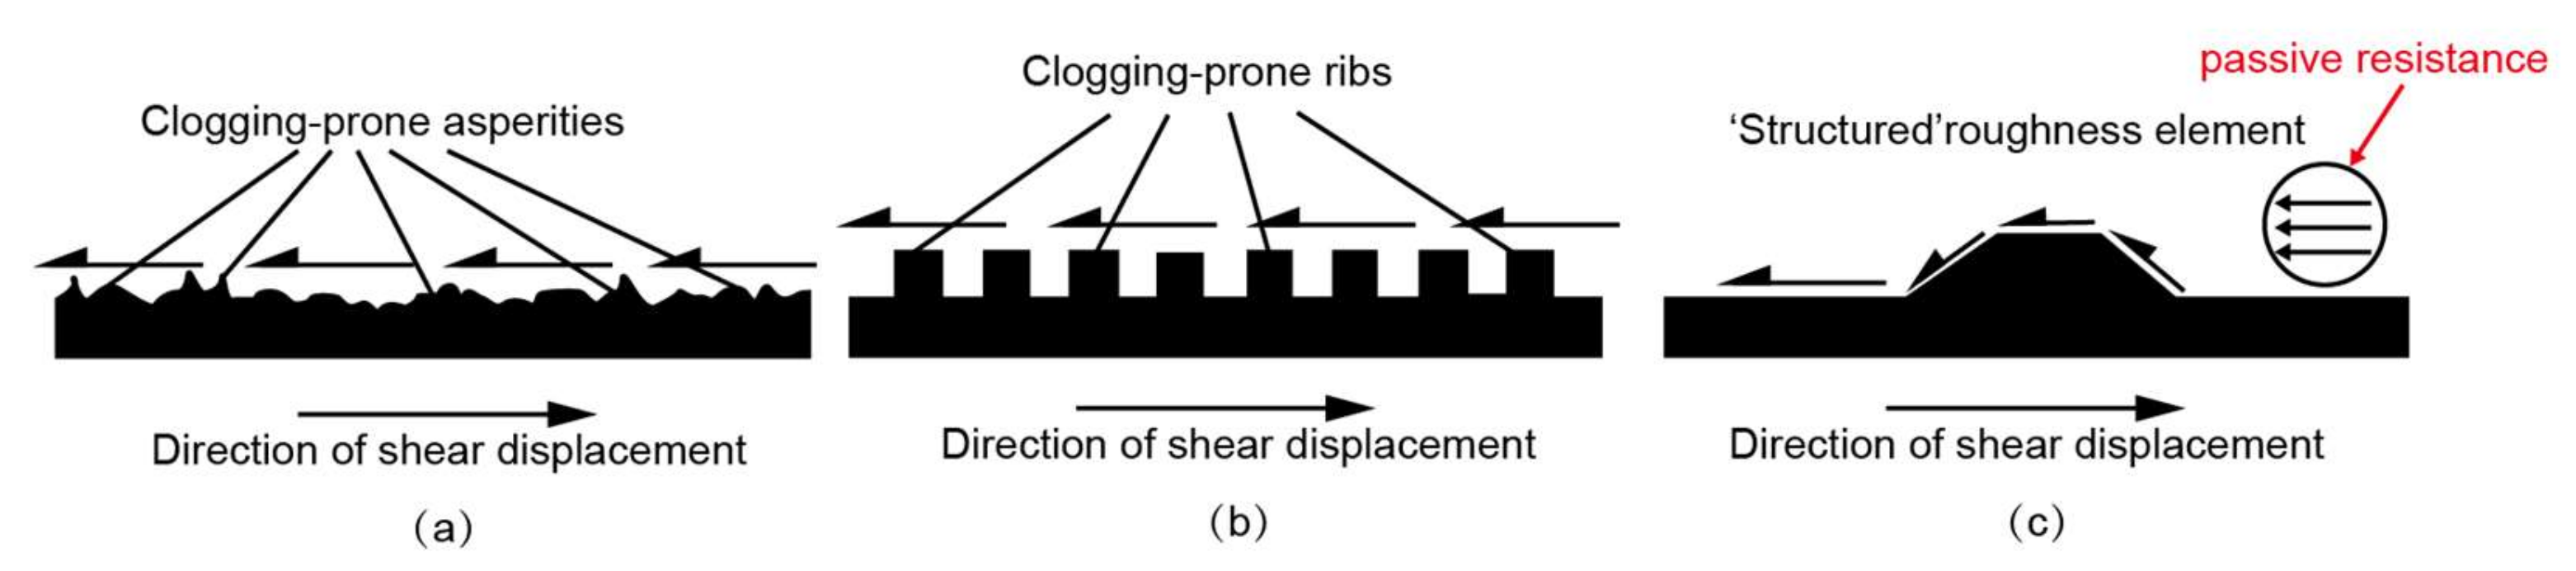
- To parametrically study the interface shear mechanism, portable surface roughness gauges are required to evaluate surface roughness. For random or ribbed surface form, the maximum interface strength equals the soil strength, called “δ = ∅ condition”. For structured surface form, the shear strength of the interface shear test is not only developed by interfacial friction between the sand particle and structure surface as “δ = ∅ condition”, but additional passive resistance generated. Thus, the maximum interface strength is greater than the soil strength, called “δ > ∅ condition”.
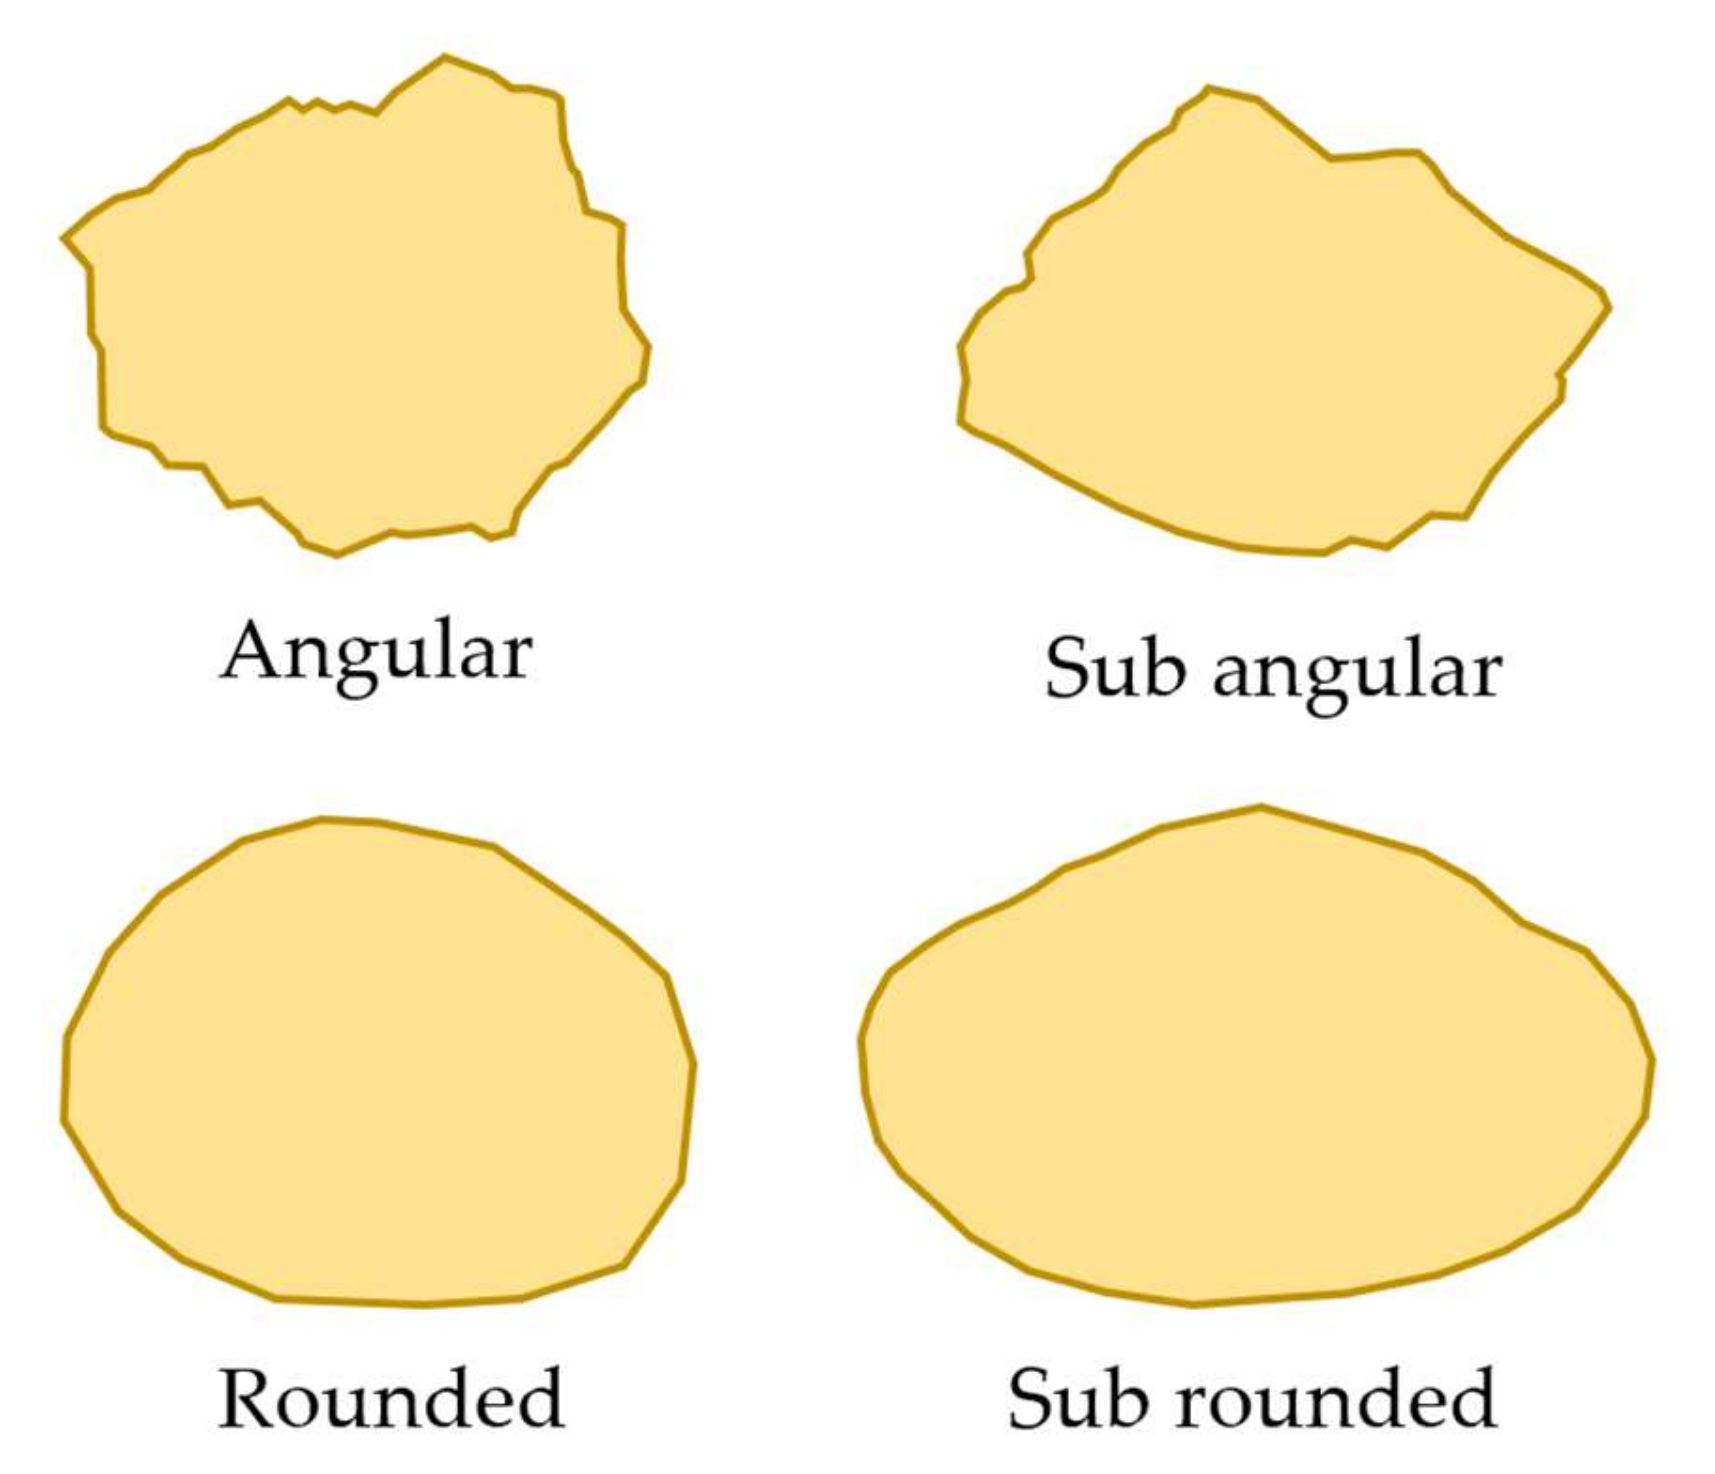
- Particle angularity influences the friction development and mobilization of loads between soil–material interfaces. The increment in particle angularity leads to a more significant particle interlocking and higher peak shear strength.
- Mean particle size influences the interface shear mechanism corresponding to surface roughness and material texture.
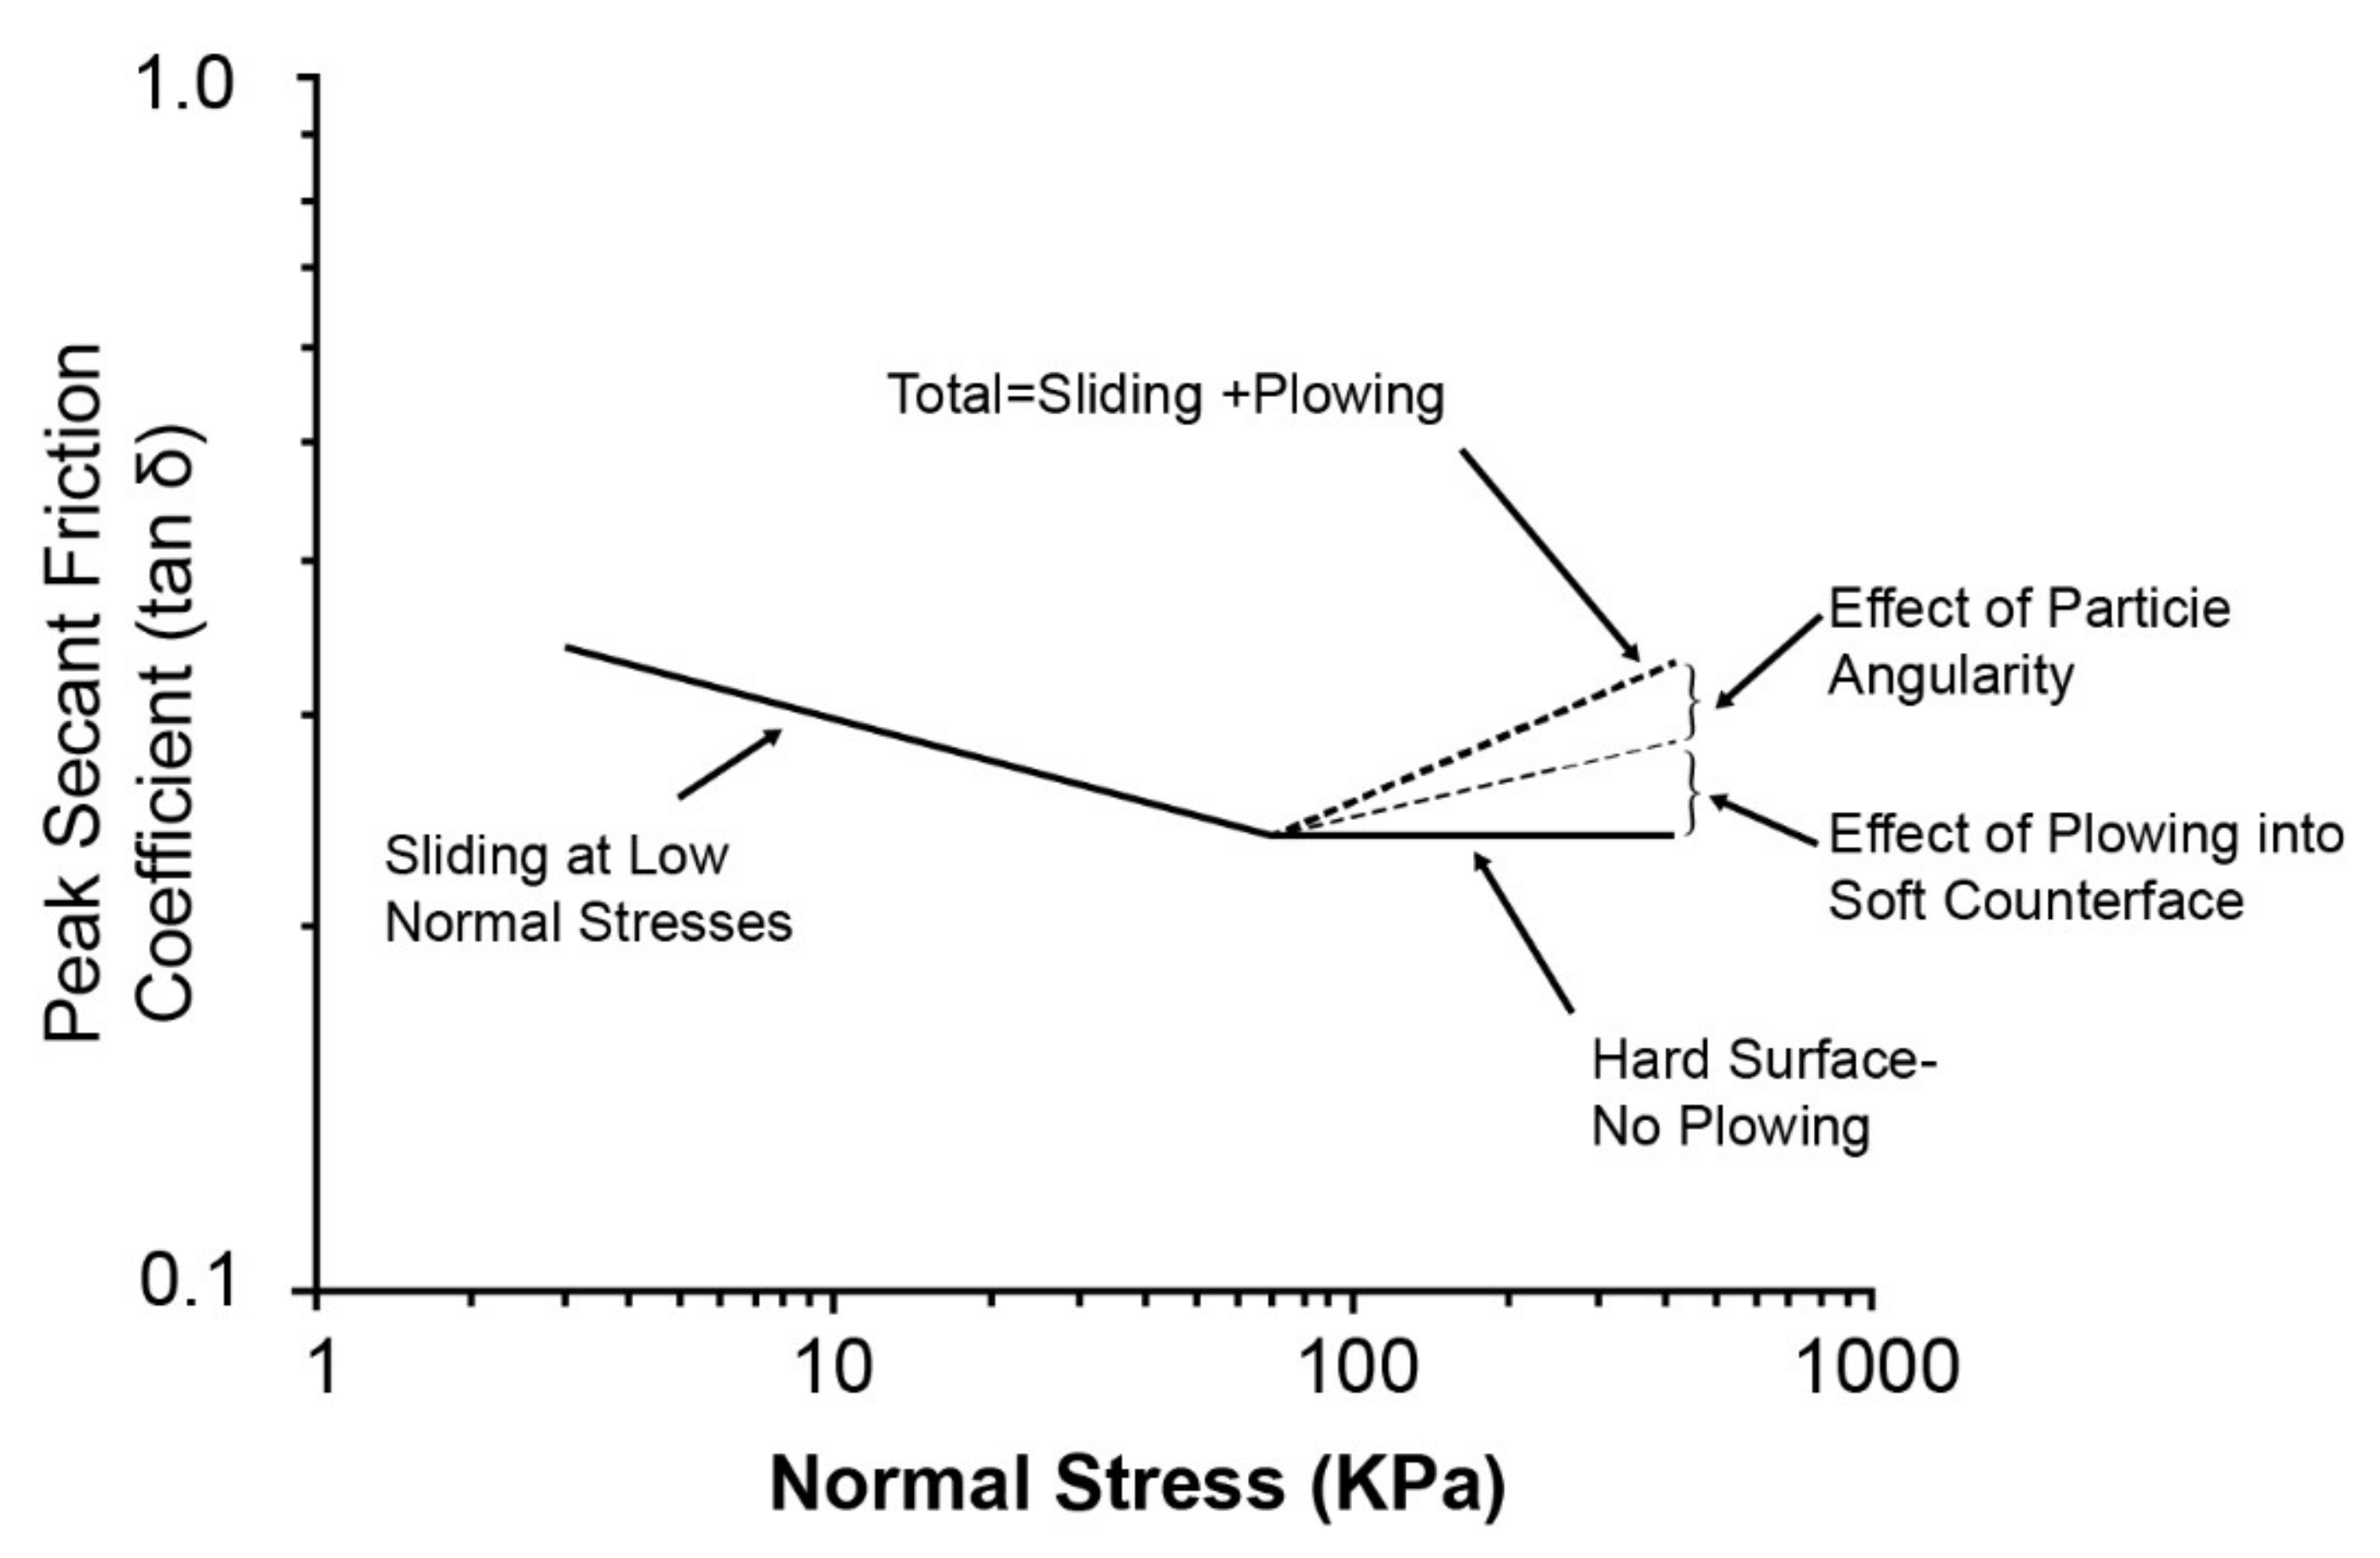
- Surface hardness affects plowing behavior on the soil–material interface. The effective shear stress of the particle decreases until the contact area reaches the specific value. Once the normal stress reaches the limit state, an additional increment in normal stress causes particle movement and particle plowing, leading to shear stress increasing.
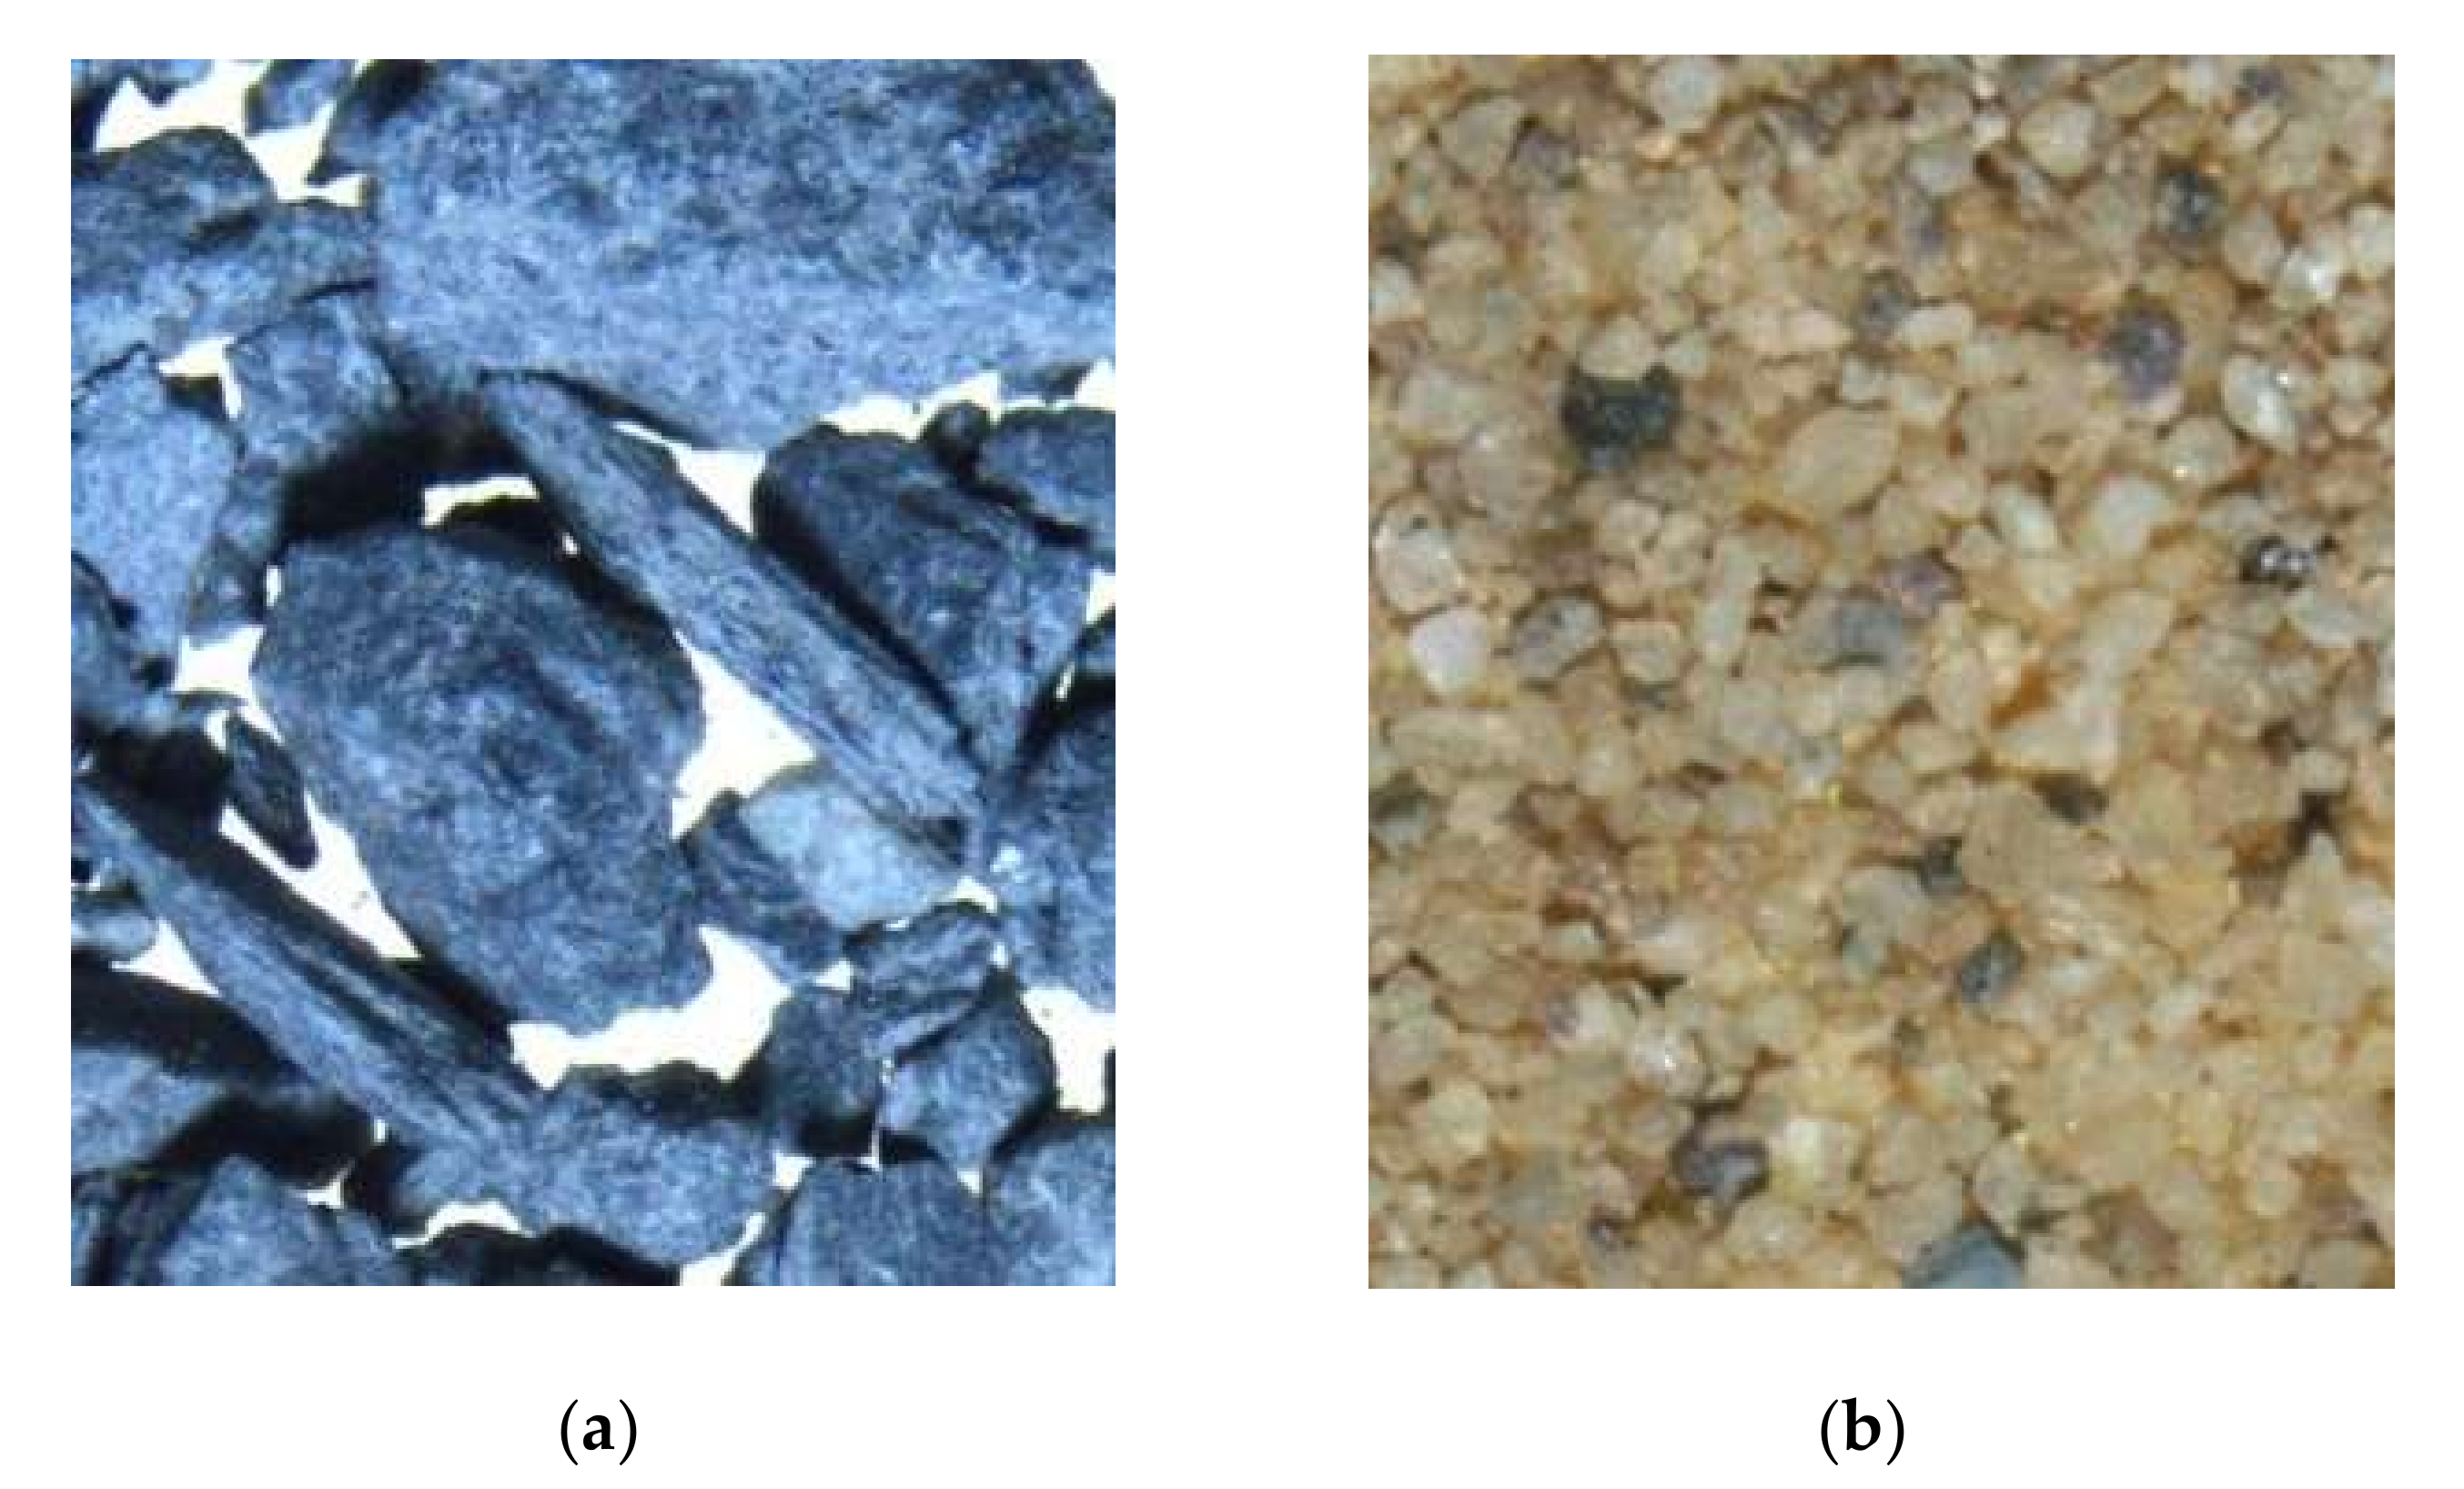
- The higher void ratios and poorer mineralogy of the particles resulted in anticipated particle breakages, significantly reducing the beneficial particle interlocking phenomena. Consequently, using flaky metagraywacke and shale particles as examples, a lack of interlocking activity results in decreased apparent cohesion, and thus a lower opportunity for strength development.
- The shearing boundaries (or limits) for soil specimens placed in the shear box vary with different shear apparatus set up. Moreover, the higher the normal stress, the more significant the particle interlocking and shear strength values would be. Thus, the selection of shear apparatus and normal stress range should match the real-life site conditions.
- Artificial neural network has the potential to establish a nonlinear relationship to investigate the mutual coupling effect of surface roughness and other factors on the interface shear mechanism.
- Rather than the spherical model that is frequently used in DEM, a micro-CT-scanned 3D model of the actual particle morphologies can be employed to enhance the simulation quality.
- In the calibration of interface shear tests, 3D printing of synthetic particles is recommended to validate the DEM results.
- Bayesian method considers soil and interface parameters as random variables and provides probabilistic estimates to reasonably quantify the parameter uncertainties and may be used in interface shear studies to develop a greater understanding in the study of soil–structure interactions.
Author Contributions
Funding
Institutional Review Board Statement
Informed Consent Statement
Data Availability Statement
Conflicts of Interest
References
- Leong, H.Y.; Ong, D.E.L.; Sanjayan, J.G.; Nazari, A. A genetic programming predictive model for parametric study of factors affecting strength of geopolymers. RSC Adv. 2015, 5, 85630–85639. [Google Scholar] [CrossRef]
- Leong, H.Y.; Ong, D.E.L.; Sanjayan, J.; Nazari, A. The effect of different Na2O and K2O ratios of alkali activator on compressive strength of fly ash based-geopolymer. Constr. Build. Mater. 2016, 106, 500–511. [Google Scholar] [CrossRef]
- Leong, H.Y.; Ong, D.E.L.; Sanjayan, J.; Nazari, A. Suitability of Sarawak and Gladstone fly ash to produce geopolymers: A physical, chemical, mechanical, mineralogical and microstructural analysis. Ceram. Int. 2016, 42, 9613–9620. [Google Scholar] [CrossRef]
- Ngu, L.; Song, J.W.; Hashim, S.S.; Ong, D.E. Lab-scale atmospheric CO2 absorption for calcium carbonate precipitation in sand. Greenh. Gases Sci. Technol. 2019, 9, 519–528. [Google Scholar] [CrossRef]
- Mehdizadeh, A.; Disfani, M.M.; Evans, R.; Arulrajah, A.; Ong, D.E.L. Discussion of “Development of an Internal Camera-Based Volume Determination System for Triaxial Testing” by S.E. Salazar, A. Barnes and R.A. Coffman. Geotech. Test. J. 2015, 38; reprinted in Geotech. Test. J. 2016, 39, 165–168. [Google Scholar] [CrossRef]
- Mehdizadeh, A.; Disfani, M.M.; Evans, R.; Arulrajah, A.; Ong, D.E.L. Mechanical Consequences of Suffusion on Undrained Behaviour of a Gap-Graded Cohesionless Soil—An Experimental Approach. Geotech. Test. J. 2017, 40, 1026–1042. [Google Scholar] [CrossRef]
- Ong, D.E.L. Benchmarking of FEM technique involving deep excavation, pile-soil interaction and embankment construction. In Proceedings of the 12th International Conference of International Association for Computer Methods and Advanced in Geomechanics (IACMAG), Goa, India, 1–6 October 2008. [Google Scholar]
- Ong, D.E.L.; Yang, D.; Phang, S. Comparison of finite element modelling of a deep excavation using SAGECRISP and PLAXIS. In Proceedings of the 2006 International Conference on Deep Excavations, Singapore, 28–30 June 2006; pp. 50–63. [Google Scholar]
- Omoregie, A.; Khoshdelnezamiha, G.; Senian, N.; Ong, D.E.L.; Nissom, P.M. Experimental optimisation of various cultural conditions on urease activity for isolated Sporosarcina pasteurii strains and evaluation of their biocement potentials. Ecol. Eng. 2017, 109, 65–75. [Google Scholar] [CrossRef]
- Omoregie, A.I.; Ngu, L.H.; Ong, D.E.L.; Nissom, P.M. Low-cost cultivation of Sporosarcina pasteurii strain in food-grade yeast extract medium for microbially induced carbonate precipitation (MICP) application. Biocatal. Agric. Biotechnol. 2019, 17, 247–255. [Google Scholar] [CrossRef]
- Omoregie, A.I.; Ong, D.E.L.; Nissom, P.M. Assessing ureolytic bacteria with calcifying abilities isolated from limestone caves for biocalcification. Lett. Appl. Microbiol. 2019, 68, 173–181. [Google Scholar] [CrossRef] [PubMed]
- Omoregie, A.I.; Palombo, E.A.; Ong, D.E.; Nissom, P.M. Biocementation of sand by Sporosarcina pasteurii strain and technical-grade cementation reagents through surface percolation treatment method. Constr. Build. Mater. 2019, 228, 116828. [Google Scholar] [CrossRef]
- Omoregie, A.I.; Palombo, E.A.; Ong, D.E.; Nissom, P.M. A feasible scale-up production of Sporosarcina pasteurii using custom-built stirred tank reactor for in-situ soil biocementation. Biocatal. Agric. Biotechnol. 2020, 24, 101544. [Google Scholar] [CrossRef]
- Omoregie, A.I.; Senian, N.; Li, P.Y.; Hei, N.L.; Leong, D.O.E.; Ginjom, I.R.H.; Nissom, P.M. Ureolytic bacteria isolated from Sarawak limestone caves show high urease enzyme activity comparable to that of Sporosarcina pasteurii (DSM 33). Malays. J. Microbiol. 2016, 12, 463–470. [Google Scholar]
- Leong, H.Y.; Ong, D.E.L.; Sanjayan, J.G.; Nazari, A. Strength Development of Soil–Fly Ash Geopolymer: Assessment of Soil, Fly Ash, Alkali Activators, and Water. J. Mater. Civ. Eng. 2018, 30, 04018171. [Google Scholar] [CrossRef]
- Leong, H.Y.; Ong, D.E.L.; Sanjayan, J.G.; Nazari, A.; Kueh, S.M. Effects of Significant Variables on Compressive Strength of Soil-Fly Ash Geopolymer: Variable Analytical Approach Based on Neural Networks and Genetic Programming. J. Mater. Civ. Eng. 2018, 30, 04018129. [Google Scholar] [CrossRef]
- Liu, Y.; Liu, Z.; Oh, E.; Ong, D. Strength and Microstructural Assessment of Reconstituted and Stabilised Soft Soils with Varying Silt Contents. Geosciences 2021, 11, 302. [Google Scholar] [CrossRef]
- Chong, E.; Ong, D. Data-Driven Field Observational Method of a Contiguous Bored Pile Wall System Affected by Accidental Groundwater Drawdown. Geosciences 2020, 10, 268. [Google Scholar] [CrossRef]
- Ong, D.E.L.; Choo, C. 2011, Sustainable construction of a bored pile foundation system in erratic phyllite. In Proceedings of the 2011 ASEAN-Australian Engineering Congress, Kuching, Malaysia, 25–27 July 2011; pp. 50–65. [Google Scholar]
- Ong, D.E.L.; Leung, C.; Chow, Y. Piles subject to excavation-induced soil movement in clay. In Proceedings of the 13th European Conference on Soil Mechanics and Geotechnical Engineering, Prague, Czech Republic, 25–28 August 2003; pp. 777–782. [Google Scholar]
- Ong, D.E.L.; Leung, C.; Chow, Y. Time-dependent Pile Behavior due to Excavation-Induced Soil Movement in Clay. In Proceedings of the 12th Pan-American Conference on Soil Mechanics and Geotechnical Engineering, Cambridge, MA, USA, 22–26 June 2003; Massachusetts Institute of Technology: Boston, MA, USA, 2003; Volume 2, pp. 2035–2040. [Google Scholar]
- Ong, D.E.L.; Leung, C.F.; Chow, Y.K.; Ng, T.G. Severe Damage of a Pile Group due to Slope Failure. J. Geotech. Geoenviron. Eng. 2015, 141, 04015014. [Google Scholar] [CrossRef]
- Ong, D.E.L.; Sim, Y.S.; Leung, C.F. Performance of Field and Numerical Back-Analysis of Floating Stone Columns in Soft Clay Considering the Influence of Dilatancy. Int. J. Géoméch. 2018, 18, 04018135. [Google Scholar] [CrossRef]
- Liu, Z.; Ong, D.E.L.; Liu, Y.; Bolton, M.W.; Oh, E. Effect of Cement and Bentonite Mixture on the Consolidation Behavior of Soft Estuarine Soils. Int. J. GEOMATE 2020, 18, 49–54. [Google Scholar] [CrossRef]
- Sun, J.; Oh, E.; Ong, D. Influence of Degree of Saturation (DOS) on Dynamic Behavior of Unbound Granular Materials. Geosciences 2021, 11, 89. [Google Scholar] [CrossRef]
- Cheng, W.-C.; Li, G.; Ong, D.E. Lubrication characteristics of pipejacking in soft alluvial deposits. In Geotechnical Aspects of Underground Construction in Soft Ground; CRC Press: Boca Raton, FL, USA, 2021; pp. 12–18. [Google Scholar] [CrossRef]
- Cheng, W.-C.; Li, G.; Ong, D.E.; Chen, S.-L.; Ni, J.C. Modelling liner forces response to very close-proximity tunnelling in soft alluvial deposits. Tunn. Undergr. Space Technol. 2020, 103, 103455. [Google Scholar] [CrossRef]
- Peerun, M.I.; Ong, D.E.L.; Choo, C.S. Calibration and parametric studies using geopiv technology to track particle movements in a transparent shear box. In Proceedings of the Young Geotechnical Engineers Conference 2016: Contributions of Young Geotechnical Engineers to Nation Building, Petaling Jaya, Selangor, Malaysia, 30 May 2016. [Google Scholar] [CrossRef]
- Peerun, M.I.; Ong, D.E.L.; Choo, C.S. Interpretation of Geomaterial Behavior during Shearing Aided by PIV Technology. J. Mater. Civ. Eng. 2019, 31, 04019195. [Google Scholar] [CrossRef]
- Peerun, M.; Ong, D.; Choo, C.; Cheng, W. Effect of interparticle behavior on the development of soil arching in soil-structure interaction. Tunn. Undergr. Space Technol. 2020, 106, 103610. [Google Scholar] [CrossRef]
- Peerun, M.I.; Ong, D.E.L.; Desha, C.; Oh, E.; Choo, C. Influences of geological characteristics on the construction of tunnels. In Proceedings of the WEC2019: World Engineers Convention 2019, Melbourne, VIC, Australia, 20–22 November 2019. [Google Scholar]
- Ong, D.E.L. Pile Behaviour Subject to Excavation-Induced Soil Movement in Clay. Ph.D. Thesis, National University of Singapore, Singapore, 2005. [Google Scholar]
- Peerun, M.I.; Ong, D.E.L.; Choo, C.S.; Phangkawira, F. Novel Methods in Estimating Pipe-Jacking Forces in Highly Fractured Rocks; Indian Society for Trenchless Technology, NoDIG: Delhi, India, 2017. [Google Scholar]
- Kang, G.; Tsuchida, T.; Athapaththu, A. Strength mobilization of cement-treated dredged clay during the early stages of curing. Soils Found. 2015, 55, 375–392. [Google Scholar] [CrossRef]
- Liu, Y.; Jiang, Y.J.; Xiao, H.; Lee, F.H. Determination of representative strength of deep cement-mixed clay from core strength data. Géotechnique 2017, 67, 350–364. [Google Scholar] [CrossRef]
- Yao, K.; Pan, Y.; Jia, L.; Yi, J.T.; Hu, J.; Wu, C. Strength evaluation of marine clay stabilized by cementitious binder. Mar. Georesour. Geotechnol. 2020, 38, 730–743. [Google Scholar] [CrossRef]
- Zhou, J. Performance of Full Scale Tests of Piles in Different Soil Conditions. Ph.D. Thesis, Griffith University, Brisbane, Australia, 2018. [Google Scholar]
- Zhou, J.; Zhang, X.; Zhang, L.; Dong, F.; Oh, E. Static load tests of driven concrete piles under CFRP confinement. Géoméch. Geoengin. 2020, 15, 159–171. [Google Scholar] [CrossRef]
- Cheng, W.-C.; Ni, J.C.; Huang, H.-W.; Shen, J.S. The use of tunnelling parameters and spoil characteristics to assess soil types: A case study from alluvial deposits at a pipejacking project site. Bull. Eng. Geol. Environ. 2019, 78, 2933–2942. [Google Scholar] [CrossRef]
- Ji, X.; Zhao, W.; Ni, P.; Barla, M.; Han, J.; Jia, P.; Chen, Y.; Zhang, C. A method to estimate the jacking force for pipe jacking in sandy soils. Tunn. Undergr. Space Technol. 2019, 90, 119–130. [Google Scholar] [CrossRef]
- Coulomb, C. Sur une Application des Regles de Mximus et Mnimus a Qelques Poblemes de Satique Rlatits a L’architecture, Academie Royale des Sciences. In Memoires de Mathermatiques et de Physique par Divers Sowans; Academy of Sciences: Paris, France, 1773; Volume 7, pp. 343–382. [Google Scholar]
- Staheli, K. Jacking Force Prediction: An Interface Friction Approach Based on Pipe Surface Roughness. Ph.D. Thesis, Georgia Institute of Technology, Atlanta, GA, USA, 2006. [Google Scholar]
- Paikowsky, S.; Player, C.; Connors, P. A Dual Interface Apparatus for Testing Unrestricted Friction of Soil Along Solid Surfaces. Geotech. Test. J. 1995, 18, 168–193. [Google Scholar] [CrossRef]
- Uesugi, M.; Kishida, H. Frictional Resistance at Yield between Dry Sand and Mild Steel. Soils Found. 1986, 26, 139–149. [Google Scholar] [CrossRef]
- Frost, J.; DeJong, J.; Recalde, M. Shear failure behavior of granular–continuum interfaces. Eng. Fract. Mech. 2002, 69, 2029–2048. [Google Scholar] [CrossRef]
- Edil, T.B.; Bosscher, P.J.; Sundberg, A.J. Soil-Structure Interface Shear Transfer Behavior. In Geomechanics II: Testing, Modeling, and Simulation; Springer: Berlin/Heidelberg, Germany, 2006; pp. 528–543. [Google Scholar] [CrossRef]
- Uesugi, M.; Kishida, H. Influential Factors of Friction between Steel and Dry Sands. Soils Found. 1986, 26, 33–46. [Google Scholar] [CrossRef]
- Jardine, R.J.; Lehane, B.M.; Everton, S.J. Friction Coefficients for Piles in Sands and Silts. In Offshore Site Investigation and Foundation Behaviour. Advances in Underwater Technology, Ocean Science and Offshore Engineering; Ardus, D.A., Clare, D., Hill, A., Hobbs, R., Jardine, R.J., Squire, J.M., Eds.; Springer: Dordrecht, The Netherlands, 1993; Volume 28, pp. 661–677. [Google Scholar] [CrossRef]
- Ho, T.; Jardine, R.; Anh-Minh, N. Large-displacement interface shear between steel and granular media. Géotechnique 2011, 61, 221–234. [Google Scholar] [CrossRef]
- Boulon, M. Physical and numerical simulation of lateral shaft friction along offshore piles in sand. In Proceedings of the 3rd Internation Conference on Numerical Methods in Offshore Piling, Paris, France; 1986; pp. 127–147. [Google Scholar] [CrossRef]
- Dove, J.E.; Frost, J.D. Peak Friction Behavior of Smooth Geomembrane-Particle Interfaces. J. Geotech. Geoenviron. Eng. 1999, 125, 544–555. [Google Scholar] [CrossRef]
- Peerun, I.; Ong, D.; Choo, C. Behaviour of reconstituted sand-sized particles in direct shear tests using PIV technology. Jpn. Geotech. Soc. Spéc. Publ. 2016, 2, 354–359. [Google Scholar] [CrossRef]
- Peerun, M.I.; Ong, D.E.L.; Choo, C.S. Effect of Particle Shapes on Shear Strength during Direct Shear Testing using GeoPIV Technology. In Proceedings of the 19th Southeast Asian Geotechnical Conference & 2nd Agssea Conference, Deep Excavation and Ground Improvement Dorsett Grand Subang, Subang Jaya, Malaysia, 31 May–3 June 2016. [Google Scholar]
- Pellet-Beaucour, A.-L.; Kastner, R. Experimental and analytical study of friction forces during microtunneling operations. Tunn. Undergr. Space Technol. 2002, 17, 83–97. [Google Scholar] [CrossRef]
- Samtani, N.C.; Nowatzki, E.A. Soils and Foundations: Reference Manual–Volume I, Report, United States; Federal Highway Administration: Washington, DC, USA, 2006. [Google Scholar]
- AS1289; Methods of Testing Soils for Engineering Purposes. Standards Association of Australia: Sydney, NSW, Australia, 1998.
- GB/T50123; Geotechnical Test Method Standard. China Planning Press: Beijing, China, 1999. (In Chinese)
- ASTM, D3080; Standard Test Method for Direct Shear Test of Soils Under Consolidated Drained Conditions. ASTM International: West Conshohocken, PA, USA, 2004.
- Yu, K.; Yao, X.; Zhang, Y.; Li, C.; Ou, L. Analysis of direct shear test data based on area and stress correction. Chin. J. Rock Mech. Eng. 2014, 33, 118–124. (In Chinese) [Google Scholar]
- Li, Y.; Aydin, A. Behavior of rounded granular materials in direct shear: Mechanisms and quantification of fluctuations. Eng. Geol. 2010, 115, 96–104. [Google Scholar] [CrossRef]
- Bjerrum, L.; Landva, A. Direct Simple-Shear Tests on a Norwegian Quick Clay. Géotechnique. 1966, 16, 1–20. [Google Scholar] [CrossRef]
- Shimamura, A.; Miyamoto, Y.; Kobayashi, T. Experimental Study on Lateral Resistance of Steel Pipe Pile with Wings Using the New Composite Geo-material with Magnesium Acrylate. In Dynamic Soil-Structure Interaction for Sustainable Infrastructures. GeoMEast 2018. Sustainable Civil Infrastructures; Choudhury, D., El-Zahaby, K., Idriss, I., Eds.; Springer: Cham, Switzerland, 2018; pp. 62–74. [Google Scholar] [CrossRef]
- Hanzawa, H.; Nutt, N.; Lunne, T.; Tang, Y.; Long, M. A Comparative Study Between the NGI Direct Simple Shear Apparatus and the Mikasa Direct Shear Apparatus. Soils Found. 2007, 47, 47–58. [Google Scholar] [CrossRef]
- ASTM, D6528; Standard Test Method for Consolidated Undrained Direct Simple Shear Testing of Fine Grain Soils. ASTM International: West Conshohocken, PA, USA, 2017.
- Bishop, A.W.; Green, G.E.; Garga, V.K.; Andresen, A.; Brown, J.D. A New Ring Shear Apparatus and Its Application to the Measurement of Residual Strength. Géotechnique 1971, 21, 273–328. [Google Scholar] [CrossRef]
- Bromhead, E.N.; Dixon, N. The field residual strength of London Clay and its correlation with loboratory measurements, especially ring shear tests. Géotechnique 1986, 36, 449–452. [Google Scholar] [CrossRef]
- Stark, T.D.; Eid, H.T. Modified Bromhead ring shear apparatus. Geotech. Test. J. 1993, 16, 100–107. [Google Scholar] [CrossRef]
- Varnes, D.J. Slope movement types and processes. In Transportation Research Board, Special Report; Transportation Research Board: Washington, DC, USA, 1978; Volume 176, pp. 11–33. [Google Scholar]
- Peerun, M.I. Behaviour of Reconstituted Sand-Sized Tunnelling Rock Spoils during Shearing Using GeoPIV Technology for the Assessment of Soil Arching Effect during Pipe-Jacking Works. Master’s Thesis, Faculty of Engineering, Computing and Science, Swinburne University of Technology, Hawthorn, VIC, Australia, 2016. [Google Scholar]
- Keramatikerman, M.; Chegenizadeh, A.; Nikraz, H.; Yilmaz, Y. Mechanical Behaviour of Atrazine-Contaminated Clay. Appl. Sci. 2020, 10, 2457. [Google Scholar] [CrossRef]
- Potyondy, J.G. Skin Friction between Various Soils and Construction Materials. Géotechnique 1961, 11, 339–353. [Google Scholar] [CrossRef]
- ISO 4278:1977; Geometrical Product Specifications (GPS)—Surface Texture: Profile Method—Terms, Definitions and Surface Texture Parameters. International Organization for Standardization: Geneva, Switzerland, 1977.
- Rudawska, A.; Danczak, I.; Müller, M.; Valasek, P. The effect of sandblasting on surface properties for adhesion. Int. J. Adhes. Adhes. 2016, 70, 176–190. [Google Scholar] [CrossRef]
- Yoshimi, Y.; Kishida, T. A Ring Torsion Apparatus for Evaluating Friction Between Soil and Metal Surfaces. Geotech. Test. J. 1981, 4, 145–152. [Google Scholar] [CrossRef]
- Kishida, H.; Uesugi, M. Tests of the interface between sand and steel in the simple shear apparatus. Géotechnique 1987, 37, 45–52. [Google Scholar] [CrossRef]
- Subba Rao, K.; Allam, M.; Robinson, R.; Paikowsky, S.; Player, C. Discussion on a dual interface apparatus for testing unrestricted friction of soil along solid surfaces. Authors’ reply. ASTM Geotech. Test. J. 1996, 19, 446–451. [Google Scholar] [CrossRef]
- Zhou, X.; Gong, W.; Ding, H.; Rao, X. Large-scale simple shear test on mechanical properties of interface between concrete face and gravel underlayer. Chin. J. Geotech. Eng. 2005, 27, 876–880. [Google Scholar]
- Iscimen, M.; Frost, J. Shearing behaviour of curved interfaces. In Characterization and Behavior of Interfaces: Proceedings of the Research Symposium on Characterization and Behavior of Interfaces, Atlanta, GA, USA, 21 September 2008; IOS Press: Amsterdam, The Netherlands, 2010; pp. 35–43. [Google Scholar]
- Knappett, J.; Craig, R.F. Craig’s Soil Mechanics, 9th ed.; CRC Press: London, UK, 2019; Volume 8. [Google Scholar] [CrossRef]
- Stępień, K. Testing the Accuracy of Surface Roughness Measurements Carried out with a Portable Profilometer. Key Eng. Mater. 2015, 637, 69–73. [Google Scholar] [CrossRef]
- Mell, B. Sandpaper Roughness Measurement Using 3D Profilometry; Nanovea Technical Report; Nanovea: Irvine, CA, USA, 2010. [Google Scholar]
- Liu, F. Roughness and Particle Diameter of Sandpaper; Nanovea Technical Report; Nanovea: Irvine, CA, USA, 2018. [Google Scholar]
- Martinez, A.; Frost, J.D. The influence of surface roughness form on the strength of sand-structure interfaces. Géotechnique Lett. 2017, 7, 104–111. [Google Scholar] [CrossRef]
- Tsubakihara, Y.; Kishida, H. Frictional Behaviour between Normally Consolidated Clay and Steel by Two Direct Shear Type Apparatuses. Soils Found. 1993, 33, 1–13. [Google Scholar] [CrossRef]
- Chen, X.; Zhang, J.; Xiao, Y.; Li, J. Effect of roughness on shear behavior of red clay—Concrete interface in large-scale direct shear tests. Can. Geotech. J. 2015, 52, 1122–1135. [Google Scholar] [CrossRef]
- Hryciw, R.D.; Irsyam, M. Behavior of Sand Particles Around Rigid Ribbed Inclusions During Shear. Soils Found. 1993, 33, 1–13. [Google Scholar] [CrossRef]
- Koval, G.; Chevoir, F.; Roux, J.-N.; Sulem, J.; Corfdir, A. Interface roughness effect on slow cyclic annular shear of granular materials. Granul. Matter 2011, 13, 525–540. [Google Scholar] [CrossRef]
- Mitchell, J.K.; Villet, W.C. Reinforcement of Earth Slopes and Embankments; NCHRP Report; Transportation Research Board: Washington, DC, USA, 1987. [Google Scholar]
- Dyskin, A.V.; Estrin, Y.; Kanel-Belov, A.; Pasternak, E. Toughening by Fragmentation—How Topology Helps. Adv. Eng. Mater. 2001, 3, 885–888. [Google Scholar] [CrossRef]
- Miura, K.; Maeda, K.; Furukawa, M.; Toki, S. Mechanical Characteristics of Sands with Different Primary Properties. Soils Found. 1998, 38, 159–172. [Google Scholar] [CrossRef]
- Shimobe, S.; Moroto, N. A new classification chart for sand liquefaction. Earthq. Geotech. Eng. 1995, 315–320. [Google Scholar]
- Cho, G.-C.; Dodds, J.; Santamarina, J.C. Closure to “Particle Shape Effects on Packing Density, Stiffness, and Strength: Natural and Crushed Sands” by Gye-Chun Cho, Jake Dodds, and J. Carlos Santamarina. J. Geotech. Geoenvironmental Eng. 2007, 133, 1474. [Google Scholar] [CrossRef]
- ASTM, D2488-17; Standard Practice for Description and Identification of Soils (Visual-Manual Procedure). ASTM International: West Conshohocken, PA, USA, 2017. [CrossRef]
- De Graft-Johnson, J.; Bhatia, H.; Gidigasu, D. The strength characteristics of residual micaceous soils and their application to stability problems. In Proceedings of the 7th International Conference on Soil Mechanics and Foundation Engineering, Mexico City, Maxico; 1969; Volume 2. [Google Scholar]
- Holtz, W.; Willard, M. Triaxial Shear Characteristics of Clayey Gravel Soils; US Bureau of Reclamation: Washington, DC, USA, 1961. [Google Scholar]
- Choo, C.S.; Ong, D.E.L. Evaluation of Pipe-Jacking Forces Based on Direct Shear Testing of Reconstituted Tunneling Rock Spoils. J. Geotech. Geoenviron. Eng. 2015, 141, 04015044. [Google Scholar] [CrossRef]
- Ong, D.; Choo, C. Assessment of non-linear rock strength parameters for the estimation of pipe-jacking forces. Part 1. Direct shear testing and backanalysis. Eng. Geol. 2018, 244, 159–172. [Google Scholar] [CrossRef]
- Vangla, P.; Gali, M.L. Effect of particle size of sand and surface asperities of reinforcement on their interface shear behaviour. Geotext. Geomembr. 2016, 44, 254–268. [Google Scholar] [CrossRef]
- Punetha, P.; Mohanty, P.; Samanta, M. Microstructural investigation on mechanical behavior of soil-geosynthetic interface in direct shear test. Geotext. Geomembr. 2017, 45, 197–210. [Google Scholar] [CrossRef]
- Su, L.-J.; Zhou, W.-H.; Chen, W.-B.; Jie, X. Effects of relative roughness and mean particle size on the shear strength of sand-steel interface. Measurement 2018, 122, 339–346. [Google Scholar] [CrossRef]
- Williams, J.A.; Kennedy, F.E. Engineering Tribology. ASME J. Tribol. 1998, 120, 644. [Google Scholar] [CrossRef][Green Version]
- Xiao, Y.; Liu, H.; Chen, Y.; Jiang, J. Strength and Deformation of Rockfill Material Based on Large-Scale Triaxial Compression Tests. I: Influences of Density and Pressure. J. Geotech. Geoenviron. Eng. 2014, 140, 04014070. [Google Scholar] [CrossRef]
- Terzaghi, K.; Peck, R.B.; Mesri, G. Soil Mechanics in Engineering Practice; John Wiley & Sons: Hoboken, NJ, USA, 1996. [Google Scholar]
- Adrian, R.J. Particle-Imaging Techniques for Experimental Fluid Mechanics. Annu. Rev. Fluid Mech. 1991, 23, 261–304. [Google Scholar] [CrossRef]
- Grant, I. Particle image velocimetry: A review. Proc. Inst. Mech. Eng. Part C J. Mech. Eng. Sci. 1997, 211, 55–76. [Google Scholar] [CrossRef]
- White, D.; Take, W. GeoPIV: Particle Image Velocimetry (PIV) Software for Use in Geotechnical Testing; Cambridge University: Cambridge, UK, 2002. [Google Scholar]
- Ng, N.Y.J.; Peerun, M.I.; Ong, D.E.L.; Choo, C.S. Assessment of Tunnelling Rock Spoils from Highly Weathered Lithology Using Rolling Friction Contact Models in Discrete Element Modelling; The Institution of Engineers Malaysia: Kuala Lumpur, Malaysia, 2020. [Google Scholar]
- Peerun, M.I.; Ong, D.E.L.; Desha, C.; Oh, E.; Choo, C.S. Advances in the Study of Micromechanical Behaviour for Granular Materials Using Micro-CT Scanner and 3D Printing. In Challenges and Innovations in Geomechanics; IACMAG 2021. Lecture Notes in Civil Engineering; Barla, M., Di Donna, A., Sterpi, D., Eds.; Springer: Cham, Switzerland, 2021; Volume 125, pp. 911–918. [Google Scholar] [CrossRef]
- Peerun, M.I.; Ong, D.E.L.; Desha, C.; Oh, E.; Choo, C.S. Recent Advancements in Fundamental Studies of Particulate Interaction and Mechanical Behaviour using 3-D Printed Synthetic Particles. In Proceedings of the 1st Malaysian Geotechincal Society (MGS) and Geotechnical Society of Singapore (GeoSS) Conference 2019, Petaling Jaya, Malaysia, 24–26 June 2019. [Google Scholar]
- Indraratna, B.; Ngo, T.; Rujikiatkamjorn, C.; Vinod, J.S. Behavior of Fresh and Fouled Railway Ballast Subjected to Direct Shear Testing: Discrete Element Simulation. Int. J. Géoméch. 2014, 14, 34–44. [Google Scholar] [CrossRef]
- Potts, D.M.; Dounias, G.T.; Vaughan, P.R. Finite element analysis of the direct shear box test. Géotechnique 1987, 37, 11–23. [Google Scholar] [CrossRef]
- Fukuoka, H.; Sassa, K.; Wang, G.; Sasaki, R. Observation of shear zone development in ring-shear apparatus with a transparent shear box. Landslides 2006, 3, 239. [Google Scholar] [CrossRef]
- Agung, M.W.; Sassa, K.; Fukuoka, H.; Wang, G. Evolution of Shear-Zone Structure in Undrained Ring-Shear Tests. Landslides 2004, 1, 101–112. [Google Scholar] [CrossRef]
- Wang, G.; Sassa, K. Post-failure mobility of saturated sands in undrained load-controlled ring shear tests. Can. Geotech. J. 2002, 39, 821–837. [Google Scholar] [CrossRef]
- Yuan, Q.; Wang, Y.H.; Tam, P.O.; Li, X.; Gao, Y. Experimental Characterizations of Contact Movement in Two-Dimensional Rod Assembly Subjected to Direct Shearing. Int. J. Géoméch. 2017, 17, 04016032. [Google Scholar] [CrossRef]
- Choo, C.S.; Ong, D.E.L. Impact of highly weathered geology on pipe-jacking forces. Geotech. Res. 2017, 4, 94–106. [Google Scholar] [CrossRef]
- Ong, D.E.L.; Choo, C.S. Back-analysis and finite element modeling of jacking forces in weathered rocks. Tunn. Undergr. Space Technol. 2016, 51, 1–10. [Google Scholar] [CrossRef]
- Jewell, R.A. Direct shear tests on sand. Géotechnique 1989, 39, 309–322. [Google Scholar] [CrossRef]
- Shahin, M.; Maier, H.; Jaksa, M. Predicting Settlement of Shallow Foundations using Neural Networks. J. Geotech. Geoenvironmental Eng. 2002, 128, 785–793. [Google Scholar] [CrossRef]
- Fatehnia, M.; Amirinia, G. A review of Genetic Programming and Artificial Neural Network applications in pile foundations. Int. J. Geo-Eng. 2018, 9, 2. [Google Scholar] [CrossRef]
- Fausett, L. Fundamentals of Neural Networks: Architectures, Algorithms, and Applications; Prentice-Hall, Inc.: Hoboken, NJ, USA, 1994. [Google Scholar]
- Maier, H.; Dandy, G. The effect of internal parameters and geometry on the performance of back-propagation neural networks: An empirical study. Environ. Model. Softw. 1998, 13, 193–209. [Google Scholar] [CrossRef]
- Ecemis, N.; Bakunowicz, P. Feasible packing of granular materials in discrete-element modelling of cone-penetration testing. Géoméch. Geoeng. 2018, 13, 198–216. [Google Scholar] [CrossRef]
- Liu, Y.; Sun, W.; Fish, J. Determining Material Parameters for Critical State Plasticity Models Based on Multilevel Extended Digital Database. J. Appl. Mech. 2016, 83, 011003. [Google Scholar] [CrossRef]
- Ng, T.-T. Input Parameters of Discrete Element Methods. J. Eng. Mech. 2006, 132, 723–729. [Google Scholar] [CrossRef]
- Friedman, J.H. On bias, variance, 0/1—Loss, and the curse-of-dimensionality. Data Min. Knowl. Discov. 1997, 1, 55–77. [Google Scholar] [CrossRef]
- Gupta, R.; Salager, S.; Wang, K.; Sun, W. Open-source support toward validating and falsifying discrete mechanics models using synthetic granular materials—Part I: Experimental tests with particles manufactured by a 3D printer. Acta Geotech. 2019, 14, 923–937. [Google Scholar] [CrossRef]
- Wang, K.; Sun, W.; Salager, S.; Na, S.; Khaddour, G. Identifying Material Parameters for a Micro-Polar Plasticity Model via X-ray Micro-Computed Tomographic (ct) Images: Lessons Learned from the Curve-Fitting Exercises. Int. J. Multiscale Comput. Eng. 2016, 14, 389–413. [Google Scholar] [CrossRef]
- Hanaor, D.A.H.; Gan, Y.; Einav, I. Effects of surface structure deformation on static friction at fractal interfaces. Géotechnique Lett. 2013, 3, 52–58. [Google Scholar] [CrossRef]
- Bayes, T. LII. An essay towards solving a problem in the doctrine of chances. By the late Rev. Mr. Bayes, F.R.S. communicated by Mr. Price, in a letter to John Canton, A.M.F.R.S. Philos. Trans. R. Soc. Lond. 1763, 53, 370–418. [Google Scholar] [CrossRef]
- Jin, Y.; Biscontin, G.; Gardoni, P. A Bayesian definition of ‘most probable’ parameters. Geotech. Res. 2018, 5, 130–142. [Google Scholar] [CrossRef]
- Jong, S.; Ong, D.; Oh, E. State-of-the-art review of geotechnical-driven artificial intelligence techniques in underground soil-structure interaction. Tunn. Undergr. Space Technol. 2021, 113, 103946. [Google Scholar] [CrossRef]
- Jong, S.C.; Ong, D.E.L.; Oh, E.; Choo, C.S. Prediction of Frictional Jacking Forces Using Bayesian Inference. In Challenges and Innovations in Geomechanics; Barla, M., Di Donna, A., Sterpi, D., Eds.; IACMAG 2021. Lecture Notes in Civil Engineering; Springer: Cham, Switzerland, 2021; Volume 125, pp. 878–885. [Google Scholar] [CrossRef]
- Qi, X.-H.; Zhou, W.-H. An efficient probabilistic back-analysis method for braced excavations using wall deflection data at multiple points. Comput. Geotech. 2017, 85, 186–198. [Google Scholar] [CrossRef]


| USCS Classification (D2487) | Minimum Time to Failure, tf |
|---|---|
| SW, SP (<5% fines) | 10 min |
| SW-SM, SP_SM, SM (>5% fines) | 60 min |
| SC, ML, CL, SP-SC | 200 min |
| MH, CH | 24 h |
| Parameters | Characteristics | Formula |
|---|---|---|
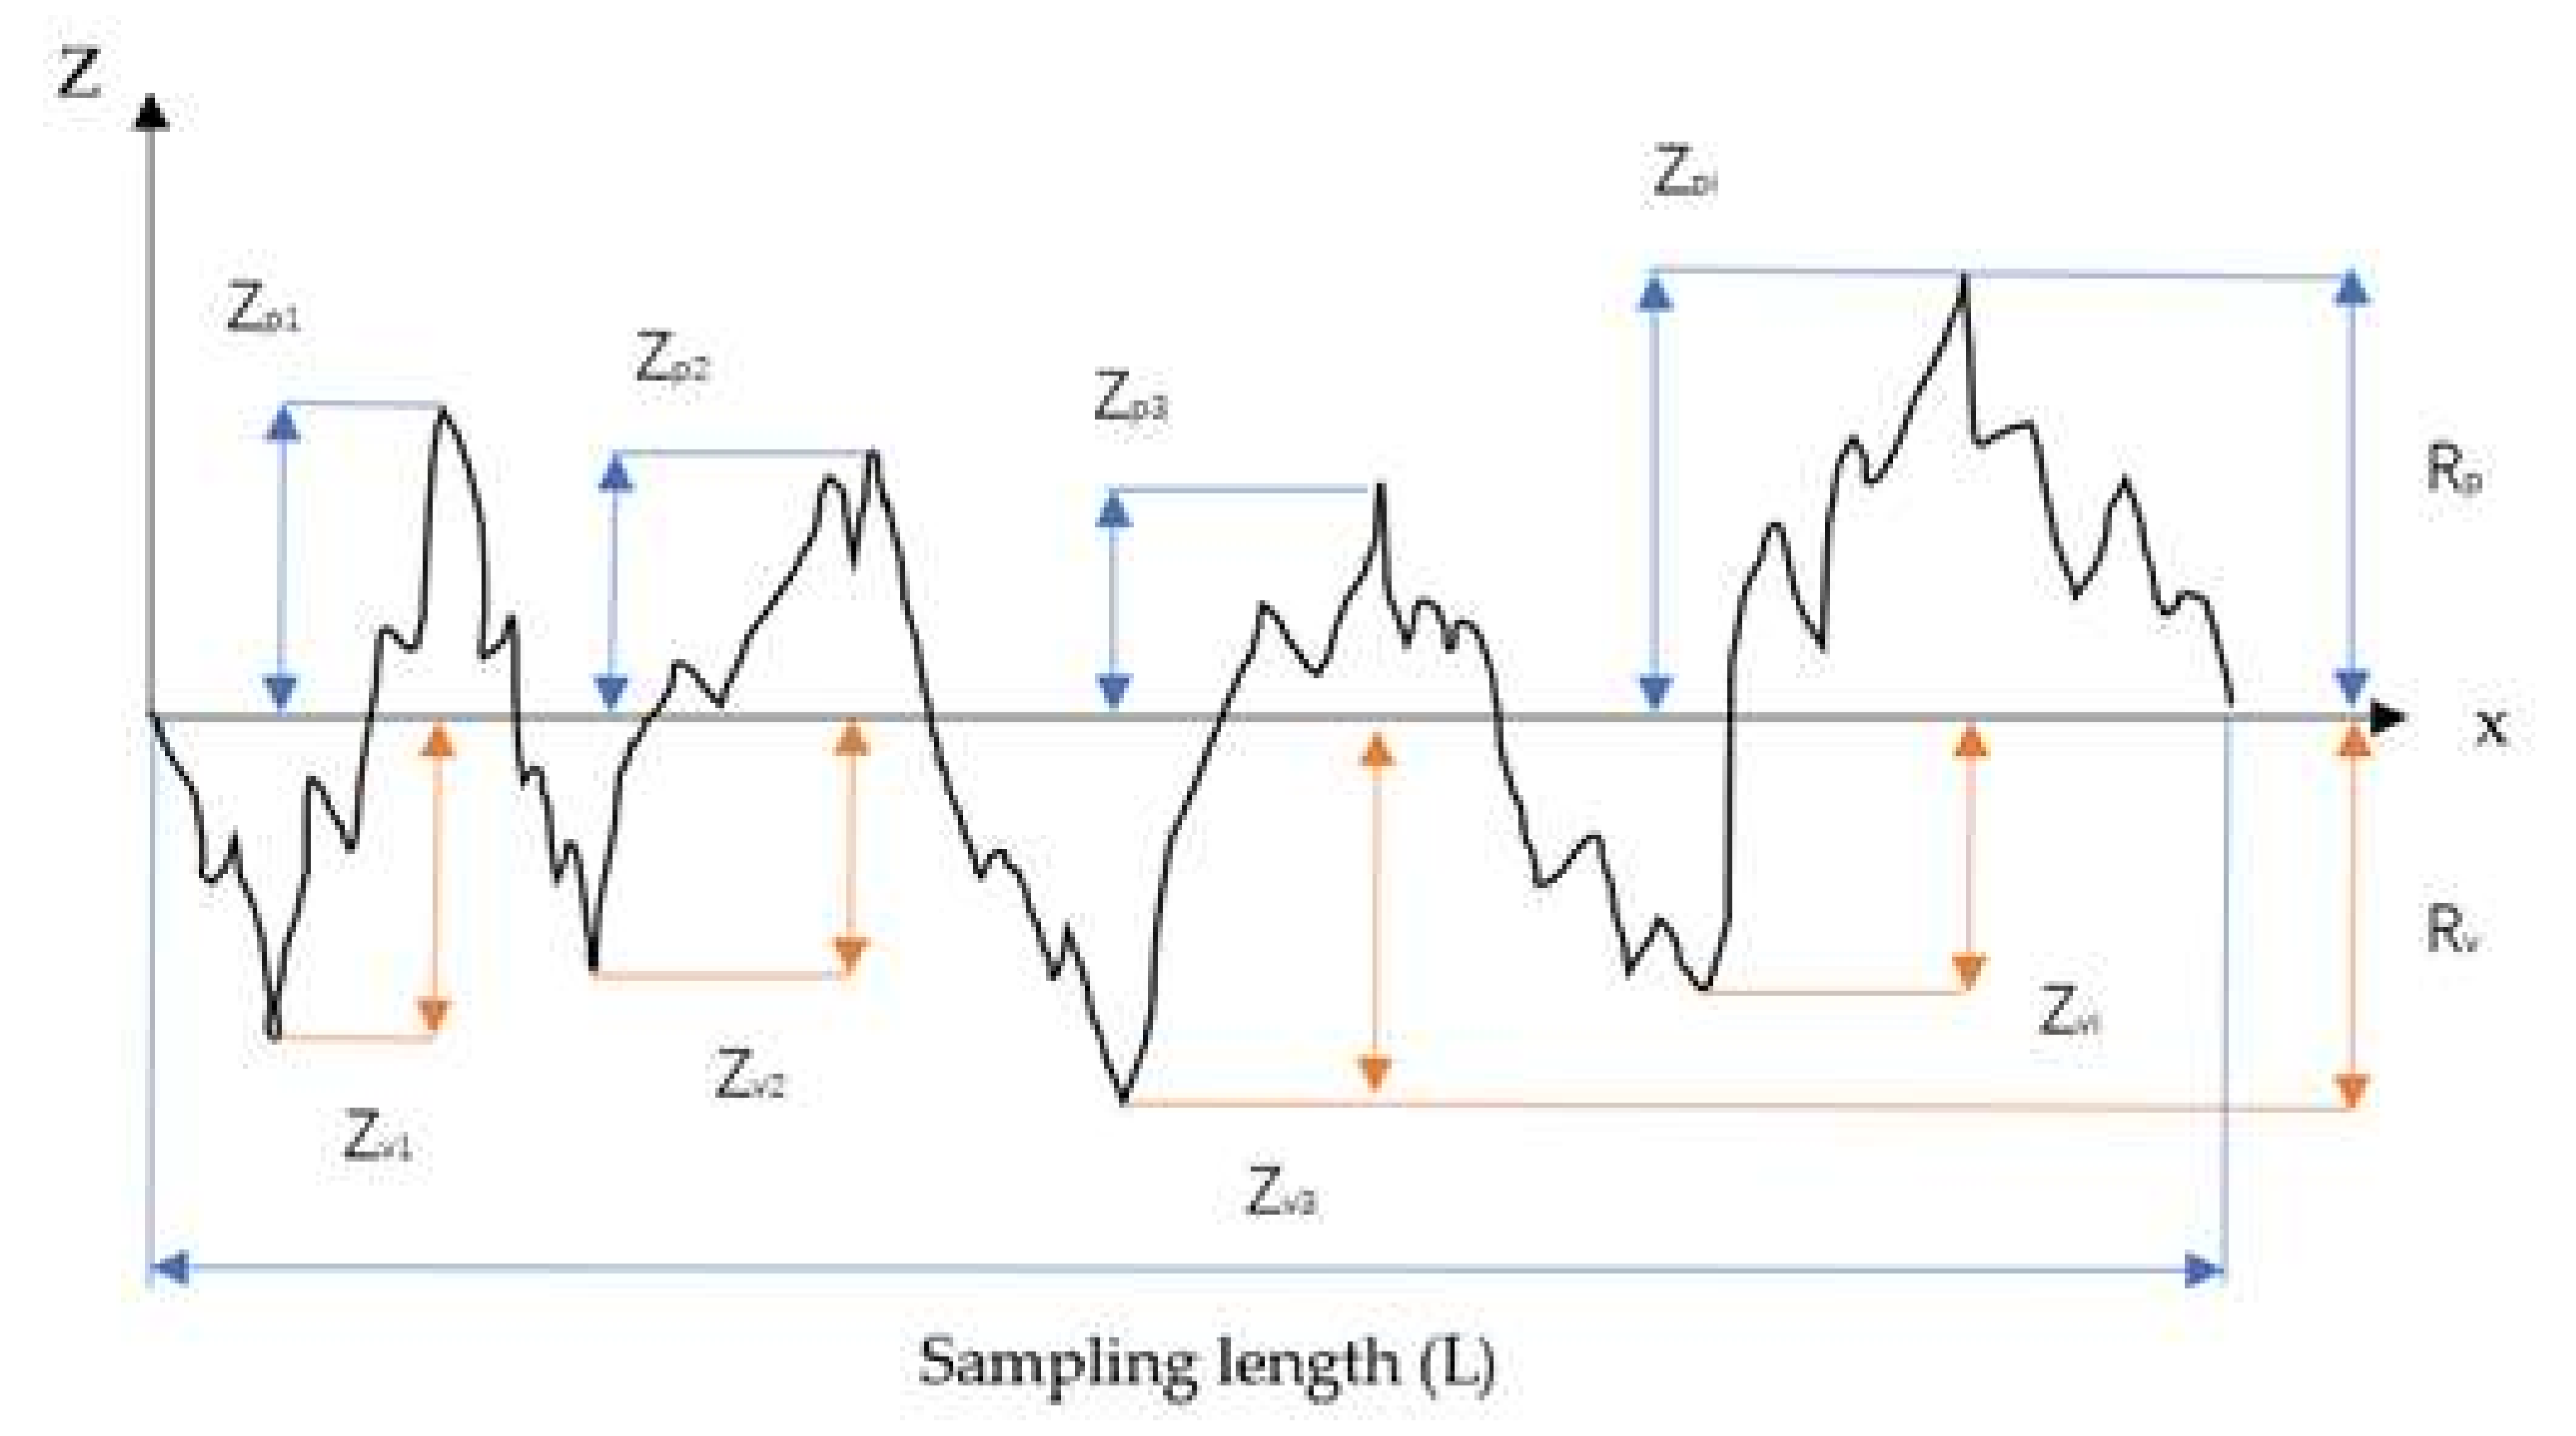
| Zpi | The ith peck height of the material roughness profile | - |
| Zvi | The ith valley depth of the material roughness profile | - |
| Rpi | The maximum peak height of the material roughness profile within a sampling length (L or lr) | |
| Rvi | The maximum valley depth of the material roughness profile within a sampling length (L or lr) | |
| Rzi | The overall height of the roughness profile Rzi is the sum of Rpi and Rvi within a sampling length (L or lr) | |
| Rmax | Maximum Rzi value over assessment length | - |
| Rz | Average Rzi value over assessment length | |
| Ra | Roughness average Ra is the arithmetic mean of the absolute values of the roughness profile ordinates |
| Parameters | Hobas | Polycrete | Wet Cast Concrete | Vitrified Clay | Packhead Concrete |
|---|---|---|---|---|---|
| Average Ra (μm) | 6.5 | 16.9 | 18.7 | 24.8 | 55.1 |
| Friction coefficient (peak) (40 kPa) | 0.51 | 0.50 | 0.68 | 0.68 | 0.81 |
| Friction coefficient (residual) (40 kPa) | 0.43 | 0.42 | 0.49 | 0.49 | 0.54 |
| Friction coefficient (peak) (80 kPa) | 0.50 | 0.49 | 0.62 | 0.65 | 0.73 |
| Friction coefficient (residual) (80 kPa) | 0.44 | 0.43 | 0.44 | 0.48 | 0.53 |
| Friction coefficient (peak) (120 kPa) | 0.48 | 0.47 | 0.62 | 0.63 | 0.73 |
| Friction coefficient (residual) (120 kPa) | 0.42 | 0.43 | 0.47 | 0.45 | 0.52 |
| Parameters | Symbol | Unit | Drive C | Drive D | Drive E | Drive F |
|---|---|---|---|---|---|---|
| Geology | - | - | Sandstone | Shale | ||
| Soil friction angle | ϕ | degree | 40.5 | 28.6 | 37.3 | 37.3 |
| Soil cohesion | C | kPa | 11.9 | 17.3 | 0.0 | 0.0 |
| Arching | - | - | Low to moderately favorable | Least to not favorable | ||
| Calculated vertical stress on pipe crown | σ | kN/m2 | 15.3 | 12.1 | 34.8 | 42.9 |
| Average volume of lubricant used | - | L/m | 250 | 250 | 500 | 375 |
| Average jacking speed | - | mm/min | 29.2 | 22.4 | 10.4 | 18.9 |
| Measured jacking force | JF | kN/m | 10.1 | 18.9 | 29.0 | 28.5 |
| Measures grooves and recessions: | wider than 0.16 in (4 mm) |
| Roughness parameters: | Ra, Rz, Rq (Rms), Rt, Rs, Rsm, Rmax, Rpc, Rmr. |
| Roughness standards: | ISO/DIN/JIS/ANSI |
| Display resolutions: | 0.01µm/±20 µm 0.02 µm/±40 µm 0.04 µm/±80 µm |
| Measuring accuracy: | ≤±10% |
| Repeatability: | Less than or equal to 6% |
| Measuring range: | Ra, Rq: 0.01–40 µm Rz, Rt, Rm: 0.02–160 µm |
| Maximum drive range: | 0.7 inch (17.5 mm) |
| Cut-off length: | 0.009/0.03/0.09 inch (0.25/0.8/2.5 mm) |
| Tracing speeds: | speed 1 mm/s (sampling length 2.5 mm) speed 0.5 mm/s (sampling length 0.8 mm) speed 0.135 mm/s (sampling length 0.25 mm) |
| Sensor: | Inductance type |
| Sensor-stylus: | Diamond, radius 5 µm |
| Pick up Force: | <4 mN |
| Filter: | RC, PC-RC, GAUSSIAN, and D-P |
| Data output: | USB |
| Operating temperature: | 41–104 °F (5–40 °C) |
| Weight: | 0.97 lb (440 g) |
| Dimensions: | (119 × 47 × 65 mm) |
| Power: | Li-Ion rechargeable battery |
| Display: | Four digits, LCD |
| Range: | 0 µm to 800 µm (0 mils to 30 mils) |
| Accuracy: | ±5% or ±5 µm, (whichever is the greater) |
| Resolution: | 1 µm (0.1 mils) |
| Measurement speed: | >30 readings per minute |
| Weight: | 280 g |
| Dimensions: | 162 × 65 × 28 mm (6.4 × 2.6 × 1.1 inch) |
| Operating temperature: | 0 °C to 50 °C, <80%RH |
| Batteries: | 4 × 1.5v (AAA) battery |
| Ra | Rq | Rz | Rmax | D50 (CS) | Rn | |
|---|---|---|---|---|---|---|
| Structural material | N/A | N/A | 422 | N/A | 833 | 0.507 |
| Grit 40 Sandpaper | N/A | N/A | 722 | N/A | 833 | 0.867 |
| Grit 80 Sandpaper | N/A | N/A | 460 | N/A | 833 | 0.552 |
| Grit 160 Sandpaper | 20.07 | 26.63 | 81.66 | 123.3 | 833 | 0.148 |
| Grit 320 Sandpaper | 10.96 | 13.37 | 29.39 | 58.0 | 833 | 0.070 |
| Soil Type | Material Type | D50 or Rmax (Micron) | Peak Friction Angle (deg) | Residual Friction Angle (deg) |
|---|---|---|---|---|
| Coarse sand | Coarse sand only | 833 (D50) | 41.3 (sand only) | 35.8 (sand only) |
| Coarse sand | Grit 40 sandpaper | 722 (Rmax) | 40.8 (sand–sandpaper) | 30.5 (sand–sandpaper) |
| Coarse sand | Grit 80 sandpaper | 460 (Rmax) | 40.6 (sand–sandpaper) | 30.7 (sand–sandpaper) |
| Coarse sand | Grit 180 sandpaper | 81.66 (Rmax) | 34.6 (sand–sandpaper) | 30.5 (sand–sandpaper) |
| Coarse sand | Grit 360 sandpaper | 29.39 (Rmax) | 34.5 (sand–sandpaper) | 29.5 (sand–sandpaper) |
Publisher’s Note: MDPI stays neutral with regard to jurisdictional claims in published maps and institutional affiliations. |
© 2022 by the authors. Licensee MDPI, Basel, Switzerland. This article is an open access article distributed under the terms and conditions of the Creative Commons Attribution (CC BY) license (https://creativecommons.org/licenses/by/4.0/).
Share and Cite
Wang, R.; Ong, D.E.L.; Peerun, M.I.; Jeng, D.-S. Influence of Surface Roughness and Particle Characteristics on Soil–Structure Interactions: A State-of-the-Art Review. Geosciences 2022, 12, 145. https://doi.org/10.3390/geosciences12040145
Wang R, Ong DEL, Peerun MI, Jeng D-S. Influence of Surface Roughness and Particle Characteristics on Soil–Structure Interactions: A State-of-the-Art Review. Geosciences. 2022; 12(4):145. https://doi.org/10.3390/geosciences12040145
Chicago/Turabian StyleWang, Runshen, Dominic E. L. Ong, Mohammud I. Peerun, and Dong-Sheng Jeng. 2022. "Influence of Surface Roughness and Particle Characteristics on Soil–Structure Interactions: A State-of-the-Art Review" Geosciences 12, no. 4: 145. https://doi.org/10.3390/geosciences12040145
APA StyleWang, R., Ong, D. E. L., Peerun, M. I., & Jeng, D.-S. (2022). Influence of Surface Roughness and Particle Characteristics on Soil–Structure Interactions: A State-of-the-Art Review. Geosciences, 12(4), 145. https://doi.org/10.3390/geosciences12040145