Abstract
The Sikkim region of the Himalayas (NE India) may form an important microplate between Nepal and Bhutan. Here we report high-resolution pressure-temperature (P-T) paths taken from garnet-bearing rocks across the northern and eastern portion of the region’s Main Central Thrust (MCT) shear zone. The MCT separates units affiliated with the Greater Himalayan Crystallines (GHC) in its hanging wall from the Lesser Himalayan Formation (LHF). Late Miocene monazite ages are reported from the LHF (10–14 Ma), whereas those from the GHC are Miocene (18–20 Ma). Some paths from the LHF and GHC show a P decrease before burial, consistent with erosion before compression. MCT shear zone and GHC rocks show a P increase and then decrease over a short T interval. This hairpin P-T path is consistent with an imbrication model for the Himalayas. LHF P-T path conditions and those obtained using conventional thermobarometry are best in agreement. These paths also are consistent with observed mineral assemblages and garnet zoning. Although we have the most confidence in LHF results, MCT shear zone and GHC P-T path shapes suggest processes to establish imbrication tectonics may have occurred here as early as the Miocene.
1. Introduction
The Sikkim region of NE India (Figure 1) plays a central role in developing ideas regarding the dynamics of India–Asia collision and the Himalayan range, e.g., [1,2,3]. In this particular area, the convergence vector between the Indian and Eurasian plates is thought to be almost perpendicular to the Himalayan deformation front [4]. The amount of convergence is estimated to be ~450 km [4] and is accommodated by several fault systems, including the Main Central Thrust (MCT) and its associated imbrications (MCT-II or Pelling-Munsiar, or Pelling thrust; Ramgarh thrust, MCT-III, Tendong Fault, or Ramman–Rangit Faults; Figure 1) [2,3,4,5,6,7,8,9,10,11].
The MCT in the region is characterized by a sinusoidal shape with a narrow neck at the southern end, creating the Tista (or Teesta) dome or Tista-Rangit double tectonic window (Figure 1) [2,7,12,13,14,15,16,17,18]. South of the MCT, the Main Boundary Thrust (MBT) is unusual compared to the rest of the Himalayas as it is modeled as a mantle-reaching seismogenic thrust, instead of terminating at the Main Himalayan Thrust (MHT), a decollement in which the MCT and other Himalayan thrusts converge, e.g., [19,20]. The MBT and presently active Main Frontal Thrust (MFT) [21] align east–west, consistent with the trend of these structures along the strike of the range.
The Sikkim region also appears unusual compared to the rest of the Himalayas in terms of its seismicity and the sense of motion of its structures. Although large Himalayan earthquakes are thought to be mainly restricted to the shallow portion of the MHT, e.g., [20], a significant number of earthquakes occur within the Lesser Himalayan duplex structure, south of the MCT [19,22]. The MCT is described as an active fault here [19,22,23], and earthquakes > 40 km suggest that the brittle-ductile transition is anomalously deep [24]. The Sikkim Himalayas also marks a zone of change where the width of the foreland basin decreases from ~200 km in the central Himalayas eastward to ∼50 km in Sikkim, and the width of the locked zone on the MHT changes from ∼100 km in the central Himalayas to ∼50 km beneath Bhutan [25].
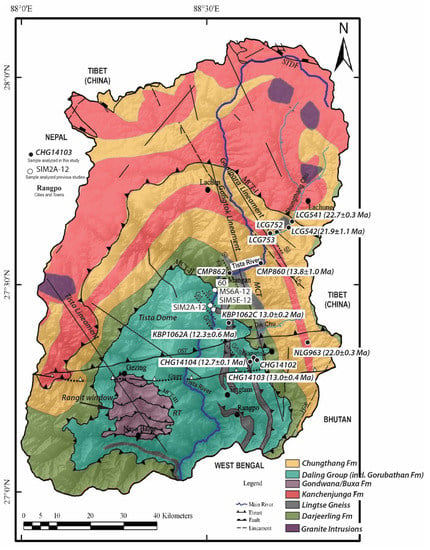
Figure 1.
Geological Map of the Sikkim Himalayas. Samples and average monazite ages indicated after [5,6]. We note that the specific locations of major fault system are inconsistently mapped and named and refer the reader to maps of additional structures possibly present as outlined in [9,14,26], among others. Specific formations that our samples belong found are based on mapping by [26] and are listed in Table 1. We include the locations of samples collected by others discussed in the text [27,28]. RT = Ramgarh thrust; OST = out of sequence thrust; YGR = Yadong-Gulu rift; STDF = South Tibet Detachment Fault. We include the map by [26] with our sample locations in the data repository.
The Sikkim region also records folding [8,29,30], anticlockwise rotation [31], and significant transcurrent deformation [32,33]. The Tista dome (Figure 1) is thought to have been created due to strike-slip faulting, e.g., [34]. Right-lateral strike-slip remains an important sense of motion for earthquakes recorded below the surface trace of the MCT at both deep and shallow levels [22,23,24,35]. The presence of strike-slip motion in the Sikkim region is also a significant difference when comparing the behavior of the MHT elsewhere in the Himalayas, which is dominated by contraction, e.g., [15,24,35,36,37]. Crustal shortening in the Sikkim Himalayas in recent times has been substantially accommodated by transverse tectonics rather than under thrusting [24].
The Himalayas is often described as a large hot orogen that may have grown by distributed extrusion (channel flow) or discrete thrusting (sometimes referred to as critical taper) [1,3,36,37,38,39,40,41,42]. The Sikkim has featured prominently in models for both end-members, e.g., [1,5,6,27,28]. In fact, both scenarios may be relevant to the Himalayan core, depending on the location within the range and the time frame of metamorphism [38,41,42,43,44,45]. Deciphering the P-T paths followed by rocks across the MCT helps understand the applicability of models to the development of this region.
Metapelitic rocks are found in the MCT hanging wall (Greater Himalayan Crystallines, GHC) and footwall (Lesser Himalayan Formations, LHF). These rocks have long been known to display an inverted metamorphic signature of almost complete Barrovian zones from chlorite to sillimanite + K-feldspar [5,6,7,27,28,46,47]. Himalayan inverted metamorphism is a characteristic of the entire range, with higher-grade rocks found at structurally shallower levels, e.g., [48,49,50]. Several studies have focused on deciphering the origin of the inverted metamorphic signature and the pressure-temperature (P-T) conditions of rocks in the Sikkim region, e.g., [5,6,27,28,51], see review in [52]. One model for developing the inverted signature is heat flow across fault imbrications [5,6]. However, other options, such as melt-triggered inversion and exhumation of a coherent, fault-bounded block, are also suggested [46]. The role of the South Tibet Detachment Fault (STDF) (Figure 1) extensional system north of the MCT is also significant in exhuming high-grade rocks in the area [34].
The ability exists to track garnet growth at high resolution [49,53,54,55,56]. The approach is best applied to garnets that preserve prograde, gradational core to rim zoning profiles and appear to behave in a closed system with minimal alteration after growth. High-resolution garnet-based P-T paths from NW India and central Nepal are consistent with a model in which the MCT shear zone experienced multiple deformation episodes within its footwall [49,53,54]. This study aims to apply a similar approach to rocks collected from the MCT shear zone in the Sikkim region [5,6]. The MCT is considered the surface expression of the MHT, e.g., [57]; thus, the data is relevant to understanding how convergence operated here in the past and provides insight into the geodynamics of this region, which appears to be an anomalous zone across and within the Himalayan orogenic belt.
2. Materials and Methods
2.1. Samples
Garnet-bearing assemblages were collected along the Tista (Teesta) River and its tributaries in the Sikkim region in the vicinity of the mapped MCT (Figure 1). Some have reported conventional P-T conditions (garnet-biotite thermometry and garnet-biotite-muscovite-plagioclase barometry) [58,59,60] and secondary ion mass spectrometry (SIMS) Th-Pb monazite ages [5,6] (Table 1). Figure 1 shows the average ages of these and other samples nearby that were dated but not used for new P-T estimations.
Samples KBP1062A and KBP1062C are from the LHF, considered the footwall of the MCT shear zone. These are placed in the Daling Group’s Gorubathan Formation using [26], but very near a thrust contact of this unit and the Lingtse Gneiss (Figure 1). The Gorubathan Formation is described as containing seven distinct units: (1) interbedded chlorite/sericite schist or phyllite and quartzite, (2) metagraywacke, (3) black slate, (4) biotite phyllite/mica schist, (5) biotite quartzite, (6) mica schist with garnet ± staurolite, and (7) chlorite quartzite [26,61]. KBP1062A and KBP1062C are mica schists with the assemblage of garnet + biotite + muscovite + plagioclase + chlorite + ilmenite + apatite + monazite + zircon + xenotime + quartz. KBP1062A has staurolite, whereas KBP1062C has sillimanite that appears to form at the expense of biotite. Both samples have 11–12 Ma monazite inclusions in garnet [5,6].
The Lingtse Gneiss has a Paleoproterozoic granitic protolith [4,61,62,63]. These gneisses occur as thick bands that trend NW–SE west of Gangtok (Figure 1). Sample CHG14102 is part of this unit, collected from an exposure located south of KBP1062A and KBP1062C (Figure 1). This sample has the mineral assemblage of garnet + biotite + muscovite + plagioclase + chlorite (prograde and retrograde) + staurolite + ilmenite + apatite + monazite + zircon + xenotime + quartz. Sample CHG14013 is collected near CHG14012 but is part of the mica-schist portion of the Gorubathan Formation. This sample has garnet + biotite + staurolite + muscovite + plagioclase + chlorite + ilmenite + zircon + monazite + xenotime + apatite + allanite + quartz. CHG14103 has matrix monazite from 11.9 ± 0.3 Ma to 13.8 ± 0.5 Ma and inclusions in staurolite are 12–14 Ma [5].

Table 1.
P-T-t information from samples collected and analyzed in this study.
Table 1.
P-T-t information from samples collected and analyzed in this study.
| Sample | Formation from [26] | Th-Pb Monazite Age (Ma, ±1σ) a | T-D Core P (kbar) b | T-D Core T (°C) b | T-D Rim P (kbar) c | T-D Rim T (°C) c | Conv Rim P (kbar) d | Conv. Rim T (°C) d |
|---|---|---|---|---|---|---|---|---|
| Greater Himalayan Crystallines | ||||||||
| LCG542 | Kanchenjunga/Darjeeling | 25.6 ± 0.3 to 18.8 ± 0.5 | 3.5 ± 0.5 | 520 ± 5 | 4.4 | 675 | n.d. | 560 ± 25 |
| LCG752 | Kanchenjunga/Darjeeling | n.d. | 8.2 ± 0.5 | 750 ± 10 | 10.0 | 780 | >10 | 700 ± 25 |
| Main Central Thrust Shear Zone | ||||||||
| CMP860 | Chungthang | 20.5 ± 0.5 to 10.3 ± 0.2 | 4.5 ± 0.2 | 580 ± 20 | 6.2 | 630 | 6.0 ± 1.0 | 650 ± 25 |
| CMP862 | Chungthang | n.d. | 7.3 ± 0.5 | 560 ± 10 | 6.3 | 587 | >10 | 875 ± 50 |
| LCG753 | Chungthang | n.d. | 6.1 ± 0.5 | 610 ± 20 | 6.4 | 617 | >10 | 900 ± 50 |
| Lesser Himalayan Formation | ||||||||
| KBP1062A | Gorubathan | 14.2 ± 1.1 to 10.5 ± 0.2 | 4.5 ± 0.5 | 540 ± 10 | 6.7 | 650 | 7.5 ± 0.5 | 610 ± 25 |
| KBP1062C | Gorubathan | 18.3 ± 0.1 to 11.5 ± 0.2 | 4.8 ± 0.2 | 540 ± 5 | 5.7 | 633 | 8.2 ± 1.2 | 730 ± 40 |
| CHG14102 | Lingtse Gneiss | n.d. | 4.7 ± 0.5 | 530 ± 10 | 5.3 | 578 | 9.6 ± 1.2 | 660 ± 40 |
| CHG14103 | Gorubathan | 13.8 ± 0.5 to 11.9 ± 0.3 | 5.5 ± 0.5 | 560 ± 10 | 6.0 | 580 | 6.0 ± 1.0 | 525 ± 25 |
a Th-Pb SIMS age of youngest and oldest monazite age reported in [5,6]. Abbreviation “n.d.” means not determined. b Theriak-Domino (T-D) P-T conditions estimated using overlapping garnet isopleths in isochemical phase diagrams. The uncertainty reported is the area of overlap and is likely underestimated. c Theriak-Domino (T-D) P-T conditions reported from the last point in the high-resolution P-T path for the sample that yielded the highest T. Uncertainty is conservatively estimated to be ±25 °C and ±0.5 kbar. d Conventional (Conv) P-T conditions estimated using garnet-biotite-muscovite-plagioclase barometry [60] and garnet-biotite thermometry [58,59]. Pressure for sample LCG752 was estimated using garnet-biotite-plagioclase barometry because muscovite could not be found in the rock. The data include previous results in [5,6] and new estimations. Uncertainty is the range in conditions estimated from a plot of lines of equilibria. Abbreviation “n.d.” means not determined. See more detail data in supplementary Excel File S1 and S2.
Both the Gorubathan Formation and the Lingtse Gneiss are considered lower portions of the LHF, e.g., [61,64] and are further categorized by some as part of the Daling Group, a unit with intercalated sedimentary and igneous-origin protoliths [61,64,65,66,67]. The Lingtse gneiss has its origins in intrusions of granite/diorite plutons within the northern margin of the Paleoproterozoic of India [61,68,69,70]. Samples from these units experienced subsequent metamorphism during Indo–Asia collision and have Miocene monazite ages (Table 1; Figure 1).
Based on [26], samples CMP860, CMP862, and LCG753 are from the Chungthang Formation (MCT shear zone). These highly deformed, metamorphosed rocks are calc-quartzites, calc-silicates, calc granulites and gneisses. Evidence of thrusting is present as shear zones in calcareous quartzite [6]. Mapping by [26] places sample CMP862 at the contact between the Chungthang Formation and Lingtse gneiss, whereas CMP860 and LCG753 are from near Chungthang Formation–Kanchenjunga Gneiss/Darjeeling Gneiss contact. The Chungthang Formation, Kanchenjunga Formation, and Darjeeling Gneiss are part of the GHC [1,6]. However, the Chungthang Formation–Lingtse gneiss and Chungthang Formation–Kanchenjunga Gneiss/Darjeeling Gneiss contacts are considered part of the MCT shear zone (near the MCT-I and MCT-II, respectively) [4,14,29,71,72]. The particular area where these samples were collected has been of significant interest regarding landslide hazards e.g., [73,74,75].
Sample CMP860 has garnet + biotite + sillimanite + muscovite + plagioclase + chlorite + ilmenite + monazite + tourmaline + zircon + apatite + allanite + quartz. Monazite inclusions in garnet in the sample are 20.5 ± 0.6 Ma, 13.8 ± 0.8 Ma, 11.2 ± 0.3 Ma, and 10.8 ± 0.3 Ma (Th-Pb, SIMS, ±1σ) [5]. Samples CMP862 and LCG753 have a similar assemblage in that both have kyanite and sillimanite. However, muscovite could be found in LCG753. Specifically, CMP862 has garnet + biotite + kyanite + sillimanite + muscovite + plagioclase + ilmenite + zircon + quartz, with sillimanite forming of kyanite grains. Sample LGC753 has garnet + biotite + kyanite + sillimanite + plagioclase + chlorite + graphite + ilmenite + monazite + tourmaline + zircon + apatite + allanite + quartz.
Samples LCG752 and LCG542 are from within the unit mapped as the Kanchenjunga Gneiss/Darjeeling Gneiss by [26]. Mapping of these rocks as individual units is challenging because of the frequent interchanging and gradational features among themselves [76]. This Kanchenjunga Gneiss consists of augen gneisses, quartzites, amphibolites, and garnet-bearing migmatite gneiss [4,6]. Darjeeling schists and gneisses are medium to high-grade metamorphic rocks and show gradational contact with the Daling Formation. Garnet ± staurolite schists form lower members of the Darjeeling rocks and show effects of retrogression, shearing, and mylonitization [6]. LCG542 has garnet + biotite + muscovite + plagioclase + staurolite + chlorite + ilmenite + monazite + tourmaline + zircon + apatite + allanite + quartz. LCG752 has a similar mineral assemblage but contains no staurolite and has rutile. No muscovite could be found in this rock. LCG542 contains monazite inclusions that average 22.7 ± 0.3 Ma [5]. Matrix monazite grains in the rock average 21.9 ± 0.7 Ma [5]. Other samples collected nearby also have Miocene monazite ages (Figure 1).
2.2. Analysis
New P-T data are reported from the assemblages listed in Table 1 using both isochemical phase diagrams and conventional thermobarometric approaches. For conventional P-T conditions, we obtained P-T conditions from the lowest Mn garnet rim paired with matrix minerals and used the same calibrations as reported in [5,6]. Entire thin sections were element mapped to understand microstructural information and elemental distributions in Mn, Ca, Fe, Mg, and Si. Transects were selected across garnets that appeared to preserve their prograde compositions. In some cases, several transects across the garnets were made to use as input to construct multiple P-T paths. Garnet compositions used for the P-T paths’ estimations are the same as reported in [5] and new compositional data taken using the JEOL 8200 microprobe (EMP) in UT Austin’s Dept. Geological Sciences Geomaterials Characterization and ImaGing Facility (GeoMatCI). We targeted the largest garnets with the highest Mn cores and showing minimal indications of retrogression. Data from the samples and the modeling results are available in the Texas Data Repository.
Bulk rock compositions of each sample were obtained from rock chips using inductively coupled plasma spectrometry (ICP) (Table 2) at Activation Laboratories (Ancaster, ON, Canada). The weight percent (wt%) data from these samples were recalculated to molar wt% and normalized to use as direct input for developing the isochemical phase diagrams. Minor changes were made to some compositions as indicated in Table 2. These changes facilitated the intersection of garnet core isopleths.

Table 2.
Bulk rock compositions (molar wt%) from sample analyzed in this study.
For the isochemical phase diagrams, we used the program Theriak-Domino [77,78] and the [79] thermodynamic dataset with updates to solution models through 2010. Appropriate mixing models in the system MnO-Na2O-CaO-K2O-FeO-MgO-Al2O3-SiO2-H2O-TiO2 were used. Solution models are feldspar [80,81], garnet [82,83,84,85], biotite [81,83], chlorite [86], white mica [87], ilmenite (Ideal Mn-Mg-Fe solution), staurolite [79,82], and chloritoid [82,84]. The system was considered to form in the presence of water (activity of H2O = 1.0), and the iron oxidation state was 2+. We assume H2O saturation (i.e., H2O (100) in Theriak-Domino).
To approximate the garnet core conditions, isopleths of ±0.02 mole fraction spessartine, grossular, pyrope, and almandine from the garnet’s highest Mn content were overlain on the diagram. This location of the intersection also allows the prediction of the mineral assemblage that existed in the sample when the core was formed and the reaction that created garnet. Table 1 reports a summary of core conditions.
Garnet zoning profiles were smoothed using a Savitzky–Golay function, and data points were added to minimize the impact of missing analyses due to inclusions or cracks. Although one cannot use the raw electron microprobe data to generate the high-resolution P-T path, the P-T paths predict garnet zoning, and a comparison can be made between the model and raw data prediction once the path is complete.
The process of generating the high-resolution P-T path requires a MATLAB script to apply the Theriak-Domino to search a P-T grid for the smallest misfit between the modeled garnet core and measured composition. Then, the calculated portion of the bulk composition is sequestered in the first step of garnet growth [88]. Next, sequestered components are subtracted from the original rock bulk composition to estimate an “effective” bulk composition for the next step of garnet growth. The process repeats for all data points from core to rim. Each step along a garnet traverse yields an estimate of the P-T conditions of incremental growth and a new effective bulk rock composition, ultimately culminating in a high-resolution P-T path. The last step for the P-T path predicts the peak P-T conditions experienced by the last data point in the garnet at its rim. The conditions for the highest T step are indicated in Table 1 as the rim P-T condition.
2.3. Uncertainties in Approach
The high-resolution P-T paths approximate how a garnet with a specific type of compositional zoning would behave as reactions proceeded following equilibrium in a closed system of a known bulk composition as it evolves during increasing T. Although rocks are open systems, the approach we apply here treats them as ideal closed systems that follow the constraints outlined by the thermodynamic datasets and programs used. The uncertainty in molar enthalpy of formation, molar entropy, molar volume, heat capacity, bulk modulus, Landau parameters, and Margules parameters of the modeled mineral phases also plays a role [79,89,90]. We assume equilibrium, closed system behavior, and that the primary composition of the mineral phases and the bulk rock have not changed significantly [90]. Uncertainty is challenging to determine due to many factors incorporated into the Theriak-Domino approach [53,54,55]. For example, the compositional core we analyzed may not coincide with the geometric garnet center [91]. Therefore, the conditions we report for the core may be too precise. In addition, the presence of inclusions in garnet allows for the potential of modification of garnet compositions that could occur after growth, thereby affecting the P-T path, which relies on closely spaced data points across the garnet [92,93].
The bulk rock compositions were modified by interpolation for six samples to force garnet core isopleth intersections (Table 1). However, the modifications are minor for most samples and constitute < 3% of the ICP values. MCT shear zone sample LCG753 required the most modification of the ICP results (1 wt% added to FeO and 6 wt% added to MgO and removed from SiO2). The choice of the appropriate rock composition is a source of uncertainty and has a significant impact on the results, e.g., [90].
Despite these issues, tests exist to check the feasibility of the P-T path and isopleth conditions. These tests include if garnet isopleths intersect and if the results seem geologically reasonable and consistent with mineral assemblages. In addition, the P-T paths themselves predict garnet zoning, so the user can compare to evaluate the degree of reproducibility. The strategy has proven successful in other studies [49,53,54,55,88,94,95].
Overall, the high-resolution P-T paths should be used as our best estimate for how a sample with a similar bulk composition as the one we collected in the field produced garnet under varying P-T conditions if it behaved as a closed system. A closed system implies that it was not subjected to significant changes in bulk rock composition over its metamorphic history, did not experience retrogression, and obeyed thermodynamic laws and principles. We include a comparison to conventional P-T estimates for most samples to gauge how exchange thermometers or net-transfer barometers result in similar conditions (Table 1). In addition, we compare our results to other samples collected nearby from previous studies [27,28].
3. Results
3.1. LHF Samples
LHF samples KBP1062A, KBP1062C, CHG14103 were collected from the Gorubathan Formation, whereas CHG14102 was collected from the Lingtse gneiss (Figure 1). Figure 2, Figure 3, Figure 4 and Figure 5 show the X-ray element maps of the garnets analyzed in the samples, as well as transects across garnets in the samples. The Gorubathan Formation garnets are similar in that all show prograde zoning with higher Mn cores and lower Mn rims. Garnets in samples KBP1062A and KBP1062C show minor increases in Mn at the rims, consistent with some diffusional modification since growth (Figure 2A and Figure 3A). A garnet in KBP1062C is fragmented along a microcrack and may have experienced significant resorption (Figure 3A–D). Portions of the garnet that show alteration textures were not used in the high-resolution P-T paths modeling for these or other samples.
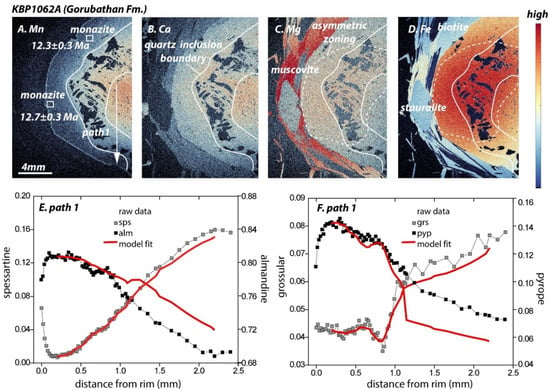
Figure 2.
X-ray element maps of sample KBP1062A (Gorubathan Fm.) in (A) Mn, (B) Ca, (C) Mg, and (D) Fe. X-map tools were used to develop the maps in this and other figures [96]. Garnet compositions in spessartine (sps) and almandine (alm) (panel E) and grossular (grs) and pyrope (pyp) (panel F) were taken across the core to rim transect in panel (A). Monazite inclusions in garnet were dated in this sample by [5], who also reported the compositional data. The red lines in panels (E,F) show the prediction of the high-resolution P-T path generated for this garnet. The solid white line shows the boundary of the large quartz inclusions, whereas the dashed white line highlights the asymmetric zoning pattern in Mg and Fe.
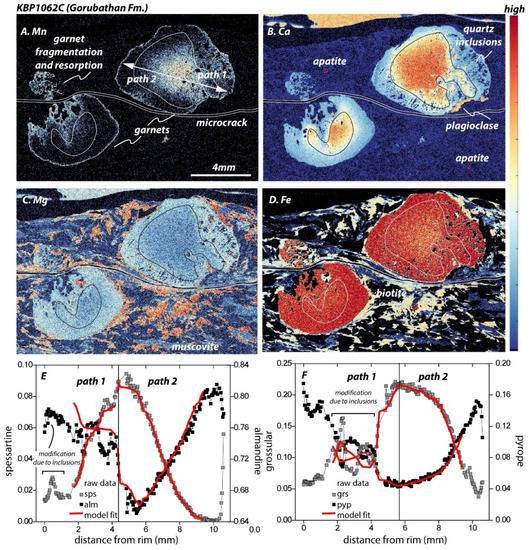
Figure 3.
X-ray element maps of sample KBP1062C (Gorubathan Fm.) in (A) Mn, (B) Ca, (C) Mg, and (D) Fe. Garnet compositions in spessartine (sps) and almandine (alm) (panel E) and grossular (grs) and pyrope (pyp) (panel F) were taken across the rim to rim transect in panel (A). The red lines in panels (E,F) show the prediction of two high-resolution P-T paths generated for this sample. We also indicate the presence of a large microcrack that cuts a garnet in the left side of the X-ray element maps and highlight the presence of quartz inclusions that appear to have modified compositions used to generate path 1 for this garnet.
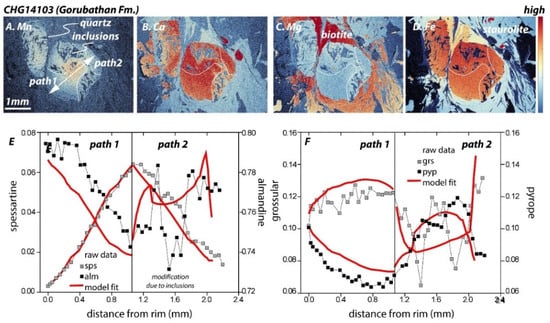
Figure 4.
X-ray element maps of sample CHG14103 (Gorubathan Fm.) in (A) Mn, (B) Ca, (C) Mg, and (D) Fe. Garnet compositions in spessartine (sps) and almandine (alm) (panel E) and grossular (grs) and pyrope (pyp) (panel F) were taken across the rim to rim transect in panel (A). The red lines in panels (E,F) show the prediction of two high-resolution P-T paths generated for this sample. We also indicate the presence of quartz inclusions that appear to have modified compositions used to generate path 2 for this garnet.
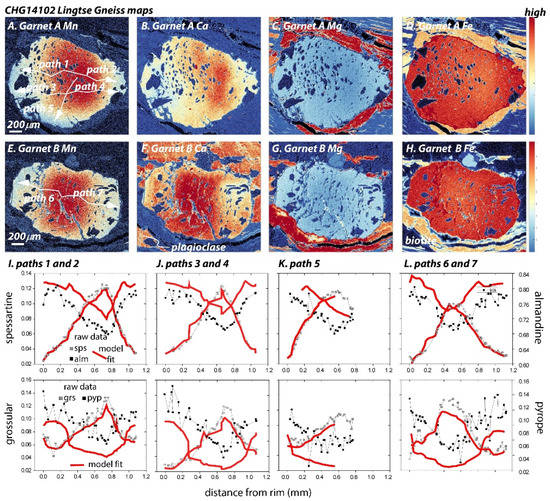
Figure 5.
X-ray element maps of sample CHG14102 (Lingtse Gneiss) in (A) and (E) Mn, (B) and (F) Ca, (C) and (G) Mg, and (D) and (H) Fe. Garnet compositions in spessartine (sps) and almandine (alm) (upper panels I–L) and grossular (grs) and pyrope (pyp) (lower panels I–L) were taken across the rim to rim transects identified in panels (A,E). The red lines in panels (I–L) show the prediction of the high-resolution P-T paths generated for this sample.
X-ray maps also show these samples do not follow simple core-centered concentric zoning patterns. For example, sample KBP1062A shows higher Fe and Mg in the mid-rim region with higher Mn and Ca in the central portion of the garnet (Figure 2A). The zoning is likely related to Fe-Mg exchange with a staurolite grain that impinges on the garnet.
These garnets also show the presence of anhedral quartz inclusions at mid-rim (KBP1062A, Figure 2) or the rim (KBP1062C and CHG14013, Figure 3 and Figure 4). Quartz inclusions in the LHF samples appear in locations where the garnet composition may have been modified and would result in P-T paths generated for the garnet appearing dissimilar to that generated using a portion of the garnet that was inclusion free. For example, the slight increase and then decrease in Mn at the rim and the spikes in Ca at the mid-rim of path 1 in KBP1062C garnet is likely the result of the transect nearing an inclusion-rich region and was not generated during prograde growth (Figure 3E). This issue also affects path 2 in sample CHG14103, which also shows a modification in the mid-rim region (Figure 4E,F). Because the high-resolution P-T paths approach relies on garnet compositional data taken at close space intervals, the expectation is that these garnets would yield different P-T paths from the same garnet. The inclusion-rich region provides ample potential for diffusion or retrogression. The asymmetry of the garnet zoning would also play a role in determining the shapes of P-T paths generated for these rocks.
Overall, however, the LHF garnet transects show similar zoning profiles in almandine and pyrope with higher Fe and Mg contents at the rims and lower Fe and Mg cores. Grossular profiles have lower Ca rims than cores (Figure 2, Figure 3, Figure 4 and Figure 5). Sample KBP1062C shows a slight increase in Ca at the rim, near where the Mn also increases, suggesting this could be a retrograde effect (Figure 3E,F). Garnets in the Lingtse Gneiss sample CHG14012 have larger quartz inclusions near the rims of the garnets and smaller, rounded in their cores (Figure 5). The spikes in this sample’s compositions are also likely due to some compositional modification. These garnets are significantly smaller (~1 mm in longest diameter) than those analyzed in the Gorubathan Formation, which could reach 10 mm in longest diameter.
The high-resolution P-T paths for these samples are presented in Figure 6. The core conditions for each sample suggest garnet formed in the rock due to the dehydration of chlorite, which is present before the garnet-in reaction line, labeled as +Grt in all samples. Garnet core conditions for each sample lie near the garnet-in reaction line, forming between 530–560 °C and 4–5.5 kbar in each sample (Table 1). All garnets appeared to grow for 100 °C, reaching 580–650 °C (Table 1). The Gorubathan formation rocks KBP1062A and KBP1062C reached the highest P to ~7 kbar, whereas samples CHG14102 and CHG14103 reached ~6 kbar (Figure 6).
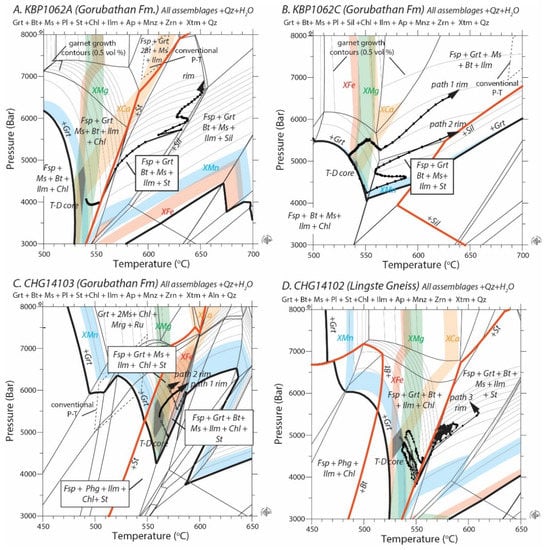
Figure 6.
Isochemical phase diagrams and high-resolution P-T paths for samples (A) KBP1062A, (B) KBP1062C, (C) CHG14103, and (D) CHG14102. Mineral assemblages for the samples are listed under the sample names. In each diagram, the colored bars represent isopleths ±0.2 mole fraction of the garnet composition from the highest Mn portion of the garnet. Blue = spessartine content, green = pyrope, orange = grossular, and red = almandine. The intersection of the colored bars represents the garnet core conditions. Some mineral stability fields are labeled and indicate relevant reactions that mark the appearance of index minerals. Mineral abbreviations in this panel and elsewhere are after [97].
P-T paths for the Gorubathan Formation show minor fluctuations in T, which could be caused by the Theriak-Domino program searching for the best fit for the conditions represented by this portion of the garnet. We have more confidence in path 2 in sample KBP1062C and path 1 in CHG14013 because these transects avoided large inclusions that may have modified primary garnet zoning. As the sample was buried, these paths increased in T, similar to KBP1062A. This is our best approximation for how the rock evolved during metamorphism using this approach. The paths generated in Lingtse gneiss sample CHG14102 suggest a different tectonic history, with the garnets recording a P decrease from 5 kbar to 4 kbar followed by an increase to 6 kbar (Figure 6D) as T increased.
Comparing the conditions of the garnet rim generated by the paths that yielded with the highest T conditions, we find that they differ from those generated using conventional thermometers and barometers (Figure 7; Table 1). All high-resolution P-T paths from the Gorubathan Formation samples suggest rim conditions are lower in P-T than those generated using conventional approaches. The P-T path from Lingtse Gneiss sample CHG14103 suggests the garnet was hotter than the conventional data but experienced a similar P. The conventional conditions are inconsistent with the mineral assemblages predicted by the P-T paths. For example, KBP1062A, CHG14013, and CHG14102 contain staurolite, but their conventional P-T conditions lie in fields where staurolite would be unstable based on their bulk composition and isochemical phase diagrams (Figure 7). Likewise, KBP1062C has sillimanite, but this would not be predicted to be stable at its conventional P-T conditions. The high-resolution P-T path 2 in KBP1062C reaches the sillimanite field (Figure 6B).
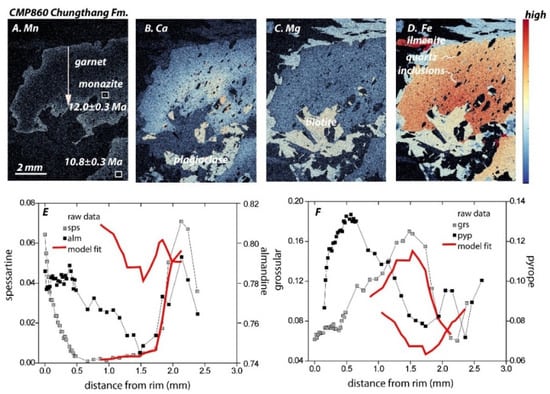
Figure 7.
X-ray element maps of sample CMP860 (Chungthang Fm) in (A) Mn, (B) Ca, (C) Mg, and (D) Fe. Garnet compositions in spessartine (sps) and almandine (alm) (panels E) and grossular (grs) and pyrope (pyp) (panels F) were taken across the rim to rim transects identified in panels (A) and (E). The red lines in panels (E,F) show the prediction of the high-resolution P-T paths generated for this sample. Monazite inclusions in garnet were dated in this sample by [5], who also reported the compositional data.
The use of conventional thermobarometers may be hindered by disequilibrium among phases or the application of barometers to inappropriate (uncalibrated) mineral compositions. The high-resolution P-T paths for the samples reflect how a garnet that had the compositional zoning indicated by the red lines in the compositional transect in 2–5 grew in the bulk compositions reported in Table 2. Confidence in the high-resolution P-T path approach reflecting the reality of how these garnets grew is provided by these paths reproducing the measured garnet zoning. For example, path 2 in sample KBP1062C has the most excellent fit, with the P-T path garnet zoning prediction lying entirely within the raw data for the garnet compositions (Figure 3E,F). Sample KBP1062A shows the best fit in terms of the garnet composition at the rims (Figure 2E,F), suggesting that the latter portion of the path may be more reliable than the earlier stages. The other samples show the best fit in terms of Mn and Ca contents, although all samples match garnet zoning within ±0.1 mole fraction.
3.2. MCT Shear Zone Samples
The MCT shear zone samples CMP860, CMP862, and LCG753 were collected from the Chungthang Formation (Figure 1; Table 1). Figure 7, Figure 8 and Figure 9 show X-ray element maps and garnet compositional data from these rocks. Samples CMP860 and LCG753 have larger garnets (~10 mm in diameter) compared to CMP862 (~3 mm in diameter). Only the mid-rim to rim transect was collected from sample CMP860 [5].
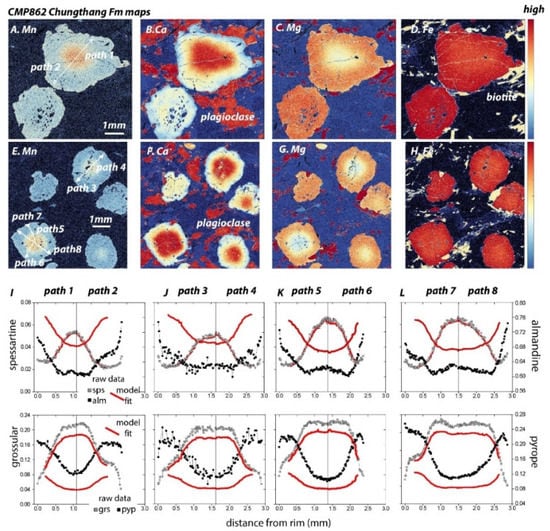
Figure 8.
X-ray element maps of sample CMP862 (Chungthang Fm) in in (A) and (E) Mn, (B) and (F) Ca, (C) and (G) Mg, and (D) and (H) Fe. Garnet compositions in spessartine (sps) and almandine (alm) (upper panels E–L) and grossular (grs) and pyrope (pyp) (lower panels I–L) were taken across the rim to rim transects identified in panels (A,E). The red lines in panels (I–L) show the prediction of the high-resolution P-T paths generated for this sample.
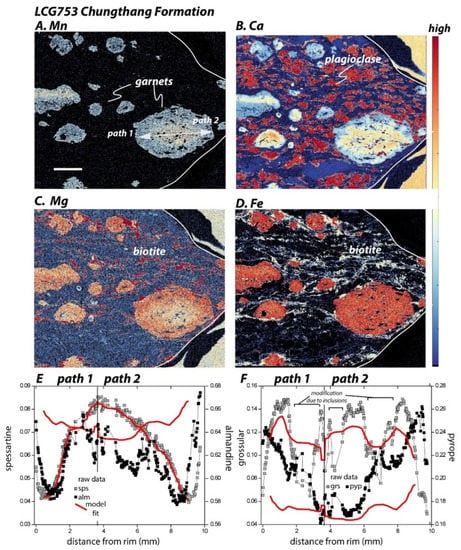
Figure 9.
X-ray element maps of sample LCG753 (Chungthang Fm) in (A) Mn, (B) Ca, (C) Mg, and (D) Fe. Garnet compositions in spessartine (sps) and almandine (alm) (panel E) and grossular (grs) and pyrope (pyp) (panel F) were taken across the rim to rim transects identified in panel (A). The red lines in panels (E,F) show the prediction of the high-resolution P-T paths generated for this sample. Areas on the garnet speculated to be affected by diffusional modification are indicated on panel (F).
These garnets preserve evidence of prograde growth as represented by higher Mn cores than rims, but all show Mn increase at the rims. All samples also decrease in Ca towards the rims, but LCG753 has fluctuations in grossular, almandine, and pyrope (Figure 9F). This sample has quartz inclusions, which appear to have affected the garnet chemical zoning near them. In LHF samples and CMP862, spessartine and almandine zoning show opposite trends, but in CMP860 and LCG753, the trends for these components are roughly parallel. All samples show the opposite grossular and pyrope zoning trends from rim to rim across the garnets, as also seen in the LHF rocks.
P-T paths and garnet isopleth intersections from the Chungthang Formation samples are shown in Figure 10. Isopleth intersections taken from the highest Mn contents do not lie near the garnet-in reaction line, suggesting the compositions are not from the true garnet core. The composition from the CMP860 garnet is from the mid-rim region due to its large size and records the lowest P-T conditions at 4.5 ± 2 kbar and 580 ± 20 °C. For sample CMP862, the intersection appears at 7.3 ± 0.5 kbar and a similar T of 560 ± 10 °C. The intersection lies between the 0.5 and 1.5 vol% garnet growth contour lines. Isopleth intersections for samples LCG753 lie between the 2.5–3 vol% garnet contour line at a lower P of 6.1 ± 0.5 kbar and 610 ± 20 °C
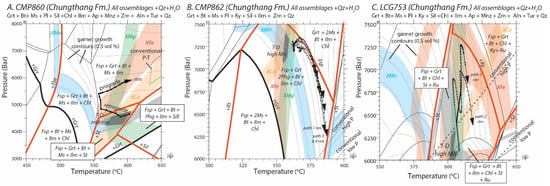
Figure 10.
Isochemical phase diagrams and high-resolution P-T paths for Chungthang Formation samples (A) CMP860, (B) CMP862, (C) LCG753. Mineral assemblages for the samples are listed under the sample names. In each diagram, the colored bars represent isopleths ±0.2 mole fraction of the garnet composition from the highest Mn portion of the garnet. Blue = spessartine content, green = pyrope, orange = grossular, and red = almandine. Where these color bars intercept are the conditions for the highest Mn portion of the garnet. For sample CMP860, the composition was taken from the garnet mid-rim. Some reactions are labeled. We indicate relevant reactions that mark the appearance of index minerals with thicker lines.
The P-T path from CMP860 is clockwise, with an initial retrograde portion, followed by isothermal burial and then prograde burial during heating (Figure 10A). The retrograde path crosses the staurolite-out reaction and with the rim lying in the field where plagioclase + garnet + biotite + muscovite + ilmenite + quartz + H2O is stable. P-T paths from samples CMP862 and LCG753 are consistent with a hairpin shape and show a P increase followed by a P decrease over a short T interval. The eight P-T paths in sample CMP862 follow the same trend, whereas the two in LCG753 differ as path 2 shows a P fluctuation not present in path 1. This fluctuation is likely due to asymmetrical zoning in the garnet due to quartz inclusions located near two higher Ca peaks in path 2, and is reflected in the P-T path (Figure 9E,F). Garnet zoning in sample CMP862 is symmetrical (Figure 8I–L). The rim of CMP862 lies within the field of plagioclase + garnet + biotite + muscovite + ilmenite + quartz + H2O (Figure 10B), whereas that of LCG753 is similar but within a field where muscovite is unstable and staurolite is predicted to be present (Figure 10C).
Sillimanite is a key index mineral in sample CMP860, whereas kyanite and sillimanite are observed in CMP862 and LCG753. No rocks contain staurolite, and muscovite was not found in LCG753. The conventional rim P-T conditions for all Chungthang samples are similar in P but higher in T than that suggested by the high-resolution P-T path (Figure 10 and Figure 11; Table 1). The sillimanite-in reaction line occurs at lower P and higher T than observed by the conventional conditions and high-resolution P-T path rim in sample CMP860 (Figure 10A). The rim conditions suggested by the mineral assemblage of this sample are within 600–650 °C and 3.5–5.5 kbar (Figure 10A).
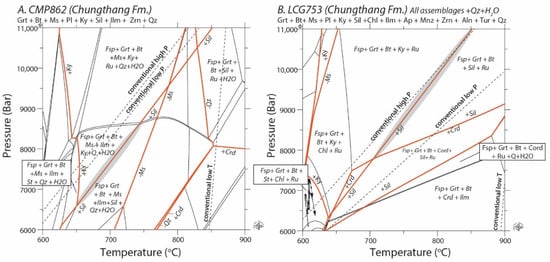
Figure 11.
Isochemical phase diagrams Chungthang Formation samples (A) CMP862 and (B) LCG753. In each diagram the appearance of key index minerals are shown by labeled orange lines. The conventional P-T lines of equilibria are shown as dashed lines. These would predict very high P-T conditions outside the boundary of the diagrams. The high-resolution P-T paths are shown in panel (B). The grey area in CMP862 is consistent with the mineral assemblage observed in the sample.
The conventional P conditions estimated for CMP862 and LCG753 are similar to that predicted by the high-resolution P-path, but the conventional T are significantly higher (~875–900 °C) (Figure 11). According to isochemical phase diagram modeling, the conventional thermal conditions for CMP862 would lie in the realm where quartz is absent from the rock (Figure 11A), inconsistent with its mineral assemblage. Likewise, sample LCG753 has no staurolite, making its assemblage inconsistent with the isochemical phase diagram modeling. However, the assemblages from these rocks contain both kyanite and sillimanite, which suggests the samples would lie along the kyanite–sillimanite reaction lines shown in Figure 11. In the case of CMP862, this would be between 650–740 °C and 6.5–8.5 kbar, and LCG753 would be at T >700 °C and P >8 kbar.
The results for the Chungthang Formation samples suggest that they experienced open system behavior and alteration since its formation. As with the LHF rocks, the high-resolution P-T paths for the samples reflect how a garnet with zoning indicated by the red lines in the transects (Figure 7, Figure 8 and Figure 9) grew in specific bulk compositions (Table 2) if they were closed systems and experienced equilibrium. Exploration of the consistency of the mineral assemblages with the conditions suggested by the approach indicates that these constraints are likely not applicable to the rocks. The P-T path predictions for garnet zoning in sample CMP862 and LCG753 best fit the spessartine composition but less so for almandine and pyrope. The P-T path model for CMP862 better predicts the rim portion of the grossular composition of the garnet compared to its cores, and the inclusions in LCG753 make the generation of the path challenging as compositions may be altered near the inclusions.
If the shapes and not the conditions remain valuable, the P-T path model and measured garnet compositional fits for sample CMP860 suggest that the P-T path could reflect a portion of the retrograde path for this sample. The garnet is conspicuously resorbed, corroded by biotite and plagioclase, and has an Mn-rich rim (Figure 7). In contrast, the hairpin P-T path shapes for CMP862 and LCG753 are consistent with imbrication (see discussion).
3.3. GHC Samples
The MCT shear zone samples LCG542 and LCG752 were collected from the Kanchenjunga/Darjeeling Formation (Figure 1). X-ray element maps and garnet zoning profiles from these samples are shown in Figure 12 and Figure 13. As with the other samples, these rocks show preservation of prograde zoning, with high spessartine cores and lower spessartine rims. For most samples, almandine and spessartine zoning have opposite compositional trends from core to rim. The grossular and pyrope contents in the larger LCG752 garnet also show opposite zoning trends, but this is not the case for its smaller garnet. The smaller garnet fluctuates in grossular. Its smaller size and compositional zoning suggest it might have grown later than the larger grain. Note that the larger garnet has a Ca increase near the rim but the compositional transect did not intersect this portion. The lower Fe portion of the larger garnet is asymmetrical but is confined to the core in the smaller garnet.
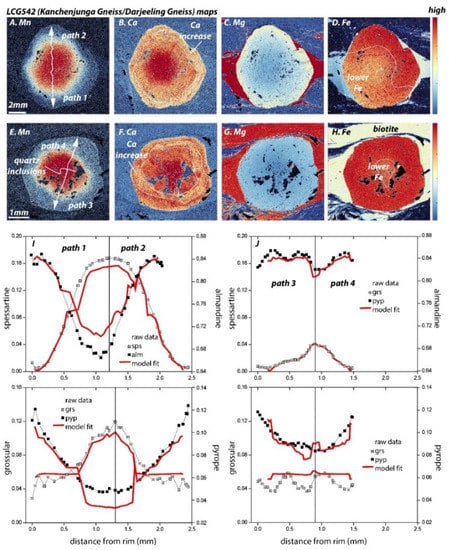
Figure 12.
X-ray element maps of sample LCG542 (Kanchenjunga/Darjeeling Gneiss) in (A) and (E) Mn, (B) and (F) Ca, (C) and (G) Mg, and (D) and (H) Fe. Garnet compositions in spessartine (sps) and almandine (alm) (upper panel I,J) and grossular (grs) and pyrope (pyp) (lower panels I,J) were taken across the rim to rim transects identified in panels (A,E). The red lines in panels (I,J) show the prediction of the high-resolution P-T paths generated for this sample.
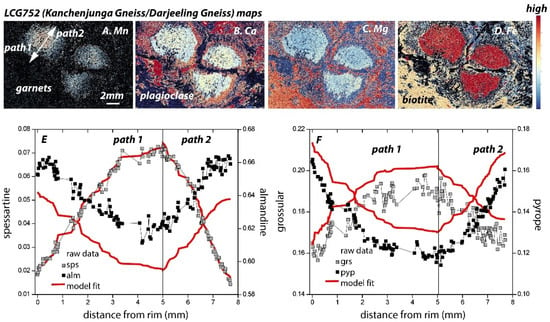
Figure 13.
X-ray element maps of sample LCG752 (Kanchenjunga/Darjeeling Gneiss) in (A) Mn, (B) Ca, (C) Mg, and (D) Fe. Garnet compositions in spessartine (sps) and almandine (alm) (panel E) and grossular (grs) and pyrope (pyp) (panel F) were taken across the rim to rim transects identified in panel (A). The red lines in panels (E,F) show the prediction of the high-resolution P-T paths generated for this sample.
P-T paths and garnet isopleth intersections from GHC samples are shown in Figure 14. As with the MCT shear zone assemblages, the intersection is not at the garnet isograd, indicating compositions from the high Mn region do not reflect the true garnet core. For sample LCG542, the intersection is between the 0.5–1 vol% contour at 510–520 °C and 3.2–3.7 kbar. For sample LCG752, the intersection is between 0.5–2 vol% contour and at much higher-grade conditions of 730–750 °C and 8.9–9.5 kbar.
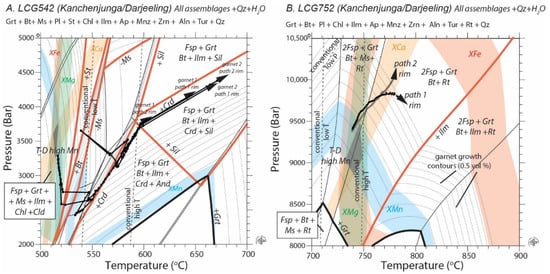
Figure 14.
Isochemical phase diagrams and high-resolution P-T paths for GHC samples (A) LCG542 and (B) LCG752. In each diagram, the colored bars represent isopleths ±0.2 mole fraction of the garnet composition from the highest Mn portion of the garnet. Blue = spessartine content, green = pyrope, orange = grossular, and red = almandine. Some mineral stability fields are labeled and relevant reactions that mark the appearance of some minerals are indicated. Dashed lines are the peak T conditions estimated using conventional thermobarometry.
The two P-T paths for the larger garnet sample LCG542 decrease in P from 3.2–2.5 kbar followed by an increase to 4.1 kbar over a T interval of 517–650 °C (Figure 14A). The two P-T paths from the smaller garnet have a similar shape, but its initial conditions overlap a larger volume% garnet growth contour line. These paths also extend to higher P-T conditions of 675 °C and 4.5 kbar. Paths from both garnets cross several significant lines that mark the appearance of significant index minerals, including staurolite and biotite, which are present in the rock. However, the paths imply that the sample should have lost muscovite and gained cordierite and sillimanite. These minerals are absent in the assemblage.
The P-T paths from sample LCG752 increase from 750–800 °C over a P interval of 9.4–10.3 kbar (Figure 14B). P-T path 1 decreases in P in its final stages, whereas path 2 increases. Path 2 contains more of the garnet and is longer than path 1, and may record more of the sample’s history. Muscovite was not found in the sample, which is predicted by the isochemical phase diagram modeling. However, the sample contains ilmenite, which is predicted to be present only at higher T conditions (Figure 14B). The conventional T conditions estimated for these samples are not the same as those estimated using the isochemical phase diagrams and garnet zoning. For example, the conventional T for LCG752 suggest the sample reached between 700–750 °C, conditions where we would expect muscovite to be stable (Figure 14B). Conventional P is high at >10 kbar. Only garnet-biotite thermometry was applied to sample LCG542, which yields T much lower (560 ± 25 °C) than the suggested high rim T (~675 °C) (Figure 14A; Table 1). However, the P-T paths predict garnet zoning (Figure 12 and Figure 13), and these predictions match the garnet zoning in all cases within ±0.1 mole fraction, lending confidence in the conditions generated using the isochemical phase diagrams. The best fit is with the spessartine content, as with most other samples.
4. Discussion
4.1. P-T Paths and Conditions
The appearance of specific index minerals has long been known to be strongly controlled by rock bulk composition and P-T conditions, e.g., [3,7,28,46,52,98,99,100]. Despite the recognized importance of rock bulk composition, mineral isograds from biotite-garnet-staurolite-kyanite-sillimanite are commonly mapped as extending the entire perimeter of the Tista dome, extending long distances roughly parallel to the MCT shear zone in both its northern and southern sections [27,28,52,101]. However, our observations of the mineral assemblages of the rocks examined here suggest that the placement of the isograds is similar to those shown in [7] (Figure 1). For example, KBP1062A contains staurolite, and KBP1062C has sillimanite. Both rocks are near each other and record similar peak P-T conditions. We speculate that the staurolite and sillimanite isograds are likely very close to each other in the northern portion of the MCT shear zone as indicated in [7] and Figure 1. The appearance of these minerals was likely controlled by the rock bulk composition and not a change in thermal conditions. The presence of both kyanite and sillimanite in samples CMP862 and LCG753 indicates that the kyanite isograd is warped or faulting, which may have influenced its present-day position. The recognition of disrupted mineral isograds or isograds controlled by rock bulk composition has implications for deciphering the applicability of specific models of collisional tectonics. The presence of continuous mineral isograds often plays a role in advocating for channel flow, e.g., [1,2,3].
Assumptions inherent in the approach taken to generate the P-T paths appear best exhibited by the LHF samples instead of the higher-grade rocks from the MCT shear zone and GHC. LHF footwall samples exhibit prograde zoning with minor retrogression, and the endpoint of the high-resolution P-T path conditions is within fields suggested by the sample’s mineral assemblage. In addition, the predicted P-T paths match the measured garnet zoning profiles. This match is exemplified remarkably well in the case of path 2 from sample KBP1062C and path 1 from CHG14103 (Figure 3 and Figure 4). Other paths from Figure 16; [27,28]). Paths from [27] show these samples show that inclusions or asymmetric garnet zoning can significantly alter the modeled path shape. These samples highlight the importance of where garnet compositions are taken. Diffusion or retrogression near inclusions could modify garnet compositions near inclusions, e.g., [92,93,99].
Figure 15A,B summarizes the P-T paths generated for samples in this study. We include some from previous work on samples collected near ours (Figure 1; Figure 15A,B, the same magnitude of P-T condition and follow the same shape as the prograde portion of the LHF paths we report. Path 1 from LHF samples KBP1062A and CHG14103 and path 2 from GHC rock LCG752 also record burial (increasing P as T increases).

Figure 15.
(A) Comparison of some P-T paths from this study and those in [27]. See Figure 1 for sample locations. Note the presence of some V-shaped P-T paths. (B) Hairpin P-T paths from MCT shear zone and GHC samples. We also include path predictions from [28]. (C) Predicted P-T path shapes for the GHC and LHF rocks if they experienced discrete thrusting (critical taper) or channel flow after [102].
Paths from [28], however, would suggest that the MCT shear zone experienced much higher peak P than those generated for LHF and MCT shear zone samples (8–9 kbar) (Figure 15B). Because this observation seemed at odds with the results and the data were available from the rocks, we used the bulk compositions and garnet core conditions provided by [29] to estimate the conditions for the garnet core analysis using the Theriak-Domino approach (Figure 16). Sample 60 is a coarse-grained schistose rock from the upper LHF collected near CMP862 [28,103]. The sample has garnets with large (several mm) staurolite inclusions in their rims. The peak assemblage is reported as garnet + staurolite + kyanite + biotite + muscovite. Biotite appears in some locations to retrogress to chlorite and ilmenite, and rutile reacts to ilmenite. Allanite is also present, but the accessory minerals apatite and rutile only appear within the garnet. Garnet zoning of the sample shows a bell-shaped spessartine profile with minimal retrogression. Grossular and spessartine steadily decrease from core to rim, and pyrope and almandine broadly increase from core to rim. Zoning is similar to that of CMP862, although almandine in sample 60 shows a minor decrease right at the garnet rim. Peak P-T conditions for the rock were estimated rock bulk compositions estimated using the program Perple_X_6.6.8 [104,105,106]. The authors calculated the rock bulk composition from the adapted XRF composition from the rock or evaluated the proportion of each mineral phase in the sample. In this case, element maps of the entire thin section representative of the whole rock and an area calculation software ImageJ (Rasband) with the average composition of each mineral phase were used. Pseudosections were validated by calculating isopleths of garnet pyrope, almandine, and spessartine compositions. The results are shown in Figure 15B.
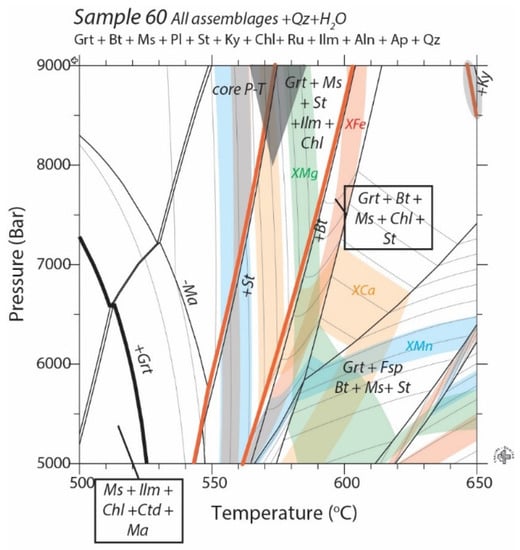
Figure 16.
Isochemical phase diagram for sample 60 using data reported from [28]. Some index mineral reaction lines are indicated. The core P-T condition is located indicted by core P-T. See Figure 1 and [28] for sample locations. Garnet isopleths are indicated and do not intersect (blue = spessartine content, green = pyrope, orange = grossular, and red = almandine). Some mineral stability fields are labeled.
Figure 16 shows the isochemical phase diagram for sample 60 using the methods applied in this study. Isopleths for the garnet core do not intersect, although some individual isopleths overlap. The core condition for sample 60 estimated by [28] lies outside the garnet-in reaction line and suggests that the true garnet core was not analyzed if the approach we apply is appropriate. The results highlight that different approaches will result in disparate outcomes, depending on several factors, including using different solution models and whether the rock experienced an open system and non-equilibrium behavior.
In most cases, the absolute values of the high-resolution P-T path rim conditions we generated and those from conventional thermobarometry are different, or only the P or T values are similar (Table 1). The results from conventional and isochemical modeling approaches for LHF samples overlap within the uncertainty (±25 °C and ±1 kbar). Still, the results differ for some others (MCT shear zone or the GHC). The check available for conventional thermobarometry is if the rim P-T condition falls within the stability field of the rock mineral assemblages. The high-resolution P-T path modeling approach provides additional checks, including if P-T estimations are appropriate for mineral assemblages and if the paths reproduce the garnet zoning. In addition, the estimated condition of the highest Mn portion of the garnet compositional transect (the “core condition”) should overlap the garnet-in reaction line, which is observed best with the LHF rocks (Figure 6). We stress that the P-T paths reported here should be viewed as a model that approximates those followed by samples with similar bulk compositions as those collected in the field if they behaved as closed systems and experienced equilibrium.
4.2. Garnets as Recorders of Erosion
The Himalayas have long been considered an ideal location to study the links between tectonics, climate, and erosion [107,108,109,110,111]. The Sikkim region in particular is a region with active tectonics and high millennial erosion rates (1–2 mm/yr), with the long-term exhumation rate appearing to be tectonically controlled [111]. The Teesta River is the largest Himalayan tributary of the Brahmaputra river with asymmetric catchment that extends 8000 km2 [112]. Landslides and flash floods are a common occurrent in the region due to the large variation in its elevation profile [112,113]. The river is created by two glacial-fed streams that meet at the city of Chungthang (Figure 1). Samples collected in this study are concentrated in the Teesta Basin and in steep gorges of its northern catchments [111,112].
Garnets from LHF and MCT shear zone samples record P of 6–7 kbar (depths of 22.2–26.9 km using a geobaric gradient of 3.7 kbar/km) and have co-existing Late Miocene monazite inclusions [5,6]. The results suggest the samples experienced exhumation of ~2.2–2.5 mm/yr since the Late Miocene. However, sample LCG752 from the GHC unit experienced higher P of 9.8–10.2 kbar (depths of 36–37 km) and T of 700 ± 25 °C. Rocks surrounding this sample contain Miocene monazite ages, which suggest exhumation on the order of 2 mm/yr. These estimations are only a first-order approximation as exhumation rates in tectonically controlled landscapes depend on several factors, including the relationship between topography, climate, erosion, and rock uplift, e.g., [114].
Garnets have increasingly been shown to be helpful in understanding the relationship between deeper crustal processes and erosion [53,54,55,56]. The decrease in pressure recorded by garnets in these studies link the change to the removal of overburden by erosion, rather than tectonics. Some LHF and GHC high-resolution P-T paths show decompression followed by burial (V-shaped paths) (Figure 15A). Paths that show this trend are in LHF samples KBP1062C (path 1) and CHG14102 and GHC sample LCG542. The amount of decompression is significant (<0.5–1 kbar) and this type of path could be related to erosional exhumation followed by compression, e.g., [53,54,55,56]. Figure 17 summarizes how we envision how the V-shape P-T paths may have been recorded in the samples analyzed in this study.
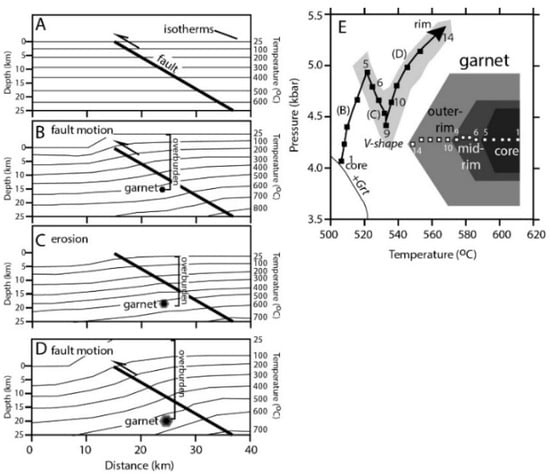
Figure 17.
Schematic model for how the V-shaped P-T paths may have developed after [55]. (A) Boundary conditions of a depth vs. distance grid with isotherms overlain. (B) Fault motion occurs and rocks are buried. Garnet forms due to burial. The garnet records the overburden P. (C) A period of erosion occurs. The overburden decreases, but T increases to grow garnet. The garnet records a P decrease due to erosion. (D) Fault motion occurs again, and the garnet is buried. (E) P-T diagram showing the path taken by the growing garnet. The cartoon inlay represents where analytical data points are taken from the core, mid-rim, and rim of the garnet, and correspond to the numbers on the P-T path. The V-shaped portion of the P-T path is indicated by the grey area on the path. Letters on the path represent where the sample is located in panels (B–D).
Our schematic modeling suggests that the Himalayan garnets record the erosional episode during the initial stages of garnet growth. Some of the garnets in sample CHG14102 show evidence for an initial burial stage before erosion occurs (Figure 17B,E, points 1–5), suggesting that we likely analyzed data closest to the garnet core (Figure 6D and Figure 15A).
We do not advocate for the reversal of fault sense of motion in Figure 17 from thrust to extension to account for the P decrease because the process would drive cooling of the sample and the cessation of garnet growth (see modeling in [55]. The STDF may account for denudation in the region, but it is mapped as a thrust by [26] and is located far north of where our samples were collected.
V-shaped P-T paths have been observed elsewhere in LHF rocks collected in NW India [54]. These are the first reported for the Gorubathan Formation in the Sikkim and for the GHC unit. Although we have the most confidence in the P-T paths from the LHF samples, those from the MCT shear zone and GHC rocks may also provide critical clues into how those rocks experienced metamorphism if their shapes accurately represent their experiences in the crust.
4.3. Implication for Models of the Himalayas
In addition to the V-shaped paths, we also report hairpin shape paths where P increases then decrease over a short T interval (<20 °C, e.g., MCT shear zone samples CMP862, LCG753, GHC rock LCG752, path 1) (Figure 15B). This shape is consistent with imbrication, as samples are transferred from the footwall to the hanging wall as different fault systems activate (e.g., Figure 15C), e.g., [5,53,54,102]. The types of paths are observed in LHF rocks from NW India and central Nepal, but the Sikkim P-T paths show that the imbrication process was active in this region and within the GHC. The magnitude and shapes of the P-T paths from this sample are more consistent with GHC rocks experiencing discrete thrusting and imbrication, as opposed to channel flow, according to the model predictions outlined by [102] (Figure 15C).
Evaluating models for GHC extrusion requires an understanding of the P-T-t paths of its rocks as they experienced the transition from convergence and subduction to their final exhumation, e.g., [5,45,53,54,102,115,116]. Figure 15C illustrates particle paths predicted by end-member “critical taper” and “channel flow” models after [102]. The shapes of these P-T loops depend significantly on the original location of samples studied and on position within a wedge or channel and we recognize that these are idealized models that may have large variations. With these caveats, the end-member models’ P-T paths experienced by the GHC and LHF rocks differ significantly, with differences in peak P-T conditions and exhumations rates. Channel flow predicts the GHC experienced isothermal exhumation, and the LHF experiences isobaric heating. The model that involves discrete thrusting predicts isobaric cooling for GHC rocks and “hairpin” LHF P-T paths, e.g., [102]. The metamorphic field gradients predicted by the models would also differ. Although this figure depicts end-member models, both may be relevant to the Himalayan core, depending on the location within the range and the time frame of metamorphism [38,41,42]. We also are limited in comparing the paths generated here to the entire P-T paths outlined in Figure 15C by the amount of garnet in the sample and the degree of preservation of primary zoning. Overall, however, the hairpin P-T path shapes similar to those reported here occur when a sample is buried and exhumed quickly, and the tectonic process is reflected in the transfer of the sample from the footwall of one fault system to the hanging wall of another, e.g., [53,54].
An additional complicating factor is the presence of numerous lineaments throughout the Sikkim (Figure 1), e.g., [117]. The region is considered a rotating, converging microplate within the Himalayas, where older contractional structures reactivate with strike-slip motion [24,118]. These lineaments highlight the potential for isograd disruption through later-stage deformation. The closest lineaments to where the samples were collected are the Goalpara and Gangtok lineaments, which were initially recognized through remote sensing [35,119]. These may not represent actual fault systems, although speculation exists that these are vertical faults with a right-lateral sense of motion [23,35].
5. Conclusions
We present high-resolution P-T paths across a prominent Himalayan fault zone (MCT shear zone) in the Sikkim region of NE India. The paths were obtained using closely spaced analytical data points across garnets and the rock bulk composition with the assumptions that the rocks collected experienced closed system behavior and equilibrium conditions. The extent of this behavior could be gauged as the paths predict the raw garnet zoning. In these cases, P-T paths from footwall assemblages (LHF) best reproduced the garnet zoning. Garnet inclusions can alter their chemical zoning, so the best approach is to avoid using compositions that lie near them. The shapes of the P-T paths help understand how they record tectonic processes in the Himalayas, including erosion. The use of garnet as a recorder of erosion is a new tool to decipher how mountain ranges evolve. In this case, decreases in P recorded by the garnet can be modeled as exhumation due to the removal of overburden instead of invoking tectonically controlled extension. Some P-T paths show a distinct hairpin shape, consistent with imbrication models for the development of the Himalayas.
Supplementary Materials
The following are available online in the Texas Data Repository https://doi.org/10.18738/T8/F134EB, Excel File S1: Compositional data used to generate the P-T paths and the output conditions, Excel File S2: Compositional data from matrix minerals used to generate the conventional conditions. Sample location map based on mapping by [26] is also included.
Author Contributions
Conceptualization, E.J.C. and C.S.D.; methodology, E.J.C. and T.M.E.; sample collection, C.S.D.; software, E.J.C. and T.M.E.; validation, E.J.C., C.S.D., and T.M.E.; formal analysis, E.J.C.; investigation, E.J.C.; resources, E.J.C.; data curation, E.J.C.; writing—original draft preparation, E.J.C.; writing—review and editing, E.J.C., C.S.D. and T.M.E.; visualization, E.J.C.; supervision, E.J.C.; project administration, E.J.C.; funding acquisition, E.J.C. All authors have read and agreed to the published version of the manuscript.
Funding
Data collected in the project were supported by funding from the Institute of Geophysics and Planetary Physics-Lawrence Livermore National Laboratory University Collaborative Research Program 97-GS002 and the National Science Foundation Award #0217611.
Institutional Review Board Statement
Not applicable.
Informed Consent Statement
Not applicable.
Data Availability Statement
Data supporting reported results can be found in the Texas Data Repository (doi:10.18738/T8/F134EB) and in the paper itself.
Acknowledgments
We appreciate analytical support from Phil Orlandini (Jackson School of Geosciences, Dept. of Geological Sciences, UT Austin). We also appreciate drafting assistance by Jeffrey Horowitz and M. Tajbakhsh. Comments from two reviewers improved the original manuscript.
Conflicts of Interest
The authors declare no conflict of interest. The funders had no role in the design of the study; in the collection, analyses, or interpretation of data; in the writing of the manuscript, or in the decision to publish the results.
References
- Searle, M.P.; Szulc, A.G. Channel flow and ductile extrusion of the high Himalayan slab-the Kangchenjunga–Darjeeling profile, Sikkim Himalaya. J. Southeast Asian Earth Sci. 2005, 25, 173–185. [Google Scholar] [CrossRef]
- Bhattacharyya, K.; Mitra, G. A new kinematic evolutionary model for the growth of a duplex—An example from the Rangit duplex, Sikkim Himalaya, India. Gondwana Res. 2009, 16, 697–715. [Google Scholar] [CrossRef]
- Chakraborty, S.; Mukhopadhyay, D.K.; Chowdhury, P.; Rubatto, D.; Anczkiewicz, R.; Trepmann, C.; Gaidies, F.; Sorcar, N.; Dasgupta, S. Channel flow and localized fault bounded slice tectonics (LFBST): Insights from petrological, structural, geochronological and geospeedometric studies in the Sikkim Himalaya, NE India. Lithos 2017, 282–283, 464–482. [Google Scholar] [CrossRef]
- Bhattacharyya, K.; Mitra, G.; Kwon, S. Geometry and kinematics of the Darjeeling–Sikkim Himalaya, India: Implications for the evolution of the Himalayan fold-thrust belt. J. Southeast Asian Earth Sci. 2015, 113, 778–796. [Google Scholar] [CrossRef] [Green Version]
- Catlos, E.J.; Dubey, C.S.; Harrison, T.M.; Edwards, M.A. Late Miocene movement within the Himalayan Main Central Thrust shear zone, Sikkim, north-east India. J. Metamorph. Geol. 2004, 22, 207–226. [Google Scholar] [CrossRef]
- Dubey, C.S.; Catlos, E.J.; Sharma, B.K. Modeling P-T-t paths constrained by mineral chemistry and monazite dating of met-apelites ion relationship to MCT activity in Sikkim, eastern Himalayas. In Metamorphism and Crustal Evolution: Papers in Honor of Prof. R.S. Sharma; Thomas, H., Ed.; Atlantic Publishers and Distributors: New Delhi, India, 2005; pp. 250–282. [Google Scholar]
- Dasgupta, S.; Ganguly, J.; Neogi, S. Inverted metamorphic sequence in the Sikkim Himalayas: Crystallization history, P-T gradient and implications. J. Metamorph. Geol. 2004, 22, 395–412. [Google Scholar] [CrossRef]
- Ghosh, S.; Bose, S.; Mandal, N.; Dasgupta, S. Dynamic recrystallization mechanisms and their transition in the Daling Thrust (DT) zone, Darjeeling–Sikkim Himalaya. Tectonophysics 2016, 674, 166–181. [Google Scholar] [CrossRef]
- Chakraborty, S.; Mukul, M. New insights into the position and geometry of the Main Central Thrust from Sikkim, Eastern Himalaya. J. Geol. 2019, 127, 289–322. [Google Scholar] [CrossRef]
- Ghosh, P.; Bhattacharyya, K.; Parui, C. Tracking progressive deformation of an orogenic wedge through two successive internal thrusts: Insights from structure, deformation profile, strain, and vorticity of the Main Central thrust (MCT) and the Pelling-Munsiari thrust (PT), Sikkim Himalayan fold thrust belt. J. Struct. Geol. 2020, 140, 104120. [Google Scholar] [CrossRef]
- Das, D.; Mallik, J.; Das, S.; Deb, T.; Das, A.; Bandyopadhyay, K. Active thrust induced realignment of recent near-surface stresses in the Darjeeling-Sikkim Himalayas: Reasons and implications. J. Struct. Geol. 2021, 145, 104311. [Google Scholar] [CrossRef]
- Acharyya, S.K.; Ray, K.K. Geology of the Darjeeling–Sikkim Himalaya. Guide to Excursion No. 3. In Proceedings of the Fourth International Gondwana Symposium, Calcutta, India, 17–22 January 1977; Geological Survey of India: Kolkata, India; pp. 1–25. [Google Scholar]
- Ray, S.K. Culmination zones in Eastern Himalaya. Geol. Surv. India Spec. Pub. 2000, 55, 85–94. [Google Scholar]
- Mitra, G.; Bhattacharyya, K.; Mukul, M. The lesser Himalayan Duplex in Sikkim: Implications for variations in Himalayan shortening. J. Geol. Soc. India 2010, 75, 289–301. [Google Scholar] [CrossRef]
- Pavankumar, G.; Manglik, A. Complex tectonic setting and deep crustal seismicity of the Sikkim Himalaya: An electrical resistivity perspective. Phys. Chem. Earth Parts A/B/C 2021, 124, 103077. [Google Scholar] [CrossRef]
- Saha, D.; Sengupta, D.; Das, S. Along strike variation in the Himalayan orogen and its expression along major intracontinental thrusts—The case of MCT in Sikkim and Arunachal Pradesh, India. Geol. Soc. India Mem. 2011, 77, 1–18. [Google Scholar]
- Landry, K.R.; Coutand, I.; Whipp, D.M.; Grujic, D.; Hourigan, J.K. Late Neogene tectonically driven crustal exhumation of the Sikkim Himalaya: Insights from inversion of multithermochronologic data. Tectonics 2016, 35, 833–859. [Google Scholar] [CrossRef] [Green Version]
- Raoof, J.; Mukhopadhyay, S.; Koulakov, I.; Kayal, J.R. 3-D seismic tomography of the lithosphere and its geodynamic implications beneath the northeast India region. Tectonics 2017, 36, 962–980. [Google Scholar] [CrossRef]
- De, R. Seismotectonic Model of the Sikkim Himalaya: Constraint from Microearthquake Surveys. Bull. Seism. Soc. Am. 2003, 93, 1395–1400. [Google Scholar] [CrossRef]
- Patro, P.K.; Harinarayana, T. Deep geoelectric structure of the Sikkim Himalayas (NE India) using magnetotelluric studies. Phys. Earth Planet. Inter. 2009, 173, 171–176. [Google Scholar] [CrossRef]
- Nakata, T.; Otsuki, K.; Khan, S.H. Active faults, stress field, and plate motion along Indo-Eurasian plate boundary. Tectono-Physics 1990, 181, 83–95. [Google Scholar] [CrossRef]
- De, R.; Kayal, J. Seismic activity at the MCT in Sikkim Himalaya. Tectonophysics 2004, 386, 243–248. [Google Scholar] [CrossRef]
- Hazarika, P.; Kumar, M.R.; Srijayanthi, G.; Raju, P.S.; Rao, N.P.; Srinagesh, D. Transverse Tectonics in the Sikkim Himalaya: Evidence from Seismicity and Focal-Mechanism Data. Bull. Seism. Soc. Am. 2010, 100, 1816–1822. [Google Scholar] [CrossRef]
- Paul, H.; Mitra, S.; Bhattacharya, S.; Suresh, G. Active transverse faulting within underthrust Indian crust beneath the Sikkim Himalaya. Geophys. J. Int. 2015, 201, 1072–1083. [Google Scholar] [CrossRef] [Green Version]
- Thirunavukarasu, A.; Kumar, A.; Mitra, S. Lateral variation of seismic attenuation in Sikkim Himalaya. Geophys. J. Int. 2016, 208, 257–268. [Google Scholar] [CrossRef]
- Geology and Mineral Resources Map of Sikkim. Source: Geological Survey of India (GSI). 2011. Available online: http://www.sikenvis.nic.in/Database/GSI_4420.aspx (accessed on 11 March 2022).
- Gaidies, F.; Petley-Ragan, A.; Chakraborty, S.; Dasgupta, S.; Jones, P. Constraining the conditions of Barrovian metamorphism in Sikkim, India: P-T-t paths of garnet crystallization in the Lesser Himalayan Belt. J. Metamorph. Geol. 2015, 33, 23–44. [Google Scholar] [CrossRef]
- Mottram, C.; Argles, T.W.; Harris, N.; Parrish, R.R.; Horstwood, M.; Warren, C.; Gupta, S. Tectonic interleaving along the Main Central Thrust, Sikkim Himalaya. J. Geol. Soc. 2014, 171, 255–268. [Google Scholar] [CrossRef] [Green Version]
- Gangopadhyay, P.K. Intrafolial folds and associated structures in a progressive strain environment of Darjeeling-Sikkim Himalaya. J. Earth Syst. Sci. 1995, 104, 523–537. [Google Scholar] [CrossRef]
- Bose, S.; Mandal, N.; Acharyya, S.; Ghosh, S.; Saha, P. Orogen-transverse tectonic window in the Eastern Himalayan fold belt: A superposed buckling model. J. Struct. Geol. 2014, 66, 24–41. [Google Scholar] [CrossRef]
- Roberts, A.G.; Weinberg, R.F.; Hunter, N.J.R.; Ganade, C.E. Large-scale rotational motion within the Main Central Thrust Zone in the Darjeeling-Sikkim Himalaya, India. Tectonics 2020, 39, e2019TC005949. [Google Scholar] [CrossRef]
- Singh, A.; Kumar, M.R.; Raju, P.S. Seismic structure of the underthrusting Indian crust in Sikkim Himalaya. Tectonics 2010, 29, 2010TC6021. [Google Scholar] [CrossRef]
- Sunilkumar, T.C.; Earnest, A.; Silpa, K.; Andrews, R. Rupture of the Indian slab in the 2011 Mw 6.9 Sikkim Himalaya earth-quake and its tectonic implications. J. Geophys. Res. 2019, 124, 2623–2637. [Google Scholar] [CrossRef]
- Kellett, D.A.; Grujic, D.; Coutand, I.; Cottle, J.; Mukul, M. The South Tibetan detachment system facilitates ultra rapid cooling of granulite-facies rocks in Sikkim Himalaya. Tectonics 2013, 32, 252–270. [Google Scholar] [CrossRef]
- Mukul, M.; Jade, S.; Ansari, K.; Abdul, M. Seismotectonic implications of strike-slip earthquakes in the Darjiling—Sikkim Himalaya. Curr. Sci. 2014, 106, 198–210. [Google Scholar]
- Beaumont, C.; Nguyen, M.; Jamieson, R.; Ellis, S. Crustal flow modes in large hot orogens. In Channel Flow, Ductile Extrusion and Exhumation in Continental Collision Zones; Law, R.D., Searle, M.P., Godin, L., Eds.; The Geological Society: London, UK, 2006; Volume 268, pp. 91–146. [Google Scholar]
- Jamieson, R.A.; Beaumont, C. On the origin of orogens. GSA Bull. 2013, 125, 1671–1702. [Google Scholar] [CrossRef]
- Mukherjee, S. Higher Himalaya in the Bhagirathi section (NW Himalaya, India): Its structures, backthrusts and extrusion mechanism by both channel flow and critical taper mechanisms. Int. J. Earth Sci. 2013, 102, 1851–1870. [Google Scholar] [CrossRef]
- Iaccarino, S.; Montomoli, C.; Montemagni, C.; Massonne, H.-J.; Langone, A.; Jain, A.K.; Visonà, D.; Carosi, R. The Main Central Thrust zone along the Alaknanda and Dhauli Ganga valleys (Garhwal Himalaya, NW India): Insights into an inverted metamorphic sequence. Lithos 2020, 372–373, 105669. [Google Scholar] [CrossRef]
- Wang, J.-M.; Zhang, J.J.; Wang, X.X. Structural kinematics, metamorphic P-T profiles and zircon geochronology across the Greater Himalayan Crystalline Complex in south-central Tibet: Implication for a revised channel flow. J. Metamorph. Geol. 2013, 31, 607–628. [Google Scholar] [CrossRef]
- Larson, K.; Godin, L.; Price, R.A. Relationships between displacement and distortion in orogens: Linking the Himalayan foreland and hinterland in central Nepal. GSA Bull. 2010, 122, 1116–1134. [Google Scholar] [CrossRef]
- Cottle, J.M.; Larson, K.P.; Kellett, D. How does the mid-crust accommodate deformation in large, hot collisional orogens? A review of recent research in the Himalayan orogen. J. Struct. Geol. 2015, 78, 119–133. [Google Scholar] [CrossRef] [Green Version]
- Beaumont, C.; Jamieson, R.A. Himalayan-Tibetan orogeny: Channel flow versus (critical) wedge models, afalse dichotomy. In Proceedings for the 25th Himalaya-Karakoram-Tibet Workshop, Open-File Report 2010-1099; U.S. Geological Survey; U.S. Department of the Interior: San Francisco, CA, USA, 2010; 2p. Available online: https://pubs.usgs.gov/of/2010/1099/beaumont/of2010-1099_beaumont.pdf (accessed on 11 March 2022).
- Larson, K.P.; Gervais, F.; Kellett, D.A. A P–T–t–D discontinuity in east-central Nepal: Implications for the evolution of the Himalayan mid-crust. Lithos 2013, 179, 275–292. [Google Scholar] [CrossRef]
- Corrie, S.L.; Kohn, M.J.; McQuarrie, N.; Long, S.P. Flattening the Bhutan Himalaya. Earth Planet. Sci. Lett. 2012, 349–350, 67–74. [Google Scholar] [CrossRef]
- Dasgupta, S.; Chakraborty, S.; Neogi, S. Petrology of an inverted Barrovian sequence of metapelites in Sikkim Himalaya, India: Constraints on the tectonics of inversion. Am. J. Sci. 2009, 309, 43–84. [Google Scholar] [CrossRef]
- Anczkiewicz, R.; Chakraborty, S.; Dasgupta, S.; Mukhopadhyay, D.; Kołtonik, K. Timing, duration and inversion of prograde Barrovian metamorphism constrained by high resolution Lu–Hf garnet dating: A case study from the Sikkim Himalaya, NE India. Earth Planet. Sci. Lett. 2014, 407, 70–81. [Google Scholar] [CrossRef]
- Yin, A. Cenozoic tectonic evolution of the Himalayan orogen as constrained by along-strike variation of structural geometry, exhumation history, and foreland sedimentation. Earth-Sci. Rev. 2006, 76, 1–131. [Google Scholar] [CrossRef]
- Catlos, E.J. Records of Himalayan metamorphism and compressional tectonics in the central Himalayas (Darondi Khola, Nepal). In Compressional Tectonics: Plate Convergence to Mountain Building; Cemen, I., Catlos, E.J., Eds.; AGU Books; American Geophysical Union: Washington, DC, USA, 2021; Volume II. [Google Scholar] [CrossRef]
- Waters, D.J. Metamorphic constraints on the tectonic evolution of the High Himalaya in Nepal: The art of the possible. In Himalayan Tectonics: A Modern Synthesis; Treloar, J., Searle, M., Eds.; Special Publications; Geological Society: London, UK, 2019; Volume 483, pp. 325–375. [Google Scholar] [CrossRef]
- Ganguly, J.; Dasgupta, S.; Cheng, W.; Neogi, S. Exhumation history of a section of the Sikkim Himalayas, India: Records in the metamorphic mineral equilibria and compositional zoning of garnet. Earth Planet. Sci. Lett. 2000, 183, 471–486. [Google Scholar] [CrossRef]
- Tewari, S.; Prakash, D.; Yadav, M.K.; Srivastava, V. Barrovian metamorphism of the metapelites in NE Sikkim (Eastern Himalaya): Constraints from chemographic projection and geothermobarometry. J. Southeast Asian Earth Sci. 2021, 208, 104673. [Google Scholar] [CrossRef]
- Catlos, E.J.; Lovera, O.M.; Kelly, E.D.; Ashley, K.T.; Harrison, T.M.; Etzel, T. Modeling High-Resolution Pressure-Temperature Paths Across the Himalayan Main Central Thrust (Central Nepal): Implications for the Dynamics of Collision. Tectonics 2018, 37, 2363–2388. [Google Scholar] [CrossRef]
- Catlos, E.J.; Perez, T.J.; Lovera, O.M.; Dubey, C.S.; Schmitt, A.K.; Etzel, T.M. High-Resolution P-T-Time Paths Across Himalayan Faults Exposed Along the Bhagirathi Transect NW India: Implications for the Construction of the Himalayan Orogen and Ongoing Deformation. Geochem. Geophys. Geosyst. 2020, 21, e2020GC009353. [Google Scholar] [CrossRef]
- Etzel, T.M.; Catlos, E.J.; Ataktürk, K.; Lovera, O.M.; Kelly, E.D.; Çemen, I.; Diniz, E. Implications for Thrust-Related Shortening Punctuated by Extension From P-T Paths and Geochronology of Garnet-Bearing Schists, Southern (Çine) Menderes Massif, SW Turkey. Tectonics 2019, 38, 1974–1998. [Google Scholar] [CrossRef] [Green Version]
- Etzel, T.M.; Catlos, E.J.; Cemen, I.; Ozerdem, C.; Oyman, T.; Miggins, D. Documenting Exhumation in the Central and Northern Menderes Massif (Western Turkey): New Insights from Garnet-Based P-T Estimates and K-Feldspar 40Ar/39Ar Geochronology. Lithosphere 2020, 2020, 8818289. [Google Scholar] [CrossRef]
- Daniel, C.G.; Hollister, L.S.; Parrish, R.R.; Grujic, D. Exhumation of the Main Central Thrust from Lower Crustal Depths, Eastern Bhutan Himalaya. J. Metamorph. Geol. 2003, 21, 317–334. [Google Scholar] [CrossRef]
- Ferry, J.M.; Spear, F.S. Experimental calibration of the partitioning of Fe and Mg between biotite and garnet. Contrib. Miner. Pet. 1978, 66, 113–117. [Google Scholar] [CrossRef]
- Berman, R.G. Mixing properties of Ca-Mg-Fe-Mn garnets. Am. Mineral. 1990, 75, 328–344. [Google Scholar]
- Hoisch, T.D. Empirical calibration of six geobarometers for the mineral assemblage quartz+muscovite+biotite+plagioclase+garnet. Contrib. Miner. Pet. 1990, 104, 225–234. [Google Scholar] [CrossRef]
- Saha, D. Lesser Himalayan sequences in Eastern Himalaya and their deformation: Implications for Paleoproterozoic tectonic activity along the northern margin of India. Geosci. Front. 2013, 4, 289–304. [Google Scholar] [CrossRef] [Green Version]
- Paul, D.K.; Chandy, K.C.; Bhalla, J.N.; Sengupta, N.R. Geochronology and geochemistry of Lingtse Gneiss, Darjeeling–Sikkim Himalayas. Indian J. Sci. 1982, 9, 11–17. [Google Scholar]
- Paul, D.K.; McNaughton, N.J.; Chattopadhyay, S.; Ray, K.K. Geochronology and geochemistry of the Lingtse gneiss, Darjee-ling—Sikkim Himalaya: Revisited. J. Geol. Soc. India 1996, 48, 497–506. [Google Scholar]
- Acharyya, S.K.; Ghosh, S.; Mandal, N.; Bose, S.; Pande, K. Pre-Himalayan tectono-magmatic imprints in the Darjeeling-Sikkim Himalaya (DSH) constrained by 40Ar/39Ar dating of muscovite. J. Southeast Asian Earth Sci. 2017, 146, 211–220. [Google Scholar] [CrossRef]
- Acharyya, S.K. Structural framework and tectonic evolution of the eastern Himalaya. Himal. Geol. 1980, 10, 412–439. [Google Scholar]
- Acharyya, S.K. The Daling Group, its nomenclature, tectono-stratigraphy and structural grain: With notes on their possible equivalents. Visesa Prakasana-Bharatiya Bhuvaijñanika Sarveksana 1989, 22, 5–13. [Google Scholar]
- Long, S.; McQuarrie, N.; Tobgay, T.; Grujic, D. Geometry and crustal shortening of the Himalayan fold–thrust belt, eastern and central Bhutan. Geol. Soc. Am. Bull. 2011, 123, 1427–1447. [Google Scholar] [CrossRef]
- Ray, K.K. Some problems of stratigraphy and tectonics of the Darjeeling and Sikkim Himalayas. Geol. Surv. Ind. Misc. Pub. 1976, 24, 279–394. [Google Scholar]
- Sinha-Roy, S.; Gupta, S.S. Precambrian deformed granites of possible basement in the Himalayas. Precambrian Res. 1986, 31, 209–235. [Google Scholar] [CrossRef]
- Ameen, S.M.; Wilde, S.A.; Kabir, Z.; Akon, E.; Chowdhury, K.R.; Khan, S.H. Paleoproterozoic granitoids in the basement of Bangladesh: A piece of the Indian shield or an exotic fragment of the Gondwana jigsaw? Gondwana Res. 2007, 12, 380–387. [Google Scholar] [CrossRef]
- Martin, A.J.; DeCelles, P.G.; Gehrels, G.E.; Patchett, P.J.; Isachsen, C. Isotopic and structural constraints on the location of the Main Central Thrust in the Annapurna Range, central Nepal Himalaya. Geol. Soc. Am. Bull. 2005, 117, 926–944. [Google Scholar] [CrossRef]
- Saha, S.; Roy, J.; Pradhan, B.; Hembram, T.K. Hybrid ensemble machine learning approaches for landslide susceptibility mapping using different sampling ratios at East Sikkim Himalayan, India. Adv. Space Res. 2021, 68, 2819–2840. [Google Scholar] [CrossRef]
- Bhasin, R.; Grimstad, E.; Larsen, J.O.; Dhawan, A.K.; Singh, R.; Verma, S.; Venkatachalam, K. Landslide hazards and mitigation measures at Gangtok, Sikkim Himalaya. Eng. Geol. 2002, 64, 351–368. [Google Scholar] [CrossRef]
- Biswakarma, P.; Barman, B.K.; Joshi, V.; Rao, K.S. Landslide susceptibility mapping in east Sikkim region of Sikkim Himalaya using high resolution remote sensing data and GIS techniques. Appl. Ecol. Environ. Sci. 2020, 8, 143–153. [Google Scholar]
- Sivasankar, T.; Ghosh, S.; Joshi, M. Exploitation of optical and SAR amplitude imagery for landslide identification: A case study from Sikkim, Northeast India. Environ. Monit. Assess. 2021, 193, 386. [Google Scholar] [CrossRef] [PubMed]
- Sarkar, S.S.; Ali, A.; Bhattacharya, G.; De, P.; Roy, B.C.; Nambiar, K.V.; Khan, S.I.K. Geology and Mineral Resources of the States of India, Part XIX–SIKKIM. In Geological Survey of India Miscellaneous Publication; Government of India: Kolkata, India, 2012; Volume 30, 54p, Available online: http://www.sikenvis.nic.in/WriteReadData/UserFiles/file/GSI%20Miscpub30_Sikkim.pdf (accessed on 11 March 2022).
- de Capitani, C.; Brown, T.H. The computation of chemical equilibrium in complex systems containing non-ideal solutions. Geochim. Cosmochim. Acta 1987, 51, 2639–2652. [Google Scholar] [CrossRef]
- De Capitani, C.; Petrakakis, K. The computation of equilibrium assemblage diagrams with Theriak/Domino software. Am. Miner. 2010, 95, 1006–1016. [Google Scholar] [CrossRef]
- Holland, T.; Baker, J.; Powell, R. Mixing properties and activity-composition relationships of chlorites in the system MgO-FeO-Al2O3-SiO2-H2O. Eur. J. Miner. 1998, 10, 395–406. [Google Scholar] [CrossRef]
- Baldwin, J.A.; Powell, R.; Brown, M.; Moraes, R.; Fuck, R.A. Modelling of mineral equilibria in ultrahigh-temperature metamorphic rocks from the Anápolis-Itauçu Complex, central Brazil. J. Metamorph. Geol. 2005, 23, 511–531. [Google Scholar] [CrossRef]
- Powell, R.; Holland, T. Relating formulations of the thermodynamics of mineral solid solutions; activity modeling of pyroxenes, amphiboles, and micas. Am. Miner. 1999, 84, 1–14. [Google Scholar] [CrossRef]
- Mahar, E.M.; Baker, J.M.; Powell, R.; Holland, T.J.B.; Howell, N. The effect of Mn on mineral stability in metapelites. J. Metamorph. Geol. 1997, 15, 223–238. [Google Scholar] [CrossRef]
- White; Powell; Holland; Worley. The effect of TiO2 and Fe2O3 on metapelitic assemblages at greenschist and amphibolite facies conditions: Mineral equilibria calculations in the system K2O-FeO-MgO-Al2O3-SiO2-H2O-TiO2-Fe2O3. J. Metamorph. Geol. 2000, 18, 497–511. [Google Scholar] [CrossRef]
- White, R.W.; Pomroy, N.E.; Powell, R. An in situ metatexite-diatexite transition in upper amphibolite facies rocks from Broken Hill, Australia. J. Metamorph. Geol. 2005, 23, 579–602. [Google Scholar] [CrossRef]
- Zeh, A.; Holness, M.B. The Effect of Reaction Overstep on Garnet Microtextures in Metapelitic Rocks of the Ilesha Schist Belt, SW Nigeria. J. Pet. 2003, 44, 967–994. [Google Scholar] [CrossRef]
- Holland, T.; Powell, R. Activity-composition relations for phases in petrological calculations: An asymmetric multicomponent formulation. Contrib. Miner. Pet. 2003, 145, 492–501. [Google Scholar] [CrossRef]
- Coggon, R.; Holland, T.J.B. Mixing properties of phengitic micas and revised garnet-phengite thermobarometers. J. Metamorph. Geol. 2002, 20, 683–696. [Google Scholar] [CrossRef]
- Moynihan, D.P.; Pattison, D.R.M. An automated method for the calculation of P-T paths from garnet zoning, with application to metapelitic schist from the Kootenay Arc, British Columbia, Canada. J. Metamorph. Geol. 2013, 31, 525–548. [Google Scholar] [CrossRef]
- White, R.W.; Powell, R.; Holland, T.J.B.; Johnson, T.E.; Green, E.C.R. New mineral activity-composition relations for thermo-dynamic calculations in metapelitic systems. J. Metamorph. Geol. 2014, 32, 261–286. [Google Scholar] [CrossRef]
- Lanari, P.; Engi, M. Local Bulk Composition Effects on Metamorphic Mineral Assemblages. Rev. Miner. Geochem. 2017, 83, 55–102. [Google Scholar] [CrossRef] [Green Version]
- Spear, F.S.; Daniel, C.G. Three-dimensional imaging of garnet porphyroblast sizes and chemical zoning: Nucleation and growth history in the garnet zone. Geol. Mat. Res. 1998, 1, 44. [Google Scholar]
- Florence, F.P.; Spear, F.S. Effects of diffusional modification of garnet growth zoning on P-T path calculations. Contrib. Miner. Pet. 1991, 107, 487–500. [Google Scholar] [CrossRef]
- Hames, W.E.; Menard, T. Fluid-assisted modification of garnet composition along rims, cracks, and mineral inclusion bound-aries in samples of amphibolite facies schists. Am. Mineral. 1993, 78, 338–344. [Google Scholar]
- Kelly, E.D.; Hoisch, T.D.; Wells, M.L.; Vervoort, J.D.; Beyene, M.A. An Early Cretaceous garnet pressure–temperature path recording synconvergent burial and exhumation from the hinterland of the Sevier orogenic belt, Albion Mountains, Idaho. Contrib. Mineral. Petrol. 2015, 170, 1–22. [Google Scholar] [CrossRef]
- Affinati, S.C.; Hoisch, T.D.; Wells, M.L.; Vervoort, J.D. Pressure-temperature-time paths from the Funeral Mountains, California, reveal Jurassic retroarc underthrusting during early Sevier orogenesis. GSA Bull. 2019, 132, 1047–1065. [Google Scholar] [CrossRef]
- Lanari, P.; Vidal, O.; de Andrade, V.; Dubacq, B.; Lewin EGrosch, E.G.; Schwartz, S. XMapTools: A MATLAB©-based program for electron microprobe X-ray image processing and geothermobarometry. Comp. Geosci. 2014, 62, 227–240. [Google Scholar] [CrossRef] [Green Version]
- Whitney, D.; Evans, B.W. Abbreviations for names of rock-forming minerals. Am. Miner. 2009, 95, 185–187. [Google Scholar] [CrossRef]
- McLellan, E. Metamorphic Reactions in the Kyanite and Sillimanite Zones of the Barrovian Type Area. J. Pet. 1985, 26, 789–818. [Google Scholar] [CrossRef]
- Spear, F.S. Metamorphic Phase Equilibria and Pressure-Temperature-Time Paths; American Geophysical Union: Washington, DC, USA, 1995; Volume 1, pp. 1–799. ISBN 0-939950-34-0. [Google Scholar]
- Sorcar, N.; Hoppe, U.; Dasgupta, S.; Chakraborty, S. High-temperature cooling histories of migmatites from the High Himalayan Crystallines in Sikkim, India: Rapid cooling unrelated to exhumation? Contrib. Miner. Pet. 2014, 167, 957. [Google Scholar] [CrossRef]
- Mohan, A.; Windley, B.F.; Searle, M.P. Geothermobarometry and development of inverted metamorphism in the Darjeeling-Sikkim region of the eastern Himalayan. J. Metamorph. Geol. 1989, 7, 95–110. [Google Scholar] [CrossRef]
- Kohn, M. P-T-t data from central Nepal support critical taper and repudiate large-scale channel flow of the Greater Himalayan Sequence. GSA Bull. 2008, 120, 259–273. [Google Scholar] [CrossRef]
- Mottram, C.M.; Parrish, R.R.; Regis, D.; Warren, C.J.; Argles, T.W.; Harris, N.B.W.; Roberts, N.M.W. Using U-Th-Pb petrochronology to determine rates of ductile thrusting: Time windows into the Main Central Thrust, Sikkim Himalaya. Tectonics 2015, 34, 1355–1374. [Google Scholar] [CrossRef] [Green Version]
- Connolly, J.A.D. Multivariable phase diagrams; an algorithm based on generalized thermodynamics. Am. J. Sci. 1990, 290, 666–718. [Google Scholar] [CrossRef]
- Connolly, J.A.D. The geodynamic equation of state: What and how. Geochem. Geophys. Geosyst. 2009, 10, Q10014. [Google Scholar] [CrossRef]
- Holland, T.J.B.; Powell, R. An improved and extended internally consistent thermodynamic dataset for phases of petrological interest, involving a new equation of state for solids. J. Metamorph. Geol. 2011, 29, 333–383. [Google Scholar] [CrossRef]
- Zeitler, P.K.; Meltzer, A.S.; Koons, P.O.; Craw, D.; Hallet, B.; Chamberlain, C.P.; Kidd, W.S.F.; Park, S.K.; Seeber, L.; Bishop, M.; et al. Erosion, Himalayan Geodynamics, and the Geomorphology of Metamorphism. GSA Today 2001, 11, 4–9. [Google Scholar] [CrossRef]
- Grujic, D.; Coutand, I.; Bookhagen, B.; Bonnet, S.; Blythe, A.; Duncan, C. Climatic forcing of erosion, landscape, and tectonics in the Bhutan Himalayas. Geology 2006, 34, 801–804. [Google Scholar] [CrossRef] [Green Version]
- Burbank, D.W.; Blythe, A.E.; Putkonen, J.; Pratt-Sitaula, B.; Gabet, E.; Oskin, M.; Barros, A.; Ojha, T.P. Decoupling of erosion and precipitation in the Himalayas. Nature 2003, 426, 652–655. [Google Scholar] [CrossRef] [PubMed]
- Whipple, K.X. Can erosion drive tectonics? Science 2014, 346, 918–919. [Google Scholar] [CrossRef] [PubMed]
- Abrahami, R.; van der Beek, P.; Huyghe, P.; Hardwick, E.; Carcaillet, J. Decoupling of long-term exhumation and short-term erosion rates in the Sikkim Himalaya. Earth Planet. Sci. Lett. 2016, 433, 76–88. [Google Scholar] [CrossRef]
- Tsering, T.; Wahed, M.S.A.; Iftekhar, S.; Sillanpää, M. Major ion chemistry of the Teesta River in Sikkim Himalaya, India: Chemical weathering and assessment of water quality. J. Hydrol. Reg. Stud. 2019, 24, 100612. [Google Scholar] [CrossRef]
- Goyal, M.K.; Goswami, U.P. Teesta River and Its Ecosystem. In The Indian Rivers. Springer Hydrogeology; Singh, D., Ed.; Springer: Singapore, 2018. [Google Scholar] [CrossRef]
- Adams, B.A.; Whipple, K.X.; Forte, A.M.; Heimsath, A.M.; Hodges, K.V. Climate controls on erosion in tectonically active landscapes. Sci. Adv. 2020, 6, eaaz3166. [Google Scholar] [CrossRef] [PubMed]
- Caddick, M.; Bickle, M.; Harris, N.; Holland, T.; Horstwood, M.; Parrish, R.; Ahmad, T. Burial and exhumation history of a Lesser Himalayan schist: Recording the formation of an inverted metamorphic sequence in NW India. Earth Planet. Sci. Lett. 2007, 264, 375–390. [Google Scholar] [CrossRef]
- Goswami-Banerjee, S.; Bhowmik, S.K.; Dasgupta, S.; Pant, N.C. Burial of thermally perturbed Lesser Himalayan mid-crust: Evidence from petrochemistry and P–T estimation of the western Arunachal Himalaya, India. Lithos 2014, 208–209, 298–311. [Google Scholar] [CrossRef]
- Arora, B.R.; Prajapati, S.K.; Reddy, C.D. Geophysical Constraints on the Seismotectonics of the Sikkim Himalaya. Bull. Seism. Soc. Am. 2014, 104, 2278–2287. [Google Scholar] [CrossRef]
- Vernant, P.; Bilham, R.; Szeliga, W.; Drupka, D.; Kalita, S.; Bhattacharyya, A.K.; Gaur, V.K.; Pelgay, P.; Cattin, R.; Berthet, T. Clockwise rotation of the Brahmaputra Valley relative to India: Tectonic convergence in the eastern Himalaya, Naga Hills, and Shillong Plateau. J. Geophys. Res. Solid Earth 2014, 119, 6558–6571. [Google Scholar] [CrossRef]
- Kayal, J.R. Microearthquake Seismology and Seismotectonics of South Asia; Springer: Dordrecht, The Netherlands; Capital Publishing Company: New Delhi, India, 2008; 248p. [Google Scholar]
Publisher’s Note: MDPI stays neutral with regard to jurisdictional claims in published maps and institutional affiliations. |
© 2022 by the authors. Licensee MDPI, Basel, Switzerland. This article is an open access article distributed under the terms and conditions of the Creative Commons Attribution (CC BY) license (https://creativecommons.org/licenses/by/4.0/).