Abstract
Accurate and detailed multitemporal inventories of landslides and their process characterization are crucial for the evaluation of landslide hazards and the implementation of disaster risk reduction strategies in densely-populated mountainous regions. Such investigations are, however, rare in many regions of the tropical African highlands, where landslide research is often in its infancy and not adapted to the local needs. Here, we have produced a comprehensive multitemporal investigation of the landslide processes in the hillslopes of Bujumbura, situated in the landslide-prone East African Rift. We inventoried more than 1200 landslides by combining careful field investigation and visual analysis of satellite images, very-high-resolution topographic data, and historical aerial photographs. More than 20% of the hillslopes of the city are affected by landslides. Recent landslides (post-1950s) are mostly shallow, triggered by rainfall, and located on the steepest slopes. The presence of roads and river quarrying can also control their occurrence. Deep-seated landslides typically concentrate in landscapes that have been rejuvenated through knickpoint retreat. The difference in size distributions between old and recent deep-seated landslides suggests the long-term influence of potentially changing slope-failure drivers. Of the deep-seated landslides, 66% are currently active, those being mostly earthflows connected to the river system. Gully systems causing landslides are commonly associated with the urbanization of the hillslopes. Our results provide a much more accurate record of landslide processes and their impacts in the region than was previously available. These insights will be useful for land management and disaster risk reduction strategies.
1. Introduction
The highlands of tropical Africa stand out as continental landslide hotspots where, in addition, high population densities are typically found, frequently on the rise and combined with high societal vulnerability [1,2,3,4,5,6,7]. Despite the frequent occurrence of landslides and the high vulnerability of the population, these mountainous regions are less studied in comparison to similar landscapes in other parts of the world, as is the case with many other places in the African tropics [8,9,10]. In particular, comprehensive multitemporal landslide inventories with an accurate, field-based, characterization of the processes and understanding of the factors explaining their occurrence remain rare [6,11,12]. Such information is key in the context of landscape evolution understanding, hazard assessment, and disaster risk reduction strategies [13,14,15]. This highly spatially-resolved local-scale knowledge is particularly needed in densely-populated regions. However, as highlighted by Dewitte et al. [16], several conditions challenge the collection of such information on landslides in the tropics: (1) quick natural vegetation regeneration after a disturbance, concealing landslide scars rapidly; (2) complex heterogeneous patterns in the landscape due to slash-and-burn practices and shifting cultivation; and (3) deep weathering and development of thick regolith. Furthermore, efficient data collection policies on landslide occurrence are rarely in place [8] and field accessibility and working conditions can be, in comparison, more difficult (e.g., [17,18]).
Understanding landslide processes in detail is complex, especially when the natural landscape is shaped by a variety of interacting environmental factors that influence the types and the timings of the slope instabilities, as well as their causation and triggering conditions. Whether static or dynamic, the factors conditioning the hillslope stability only lead to failure when an (un)favorable factor combination is encountered [15,19,20]. Inherited geologic structures or slope morphology are generally considered as preconditioning factors. Those are regarded as static components that may facilitate the action of dynamic destabilizing factors [21,22]. Factors gradually preparing slopes for failure in the long term are generally considered as underlying landslide causes (e.g., shear strength loss due to weathering, climatic changes, or tectonic uplift). These are dynamic factors that typically act over geomorphic timescales. Dynamic processes leading the hillslope to an actively unstable state (i.e., causing a near-immediate response) are considered as triggers [21,22]. The most common dynamic triggers are changes in the slope pore-water pressure with rainfall and earthquakes shaking [15,23] but, e.g., slope undercutting is also known to trigger landslide failures [10]. No slope failure can, however, be attributed to a single and definite cause—preconditioning and triggering factors acting simultaneously to define the present stability of the slope [15]. Even though most studies describe examples where the timing of a landslide failure is associated with a clearly defined trigger event, hillslopes can fail without any apparent trigger [20,24]. In those cases, the slope fails through progressive mechanisms that involve the weakening of hillslope material through time until stability is compromised by a trigger of trivial magnitude [20,24]. Our understanding of landslide complexity is further increased when the landscape is impacted by human activities [15,25]. Human activities play a role not only in the occurrence of new landslides, such as slope instabilities that are associated with deforestation and the presence of roads (e.g., [16,26]), but also in the dynamics of existing landslides (e.g., [27,28]).
Here we target the populated hillslopes of Bujumbura, a city of Burundi set in the mountainous environment of the North Tanganyika-Kivu Rift region (and abbreviated as the NTK Rift). Over the last few years, several studies have shown that landslides are frequent around the city and their impacts are important [16,29,30,31,32,33,34,35]. However, these studies are either too regional in their analysis; or, on the contrary, concentrate on very local issues, in the end providing only a general overview of the issues related to landsliding in the area. For example, Depicker et al. [35] assessed the landslide susceptibility of the NTK Rift based on a relatively undetailed regional landslide inventory where the typology of the slope failures was not considered. Nibigira et al. [31] focused on the dynamics of one large, slow-moving landslide in relation to river damming and its potential for cascading flood hazard. Therefore, it is currently impossible from these studies to draw a clear and accurate picture of the landslide problem and the processes at play in the region of Bujumbura.
The main objective of this research is to produce a comprehensive multitemporal landslide inventory in the populated hillslopes of the city of Bujumbura to improve the understanding of the slope failure processes and the associated hazards. More specifically, we aim to locate the various types of slope instabilities and to identify their timings and their main controlling and triggering factors. We present an analysis of the processes at play through the combination of careful field investigation and visual analysis of satellite images, very-high resolution topographic data, and historical aerial photographs. Specific attention is paid to the role of human activities in landslide distribution patterns.
2. Landslide Processes in the NTK Rift and Environmental Characteristics of Bujumbura
The NTK Rift, in which Bujumbura is located, is situated in the central section of the western branch of the East African Rift (Figure 1a). In this region, tectonic uplift, accompanied with seismic activity and faulting, has initiated landscape rejuvenation through knickpoint retreat, enforcing topographic steepening [16,36,37,38]. This tectonic setting, combined with a tropical climate that favors the occurrence of intense rainfall events and deep weathering, makes the region a landslide hotspot in Africa [6,16]. It is characterized by a large diversity of landslides of various sizes (up to tens of km²) and ages [17,33,35,38,39]; some being much older than 10,000 years [16]. Most of the recent, often shallow landslides (i.e., being <5 m deep) that occurred over the last decades were triggered by rainfall; and a general link between rainfall seasonality and their occurrence has been recently demonstrated [16,33]. During that same period, none of the observed landslides in the region were triggered by earthquakes [16]. While we cannot exclude that earthquakes can trigger landslides (or play a role in their occurrence), their return period can be long and their impacts as triggering factors can be unnoticed over such a short window of observation [16,37]. Moreover, deep-seated landslides in the region can occur without any apparent trigger, due to the long-term evolution of preconditioning drivers alone, such as rock weathering and regolith formation [40]. This observation has an implication for our interpretation of the many landslides that occur in isolation.
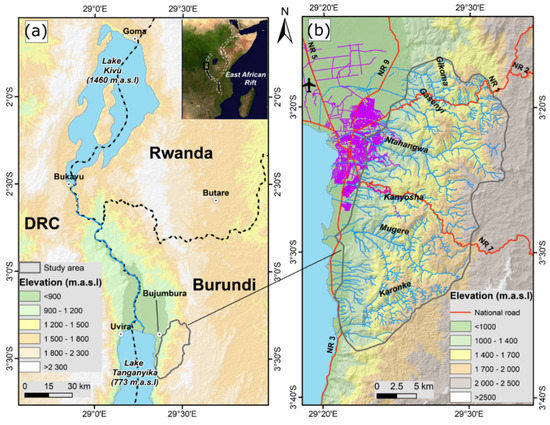
Figure 1.
Location of the study area. (a) Central portion of the western branch of the East African Rift; (b) populated hillslopes of the city of Bujumbura with the drainage network of the main watersheds (delineated with the grey line). The hillshade is derived from 1 Arc-Second SRTM data [47]. The road network in violet and the national roads (NR) in red are from OpenStreetMap.
In the NTK Rift, erosion rates due to recent shallow landslides have been observed to be higher in the rejuvenated landscapes (i.e., actively incised and more recent) than in the surrounding relict landscapes, upstream of the retreating knickpoints and outside the rift shoulders [38]. This difference is mainly explained by the steeper topography in the rejuvenated landscapes. Landslides in the rejuvenated landscapes are more abundant but smaller. This may be a consequence of the higher levels of seismic activity that fracture and weaken the slope material, and a thinner regolith thickness in the rejuvenated landscapes [38]. Many of the recent landslides also occur along roads. There, the landscape drivers are sometimes highly altered (e.g., by hillslope undercutting, inadequate drainage systems, overloading, and landfills), so that triggering conditions are met more often [16]. Another important human disturbance in the region is associated with deforestation. Depicker et al. [38] showed that deforestation in the NTK Rift typically initiates a peak in landslide occurrence that lasts approximately 15 years and increases landslide erosion 2–8 times during that period before it eventually falls back to a level similar to forested conditions. Quarrying of riverbeds for construction material—frequent close to urban centers—is also impacting river systems and consequently landslide activity. This quarrying leads to a lack of bedload with a strong alteration of the river dynamics and an overall increase in river incision. As a consequence, riverbank oversteepening and subsequent bank collapses often occur [16].
The city of Bujumbura is bounded by Lake Tanganyika in the west, and one of the hilly NTK rift shoulders in the east (Figure 1a,b). It is one of the major cities of the region, currently counting about one million inhabitants. The city is also experiencing a rapid and sustained urban expansion that is typically uncontrolled [4]. Due to the presence of Lake Tanganyika, this expansion is also taking place east of the city center, i.e., on the hilly surroundings of the city. The population of Bujumbura is overall highly exposed to hazards such as landslides because of poorly designed urban infrastructures and road networks that often do not consider constraints from the local environmental context. Also, local vulnerability is high and the resilience towards landslide impacts is low because of poverty [41]. Finding safer location alternatives is often impossible for a large share of the population because of limited financial resources. This is particularly true for the population living in the hilly surroundings of Bujumbura, who have generally lower standards of living and rely on small farming activities and small-scale building works.
Alongside landslides, the city of Bujumbura is also severely impacted by gully erosion. Sometimes also occurring as a consequence of landsliding, the interactions between landslides and gullies are typically complex and sometimes involve self-reinforcing feedbacks. The presence of gully erosion on a landslide can attest to both the type of slope movement and its level of activity [42,43]. Large gully erosion systems in which landslides are present are identified in Bujumbura [16]. The origin of these large gullies is assumed to be partly associated with urban infrastructures (as observed in other urban environments such as in Kinshasa [44]). However, a comprehensive inventory is still lacking.
Analyzing the landscape, we see that the hillslopes east of the city are typically incised by rivers flowing westward towards the city center (Figure 1b). The lower reaches of the rivers are in the rejuvenated landscape and affected by several knickpoints. Upslope, the rivers evolve in the relict landscape, where catchment slopes are less steep (Figure 2a). The lithology is made of Precambrian metamorphic (gneiss, quartzites, and meta-quartzites) and igneous rocks (granites), as well as Pleistocene rift sediments (Figure 2b). Gneiss and rift sediments dominate the western part of the study area, while granites prevail in the east. Meta-quartzite and quartzite are dispersed and often used for the extraction of building materials; pegmatite bands are intercalated within gneiss and quartzite units. Rift sediments are thick, while gneiss and granites are usually highly weathered. The region is crossed by active faults related to the rifting dynamics [36,37]. Typically of the NTK Rift, the climate of Bujumbura is tropical, with an average annual rainfall of 1400 mm (the southern catchment of Bujumbura [45], with most of the precipitation occurring during the October–May rainy season [46].
3. Data and Methods
3.1. Landslide Inventory: Types and Processes
Using ©Google Earth imagery with a limited search time per image, Depicker et al. [35] mapped 272 landslides over the study area—these landslides being part of a regional inventory at the scale of the NTK Rift. This inventory made a sole differentiation between shallow and deep-seated processes without any timing characterization. In this study, we present a comprehensive multitemporal landslide inventory that is a significant update of the inventory compiled by Depicker et al. [35]. Here we rely on a more careful and detailed visual interpretation of the very high spatial resolution ©Google Earth images, in addition combined with the analysis of historical and present orthomosaics from aerial photographs (Table 1). The historical aerial photographs available at the Royal Museum for Central Africa (Belgium) for the periods 1957–1959 and 1974 were also used to obtain a stereoscopic vision of the landscape morphology. Note that the quality of the photographs is not always optimal as they have been preserved in paper format and, in some cases, suffer from low-quality imaging (e.g., blurring, under- and overexposure) and ageing effects [48]. A 1-m spatial resolution orthomosaic was built from the 1957–1959 photographs by applying recent Multiview Stereo Photogrammetry (MVS) approaches [48,49,50] in Metashape Pro [51]. We also visually interpreted a set of products (slope angle, contour lines and hillshade) that were derived from a 1-m very high spatial resolution Digital Elevation Model (DEM). The DEM was built from tri-stereo Pléiades images. The photogrammetric processing (bundle adjustment, topographic surface reconstruction, and orthorectification) was performed in MicMac [52].

Table 1.
Ancillary information used in this research. RMCA: Royal Museum for Central Africa; BCG: Bureau de Centralisation Géomatique; DEM: Digital Elevation Model; N.A.: Not Applicable.
Complementary to the visual analysis of these ancillary data (Table 1), we carried out an intensive geomorphological field investigation over the entire study area, where we collected information on the timing of the slope failures via interviews with local farmers. Comprehensive and systematic field surveys were carried out in June–September 2016, September and December 2018, and January–March 2019. These data collection campaigns complement the site-specific investigations that have been carried out in the study area since 2014, typically after the occurrence of damaging landslides.
We used the updated Varnes’ classification [53] for defining the landslide typology. In addition, the landslide area, depth, relative age, activity, and connection to drainage/road lines were assessed. The landslide depth is an important element when analyzing landslide causes and triggers; the occurrence of shallow landslides being, for instance, much more sensitive to disturbances of the landscape surface (e.g., land use/land cover changes) and rainfall conditions than deep-seated landslides [15]. The depth of the surface of rupture of shallow landslides is usually defined in the range of 2–5 m [15,42]. Here, similarly to what has already been used in the NTK Rift [16], we considered landslides to be shallow when their estimated depth was <5 m. The distinction between shallow and deep-seated processes was carried out from topographic data and field observation. Landslides were classified into (i) recent, (ii) old, and (iii) very old movements following the approach proposed by Dewitte et al. [16]. Recent landslides are all new slope failures that were not visible on the historical aerial photographs from the 1950s, or that were visible at that time but showed clear signs of activity. Landslides were considered active when they presented disturbed vegetation patterns and bare soil surfaces. Field observations of tilted trees, deformation/crack features in the displaced material, and damages to infrastructures (such as roads and houses) are also indicators of active landslides. Landslides were classified as old if present on the historical photographs with clear morphological features but showed no signs of recent activity. Many earthflows fall within this category. Earthflows are slow-moving deep-seated landslides with flow-like morphology that are known to sometimes remain active during several decades and whose phases of activity can alternate with periods of relative dormancy (e.g., [42]). Therefore, the fact that earthflows currently exhibit signs of activity does not mean that they are recent. We classified landslides as very old when they were partly (or heavily) dismantled by erosion and showed no sign of activity. Mountain and rock slope deformations are included in this category. This type of landslide may also have evidence of subsequent old landslides.

Figure 2.
(a) Map of the location of the landslides inventoried in the area by type. The “R/R limit” line shows the position of the contact between the rejuvenated (west) and the relict (east) landscapes (REJ and REL)—note the difference in landslide density. The numbers represent the location of recent landslide events whose impacts have been assessed (see Table 3 for further details). (b) Lithological units and active faults for the study area (after [54]). White rectangles represent the locations of Figures 5–7.
3.2. Landslide Controlling and Triggering Factors
Based on earlier regional/local knowledge, we selected four variables (slope angle, slope aspect, lithology, and the relief differentiation into rejuvenated and relict landscapes) to analyze the controls on the spatial landslide distribution [17,32,35,38,40]. We used a local 10-m DEM (Table 1) for calculating the two topographic derivatives (slope angle and slope aspect) as it better grasps the environmental conditions than the 1 Arc-Second SRTM data [47]. The high-resolution Pléiades 1-m DEM was not used as it contains too many artefacts and would provide, even if corrected, too complex information for such a spatial analysis [55,56].
In order to study landslides regardless of their size and to avoid problems of spatial autocorrelation (e.g., [35,56,57]), we manually assigned an initiation point for each landslide in its depletion zone. We then used a non-parametric χ2 statistical test to measure the association between each controlling variable and the occurrence of landslides; in other words, we investigated whether or not each controlling variable has a significant impact on the spatial distribution of landslides (e.g., [55]). We applied a 95% level of confidence. If a variable displayed a significant impact on landsliding (p < 0.05), we calculated the Frequency Ratio (FR) to analyze the importance of its different classes [58]. We performed a stratified analysis by spatial zonation according to the rejuvenated/relict landscapes, the lithology, the differentiation between deep-seated and shallow processes, as well as the current state of landslide activity. We identified visually the knickpoints and the limits of the river incision waves to delineate the rejuvenated and the relict landscapes; the latter being located in each watershed upstream of the highest knickpoint. For the lithological controls, we analyzed only deep-seated landslide distributions. To approximate the slope conditions prior to failure, we gave the initiation point of the deep-seated landslides an average slope angle value derived from several points selected around the landslide head [35,56]. For a more accurate landslide distribution analysis, we removed the mountain and rock slope deformations from the analysis; i.e., deep-seated landslides processes that respond to structural and geodynamics conditions that can only be constrained at a regional scale [59]. We also removed landslides in quarrying areas as well as those associated with road cuts and recent river bank incisions as they are associated with site-specific human-induced conditions that could not be constrained in our analysis [16]. Finally, we also excluded landslides associated with gullies, as their environmental context is much different from the other landslide processes. A similar stratified approach was used for the analysis of the landslides area. This was achieved using boxplots (e.g., [60,61]).
For recent landslides investigated in the field, we collected additional information from testimonies, the Internet, and grey literature to elaborate on the potential role of rainfall and earthquake as triggering factors. These additional data are complementary to the analysis performed by Dewitte et al. [16], who have investigated the occurrence of landslide-triggering earthquakes in the region for the past 60 years. This analysis was based on the USGS earthquake data catalogue and the local KivuSNet network—the dense seismic network implemented in the region since 2016, which contains a seismic station in Bujumbura [62].
4. Results
4.1. Landslides Types and Characteristics
We inventoried 1286 landslides of various types (Figure 2, Figure 3 and Figure 4). All mapped landslides were grouped into six categories with similar characteristics according to the mechanisms of slope failure and the materials involved (Figure 2a and Table 2). Differentiation between slides, flowslides, and avalanches was not always possible for older landslides, whose fresh morphologies could not always be accurately observed. The differentiation between mudflows and debris flows was also sometimes complex, and we have therefore considered them all as debris flows.
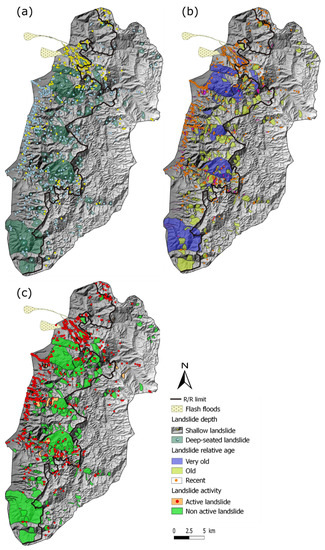
Figure 3.
Mapped landslides classified by (a) depth, (b) relative age, and (c) level of activity. The hillshade is from the 10-m resolution DEM (Table 1). The landslides <14,000 m2 are represented with a dot so that they are visible at the scale of the maps.
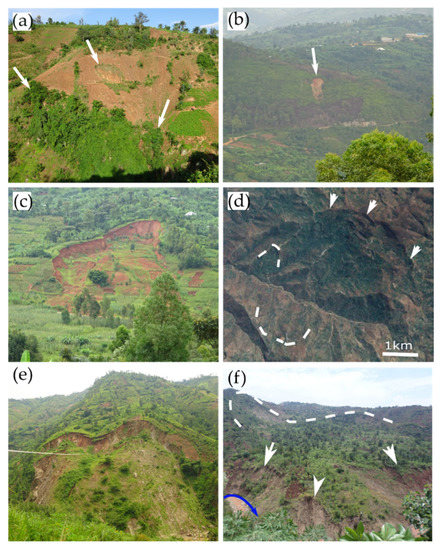
Figure 4.
Examples of landslides of the inventory. (a) Cluster of rainfall-triggered shallow debris slides and avalanches in agricultural crops (headscarps located with white arrows). Photo taken in January 2019 (−3.382°, 29.369°). (b) Shallow planar slide above a road. Photo taken in January 2019 (−3.355°, 29.492°). (c) Recent rotational slide in regolith overlying gneiss in the relict landscape. Photo taken in January 2019 (−3.381°, 29.494°). (d) Old and very old landslides in the Mugere catchment area (©Google Earth, image from December 2018). White arrows locate the head of a mountain slope deformation (−3.477°, 29.419°) while dashed lines delineate the head of two deep-seated landslides. (e) Recent slide reactivation that occurred in 2012 in the rift sediments of the Ntahangwa catchment. Photo taken in January 2019 (−3.380°, 29.404°). The slide is visible on the historical photograph from the 1950s. (f) Active slide—earthflow developed on gneiss with several recent shallow secondary landslides (white arrows) at its toe (that is eroded by the Kanyosha river). Photo taken in August 2016 (−3.432°, 29.388°).
Table 2.
Main characteristics of the landslides and gullies inventoried. CRi: connected to river; CRo: connected to road; R: reactivation; LR: landslide related to river bank/road cut; Tot: total; Rej: rejuvenated landscape; Rel: relict landscape; VO: very old landslide; Re: recent landslide; DL: deep-seated landslides; SL: shallow landslides, AL: active landslides; NL: non-active landslides; Y: yes, N: no; NA: not applicable.
Many of the shallow landslides inventoried are relatively small debris slides and debris avalanches (Figure 2a, Figure 3a and Figure 4a,b). The signatures of shallow landslide scars tend to disappear quickly from the landscape, sometimes already after a few months. Hence, all mapped shallow landslides have been detected in recent high-resolution satellite images and/or in the field; their identification on the historical aerial photographs being difficult because of their lower quality [48]. The smallest landslides observed in the field were not visible on the satellite images either, especially when they occurred alongside road cuts or river banks.
We saw clusters of shallow landslides occurring after heavy rainfall events (clusters of yellow dots in Figure 3a). There, cascading processes where debris slides and avalanches are connected to debris flows were observed. One clear example of such a cluster —and of the related cascading events—occurred on 9 February 2014, and impacted the national road NR1 [33,40]. An accurate field-based inventory carried out a few weeks after the event and further complemented by satellite image analysis allowed us to map 307 recent shallow landslides (Figure 5). Most failures were debris slides and avalanches, many being connected to debris flows and the river network. The material brought by these landslides contributed to debris-rich and kilometer-long flash floods that were associated with this intense rainfall event. Note that a few deep-seated landslides also occurred at that time [40]. One landslide, partly associated with quarrying/mining activities and the mobilization of tailings, was large enough to create a temporary dam on the Gasenyi River that breached and exacerbated the flash floods, leading to dramatic impacts in the city of Bujumbura (Figure 5c and Table 3).
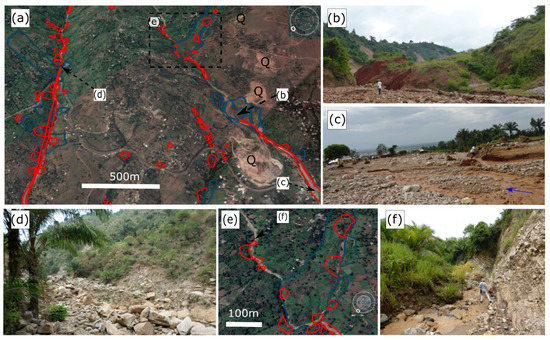
Figure 5.
(a) ©Google Earth image (12 March 2021) of landslides triggered by an intense rainfall event in February 2014. Shallow and deep-seated landslides are in red and blue respectively. Note also the presence of quarries and mines (Q). (b) Toe of a landslide dam partly associated with quarrying and mining activities that blocked the river. Photo taken in July 2014. (c) Example of debris-rich flash flood impact in the Gasenyi River, resulting from the breaching of the upstream landslide dam. The photo was taken a few hours after the event at around 1.5 km downstream of the point indicated by the C arrow. (d) Debris flows with lateral sediment supply from debris avalanches. Photo taken in July 2014. (e) ©Google Earth image (7 March 2018) of an active earthflow in contact with the Gasenyi river. (f) Toe of the earthflow and sediment supply into the river system. Photo taken in July 2014.
Table 3.
Examples of impacts associated with landslide types. These impacts have been recorded in archive sources and/or observed directly in the field. They are located in Figure 2a with their IDs.
Deep-seated landslides show a large range of sizes (between 106 m² and 18.4 km²) and are present in all age categories (Figure 4c–f). The majority of these landslides are old or very old, and all mountain and rock slope deformations belong to the latter category. We observed 82 reactivations of old landslides (Figure 4e) that were classified as recent and active processes. These reactivations concern 76 slides and six earthflows. Although only 0.03% of the active landslides are earthflows, they constitute more than 34% of the active landslide areas. Since all the earthflows were already present in the 1950s and 44% of them are active, it shows that they can easily remain active over a timespan of several decades. Field observation and interviews allowed us to infer ground deformation of around 1 m/year. Other earthflows, such as that of Figure 4f, show deformation patterns that attest to more active movements. In that case, we could certainly assume that some parts of the landslide have displacements of several meters per year. The large majority of the earthflows are connected to rivers; therefore, contributing actively to supply sediments to river systems (e.g., Figure 4f, Figure 5e,f, and Figure 6b). The river reaches located downslope of the earthflows are indeed usually debris-rich (e.g., Figure 5).
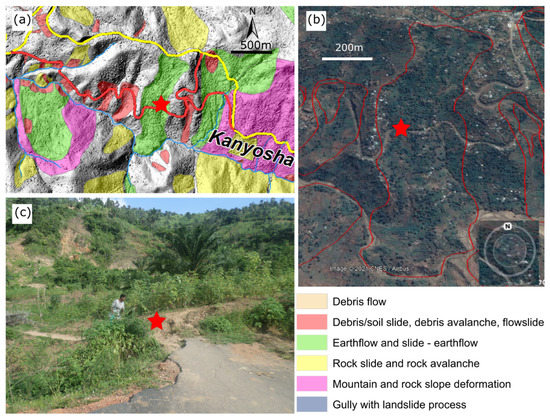
Figure 6.
Focus on a landslide impact zone on the national road NR7. (a) Location of the NR7 in the Kanyosha watershed with the distribution of the inventoried landslides. The current road is in yellow, the former section is in red. The hillshade is derived from 1-m-resolution DEM built from Pléiades tri-stereo images (Table 1). (b) Zoom image of one of the active earthflows (©Google Earth image of 05 August 2018). (c) Damaged section of the former road NR7. Photo taken in June 2016 (−3.431°, 29.393°).
Table 3 provides example of impacts from landslides on infrastructure and people. The landslide and flash flood event of 9 February 2014 (see Section 4.1 for the description of the processes; Figure 5) was one of the most destructive events in the region during the last decade. Another example of the destructive impact of landslides was observed on the national road NR 7 (Figure 6). The original road, built between 1980 and 1984, ran parallel with the northern side of the Kanyosha river. However, this design ignored the presence of numerous landslides, notably the presence of two active large earthflows. Due to the constant damage inflicted to the road, the authorities had no option but to abandon a section with a length of roughly three kilometers. Overall, the large earthflows in the region are frequently associated with pervasive damages, which explains why they are usually less inhabited compared to their surroundings. Pervasive damages are also observed along the gully systems in the Rift sediments (Figure 7) and along some river reaches. The impacts that we have described (Table 3) are clearly an underestimation of the problems that the region is facing.
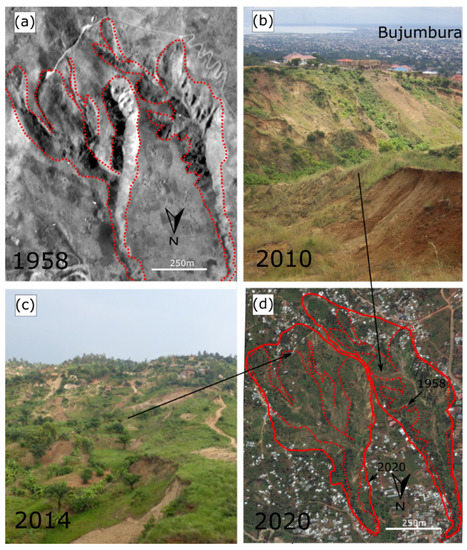
Figure 7.
Example of two gullies with landslide processes, located within a densely populated outskirt of Bujumbura (−3.384°, 29.395°). The image sequence illustrates the rapid evolution of the gullies and the built-up area between 1958 to 2020. (a) Historical orthomosaic from 1958; (b) recent photo of the gully at the right (©Alexis Ciza); (c) recent photo of the large landslide that develop in the gully at the left; (d) ©Google Earth image from 28 January 2020. The dotted lines represent the limits of the gullies in 1958.
4.2. Landslide Causes and Triggers
Our data show that the slope angle is the main landslide controlling factor (Table 4). This control is particularly important for shallow landslides. They tend to concentrate on slopes >25° (Figure 8) and this effect is slightly more prominent in the relict landscape. Overall, the deep-seated landslides occur on slopes with a lower steepness; yet this control is more important for active, generally smaller, landslides. Rift sediments and gneiss are both favorable to landslides (Figure 8k–m). These two lithologies are the dominant rocks in the rejuvenated landscape (the Rift sediment lithology is found only in this region). Overall, the control of slope angle is larger in these two lithologies (Figure 8n–q). Slope aspect is not significant for the deep-seated landslides and, at this spatial scale of this study, a link between the presence of faults cannot be highlighted. For the active processes, a small association is observed for south- to south–west-oriented slopes (Figure 8j).
Table 4.
Association between the occurrence of landslides (L) and the controlling factors. DL: deep-seated landslide; SL: shallow landslide; AL: active landslide; NL: non-active landslide; ADL: active deep-seated landslide; ASL: active shallow landslide; RR: relief differentiation into the rejuvenated (Rej) and relict (Rel) landscapes.
The study area stretches over 490 km², of which 237 km² and 253 km² are in the rejuvenated and relict landscapes respectively. Nearly one fifth of the study area (98.3 km²) is affected by landslides. In addition, many landslides developed in pre-existing slope failures. When the landslides are considered separately (i.e., without overlay), their total cumulative area equals 107 km² (Table 2), which means that 8.7 km² of slope failures are located within past landslides.
There is an important difference between the percentages of the land affected by landslides in the rejuvenated (79.6 km², 34% of the total area) and relict (27.4 km², 11%) landscapes. When mountain slope deformations are not considered, the landslide areas represent 48 km² and 11 km² (23% and 5%) for the rejuvenated and relict landscapes, respectively. The occurrence of deep-seated landslides is positively associated with landscape rejuvenation (Table 2 and Table 4). The total area covered by deep-seated landslides is much larger than that of the shallow landslides (102.5 km² vs. 4.5 km²). Recent landslides cover an area of 5.3 km². A total 88% of this area is related to the occurrence of 458 rather large deep-seated landslides. Active landslides cover an area of 14.2 km². The analysis of the size distribution shows that landslides are larger in the rejuvenated landscape (Figure 9e). The population differences are much larger when looking at the activity of the landslides; active landslides being smaller whatever position in the landscape (relict/rejuvenated) or depth is considered (Figure 9a–d). The recent landslides are smaller (Figure 9f). Most of largest recent landslides are in the rejuvenated landscape.
Gullies are mainly observed in the rejuvenated landscape (Figure 2). Gullies developing within landslides are, in general, associated with active earthflows. However, the majority of the gullies are not a consequence of a landslide process. Such gullies are found in the lower part of the study area at the outskirts of the city of Bujumbura within the unconsolidated Rift sediments (Figure 2 and Figure 7). Out of the 93 gullies mapped in this region, 55 were initiated after the 1950s. There are 79 active gullies that show clear signs of extension with an average headcut retreat of around 100 m over the last 70 years, the largest retreat being >250 m. Landslides are frequent along the banks of these gullies. In some case, gully erosion triggers relatively large slope failures (Figure 7).
Since the 1950s, both the built-up area and the road network have been largely extended, particularly over the outskirts of the city (Figure 7). The landslides that are directly connected to the road network are typically small debris slides/avalanches/flows and rockfalls, usually observed after a rainstorm. They are observed along road cuts as well as at the level of road gutters and other runoff concentration zones associated with the impervious surfaces. Landslides are also observed along river banks (frequently of the slide type) and at quarrying/mining sites (Figure 5). Over the last decades, the quarrying of river bed material has increased (in parallel with the growth of the city). As a consequence, the sediment patterns of the rivers are heavily disturbed and so the river flows. A wave of increased river incision is observed in many places. This leads to a local erosion and oversteepening of the river banks, which can cause landsliding, especially in the Rift sediments.
We inventoried four clusters of recent landslides (9 February 2014, 307 landslides; 2007, 36 landslides; 2010, 44 landslides; March 2018, 13 landslides). These (mostly shallow) landslides were all reported as triggered by heavy rainfall. Interviews have also allowed us to constrain the timings of the occurrence of 14 other landslides, all associated with rainfall. However, only the timing of the most problematic occurrences could be constrained, for most recent landslides (especially those of limited size/impacts or that occurred in isolation), information on the timing or triggering event could not be obtained from interviews with local residents. The timing constrained between two subsequent satellite images in ©Google Earth shows that these landslides usually occur during the rainy season. Concerning the potential role of earthquakes in the occurrence of landslides, no related landslide activity was reported nor mentioned by the interviewed residents; which corroborates the findings of Dewitte et al. [16].
5. Discussion
5.1. Landslide Inventory and Data Reliability
With an inventory of more than 1200 landslides, we have identified four times more slope failures than the regional-scale study of Depicker et al. [35]. When compared to the previous local studies that identified a few tens of landslides [30,32,34], the contrast is even bigger. Such an improvement in the inventory clearly shows that with limited means (field work, interviews, ©Google Earth images), highly spatially-explicit local-scale knowledge can be collected. The use of historical aerial photographs was important to further constrain the timing of the deep-seated landslides and the gullies. The access to such photographs, provided they are existent in the first place, is more difficult, as the institutions from which they can be obtained are not always easy to identify.
Although our inventory provides a unique dataset, it still suffers from incompleteness. The true portion of the shallow landslides is underestimated since they tend to disappear rather quickly after their initiation; a process that is also observed in other tropical regions [6,17]. In addition, many landslides are too small to be identified in ©Google Earth. ©Google Earth imagery covers 20 years in the hillslopes of Bujumbura, with sometimes up to 20 images over this period [38]. However, most of these images cover the last 5 years, introducing an additional time bias in the inventory. While such a time window of 20 years remains relatively narrow compared to what can be achieved in regions where several covers of good quality aerial photographs are available and field work has been systematically conducted for many decades (e.g., [64]), our dataset of 403 shallow landslides is robust enough to analyze the spatial patterns of the slope failures [35]. For the deep-seated landslides, we certainly miss some of the eldest/smallest features whose morphology is altered in time, especially with regard to the deep weathering that is present in this tropical environment [40]. Landslides of the avalanche types, whose topographic signature is usually less pronounced than that of the slide types, are certainly under-represented too. Despite these issues of inventory completeness, when we consider the ancillary data used in this research as well as the field investigations that were carried out, we can argue that this multitemporal inventory is exhaustive and accurate enough to understand how deep-seated landslides occur in these hillslopes.
Field observations allowed us to identify active landslides whose ground deformation patterns were too limited to be visually mapped from ©Google Earth imagery. Yet, such an assessment could not be carried out thoroughly everywhere in the study area and several active landslides were probably missed. Theoretically, further insight into slow-moving ground deformations and the activity state of the landslides could be assessed through radar satellite remote sensing [65], a technique that was successfully applied in the nearby city of Bukavu [66]. However, the relative low number of natural coherent zones, such as rock outcrops, as compared to less-weathered environments and the dominant north–south orientation of many hillslopes, is a limiting factor for such an approach. Furthermore, although the hillslopes are populated, the built environment is not as dense as in Bukavu [66]. These reasons explain why a radar-based quantitative analysis of the landslide activity has hitherto remained challenging in these hillslopes [67].

Figure 8.
Frequency distributions for landslides (orange bars; each landslide is represented by one pixel over its depletion area) and for all pixels outside the landslide bodies in the entire study area, rejuvenated, and relict landscapes (blue, green, and violet bars respectively). The other bars (grey, blue-grey, red, and yellow) are landslides distributions within the different lithologies; respectively in gneiss, rift sediments, granite, and quartzite. (a–d) Slope angle in study area respectively for deep-seated (DL), shallow (SL), active (AL), and non-active (NL) landslides; (e) landslide distribution within the differentiation of rejuvenated and relict landscape; (f,g) slope angle in the rejuvenated landscape respectively for deep-seated and shallow landslides; (h,i) slope angle in relict landscape respectively for deep-seated and shallow landslides; (j) slope aspect for active landslides; (k,l) lithology in study area respectively for all deep-seated and active deep-seated landslides; (m) lithology in the rejuvenated landscape for deep-seated landslides; (n–q) slope angle respectively in gneiss, rift sediments, granite, and quartzite for deep-seated landslides. For each class, the corresponding frequency ratio (FR) is indicated.
5.2. Landslide Processes: Causes and Triggers
The landscape in the hillslopes of Bujumbura is strongly dominated by mass-wasting processes. Even when the mountain slope deformations are left apart, 12% of the landscape is affected by landslides. Such a density is comparable to that of other highly landslide-prone regions in different climatic settings (e.g., [64,68]). The rejuvenation of the landscape is clearly an important driver on the occurrence of the deep-seated landslides, their density being particularly high in that part of the landscape. The importance of knickpoint migration on the distribution of landslides is frequently highlighted in threshold hillslopes [69]. Our study clearly highlights that, even at the local level, the characterization of the landslide processes must consider the geomorphological context associated with the long-term evolution of the landscape. Contrary to what is demonstrated by Depicker et al. [38] at the scale of the NTK Rift, landscape rejuvenation does not seem to impact the size distribution of the shallow landslides in the hillslopes of Bujumbura. This difference probably has to be sought in the rather limited extent of our study area that does not display a large gradient in seismic activity, while seismic fracturing of the hillslopes was identified by Depicker et al. [38] as an important mechanism to explain differences in size distributions between rejuvenated and relict landscapes.
The non-homogeneous distribution of rock types and their weathering throughout the study area explains some of the differences in landslide patterns. For example, gneiss here offers more favorable conditions for landslides than granite, which could be linked to differences in rock mass strength. The role of gneiss was also highlighted in a similar environment just north of the NTK Rift in the Rwenzori Mountains [17]. The seismo-tectonic context and the variety of ages and expositions of the lithologies are factors that are considered in differences in rock mass strength [70]. In addition, climatic weathering and the associated development of thick regolith cannot be ignored (for example Figure 4c). The formation of regolith can be highly depending on very local geological and topographical conditions [40]. Earthflows are slow-moving processes that rely on the availability of mobile material such as regolith. Their distribution and dynamics is certainly influenced by this.
The significant difference in landslide size that is observed between active (generally recent) and non-active deep-seated landslides (Figure 2 and Figure 9a–d) could be because the period of observation is too short to capture the impact of high-magnitude triggering events such as large earthquakes [16,71]. In addition, we know that climatic conditions have changed over the past tens of thousands of years [62,72,73]; the climate also being a key driver acting as cause and trigger of deep-seated landslides [40,74]. It is important to note that the size of old landslides, as exemplified for the Ikoma landslide in the neighbor region of Bukavu in DR Congo [40], reflects a history of accumulating slope deformation phases [75]. In other words, the actual size of an old landslide is not necessarily the consequence of one single slope failure associated with one high-magnitude triggering event. The numerous reactivations that we have detected in the region of Bujumbura support this scenario of path-dependency where landslide size grows in time [76].
Our study attests that almost all recent landslides are rainfall-triggered. This is consistent with the regional analysis of Dewitte et al. and Monsieurs et al. [16,33]. These typically small debris slides/avalanches/flows are also observed along road cuts, road gutters, and other runoff concentration zones. Hence, these human interventions in the landscape exacerbate the impact of rainfall on landslides. The analysis of the historical photographs reveals that the extent of the forest in the hillslopes of Bujumbura was already limited in the 1950s. Deforestation cannot therefore be invoked as a shallow landslide driver [16].
The uncontrolled exploitation of construction materials in river beds/banks profoundly modifies rivers dynamics and morphologies. In many places, enhanced river incision is triggering the occurrence or acceleration of landslides. Changes in surface and subsurface hydrology associated with the extension of built-up areas, road networks, and changes in river dynamics with a river’s exploitation is also thought to be causing the emergence of new gullies. The rapid and continuous development of the gullies and the associated landslide processes suggest that most of them have not yet reached equilibrium.

Figure 9.
Boxplots showing the distribution of the landslide size (m2) with regard to landslide (L) activity in (a) the entire study area; (b) the rejuvenated landscape (rej.), and (c) the relict landscape (rel.). (d) Boxplot comparing the distribution of deep-seated landslide (DL) size (m2) in function of their activity in rejuvenated and relict landscape; (e) boxplot comparing the distribution of the landslide (L) size (m2) in function of their position in the landscape (rejuvenated (rej.) or relict landscape (rel.)); (f) boxplot comparing the distribution of landslide (L) size (m2) in function of their age. Boxplots give lower and upper quartiles and median. The whiskers of each box represent 1.5 times the interquartile range. Outliers beyond whiskers are shown as dots. For each boxplot, the average area X of the landslides is provided.
5.3. Landslide Impacts and Disaster Risk Reduction Strategies
Landslides and gullies are affecting infrastructures and the livelihood of many in the region—this is not surprising considering that >20% of the study area is affected by landslides, of which a significant portion of the processes are active. While landslides are intrinsically a natural phenomenon, the data we collected show that human disturbances are amplifying their occurrences and impacts. While no easy solution exists to mitigate the impacts of landsliding, this study offers for the first time a clear overview of the extent of the landslide phenomena in the region. The inventory of the landslides and the understanding gained of their mechanisms, causes, and triggers constitute the elementary—and crucial—knowledge on which can be built disaster risk reduction strategies. We also identify the zones that are currently the most problematic and the areas that could be impacted by the reactivation of existing instable slopes. The information provided here is also crucial for any further investigation of the evolution of the landscape and the dangers it offers. As such, this study provides a first step towards an improvement of the management of the landscape and the design of disaster risk reduction strategies. Ideally such strategies should not only consider the direct impacts of landslides, such as those we highlighted here, but also the indirect impacts (soil degradation, water quality of the river systems, lake sedimentation, and biodiversity loss, etc.).
6. Conclusions
In this work, we aimed at characterizing and better understanding landslides in the populated hillslopes around Bujumbura. We show that this region is highly landslide-prone, with >20% of the landscape being affected by various slope failures. This is similar to some of the highest landslide-prone regions in different climatic settings. We recorded a multitemporal inventory containing 1286 landslides and gullies with landslides categorized as active and non-active; old/very old, and recent; shallow, and large deep-seated processes. Our data show that most recent landslides, i.e., landslides that have occurred since the 1950s, are relatively small, shallow slope failures. These landslides, commonly debris slides and debris avalanches, are favored by the steepest slopes and typically triggered by heavy rainfall. For the largest rainfall events, clusters of co-occurring landslides are observed with the presence of cascading processes that lead to the formation of debris flows. Shallow landslides can be influenced by interactions with the road network and the quarrying of the rivers. The deep-seated landslides are the most important by area covered; they are controlled by the lithology and the weathering of rocks and mostly occur in the rejuvenated landscape. The larger size of the old deep-seated landslides suggest that they could be related to high-magnitude triggering events, such as earthquakes, that were not captured during our observation window. The changing climatic conditions over the past thousands of years could also explain this size difference. However, the presence of many reactivations also shows that the increasing size of the landslides through time is a common process that does not need to call for extreme and/or changing environmental conditions. Earthflows are amongst the deep-seated processes, the slope failures that show the most evident signs of activity. They are commonly connected to the river system and contribute significantly as sediment supplier. Most gullies are active. Apart from those that are associated with the dynamics of the earthflows, they have a strong association with the urban development of the region, and their development is a common trigger of landslides. The active landslides/gullies can be highly destructive and cause loss of human life. Regular registration of landslides and predictive studies can be envisaged to better understand the landslide mechanism and evolution in this populated area of Burundi. This study shows that despite the paucity of landslide data collection policy in the region and the absence of an existing database, the combination of basic inventory approaches with remote sensing-based data and fieldwork allowed us to build a robust dataset to better understand the processes at play. This will hopefully help in the implementation of future management and disaster risk reduction strategies in the region.
Author Contributions
Conceptualization, D.K., L.A.B. and O.D.; methodology, D.K. and O.D.; validation, D.K. and O.D.; formal analysis, D.K. and O.D.; investigation, D.K., O.D., P.N. and L.N.; resources, D.K., O.D., P.N., L.N., Antoine Dille (A.D.) and Arthur Depicker (A.D.); data curation, D.K.; writing—original draft preparation, D.K. and O.D.; writing—review and editing, D.K., Antoine Dille (A.D.), Arthur Depicker (A.D.) and O.D.; visualization, D.K. and O.D.; supervision, L.A.B., P.N., A.A. and O.D.; project administration, L.A.B., P.N., L.N. and A.A.; funding acquisition, L.A.B., P.N., A.A. and O.D. All authors have read and agreed to the published version of the manuscript.
Funding
Désiré Kubwimana was funded by a PhD scholarship from the Bureau de Bourses d’Etudes et des Stages (BBES Burundi) and the Agence Marocaine pour la Coopération Internationale (AMCI). Désiré Kubwimana was also supported for a research stay at the RMCA by the RA_S1_RGL_GEORISK project funded by the Development Cooperation programme of the Royal Museum for Central Africa (Belgium) with support of the Directorate-General Development Cooperation and Humanitarian Aid of Belgium (Belgium). Fieldwork was partly supported by the Belgian Scientific Policy (BELSPO) project RESIST (SR/00/305) and as well as the Académie de Recherche d’Enseignement Supérieur—Projet de Formation Sud (ARES—PFS). Pléiades images and historical aerial photograph acquisitions were provided respectively via RESIST and the BELSPO PAStECA projects (BR/165/A3/PASTECA). Antoine Dille was supported by the BELSPO MODUS (SR/00/358) project. Arthur Depicker was supported by the PAStECA project.
Informed Consent Statement
Not applicable.
Data Availability Statement
Not applicable.
Acknowledgments
The authors would like to thank François Kervyn for the logistical support for fieldwork and Toussaint Muguruka Bibentyo for insight in data analysis. Special thanks go to University of Burundi colleagues Aloys Ndayisenga, Athanase Nkunzimana, Jean Baptiste Hamenyimana, and Pierre Claver Ngenzebuhoro.
Conflicts of Interest
The authors declare no conflict of interest.
References
- Seto, K.C.; Güneralp, B.; Hutyra, L.R. Global forecasts of urban expansion to 2030 and direct impacts on biodiversity and carbon pools. Proc. Natl. Acad. Sci. USA 2012, 109, 16083–16088. [Google Scholar] [CrossRef] [PubMed]
- Bizimana, H.; Sönmez, O. Landslide occurrences in the hilly areas of Rwanda, their causes and protection measures. Disaster Sci. Eng. 2015, 1, 1–7. [Google Scholar]
- Kervyn, M.; Jacobs, L.; Maes, J.; Che, V.B.; de Hontheim, A.; Dewitte, O.; Isabirye, M.; Sekajugo, J.; Kabaseke, C.; Poesen, J.; et al. Landslide resilience in Equatorial Africa: Moving beyond problem identification! Belgeo 2015, 1, 1–22. [Google Scholar] [CrossRef]
- Michellier, C.; Pigeon, P.; Kervyn, F.; Wolff, E. Contextualizing vulnerability assessment: A support to geo-risk management in central Africa. Nat. Hazards 2016, 82, 27–42. [Google Scholar] [CrossRef]
- Balegamire, C.; Michellier, C.; Muhigwa, J.B.; Delvaux, D.; Imani, G.; Dewitte, O. Vulnerability of buildings exposed to landslides: A spatio-temporal assessment in Bukavu (DR Congo). Geo- Eco-Trop 2017, 41, 263–278. [Google Scholar]
- Broeckx, J.; Vanmaercke, M.; Duchateau, R.; Poesen, J. A data-based landslide susceptibility map of Africa. Earth Sci. Rev. 2018, 185, 102–121. [Google Scholar] [CrossRef]
- Emberson, R.; Kirschbaum, D.; Stanley, T. New global characterisation of landslide exposure. Nat. Hazards Earth Syst. Sci. 2020, 20, 3413–3424. [Google Scholar] [CrossRef]
- Maes, J.; Kervyn, M.; de Hontheim, A.; Dewitte, O.; Jacobs, L.; Mertens, K.; Vanmaercke, M.; Vranken, L.; Poesen, J. Landslide risk reduction measures: A review of practices and challenges for the tropics. Prog. Phys. Geogr. Earth Environ. 2017, 41, 191–221. [Google Scholar] [CrossRef]
- Reichenbach, P.; Rossi, M.; Malamud, B.D.; Mihir, M.; Guzzetti, F. A review of statistically-based landslide susceptibility models. Earth-Sci. Rev. 2018, 180, 60–91. [Google Scholar] [CrossRef]
- Lacroix, P.; Handwerger, A.L.; Bièvre, G. Life and death of slow-moving landslides. Nat. Rev. Earth Environ. 2020, 1, 404–419. [Google Scholar] [CrossRef]
- Che, V.B.; Kervyn, M.; Ernst, G.G.J.; Trefois, P.; Ayonghe, S.; Jacobs, P.; Van Ranst, E.; Suh, E. Systematic documentation of landslide events in Limbe area (Mt Cameroon Volcano, SW Cameroon): Geometry, controlling, and triggering factors. Nat. Hazards 2011, 59, 47–74. [Google Scholar] [CrossRef]
- Jacobs, L.; Maes, J.; Mertens, K.; Sekajugo, J.; Thiery, W.; Van Lipzig, N.; Poesen, J.; Kervyn, M.; Dewitte, O. Reconstruction of a flash flood event through a multi-hazard approach: Focus on the Rwenzori Mountains, Uganda. Nat. Hazards 2016, 84, 851–876. [Google Scholar] [CrossRef]
- van Westen, C.; Castellanos, E.; Kuriakose, S.L. Spatial data for landslide susceptibility, hazard, and vulnerability assessment: An overview. Eng. Geol. 2008, 102, 112–131. [Google Scholar] [CrossRef]
- Guzzetti, F.; Mondini, A.C.; Cardinali, M.; Fiorucci, F.; Santangelo, M.; Chang, K.-T. Landslide inventory maps: New tools for an old problem. Earth-Sci. Rev. 2012, 112, 42–66. [Google Scholar] [CrossRef]
- Sidle, R.C.; Bogaard, T. Dynamic earth system and ecological controls of rainfall-initiated landslides. Earth-Sci. Rev. 2016, 159, 275–291. [Google Scholar] [CrossRef]
- Dewitte, O.; Dille, A.; Depicker, A.; Kubwimana, D.; Maki Mateso, J.-C.; Mugaruka Bibentyo, T.; Uwihirwe, J.; Monsieurs, E. Constraining landslide timing in a data-scarce context: From recent to very old processes in the tropical environment of the North Tanganyika-Kivu Rift region. Landslides 2021, 18, 161–177. [Google Scholar] [CrossRef]
- Jacobs, L.; Dewitte, O.; Poesen, J.; Maes, J.; Mertens, K.; Sekajugo, J.; Kervyn, M. Landslide characteristics and spatial distribution in the Rwenzori Mountains, Uganda. J. Afr. Earth Sci. 2017, 134, 917–930. [Google Scholar] [CrossRef]
- Monsieurs, E.; Kirschbaum, D.; Thiery, W.; van Lipzig, N.; Kervyn, M.; Demoulin, A.; Jacobs, L.; Kervyn, F.; Dewitte, O. Constraints on Landslide-Climate Research Imposed by the Reality of Fieldwork in Central Africa. In Proceedings of the 3rd North American Symposium Landslides, Landslides: Putting Experience, Knowledge and Emerging Technologies into Practice, Roanoke, VA, USA, 4–8 June 2017; pp. 158–168. [Google Scholar]
- Roering, J.J.; Kirchner, J.W.; Dietrich, W.E. Characterizing structural and lithologic controls on deep-seated landsliding: Implications for topographic relief and landscape evolution in the Oregon Coast Range, USA. GSA Bull. 2005, 117, 654–668. [Google Scholar] [CrossRef]
- McColl, S.T. Landslide Causes and Triggers. In Landslides Hazards, Risks and Disasters; Schroder, J.F., Davies, T., Eds.; Academic Press: London, UK, 2015; pp. 17–42. [Google Scholar]
- Glade, T.; Crozier, M.J. The nature of landslide hazard impact. In Landslide Hazard and Risk; Glade, T., Anderson, M.G., Crozier, M.J., Eds.; John Wiley & Sons: Chichester, UK, 2005; pp. 43–74. [Google Scholar]
- Bogaard, T.A.; Greco, R. Landslide hydrology: From hydrology to pore pressure. Wiley Interdiscip. Rev. Water 2016, 3, 439–459. [Google Scholar] [CrossRef]
- Keefer, D.K. The importance of earthquake-induced landslides to long-term slope erosion and slope-failure hazards in seismically active regions. Geomorphology 1994, 10, 265–284. [Google Scholar] [CrossRef]
- Casagli, N.; Guzzetti, F.; Jaboyedoff, M.; Nadim, F.; Petley, D. Science for Disaster Risk Management: Knowing Better and Losing Less. In Hydrological Risk: Landslides; Poljanšek, K., Marín Ferrer, M., De Groeve, T., Clark, I., Eds.; Publications Office of the European Union: Luxembourg, 2017; p. 209. [Google Scholar] [CrossRef]
- Jaboyedoff, M.; Michoud, C.; Derron, M.H.; Voumard, J.; Leibundgut, G.; Sudmeier-Rieux, K.; Nadim, F.; Leroi, E. Human-Induced Landslides: Toward the analysis of anthropogenic changes of the slope environment. Landslides Eng. Slopes Exp. Theory Pract. 2016, 1, 217–232. [Google Scholar]
- Yunus, A.P.; Fan, X.; Subramanian, S.S.; Jie, D.; Xu, Q. Unraveling the drivers of intensified landslide regimes in Western Ghats, India. Sci. Total Environ. 2021, 770, 145357. [Google Scholar] [CrossRef]
- Van Den Eeckhaut, M.; Poesen, J.; Dewitte, O.; Demoulin, A.; De Bo, H.; Vanmaercke-Gottigny, M.C. Reactivation of old landslides: Lessons learned from a case-study in the Flemish Ardennes (Belgium). Soil Use Manag. 2007, 23, 200–211. [Google Scholar] [CrossRef]
- Troncone, A.; Pugliese, L.; Lamanna, G.; Conte, E. Prediction of rainfall-induced landslide movements in the presence of stabilizing piles. Eng. Geol. 2021, 288, 106143. [Google Scholar] [CrossRef]
- Moeyerson, J.; Trefois, P. La Protection du Site Curgo–Kabezi–Bujumbura Contre les Risques Hydrologiques dans le Bassin de la Rivière Nyabage Etude de Formulation d’une Opération de Conservation; Section de Géomorphologie, Tervuren, Belgium. 2012. Available online: https://repository.tudelft.nl/islandora/object/uuid:3e6a844d-e90e-4234-b83e-6215846ca652?collection=research (accessed on 16 June 2021).
- Nibigira, L.; Draidia, S.; Havenith, H.-B. GIS-Based Landslide Susceptibility Mapping in the Great Lakes Region of Africa, Case Study of Bujumbura Burundi. In Engineering Geology for Society and Territory; Springer: Berlin/Heidelberg, Germany, 2015; Volume 2, pp. 985–988. [Google Scholar] [CrossRef]
- Nibigira, L.; Havenith, H.-B.; Archambeau, P.; Dewals, B. Formation, breaching and flood consequences of a landslide dam near Bujumbura, Burundi. Nat. Hazards Earth Syst. Sci. 2018, 18, 1867–1890. [Google Scholar] [CrossRef]
- Désiré, K.; Lahsen, A.B.; Mahfoud, B.; Olivier, D.; Abdellah, A.; Tarik, B. Landslides Susceptibility Assessment Using AHP method in Kanyosha Watershed (Bujumbura-Burundi): Urbanisation and Management Impacts. In MATEC Web of Conferences; EDP Sciences: Les Ulis, France, 2018; Volume 149, p. 02071. [Google Scholar]
- Monsieurs, E.; Jacobs, L.; Michellier, C.; Basimike Tchangaboba, J.; Bamulezi Ganza, G.; Kervyn, F.; Maki Mateso, J.-C.; Mugaruka Bibentyo, T.; Kalikone Buzera, C.; Nahimana, L.; et al. Landslide inventory for hazard assessment in a data-poor context: A regional-scale approach in a tropical African environment. Landslides 2018, 15, 2195–2209. [Google Scholar] [CrossRef]
- Shirambere, G.; Nyadawa, M.; Masekanya, J.; Nyomboi, T. Comparative assessment of landslide susceptibility by logistic regression and first order second moment method: Case study of Bujumbura Peri-Urban Area, Burundi. J. Eng. Res. Appl. 2018, 8, 28–37. [Google Scholar]
- Depicker, A.; Jacobs, L.; Delvaux, D.; Havenith, H.-B.; Maki Mateso, J.-C.; Govers, G.; Dewitte, O. The added value of a regional landslide susceptibility assessment: The western branch of the East African Rift. Geomorphology 2020, 353, 106886. [Google Scholar] [CrossRef]
- Smets, B.; Delvaux, D.; Ross, K.A.; Poppe, S.; Kervyn, M.; d’Oreye, N.; Kervyn, F. The role of inherited crustal structures and magmatism in the development of rift segments: Insights from the Kivu basin, western branch of the East African Rift. Tectonophysics 2016, 683, 62–76. [Google Scholar] [CrossRef]
- Delvaux, D.; Mulumba, J.-L.; Sebagenzi, M.N.S.; Bondo, S.F.; Kervyn, F.; Havenith, H.-B. Seismic hazard assessment of the Kivu rift segment based on a new seismotectonic zonation model (western branch, East African Rift system). J. Afr. Earth Sci. 2017, 134, 831–855. [Google Scholar] [CrossRef]
- Depicker, A.; Govers, G.; Jacobs, L.; Campforts, B.; Uwihirwe, J.; Dewitte, O. Interactions between deforestation, landscape rejuvenation, and shallow landslides in the North Tanganyika–Kivu rift region, Africa. Earth Surf. Dyn. 2021, 9, 445–462. [Google Scholar] [CrossRef]
- Jacobs, L.; Dewitte, O.; Poesen, J.; Delvaux, D.; Thiery, W.; Kervyn, M. The Rwenzori Mountains, a landslide-prone region? Landslides 2016, 13, 519–536. [Google Scholar] [CrossRef]
- Dille, A.; Kervyn, F.; Mugaruka Bibentyo, T.; Delvaux, D.; Bamulezi Ganza, G.; Ilombe Mawe, G.; Kalikone Buzera, C.; Safari Nakito, E.; Moeyersons, J.; Monsieurs, E.; et al. Causes and triggers of deep-seated hillslope instability in the tropics—Insights from a 60-year record of Ikoma landslide (DR Congo). Geomorphology 2019, 345, 106835. [Google Scholar] [CrossRef]
- Pollock, W.; Wartman, J. Human Vulnerability to Landslides. GeoHealth 2020, 4, e2020GH000287. [Google Scholar] [CrossRef] [PubMed]
- Mackey, B.H.; Roering, J.J. Sediment yield, spatial characteristics, and the long-term evolution of active earthflows determined from airborne LiDAR and historical aerial photographs, Eel River, California. GSA Bull. 2011, 123, 1560–1576. [Google Scholar] [CrossRef]
- Poesen, J. Soil erosion in the Anthropocene: Research needs. Earth Surf. Process. Landf. 2018, 43, 64–84. [Google Scholar] [CrossRef]
- Makanzu Imwangana, F.; Dewitte, O.; Ntombi, M.; Moeyersons, J. Topographic and road control of mega-gullies in Kinshasa (DR Congo). Geomorphology 2014, 217, 131–139. [Google Scholar] [CrossRef]
- Kirasa Energy. Etude de l’évaluation de la vulnérabilité de l’aménagement hydroélectrique de deux centrales en cascade sur la rivière Kirasa à la variabilité et aux changements climatiques de la région, unpublished.
- Bidou, J.E.; Ndayirukiye, S.; Ndayishimiye, J.P.; Sirven, P. Géographie du Burundi; Hatier: Paris, France, 1991. [Google Scholar]
- Farr, T.G.; Rosen, P.A.; Caro, E.; Crippen, R.; Duren, R.; Hensley, S.; Kobrick, M.; Paller, M.; Rodriguez, E.; Roth, L.; et al. The Shuttle Radar Topography Mission. Rev. Geophys. 2007, 45, RG2004. [Google Scholar] [CrossRef]
- Mboga, N.; Grippa, T.; Georganos, S.; Vanhuysse, S.; Smets, B.; Dewitte, O.; Wolff, E.; Lennert, M. Fully convolutional networks for land cover classification from historical panchromatic aerial photographs. ISPRS J. Photogramm. Remote Sens. 2020, 167, 385–395. [Google Scholar] [CrossRef]
- Bakker, M.; Lane, S.N. Archival photogrammetric analysis of river-floodplain systems using Structure from Motion (SfM) methods. Earth Surf. Process. Landf. 2017, 42, 1274–1286. [Google Scholar] [CrossRef]
- Smets, B.; Dewitte, O.; Michellier, C.; Munganga, G.; Dille, A.; Kervyn, F. Insights into the SfM photogrammetric processing of historical panchromatic aerial photographs without camera calibration information. ISPRS Int. J. Geo-Inform. (manuscript in preparation).
- Agisoft Metashape Pro’. 2020. Available online: https://www.agisoft.com (accessed on 16 June 2021).
- Rupnik, E.; Daakir, M.; Deseilligny, M.P. MicMac—A free, open-source solution for photogrammetry. Open Geospat. Data Softw. Stand. 2017, 2, 14. [Google Scholar] [CrossRef]
- Hungr, O.; Leroueil, S.; Picarelli, L. The Varnes classification of landslide types, an update. Landslides 2014, 11, 167–194. [Google Scholar] [CrossRef]
- Laghmouch, M.; Nimpagaritse, G.; Mudende, L.; Minani, M.; Ndereyimana, J.; Icitegetse, I.; Naahimana, A.; Ndarihonyoye, P.; Niyongabo, J.B.; Kervyn, F. Numérisation de la Carte Géologique au 50,000 ème; Ministère de l’Hydraulique, de l’Energie et des Mines; République du Burundi & Musée royal de l’Afrique Ccentrale (MRAC): Tervuren, Belgium, 2018; ISBN 978949224429. [Google Scholar]
- Dewitte, O.; Chung, C.-J.; Cornet, Y.; Daoudi, M.; Demoulin, A. Combining spatial data in landslide reactivation susceptibility mapping: A likelihood ratio-based approach in W Belgium. Geomorphology 2010, 122, 153–166. [Google Scholar] [CrossRef]
- Jacobs, L.; Dewitte, O.; Poesen, J.; Sekajugo, J.; Nobile, A.; Rossi, M.; Thiery, W.; Kervyn, M. Field-based landslide susceptibility assessment in a data-scarce environment: The populated areas of the Rwenzori Mountains. Nat. Hazards Earth Syst. Sci. 2018, 18, 105–124. [Google Scholar] [CrossRef]
- Hussin, H.Y.; Zumpano, V.; Reichenbach, P.; Sterlacchini, S.; Micu, M.; van Westen, C.; Bălteanu, D. Different landslide sampling strategies in a grid-based bi-variate statistical susceptibility model. Geomorphology 2016, 253, 508–523. [Google Scholar] [CrossRef]
- Lee, S.; Pradhan, B. Landslide hazard mapping at Selangor, Malaysia using frequency ratio and logistic regression models. Landslides 2006, 4, 33–41. [Google Scholar] [CrossRef]
- Crosta, G.; Frattini, P.; Agliardi, F. Deep seated gravitational slope deformations in the European Alps. Tectonophysics 2013, 605, 13–33. [Google Scholar] [CrossRef]
- Santangelo, M.; Gioia, D.; Cardinali, M.; Guzzetti, F.; Schiattarella, M. Interplay between mass movement and fluvial network organization: An example from southern Apennines, Italy. Geomorphology 2013, 188, 54–67. [Google Scholar] [CrossRef]
- Guns, M.; Vanacker, V. Shifts in landslide frequency–area distribution after forest conversion in the tropical Andes. Anthropocene 2014, 6, 75–85. [Google Scholar] [CrossRef]
- Oth, A.; Barrière, J.; d’Oreye, N.; Mavonga, G.; Subira, J.; Mashagiro, N.; Kadufu, B.; Fiama, S.; Celli, G.; Bigirande, J.D.D.; et al. KivuSNet: The First Dense Broadband Seismic Network for the Kivu Rift Region (Western Branch of East African Rift). Seism. Res. Lett. 2016, 88, 49–60. [Google Scholar] [CrossRef]
- IFRC. Burundi: Floods—DREF Operation No. MDRBI010; Final Report; IFRC: Bujumbura, Burundi, 2014. [Google Scholar]
- Samia, J.; Temme, A.; Bregt, A.; Wallinga, J.; Guzzetti, F.; Ardizzone, F.; Rossi, M. Do landslides follow landslides? Insights in path dependency from a multi-temporal landslide inventory. Landslides 2017, 14, 547–558. [Google Scholar] [CrossRef]
- Dini, B.; Daout, S.; Manconi, A.; Loew, S. Classification of slope processes based on multitemporal DInSAR analyses in the Himalaya of NW Bhutan. Remote Sens. Environ. 2019, 233, 111408. [Google Scholar] [CrossRef]
- Nobile, A.; Dille, A.; Monsieurs, E.; Basimike, J.; Mugaruka Bibentyo, T.; d’Oreye, N.; Kervyn, F.; Dewitte, O. Multi-Temporal DInSAR to Characterise Landslide Ground Deformations in a Tropical Urban Environment: Focus on Bukavu (DR Congo). Remote Sens. 2018, 10, 626. [Google Scholar] [CrossRef]
- Dille, A.; Kervyn, F.; Handwerger, A.; d’Oreye, N.; Derauw, D.; Mugaruka Bibentyo, T.; Samsonov, S.; Malet, J.-P.; Kervyn, M.; Dewitte, O. When correlation is needed: Unravelling the complex dynamics of a slow-moving landslide in the tropics with dense radar and optical time series. Remote Sens. Environ. 2021, 258, 112402. [Google Scholar] [CrossRef]
- Handwerger, A.L.; Fielding, E.J.; Huang, M.; Bennett, G.L.; Liang, C.; Schulz, W.H. Widespread Initiation, Reactivation, and Acceleration of Landslides in the Northern California Coast Ranges due to Extreme Rainfall. J. Geophys. Res. Earth Surf. 2019, 124, 1782–1797. [Google Scholar] [CrossRef]
- Larsen, I.J.; Montgomery, D.R. Landslide erosion coupled to tectonics and river incision. Nat. Geosci. 2012, 5, 468–473. [Google Scholar] [CrossRef]
- Clarke, B.A.; Burbank, D.W. Quantifying bedrock-fracture patterns within the shallow subsurface: Implications for rock mass strength, bedrock landslides, and erodibility. J. Geophys. Res. Space Phys. 2011, 116. [Google Scholar] [CrossRef]
- Marc, O.; Behling, R.; Andermann, C.; Turowski, J.M.; Illien, L.; Roessner, S.; Hovius, N. Long-term erosion of the Nepal Himalayas by bedrock landsliding: The role of monsoons, earthquakes and giant landslides. Earth Surf. Dyn. 2019, 7, 107–128. [Google Scholar] [CrossRef]
- Felton, A.A.; Russell, J.M.; Cohen, A.S.; Baker, M.E.; Chesley, J.T.; Lezzar, K.E.; McGlue, M.M.; Pigati, J.S.; Quade, J.; Stager, J.C.; et al. Paleolimnological evidence for the onset and termination of glacial aridity from Lake Tanganyika, Tropical East Africa. Palaeogeogr. Palaeoclim. Palaeoecol. 2007, 252, 405–423. [Google Scholar] [CrossRef]
- Wassmer, P.; Schwartz, D.; Gomez, C.; Ward, S.; Barrere, P. Geomorphology and sedimentary structures of Upper Pleistocene to Holocene alluvium within the Nyabarongo valley (Rwanda). Palaeo-climate and palaeo-environmental implications. Geogr. Fis. Din. Quat. 2013, 36, 199–210. [Google Scholar] [CrossRef]
- Lahusen, S.R.; Duvall, A.R.; Booth, A.M.; Grant, A.; Mishkin, B.A.; Montgomery, D.R.; Struble, W.; Roering, J.J.; Wartman, J. Rainfall triggers more deep-seated landslides than Cascadia earthquakes in the Oregon Coast Range, USA. Sci. Adv. 2020, 6, eaba6790. [Google Scholar] [CrossRef] [PubMed]
- Tanyaş, H.; Allstadt, K.E.; Van Westen, C.J. An updated method for estimating landslide-event magnitude. Earth Surf. Process. Landf. 2018, 43, 1836–1847. [Google Scholar] [CrossRef]
- Temme, A.; Guzzetti, F.; Samia, J.; Mirus, B.B. The future of landslides’ past—A framework for assessing consecutive landsliding systems. Landslides 2020, 17, 1519–1528. [Google Scholar] [CrossRef]
Publisher’s Note: MDPI stays neutral with regard to jurisdictional claims in published maps and institutional affiliations. |
© 2021 by the authors. Licensee MDPI, Basel, Switzerland. This article is an open access article distributed under the terms and conditions of the Creative Commons Attribution (CC BY) license (https://creativecommons.org/licenses/by/4.0/).