Article

The Use of TERRA-ASTER Satellite for Landslide Detection

Geological Survey of Austria, Neulinggasse 38, 1020 Vienna, Austria
*
Author to whom correspondence should be addressed.
Geosciences 2021, 11(6), 258; https://doi.org/10.3390/geosciences11060258
Submission received: 10 May 2021 / Revised: 3 June 2021 / Accepted: 11 June 2021 / Published: 15 June 2021
(This article belongs to the Section Natural Hazards)

Abstract

:
In August 2005, numerous shallow landslides occurred in the region of Vorarlberg (Austria), particularly induced by unfavourable event-related weather conditions. Two scenes of TERRA-ASTER sensor were used for the identification of the vegetation change induced by the landslides. The focus of this study is the establishment of a reliable method, comparable to aerial-photo visual interpretation standards, able to identify accurately landslides by processing a series of medium-resolution remote sensing optical data, before and after a catastrophic event. A very intuitive workflow for a semi-automatic image classification for the detection of landslide-induced change on the image data is proposed. The accuracy and validation assessment was carried out by means of a landslide (aerial-photos derived) inventory. By taking into account the central area of investigation, the landslide detection method, which adopted an innovative double classification workflow (a first supervised followed by an unsupervised algorithm), delivered a very high producer accuracy (81.5%) coupled to a more-than-acceptable user accuracy (68.9%) and kappa coefficient (72.9%).

1. Introduction

Landslides are one of the widest spread types of geohazard all around the world and are mostly caused by preparatory triggering factors such as earthquakes [1], human activities [2] and extreme rain episodes [3]. Such gravitational mass movements occur nearly everywhere in Austria; in fact, in 2014, it accounted for 306 events (67 rockfalls and 239 landslides) which left five deaths and 10 injured people together with extensive damage to public and private properties. In the context of disaster management, a rapid and representative overview of the areas hit by hazardous events [4] must integrate surficial mapping, which enables a detailed classification and delimitation of the phenomena, with aerospace-borne image analysis [5,6] with its ability to provide regional scale landslide detection and accessibility to remote areas [7]. Since the launch of LANDSAT in the early seventies, optical image analysis applied to the recognition of landslide scars and deposition areas is been used as a catastrophe assessment tool [8] and proved to be useful for the update of landslide inventory archives [9,10]. Although those early works established a series of standard methods for mass movements’ detection [11], the limitations of the minimum-recognizable pixel size lay on their spatial resolution. Besides the limitation of optical imageries such as clouds, shadows caused by either meteorological conditions or elevation exposition, the use of optical remote sensing analysis and image classification is very indicative of very rapid to moderate mass movements such as flow-like landslides, rock planar slides, debris slide, and rotational slides [12]. In recent years, several very high resolution (VHR) satellites have been launched and, due to their fine spatial capacity to resolve pixels, more and more scientists have become familiar with object based image analysis (OBIA) techniques applied to landslide recognition [13,14]. Since April 2015, SENTINEL-2, a new generation of high resolution satellites and high temporal resolution, is in orbit and thanks to an agreement between ESA and the Copernicus Consortium the access to this data is been secured open and free to everyone. TERRA ASTER images have provided, since 2000, with their 15 m spatial resolution (for the VNIR bands), a very suitable sensor for landslide scar and trail detection [15]. Most of the approaches used to address mass movement recognition were change-detection algorithms [1,16] and pixel-based supervised classification [8]. Several studies highlighted the limits of pixel-by-pixel against OBIA methods [17,18] and some addressed the attention as well to the use of unsupervised classification as a viable way to overcome landslide fragmentation detected by supervised analysis [19]. Another limitation of the classical supervised classification relies on the impossibility to directly remove spectral analogues classified pixels such as bare land, river beds, build-up areas and agriculture. A way to face such constraints is to use in the post-classification phase updated ancillary data, such as stream network [4] or digital elevation model derivatives [20,21], to improve the method’s mapping accuracy. A new type of paradigm, connected to the availability of new sensors, now implies to develop a mixed approach, which will integrate the quickness of pixel-based algorithms with the textural and structural information exploitation capability offered by OBIA classifiers. The “super-pixel” approach proposed by Wu et al. [22] represents such an example.
The main motivation behind this work is the assessment of the quality of remote sensing optical data (with medium resolution) beside the aerial photos (with very high resolution) as a complementary tool to promptly identify, on a regional scale, spontaneous and reactivated landslides driven by extreme weather conditions. The aim of this paper is to define an intuitive workflow for a semi-automated pixel-based image classification combined with a GIS multi-parameter data handling for the detection of landslide-induced by a heavy rainfall event. The change detection is aiming at emphasizing the spectral response in vegetation change in the pre- and post-event images due to the abrupt removal of vegetation induced by the manifestation of landslide activities. The method used a pairs of Terra-ASTER images and was applied to a study case located in the region of Vorarlberg, Austria. The main difference between our research and previous studies is that a double classification scheme was applied to a bi-temporal classical pixel change detection approach for landslide recognition. This classification scheme is composed of two steps:
  • supervised classification via maximum likelihood classifier with a set of three indexes of spectral change.
  • unsupervised classification with another set of three indexes of spectral change.

2. Study Area

The study area of interest is located in the eastern part of the Austrian federate state of Vorarlberg (Figure 1). The eastern part of the Voralberg region included in this study is characterised by the presence of the two main rivers of the region the Ill and the Bregenzer Ach both flowing from south-east toward north-west. The overall elevation, which varies between 580 and 2900 m, and the main slope angles, varying between 20° and 40°, plays an important role on the proneness to landslide. The day of the catastrophic event the local weather station registered 97 mm of rain which represents half of the amount (based on 30 years averaged measurements) of precipitation occurring during a typical month of August. The formation of a strong low-pressure system originated over the Adriatic Sea brought a large amount of moisture over the Balkans, Austria and southern Germany [23]. This so called 5-b weather condition led to long-lasting phases of heavy rain (4–5 days), resulting in the alpine floods events of 2005 for the northern Pre- and Central Alps [24].
The disaster occurred around the 19–23 August 2005, affected almost the entire Vorarlberg province and caused a series of damages which were calculated summing up to 100 million Euros [25]. The cause of property loss was related not only to landslides but also to erosion and flooding. In fact, several large rivers exceeded the 100-year flood-returning period (HQ100). Based on a previous work [26], a landslide inventory from multi-temporal digital aerial-photo interpretation (2005–2006) is being used for the delimitation of the area in exam and for the validation of the classification method. A major limitation of the aerial–photo derived interpretation, represented by the fact that the aerial-photo 2005 coverage was not extended to the whole region but limited to the valley floor, was overcome by using the available ASTER data.
The area of interest from a geological point of view can be subdivided in three large groups (Figure 2):
  • The northern part with the molasses (pink), the penninic and helvetic zone (dark and light green);
  • The central part with the northern calcareous alps (blue);
  • The southern part with the central alps and penninc metamorphic zone (purple).
In the northern area, soft sedimentary and clastic deposits are the main lithologies prone to spontaneous and quick landslides. The central area is more subject to rock fall and rockslide (black and white points in the landslide inventory in Figure 2) due to the presence of limestone and dolomites, whereas darker and harder rocks of methamorphic origin can be found in the southern part of the study area. More in the south, the landscape is dominated by high relief cliffs, narrow and U shaped valleys, and periglacial phenomena such as rock glaciers and solifluction are common. On the other hand, heading toward the north of the study area, the landscape was reshaped by fluvial activity, the relief is flatter and the incidence of rock fall and rockslide is less dominant. By visualizing the local land cover map (Figure 2) it is clear that the dominant cover types are haerbaceous and forest in the north, whereas in the south the reduction in vegetated areas is replaced by the presence (mostly where the relief is high) by bare rock and shrubs. As already shown in Figure 2, there are six classes of types of landslide in the reference inventory and the main classes earth flow, debris slide and earth flow /debris slide comprise the majority of them (with 94% of the total). The visually interpreted inventory was created by manually digitizing, at the scar locations, points, reunited in a geodatabase, which stores the type of process and activity class of a series of landslides visually identified in a multi-temporal set of aerial photos (1930, 1950; 1970, 1990, 2001, 2005, 2006, 2009, 2012).
By means of the database, it is possible to infer that 86% of the landslides were newly triggered phenomena that mostly affected loose and earth-like sediments. Further polyline features such as scars, scarps, and crowns together with polygons delimiting single landslides are not part of the inventory.

3. Challenges and Chances in Remote Sensing Landslide Recognition

A series of demands are related to the use of remote sensing applied to landslide detection in mountainous and urbanised environments. Landslides are commonly associated with prolonged heavy rain episodes, which lead to the water saturation of the shallowest layer of soil and regolith and an increased groundwater level within the slope [27]. However, under such mentioned circumstances, the interaction of those slope instabilities with rivers (which act as undercutting agents) and torrents (which transport the gravitational solid mass originated on his bank along pre-existing channels) must be taken into account when satellites images are used for landslide identification. One of the challenges faced by change detection classification is the not-straightforward ease of separating processes such as earthflow / debris slide from debris flow and debris flood due to their similar spectra signatures. The main difference between the two sub-groups already mentioned is that, although earthflow and debris slide do not share the same slope failure mechanism, the initiation of debris flows and debris floods, unlike the first group, is normally due to strong interactions with water along a steep channel [12].
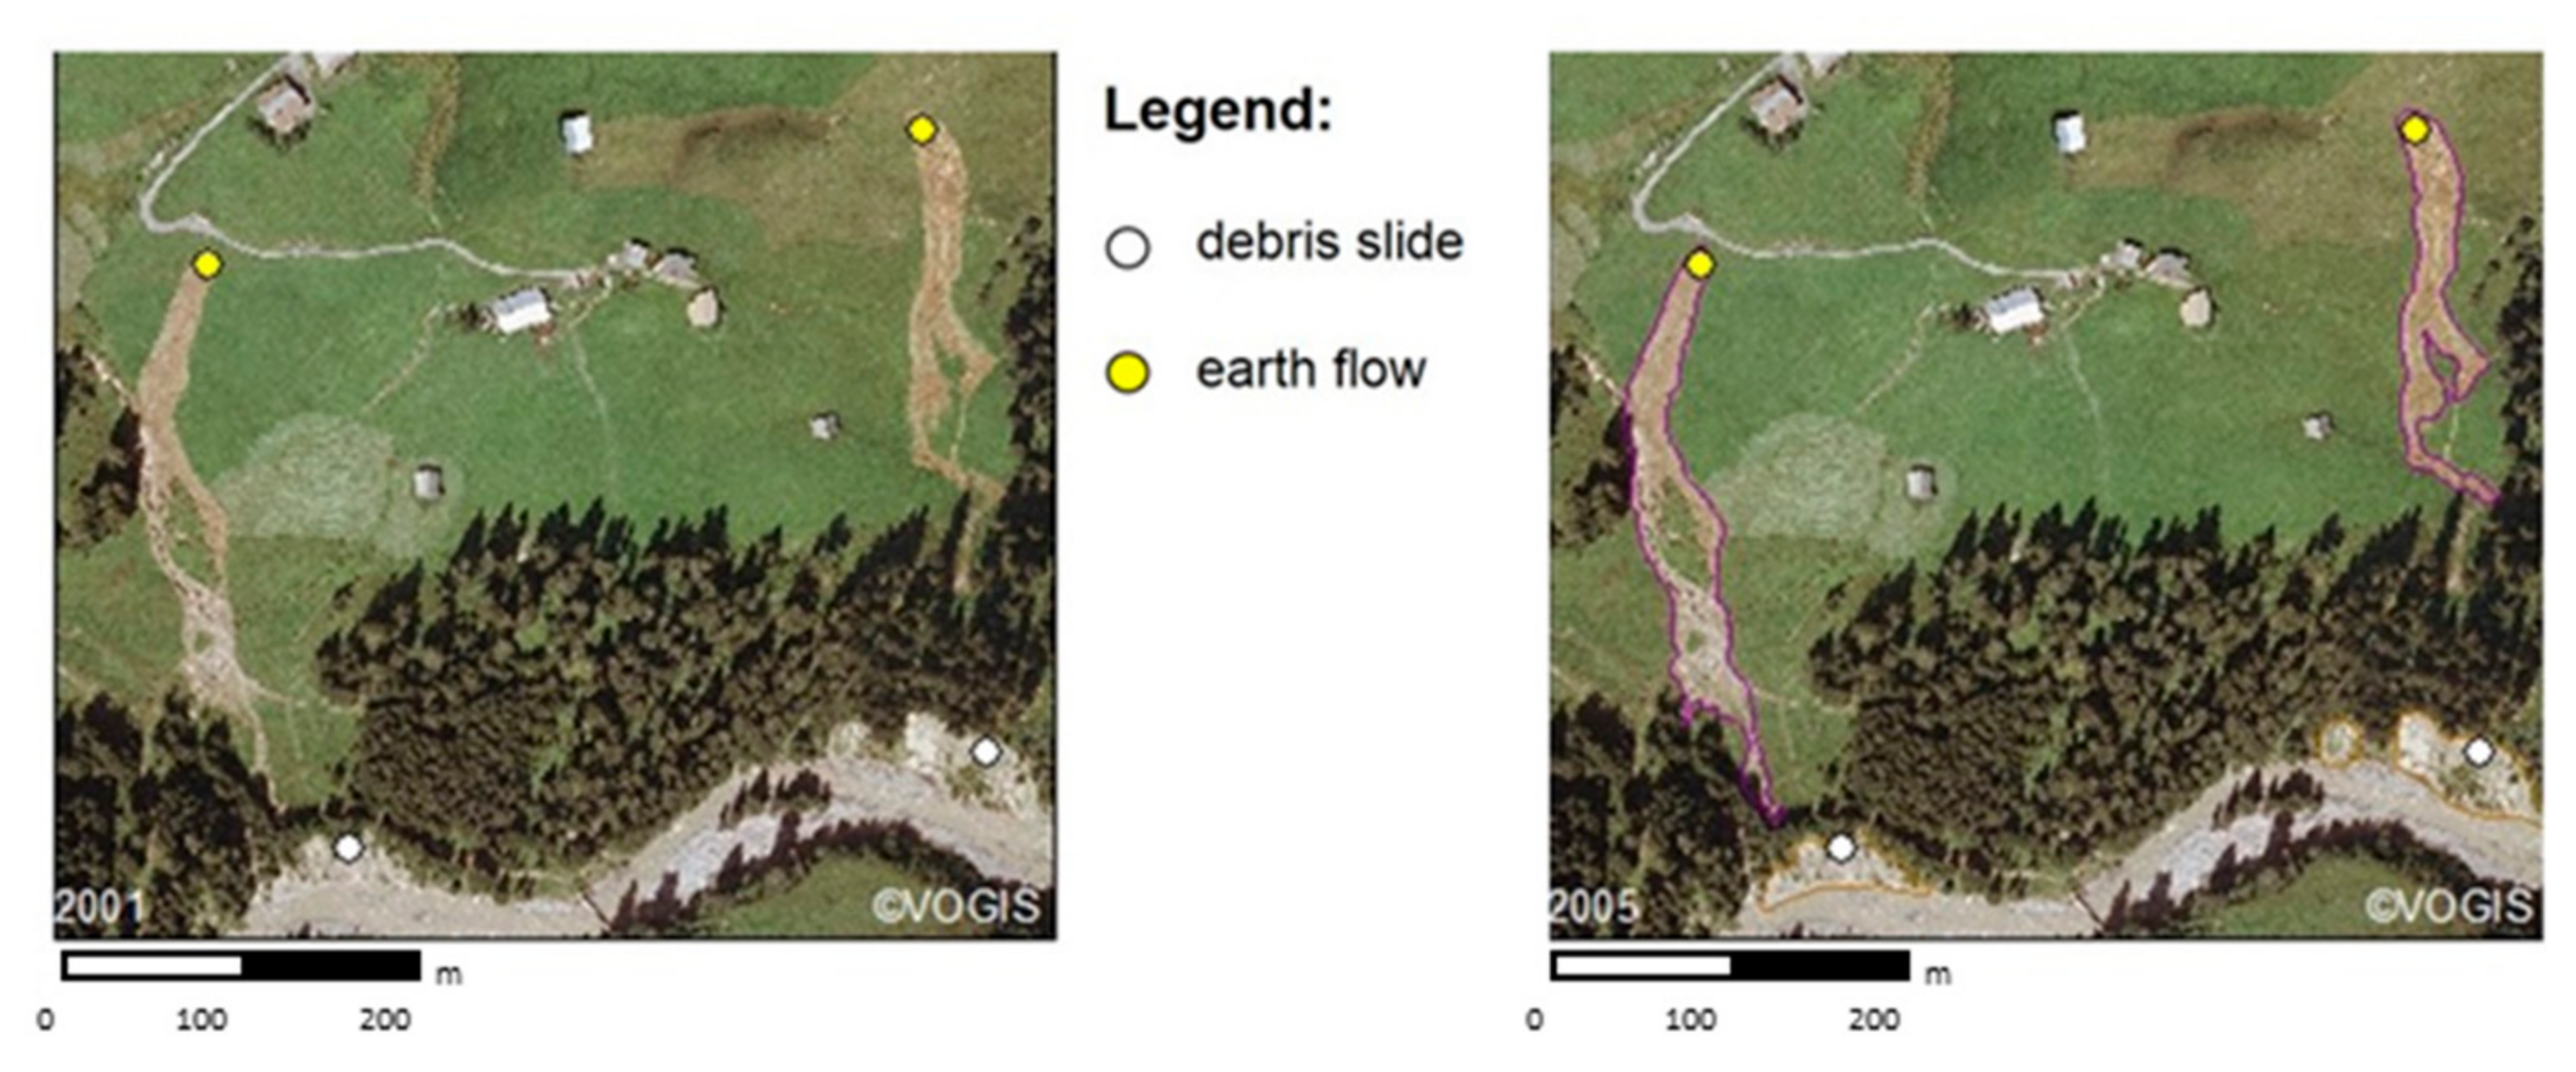
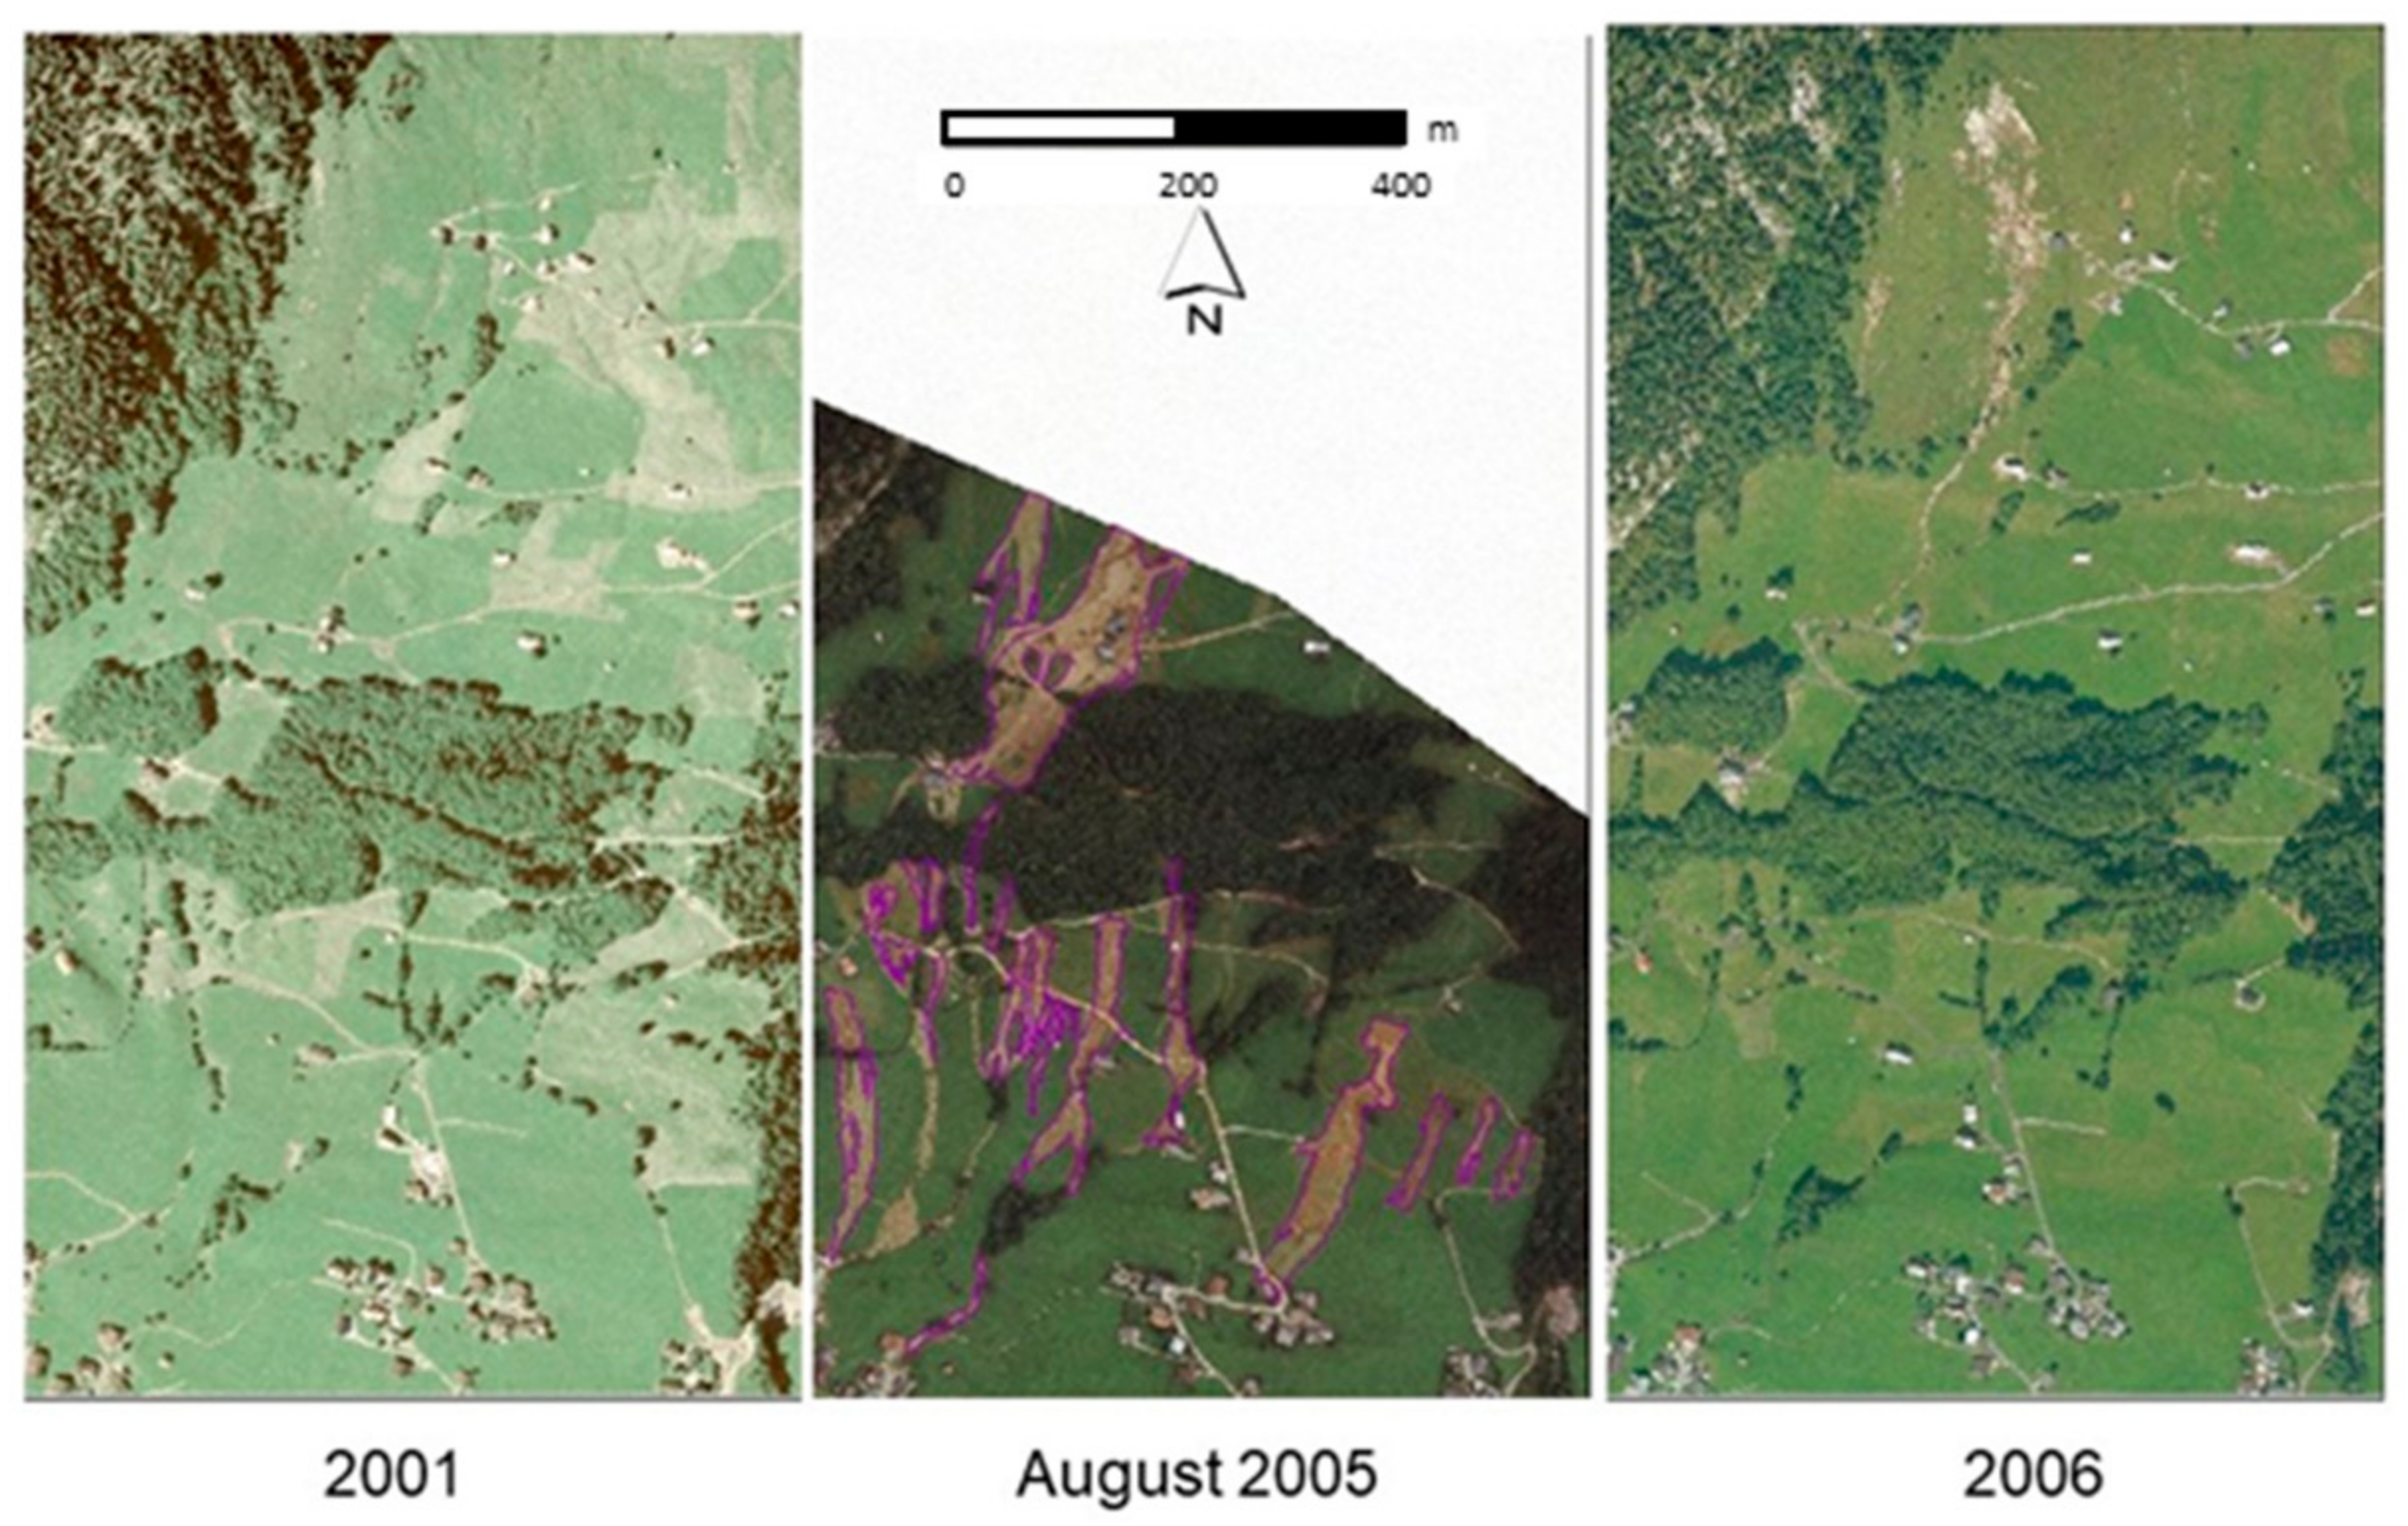
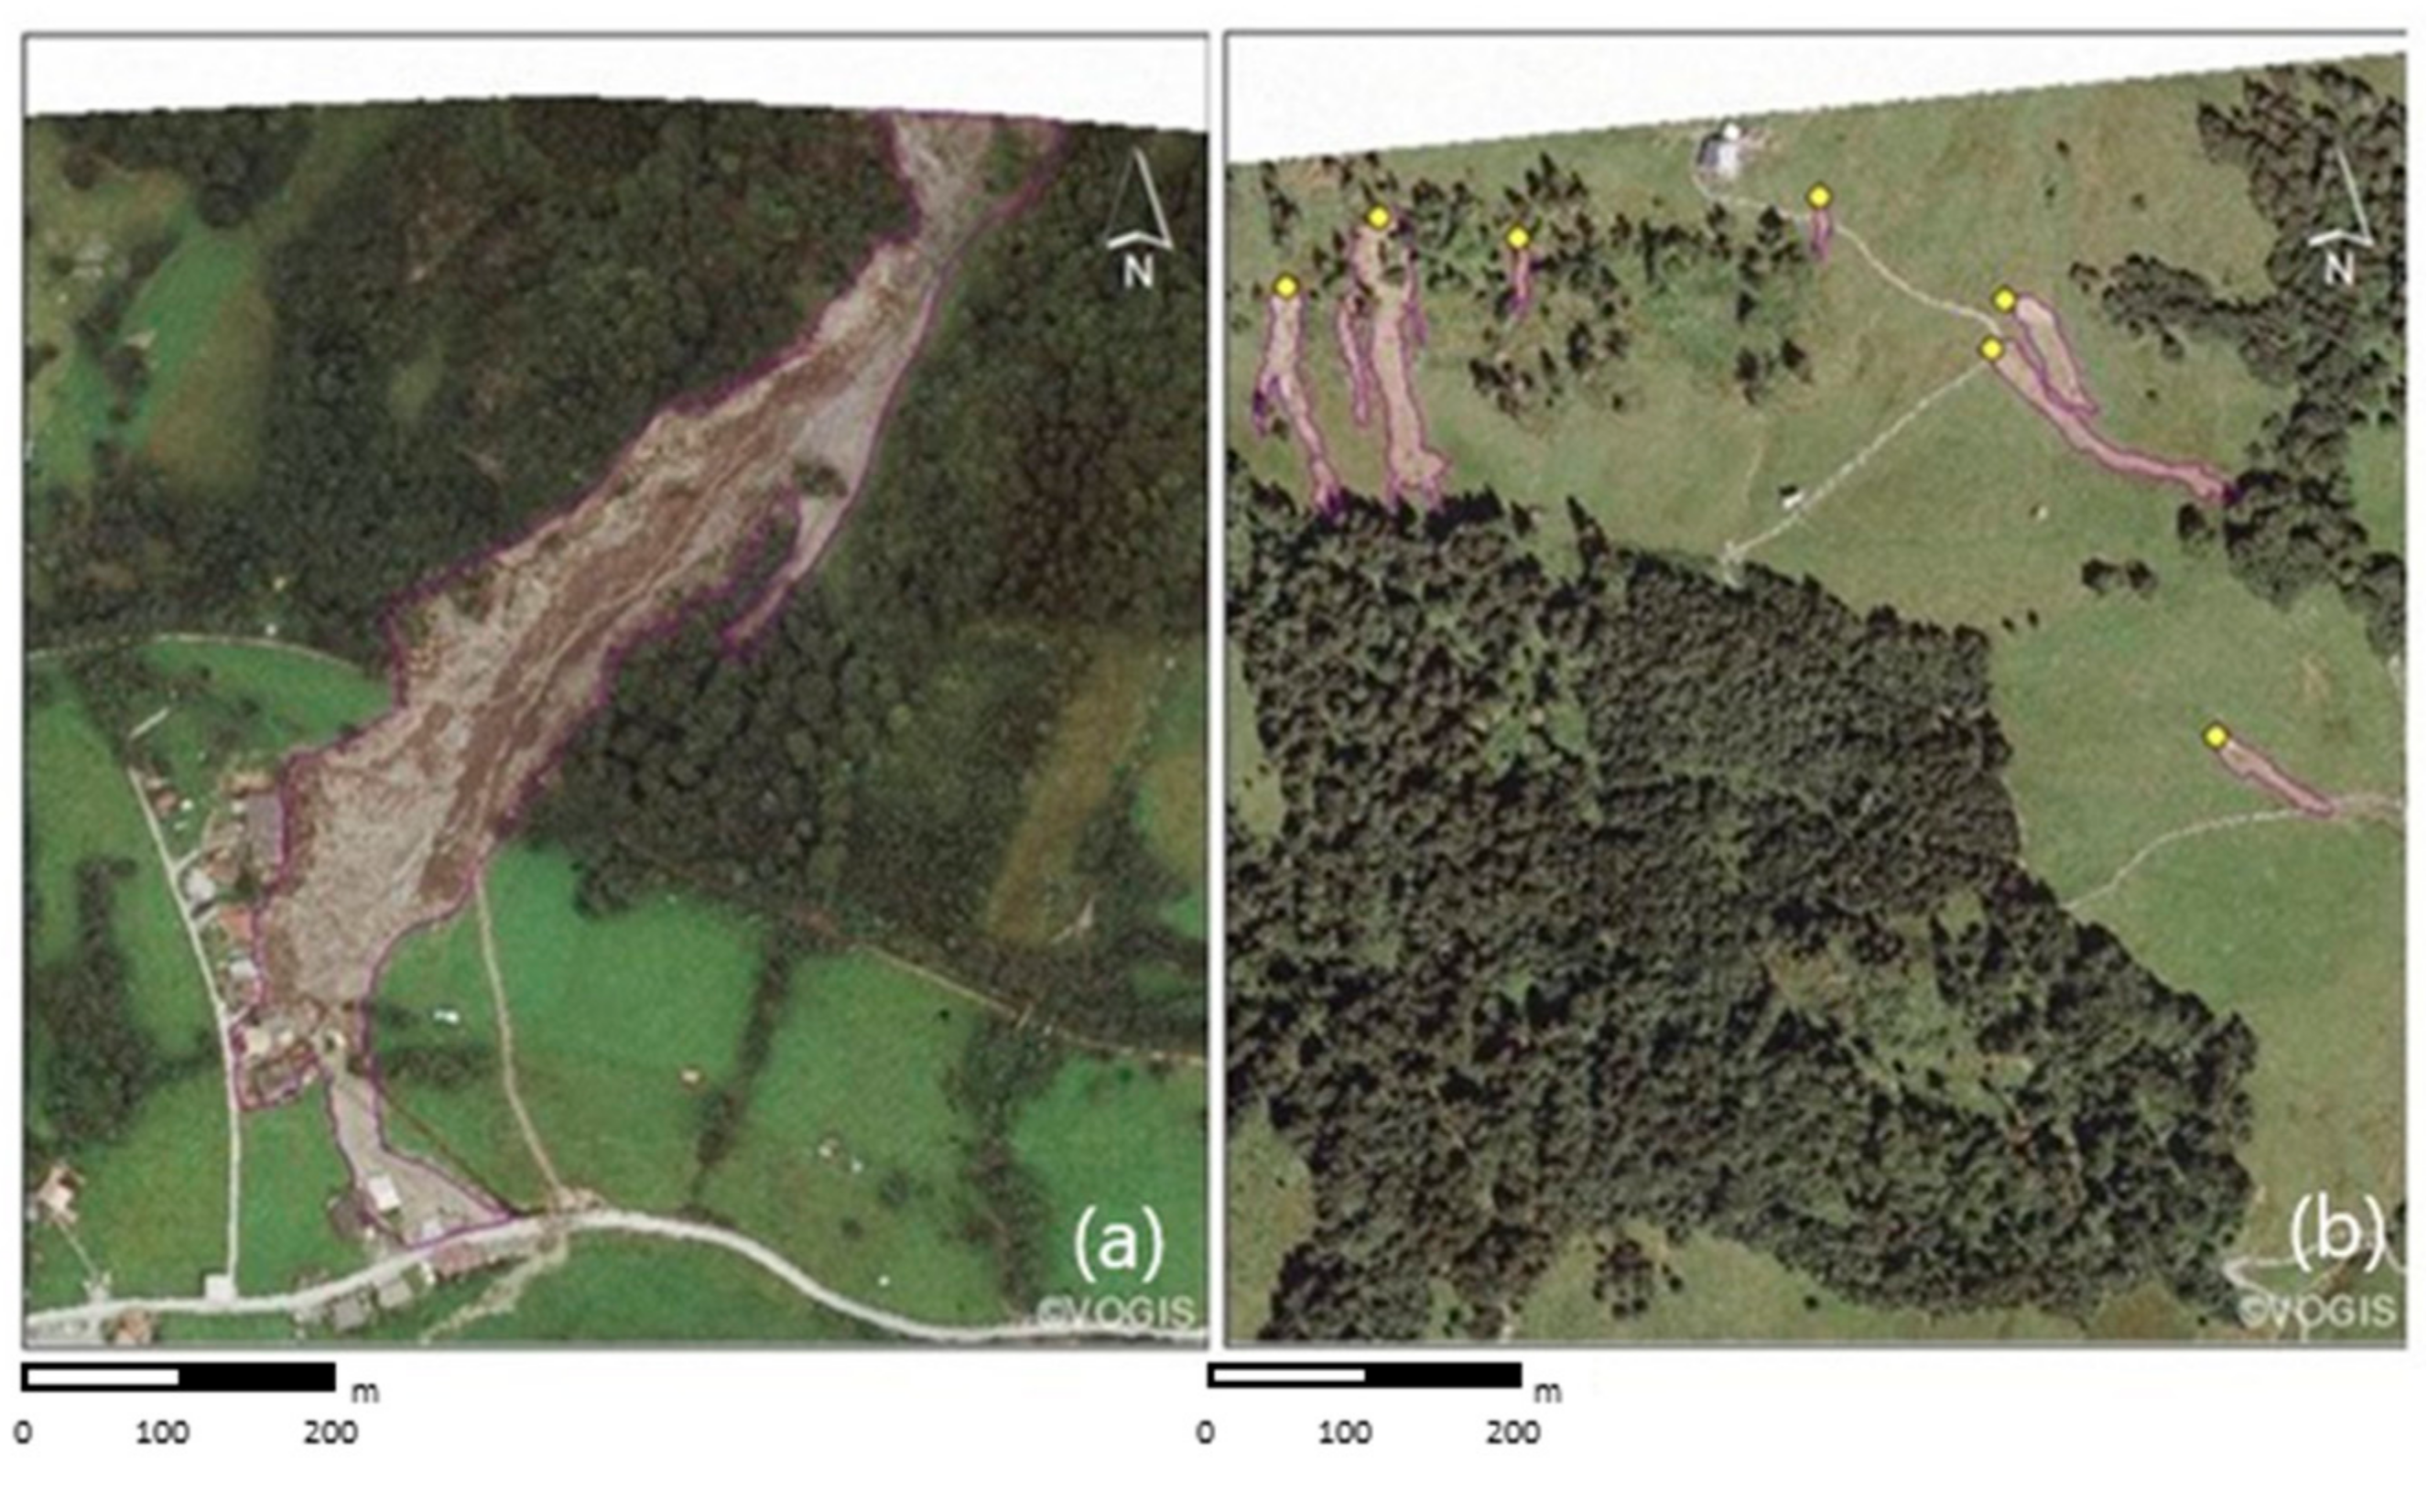
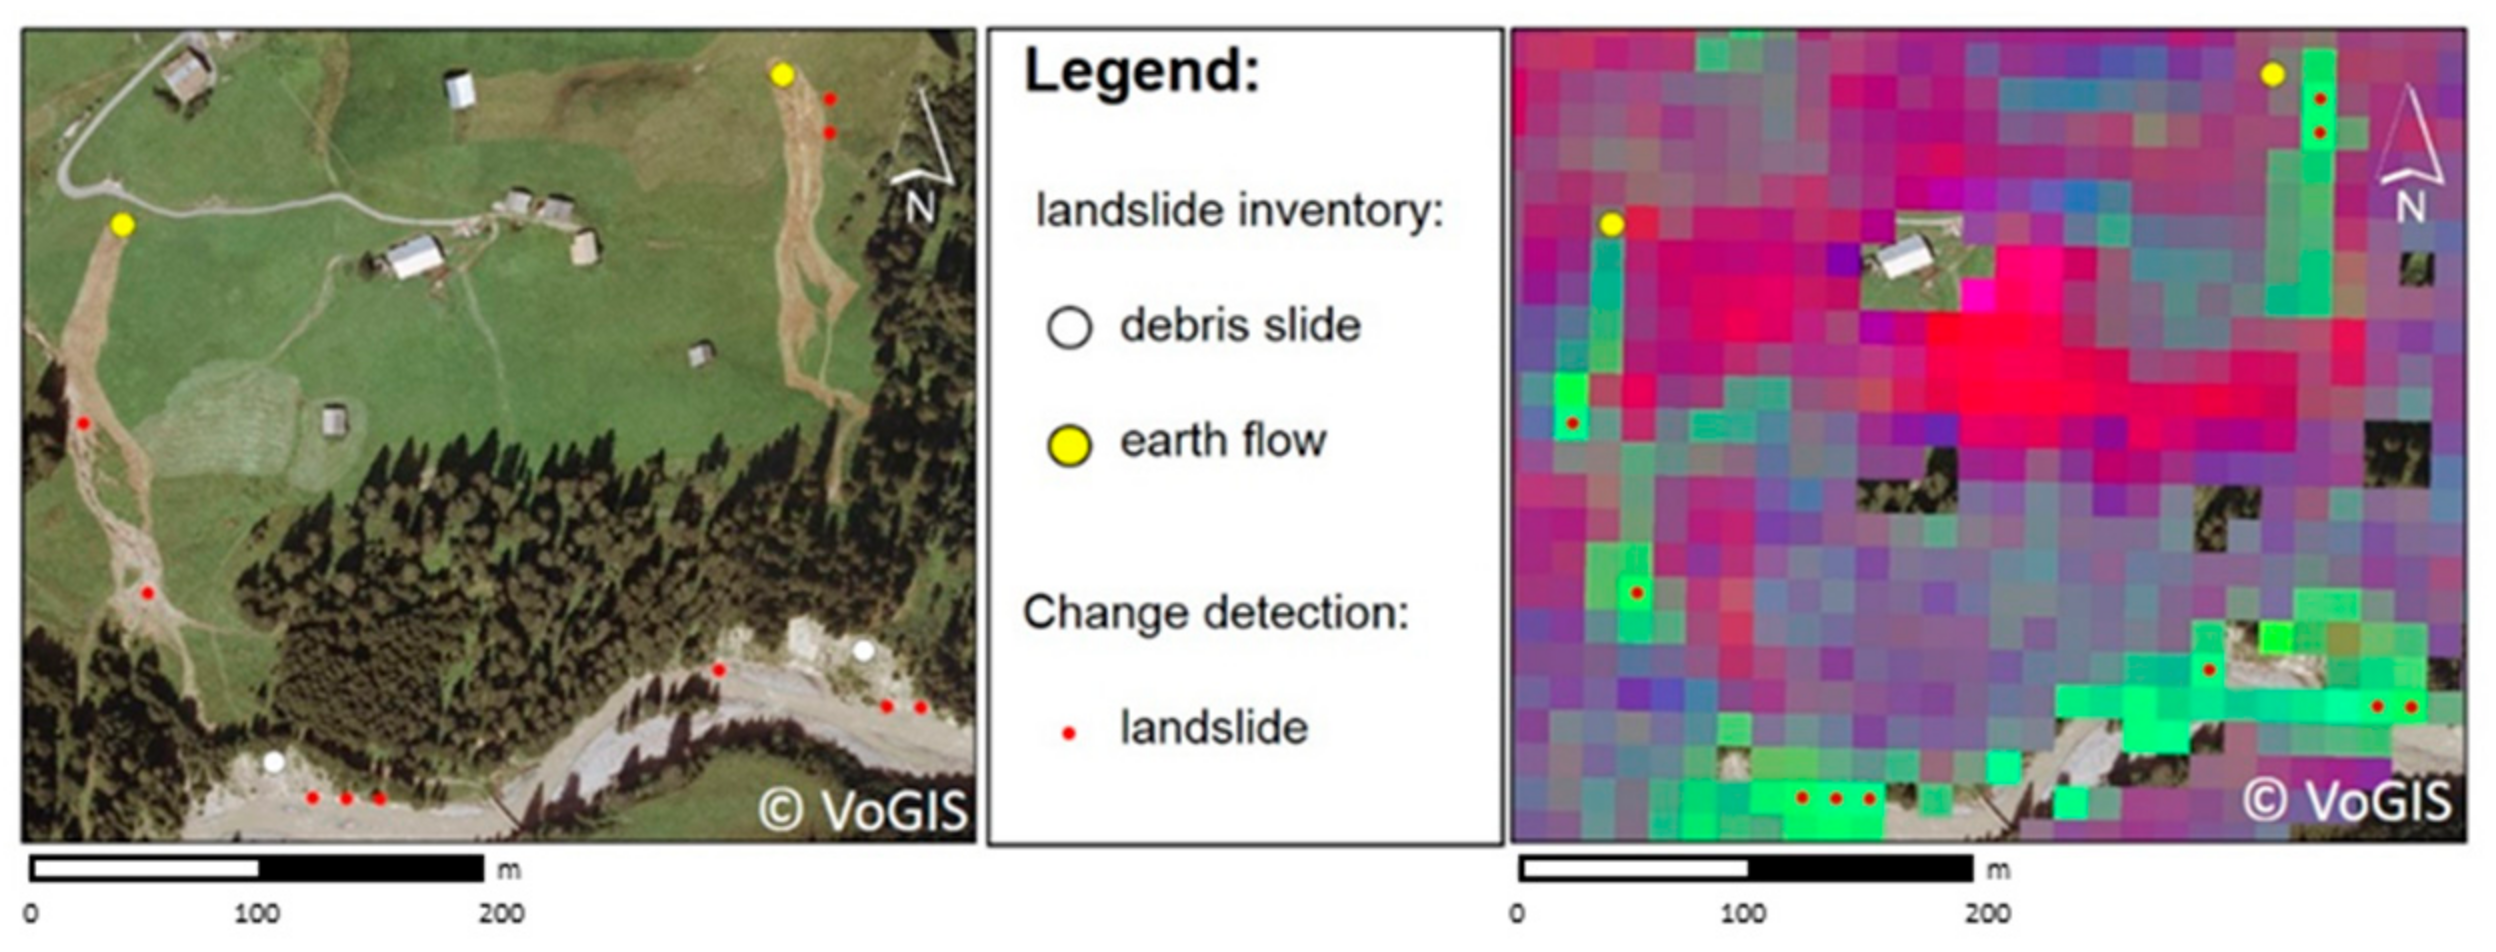
In Figure 3 is shown the area of Warth-Teschenberg on the river Lech where two earth flows (in yellow) were activated in 2005; on the other hand, two debris slides (in white) on the river flank were already visible on the aerial photo from 2001. In this case, the distinction between the debris flood action and the potential reactivation of previously originated landslides on the river flank represents a challenging task. The augmented temporal resolution in terms of revisiting time of the newcomer’s satellites plays an important role, because the closer an image is to the date of the event, the better the chance to identify a phenomenon fresh and untouched by remedial measures. The large scene extension of satellite data represents a better chance in remote sensing to cope with the problem of aerial-photo gaps (Figure 4) which are in fact remarkably common in case of a catastrophic event imaged by airborne acquisition. An important challenge is the evaluation of the ability of remote sensing method to detect the complete phenomenological expression of the landslide (scar, transport and accumulation zone). A typical high-resolution optical satellite offers a 10–15 m pixel size quality in images, which is why a large and destructive landslide such as the Danöfen earth flow (Figure 5a) is normally very well recognized in the overall geomorphological manifestation and geographical extension. On the other hand, for small and shallow earth flows (see Figure 5b) the degree of completeness and fragmentation of the classified pixels varies depending on several factors, such as:
  • the portion of denudation involved into the process;
  • the time span between the two images taken before and after the event;
  • the length of the transport trace;
  • the width of the landslide scar;
  • the degree of isolation of the single phenomena;
  • the suitable signature contrast between the land cover type and the landslide.

4. Data and Methods

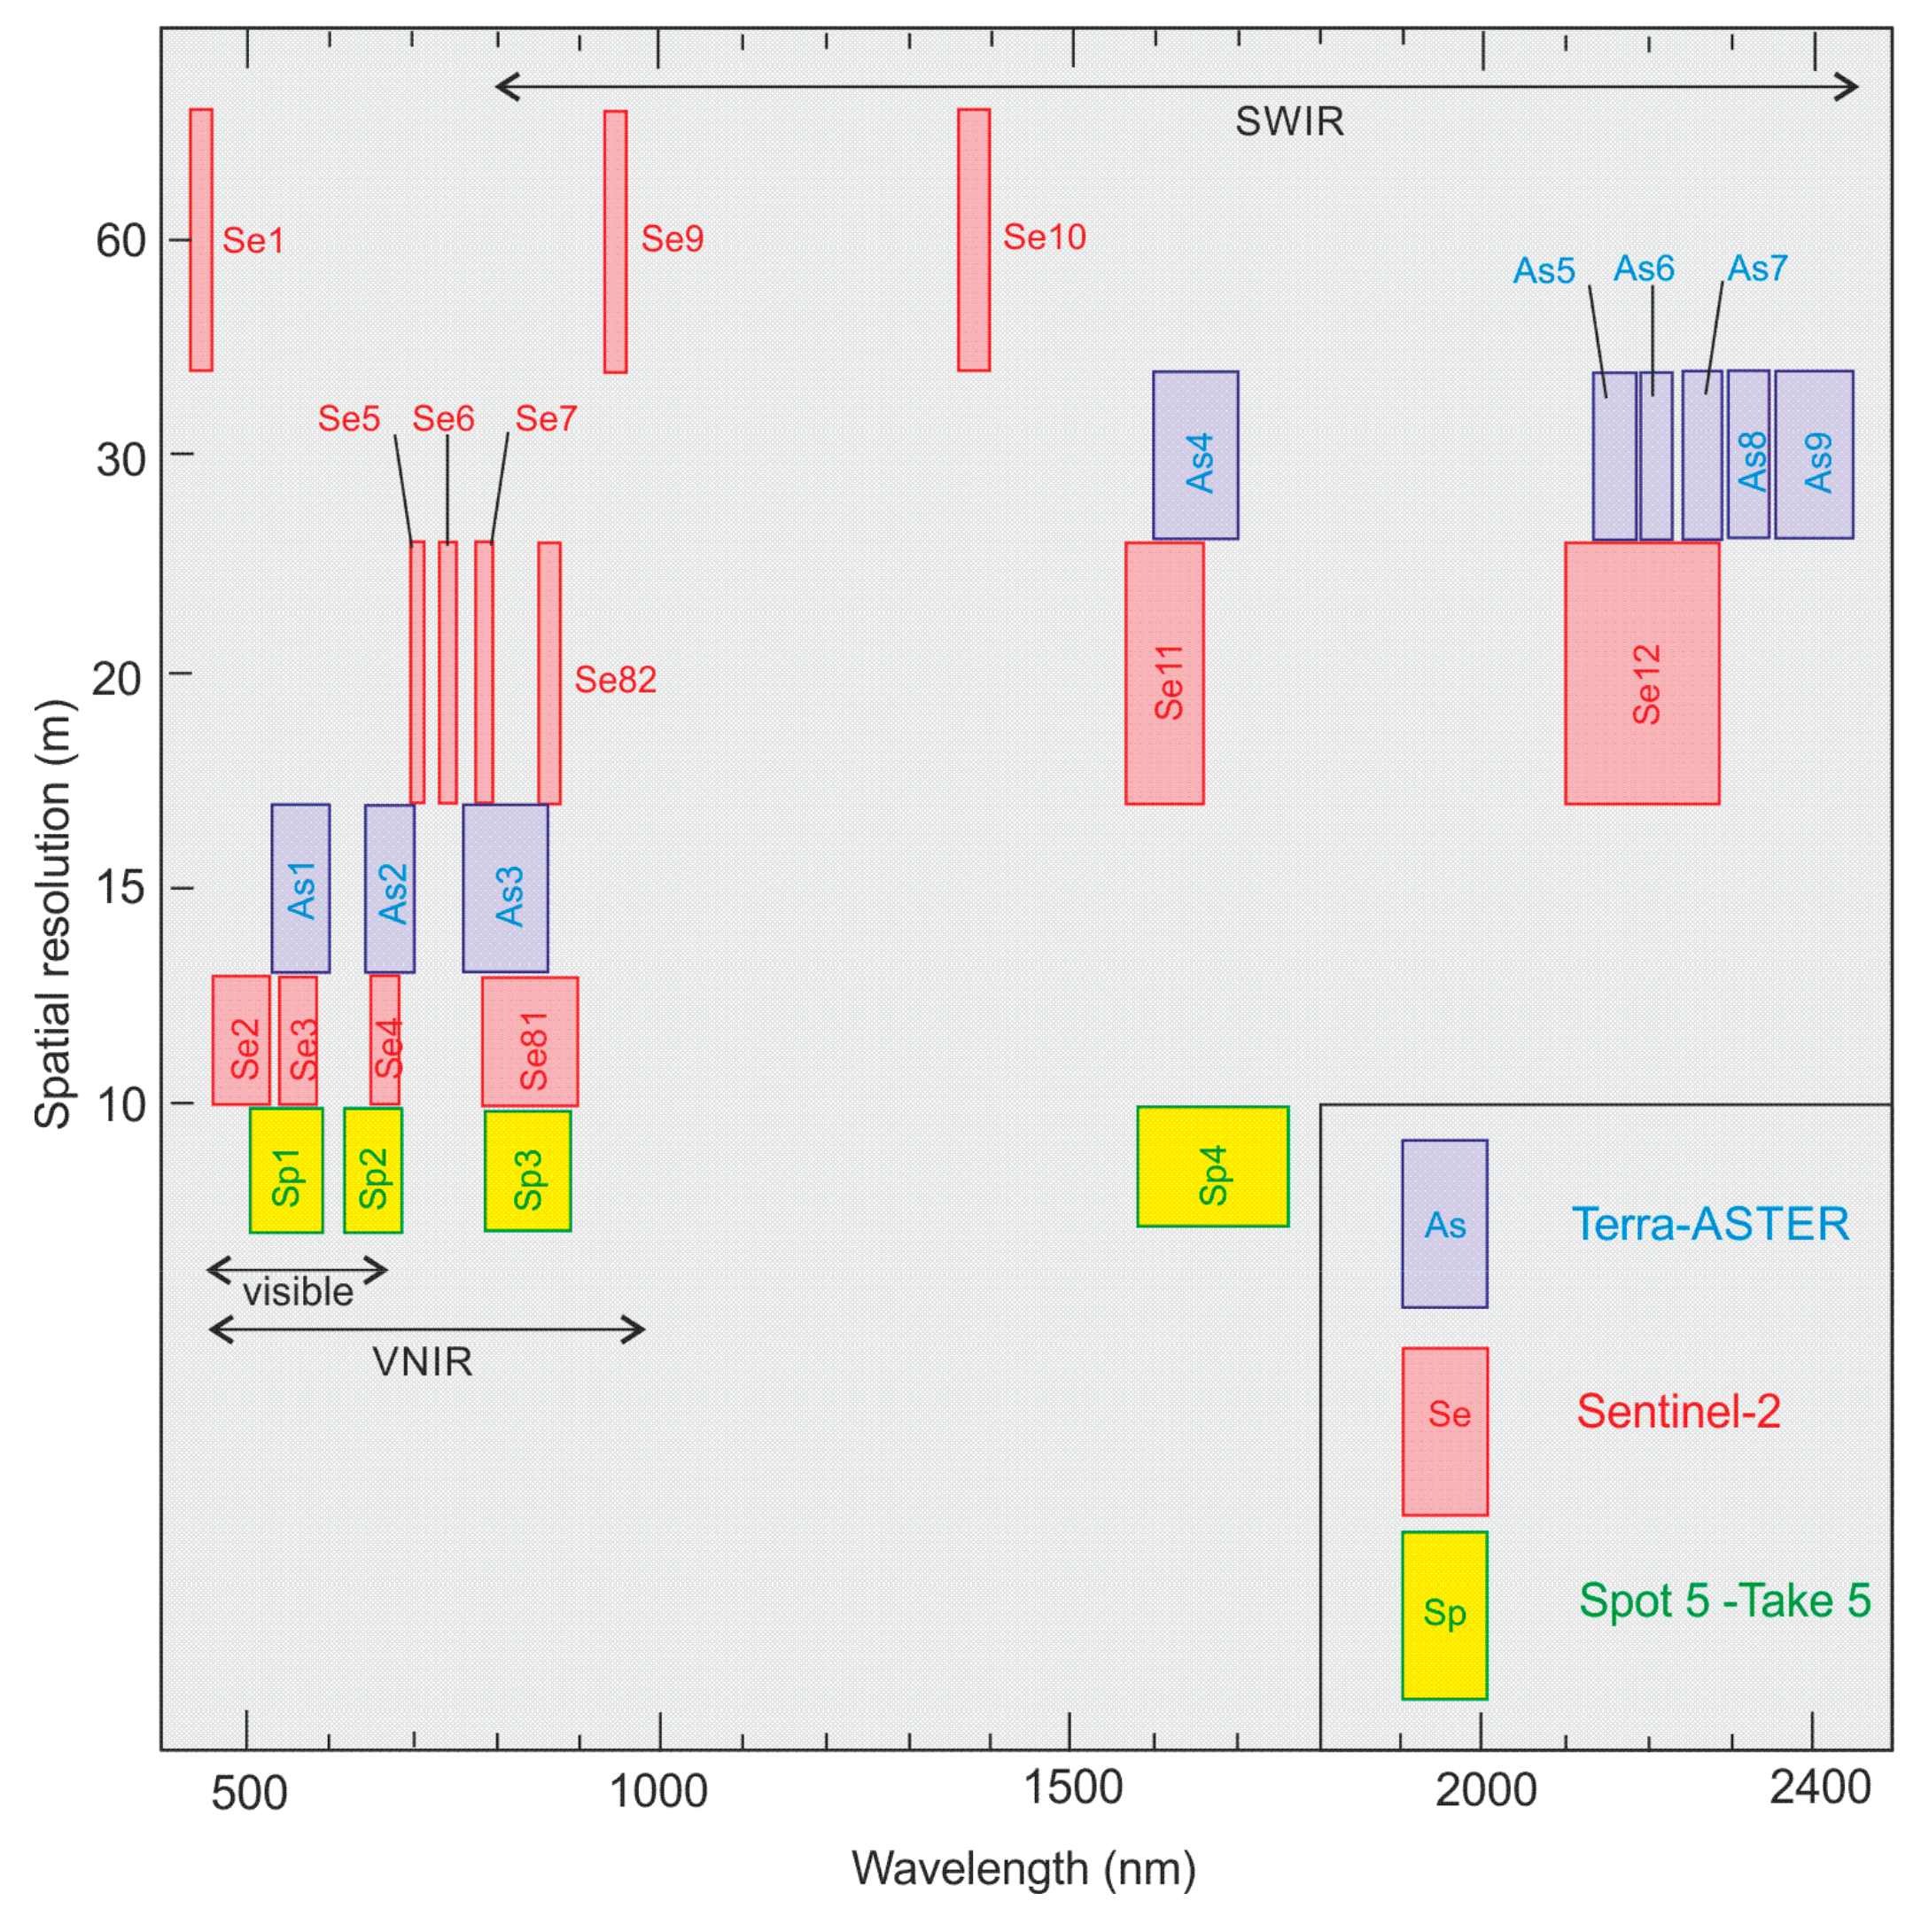
The data used for this work were Terra-ASTER L2 products. The main advantage of the ASTER L2 Surface Radiance image in comparison to the L1 product is that the former is atmospherically and crosstalk corrected [28] for both the Visible Near-Infrared (VNIR) and Shortwave Infrared (SWIR) sensors (Figure 6).
The only drawback is that the last five TIR bands were not available and a better cloud masking algorithm, which needed the thermal bands [30], could not be performed. For this study the change analysis classification was applied to the images acquired on 17 September 2004 and 4 September 2005 only. The methodology used in this work is the standard workflow required for a pixel-based change detection analysis applied to optic satellite images, with the only exception of the final stage of the processing and for the whole post-processing. The entire procedure, illustrated in Figure 7 and computed in ArcGIS, can be subdivided in the following sub-steps:
  • Image pre-processing;
  • Image processing;
  • Image post-processing.

4.1. Image Pre-Processing

The initial stages of the ASTER image preparation require a series of standard routines which have the purpose to optimise the inter-comparison between different bands in space (same spatial resolution) and in time (different acquisitions) and to create masks of unwanted information such as clouds, snow and shadows which are caused by topography, vegetation and clouds. The first step consists of the radiometric correction of the bands, which is obtained by transforming the radiance L (expressing the at-surface-radiance) into surface spectral reflectance R by calibrating the nine bands using Equation (1) [31]:
R = π × L × d 2 / ( E s u n × sin π × Z 180 )
where L is radiance, R is reflectance, d is the sun distance in astronomic units, Esun is the Exoatmospheric Solar Irradiances and Z is the sun elevation angle. The next step requires the resampling of the six bands from 30 m resolution, corresponding to the SWIR spectrum, into the finer spatial resolution of the VNIR bands (15 m). The method used was the nearest neighbourhood resampling technique. Furthermore, the georeferencing was preferred in comparison to the orthorectification in order to retain the original digital number pixel information useful for further change detection analysis. In fact, by means of the ArcGIS-10.5 georeferencing tools option “update georeferencing”, a user can avoid to interpolate an image, whereas in performing orthorectification the original digital number is always resampled. The georeferencing is quite important because incorrected misalignment of two images can lead to false differential classification or incorrect validation in case of the aerial photos and sample inventory validation. The application of several Ground Control Points (GCPs) for each image in order to obtain a reasonable root-mean-square error (RMSE) of 15 m was required. This is not the case for the geo-referencing of the SPOT-5 and Sentinel-2 (1C product) images because all single tiles have the same (i) centre position and (ii) constant viewing angle, and (iii) with a unique set of GCPs, it is possible to process a series of several images. Furthermore, a standard technique was used for snow identification. The Normalised Difference Snow Index (NDSI) based on a ratioing between Band 1 and Band 4 was adopted for this task, and by imposing a threshold of 0.4 [32] the masking of snow cover and hydrological features (such as lake and rivers) from the image was obtained. A further step required the creation of a False Colour Composite (FCC) 3-2-1 which gives results similar to traditional colour infrared aerial photography. This FCC is very useful for cloud and cloud shadow supervised classification. A further filter (Equation (2)) for the detection of cloud shadows [30] was applied by imposing the following threshold to NIR band (B3) and the blue band (B1) in the ArcGIS Raster Calculator:
I F   B 3 < 0.05   A N D   I F   B 3 B 1 > 1.1 = C l o u d   S h a d o w

4.2. Image Processing

A very good index for land cover change analysis between two images is the Normalised Differential Vegetation Index (NDVI). This index takes into account the extreme difference in reflection for the red band (B2) and NIR band (B3) for green vegetation areas and bare ground and is expressed by Equation (3):
N D V I = B 3 B 2 B 3 + B 2
High index (near +1) means very vigorous vegetation, near -1 indicates water (ice) and near 0 bare soil, asphalt and built-up areas. The NDVI is very sensitive to rapid changes in land cover, and for this reason when a superficial landslide occurs a loss in vegetation vigor can be accurately detected. Another useful algorithm used in this work is the Tasseled Cap Transformation (TCT). The TCT is a tool able of compress spectral data into a few bands associated with physical scene characteristics. Both multi- and hyperspectral data have highly correlated bands [33]. As slope deformation by superficial landslides is a type of phenomenon influencing the denudation process in perennial (grass and woodland) and non-perennial (arable lands) vegetative areas, TCT was chosen as a tool for analyzing the time series ASTER images of the satellite-based study area. TCT indices give a measure of the brightness (soil), greenness (vegetation), or wetness (water) of a pixel and utilize a linear combination of nine ASTER frequency bands. A way to perform such a calculation is to use the tasseled cap algorithm expressed by Equation (4) [34]:
t a s c a p i = c o e f f 1   ×   b a n d 1 + c o e f f 2   ×   b a n d 2 + c o e f f 3   ×   b a n d 3 + c o e f f 4   ×   b a n d 4 + c o e f f 5   ×   b a n d 5 + c o e f f 6   ×   b a n d 6 + c o e f f 7   ×   b a n d 7 + c o e f f 8   ×   b a n d 8 + c o e f f 9   ×   b a n d 9
where tascapi is the calculated tasselled cap index for brightness, greenness, or wetness depending on the coefficients used, the bands are the Top of the Atmosphere (TOA) reflectances and the coefficients are given by Yarbrough et al. [31] in Table 1. Successively, a method called image differencing [1], subtracting date one of the transformed remote sensing data to date two, was adopted. For this purpose, the three TCT components and the NDVI were combined to create two different image composites (Table 2):
  • The first with the three TCT differentiated images as RGB components;
  • The second with NDVI instead of change of surface greenness.
A supervised classification (SC) method was adopted to classify the landslides evident on the second image composite (Table 2). More in detail, a number of 24 samples were chosen as landslide signatures and a group of 575 samples were labelled as non-landslides. The supervised classification was run in ArcGIS Maximum Likelihood Classifier with “reject fraction” = 0.01 and “A priori probability weighting” = SAMPLE. In order to refine and improve the first classification, a further unsupervised classification (UC) algorithm of the first image composite in Table 2, imposing 15 classes and a 100 minimum pixel grouping, was adopted. A conditional statement on the selection of the most representative landslide classes in UC, which are matching the landslide recognised in SC, was imposed and a double classification (DC) was obtained by combining SC and UC.

4.3. Image Post-Processing

On the post-processing stage, the first step concerns the transformation of the raster-classified image in vector as point excluding the pixels classified as non-landslides for the SC image and for the DC image. Two available DTMs (Digital Terrain Models) based on Airborne Laser Scanning (ALS) were used for the flat terrain correction:
  • a nationwide 10 m resolution ALS DTM;
  • a local ALS DTM Vorarlberg (for the core study area only) with 1-m resolution.
The local DTM was resampled to 5 m and then by using the publicly available building shape file for the Open Street Map Project [35] a correction of the artefacts present into the derived DTM slope model was performed. In this sense, the vector building shape was transformed in raster with a fixed value of three degrees for each pixel, and then this raster layer was fused to the DTM slope model. For the DTM 10 m, the same approach was applied. A further extraction to points of the slope values with a threshold greater than 6°, in order to remove unprovable candidate landslide pixels, was carried out. Furthermore, those two datasets of points were visually investigated using the pre- and post-disaster images as references and edited in order to eliminate misclassified groups of points, which were not correctly masked as clouds and shadows on the pre-processing stage. In this way, failed masked part of clouds and shadows that were incorrectly classified as landslides could be easily eliminated. Since false-positive landslides resulted from the widening of riverbeds [4], a buffer of 20 m around the river network was applied and those landslide candidates were classified as “Fluvial–torrent process”. A further processing of the two-point datasets required the compilation on the field value of a new class of code (Table 3).

4.4. Classification Method

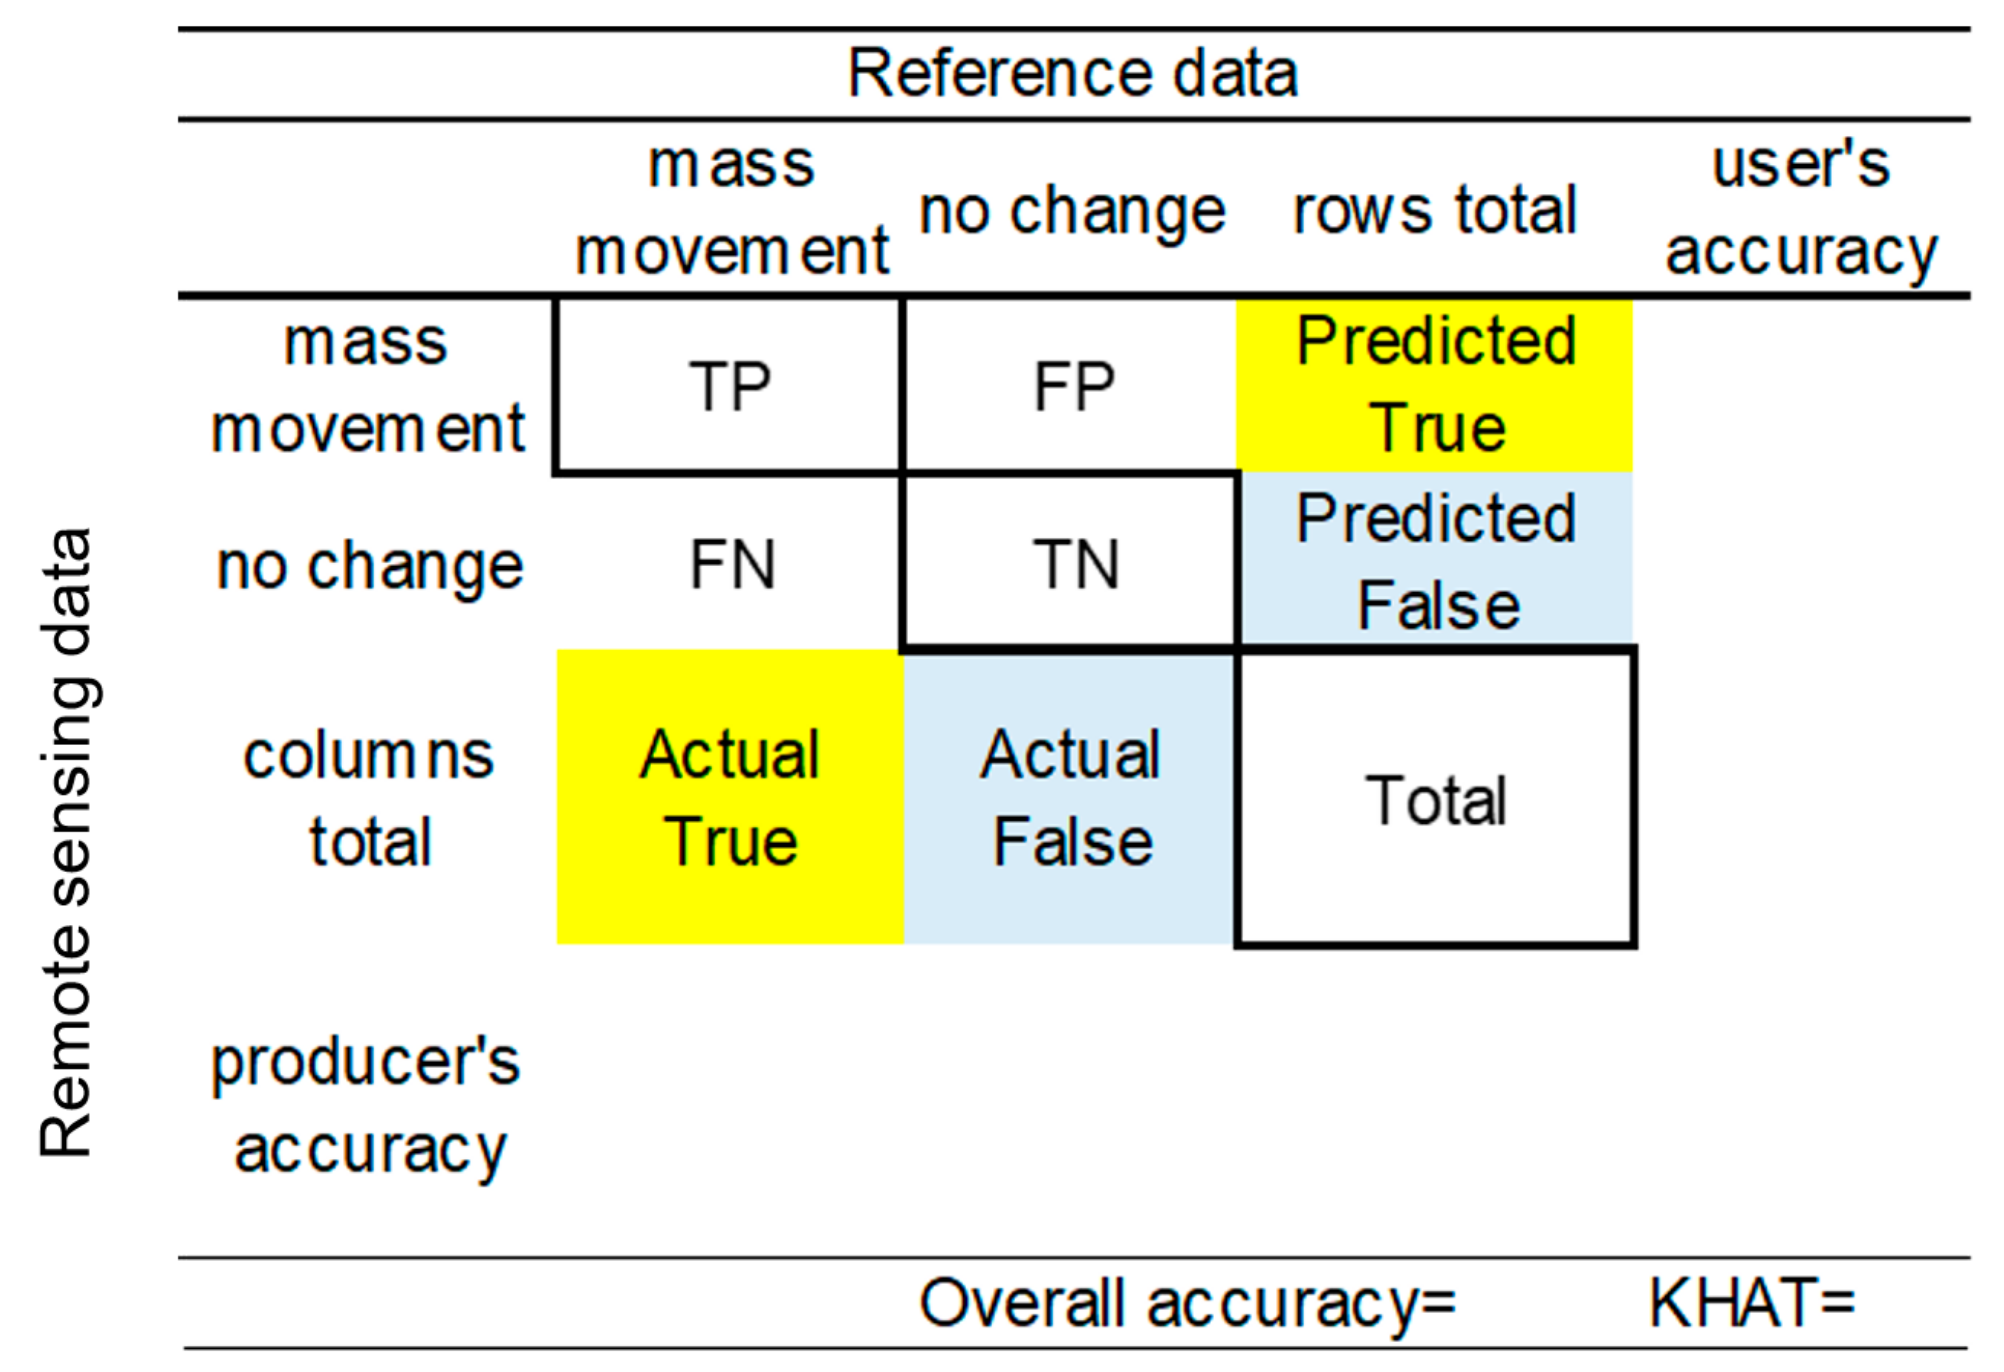
The landslide classification accuracy was evaluated by means of the confusion matrix. A confusion matrix (Figure 8) is compound of a square matrix of numbers identifying the pixels in exams, which belong to a particular category. In our case, the two categories taken into account for are landslides and no change. A series of statistical measures of thematic accuracy are assessed by the matrix, such as the producer’s accuracy, user’s accuracy and the Kappa coefficient (KHAT). The KHAT is a multivariate index which uses all the information in the confusion matrix and takes into account not only the overall accuracy but also the random accuracy. The random accuracy and the overall accuracy are calculated using the following equations (Equations (5) and (6)):
R a n d o m   a c c u r a c y = T N + F P × T N + F N + F N + T P × F P + T P T o t a l × T o t a l
O v e r a l l   a c c u r a c y = T P + T N T P + T N + F P + F N
The KHAT, expressed by Equation (7) [36], for Landis and Koch [37] can be interpreted using the following main categorisations:
  • 0.81–1 indicates excellent agreement;
  • 0.61–0.8 indicates substantial agreement;
  • 0.41–0.6 indicates moderate agreement.
K H A T = O v e r a l l   a c c u r a c y r a n d o m   a c c u r a c y 1 r a n d o m   a c c u r a c y

5. Results

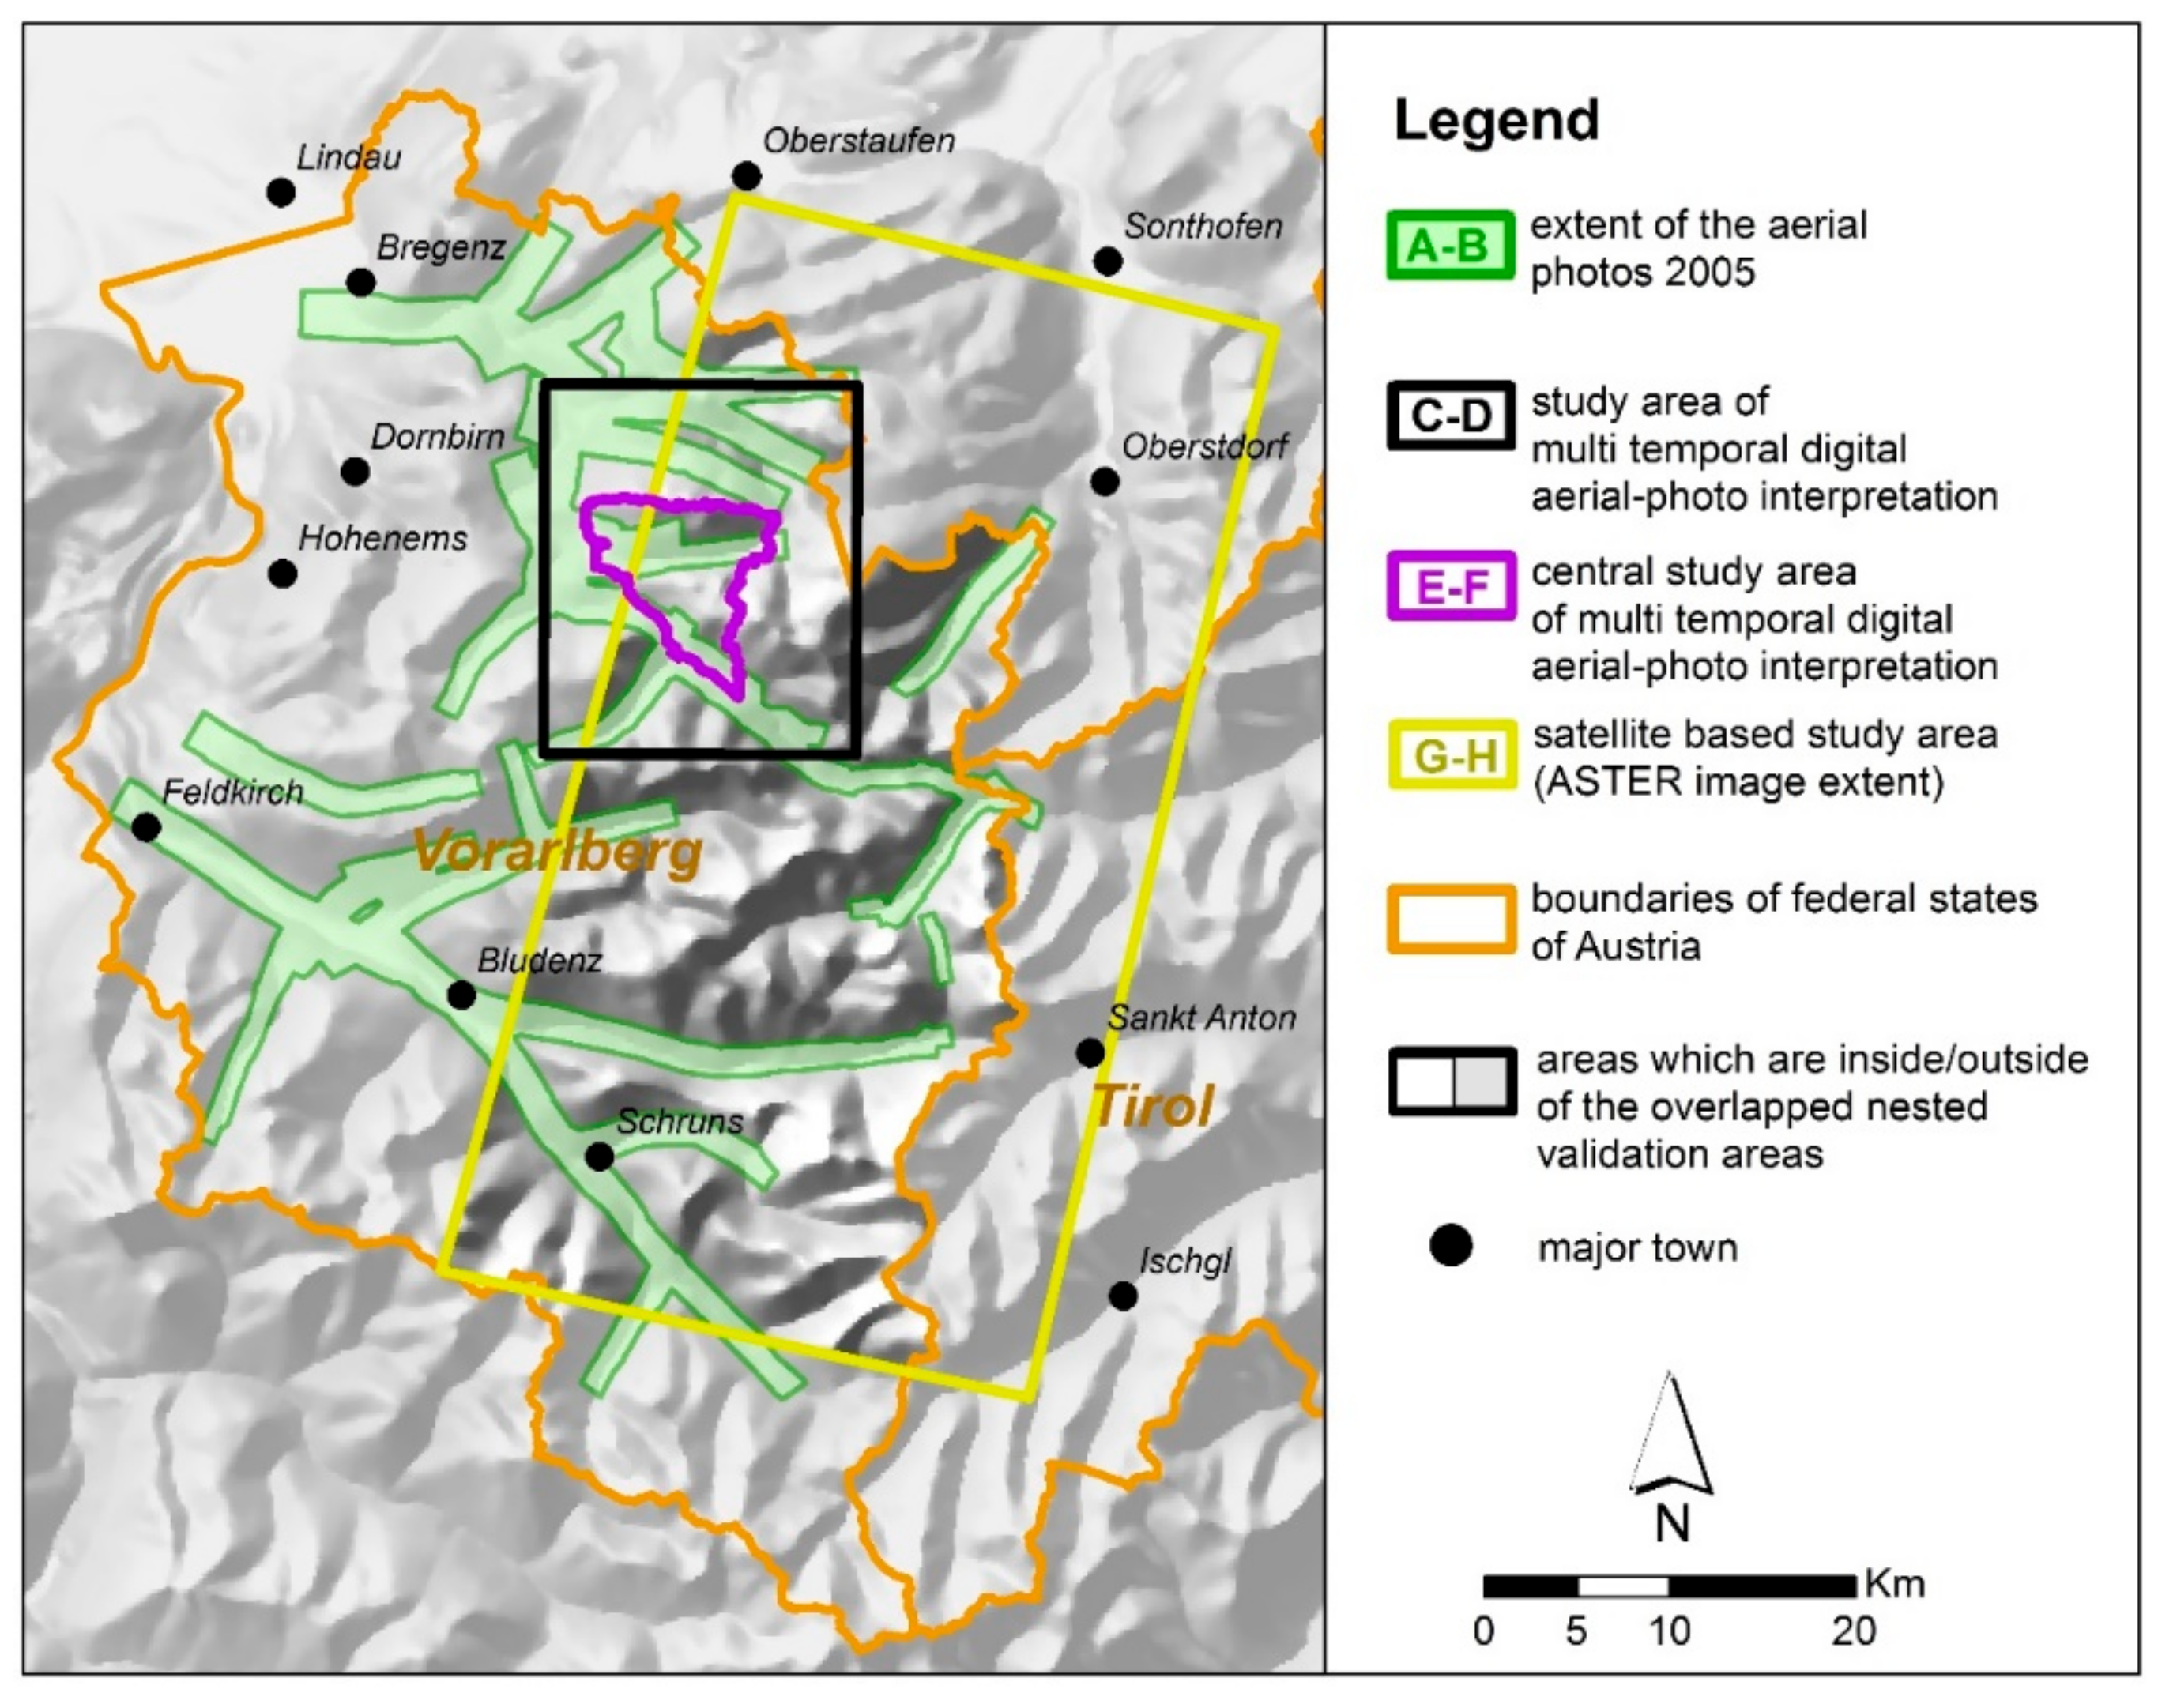
The usual way to verify the effectiveness of the classification methods used is to create a confusion matrix in order to evaluate the classification accuracy reached. From our perspective it is also fundamental to evaluate how the detected landslides in different areas are representative in pixels’ extension and position in comparison to our validation points identified as landslides. In order to judge the limitations and the strengths of the methods a nested approach, with subdivision of the whole image in four overlapping areas of interest (Figure 9), was proposed:
  • The area only covered by the aerial-photo 2005 (green) A for the double classification (DC) and B for the supervised classification (SC);
  • The study area (black) C (DC) and D (SC);
  • The central area (purple) E (DC) and F (SC);
  • The satellite study area (yellow) G (DC) and H (SC).
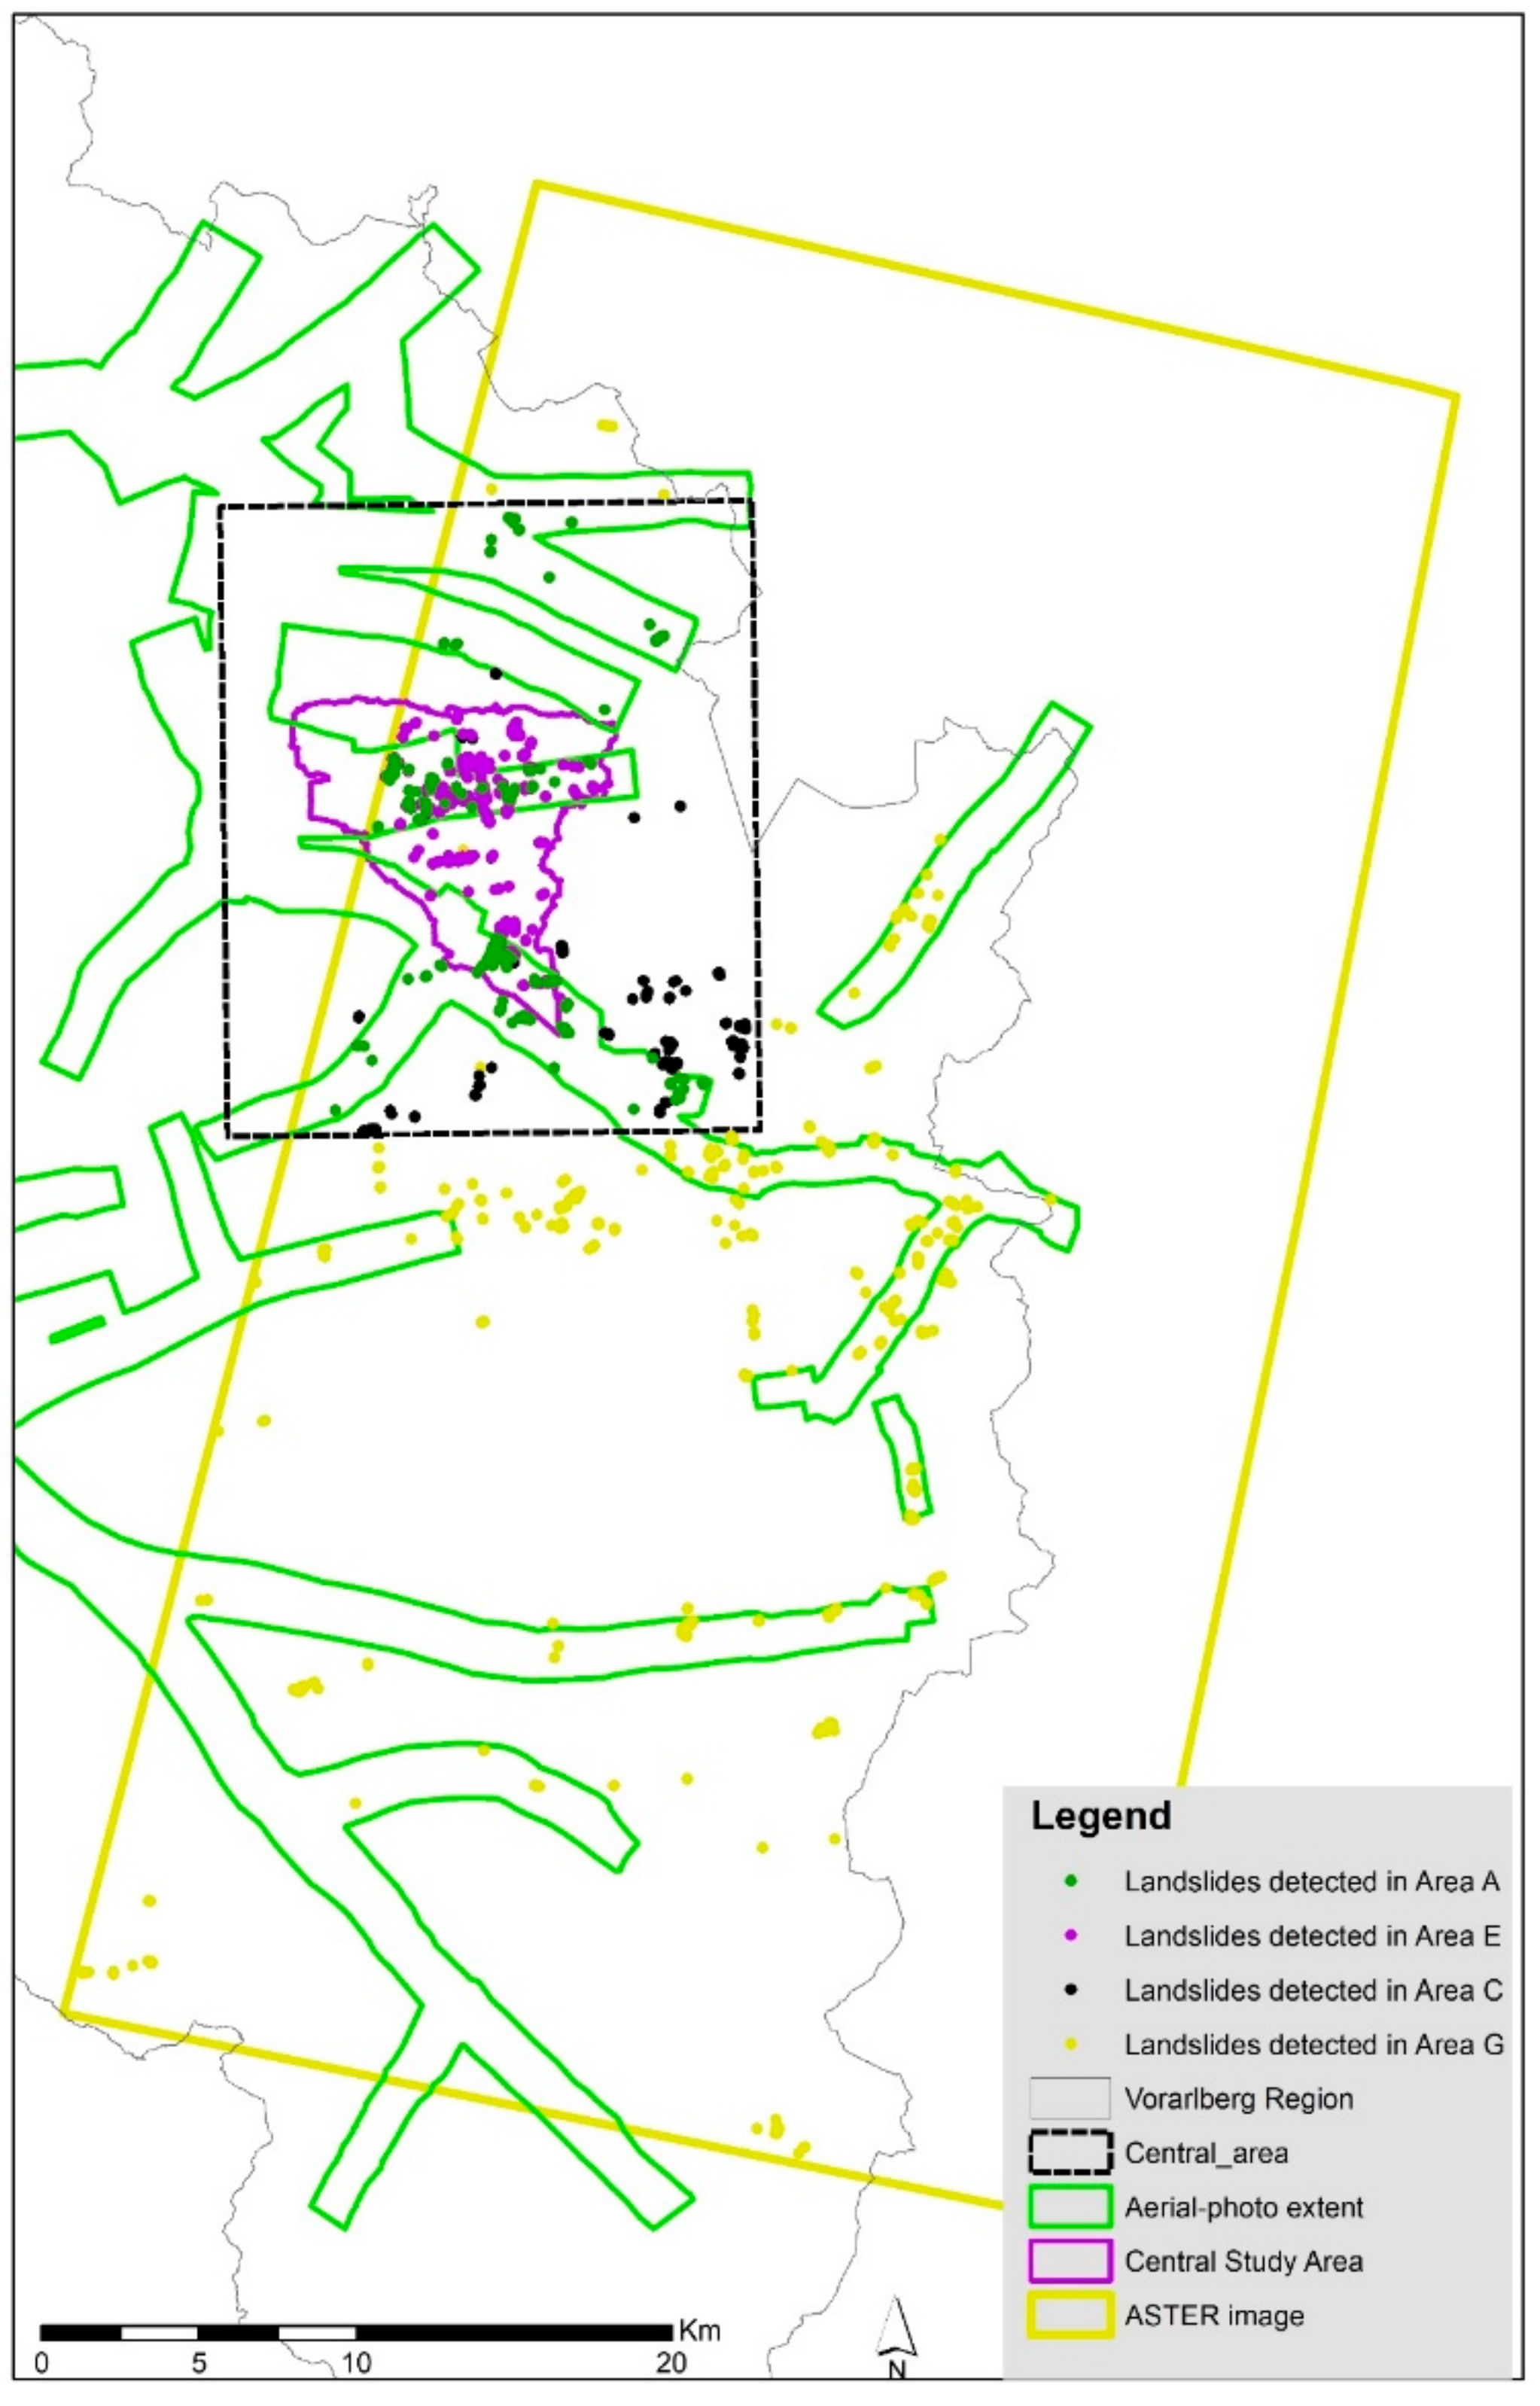
In Figure 10 the overall landslide detection map for the region of Vorarlberg, by taking into account the results obtained by applying the double classification method, is shown.

5.1. Landslide Classification Accuracy

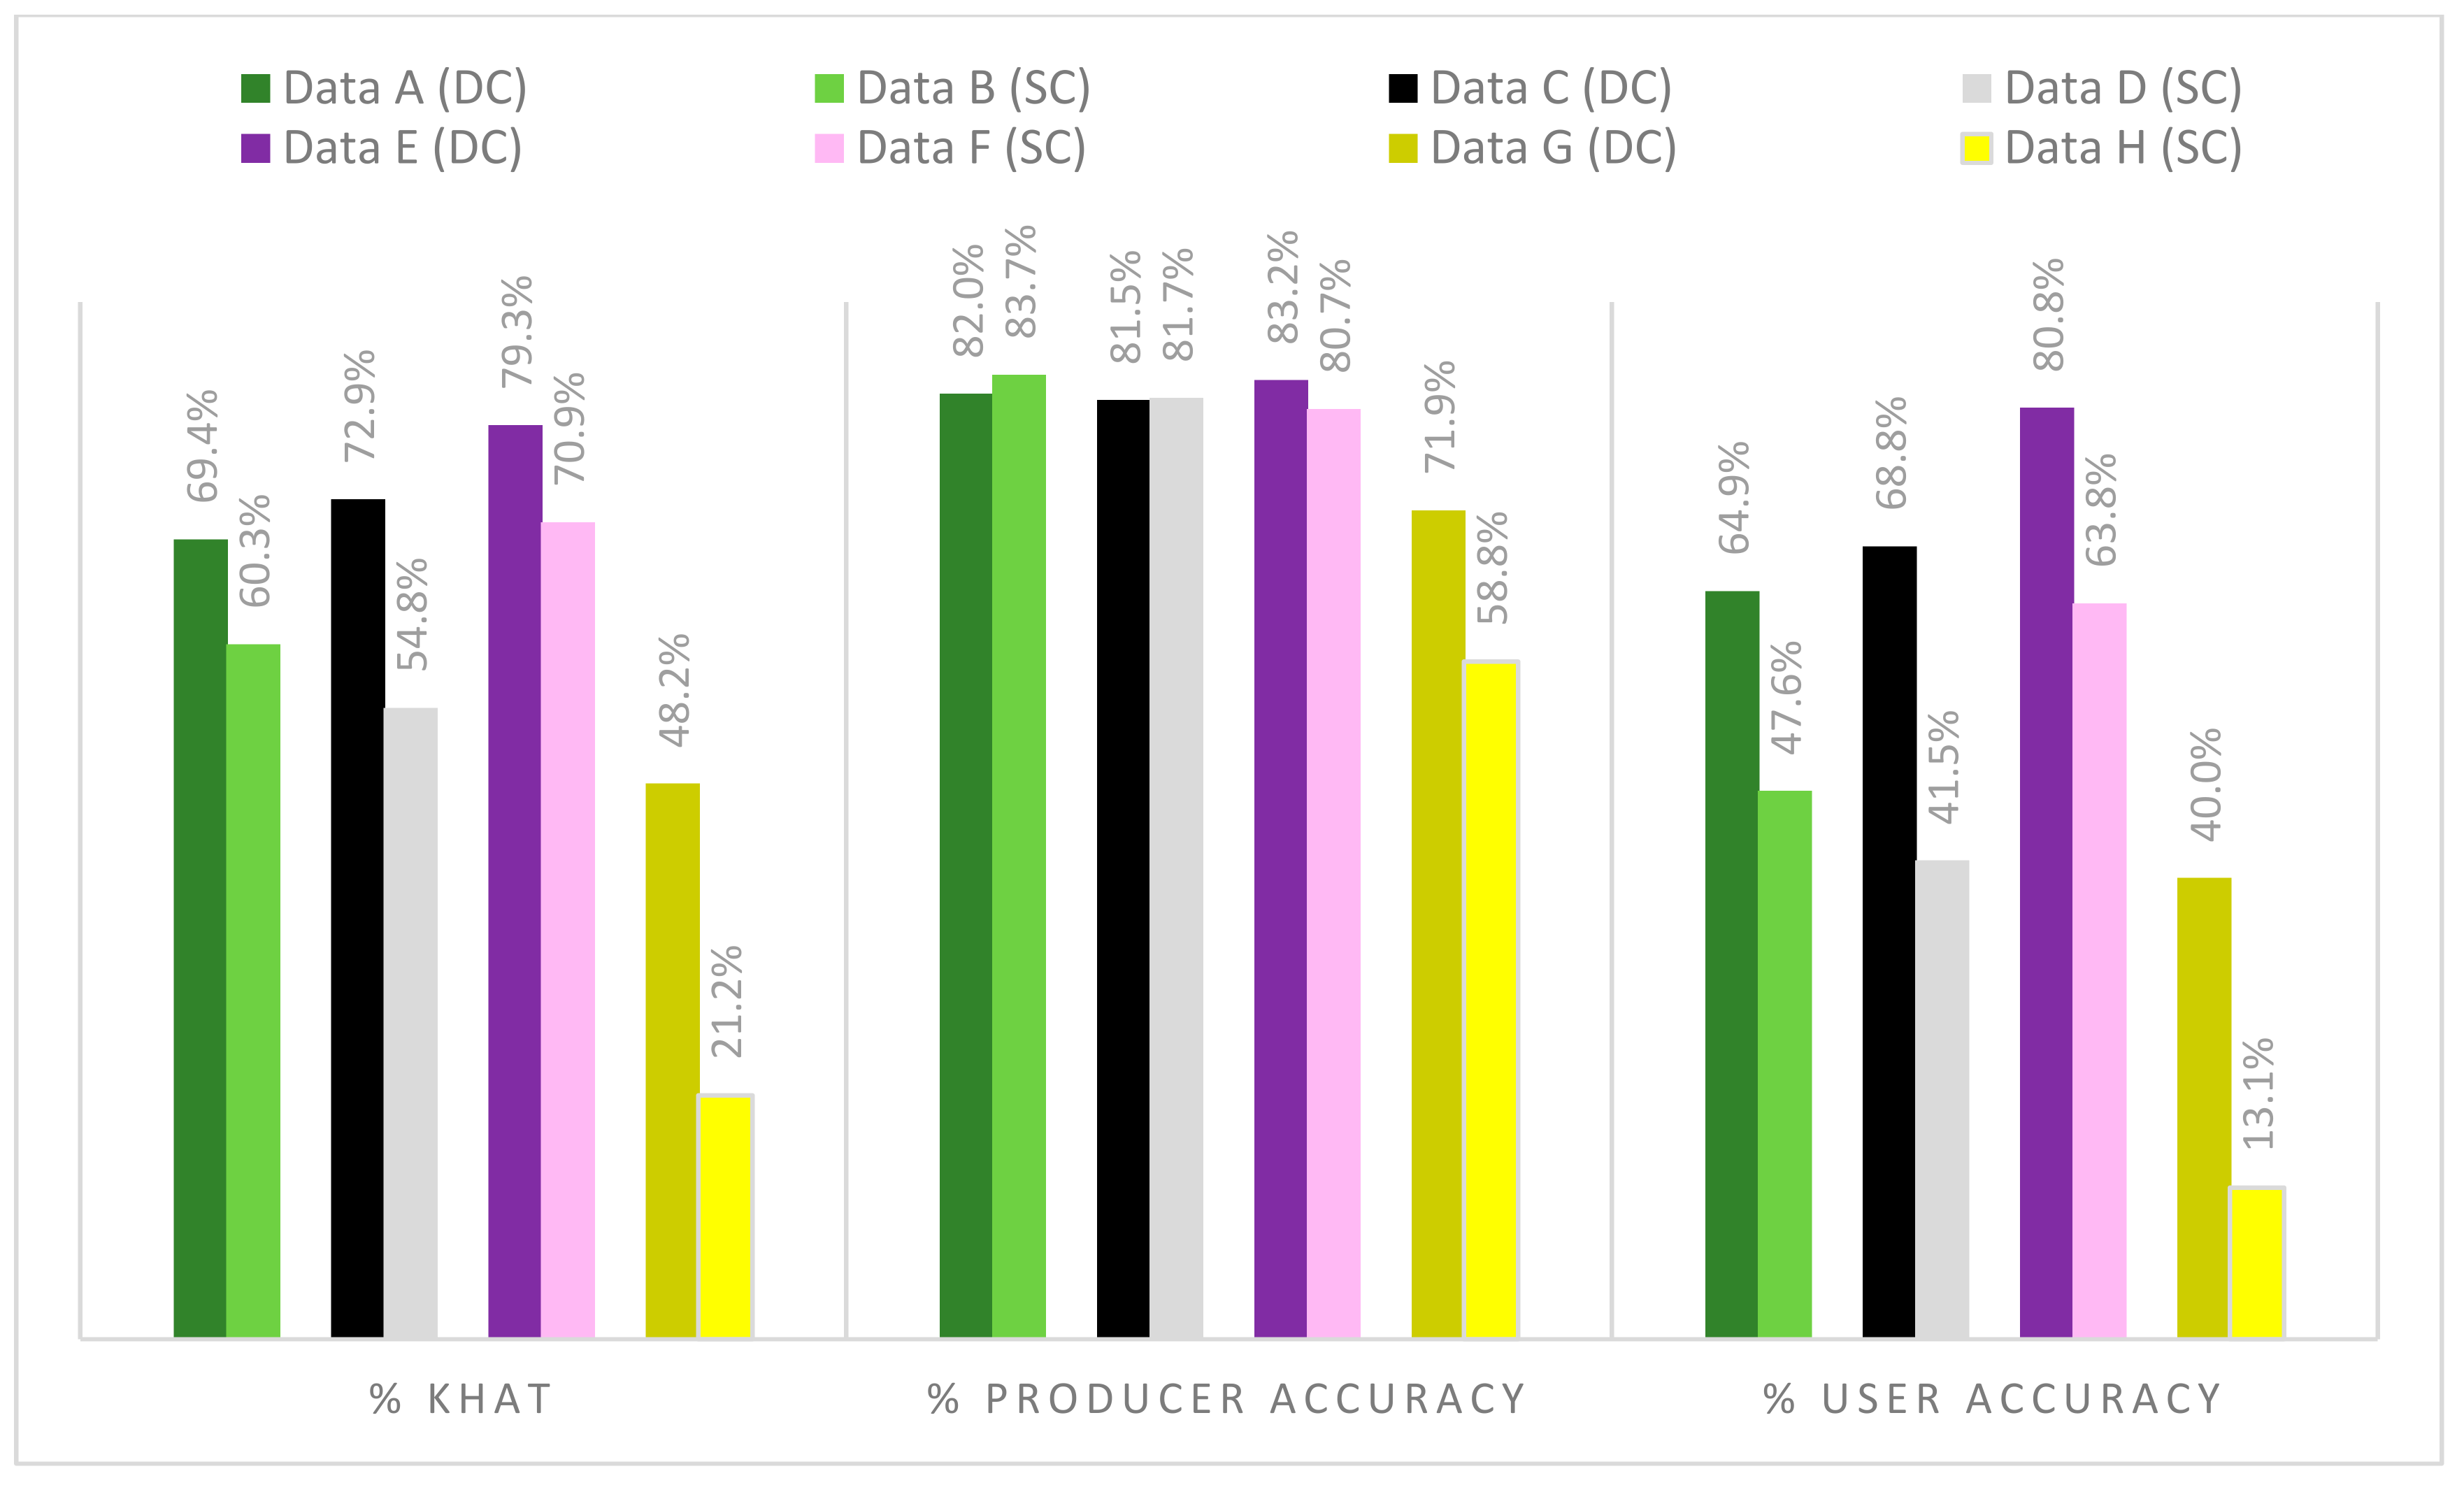
All the pixels of the eight datasets in the four overlapping areas were assessed by means of the confusion matrix (Figure 11). At this stage, it is important to evaluate the effectiveness of the DC process. In fact, apart from the satellite-based study area where the KHAT shows a moderate agreement with 48.2%, in the other study areas this statistic scored over 55%. The best scores were obtained in the central study area (KHAT = 79.3%) where the single classification with a KHAT of 70.9% also bore reliable accuracy. The SC for the slightly larger study area shown as well an almost substantial agreement (KHAT = 54.8%) with a producer accuracy for landslides of 81.7%. Another way to read the producer accuracy is to calculate the mutual omission errors. In larger areas the probability to miss small landslides is higher than in delimited areas, and, apart for case F, the single classification scores always better. For all of the four DC cases the producer accuracy is acceptable. Controversial instead it is the interpretation of the commission errors. The commission errors come primarily from the misclassification of fluvial–torrent process as common landslides and due to the similarity between landslide and fluvial–torrent process signatures.
A further source of error is due to the time span between the first image and the second. The image was taken about at the same time one year before but the pixel appearance under different sun illumination effects, especially in high relief areas, the capacity of the classifier to assign the correct not-landslide class to the image. The consequence of the latter is that in high relief areas the labelled signature landslide can be misinterpreted with denudation processes or (in the majority of the cases) completely misclassified. Other sources of errors are new human activity detected which provoked a change in vegetation (forest clearance, new built up areas, forest-road, new infrastructures) and minor phenology variation affecting cultivars in specific crop seasons.
The good quality in central study area F is a consequence of the fact that there, a minor number of fluvial–torrent processes were documented in comparison to the rest of the study areas. A further remark concerns the river network extension which in this area it is not so preeminent. Those circumstances leaded to a lowered commission error. By removing the class fluvial–river process from the classifier (Figure 12) several indexes were improved. For example, concerning the KHAT, it is possible to score for the three DC classified datasets almost an excellent agreement.
Furthermore, for a regional-scale classification (data G) this method demonstrates good potential for mapping landslides, obtaining a good 28% of omission errors and a substantial agreement performance with a KHAT of 59%, once the river processes are removed from the classifier.

5.2. Landslide Validation

The landslide validation has a duplex purpose: on one hand, to verify how many landslides the classifier was able to detect, and on the other hand, to quantify how well those pixels represent spatially specific landslide types. This stage of the study was conducted only on the three well-documented study areas.
From the original process inventory, a selection based on spontaneous landslides activated between 2005–2006 in the study area, in the aerial-photo of 2005, and the central study area was created. Furthermore, two new fields, called SAT_VAL and SAT_POS, were added and coded as from Table 4 and Table 5:
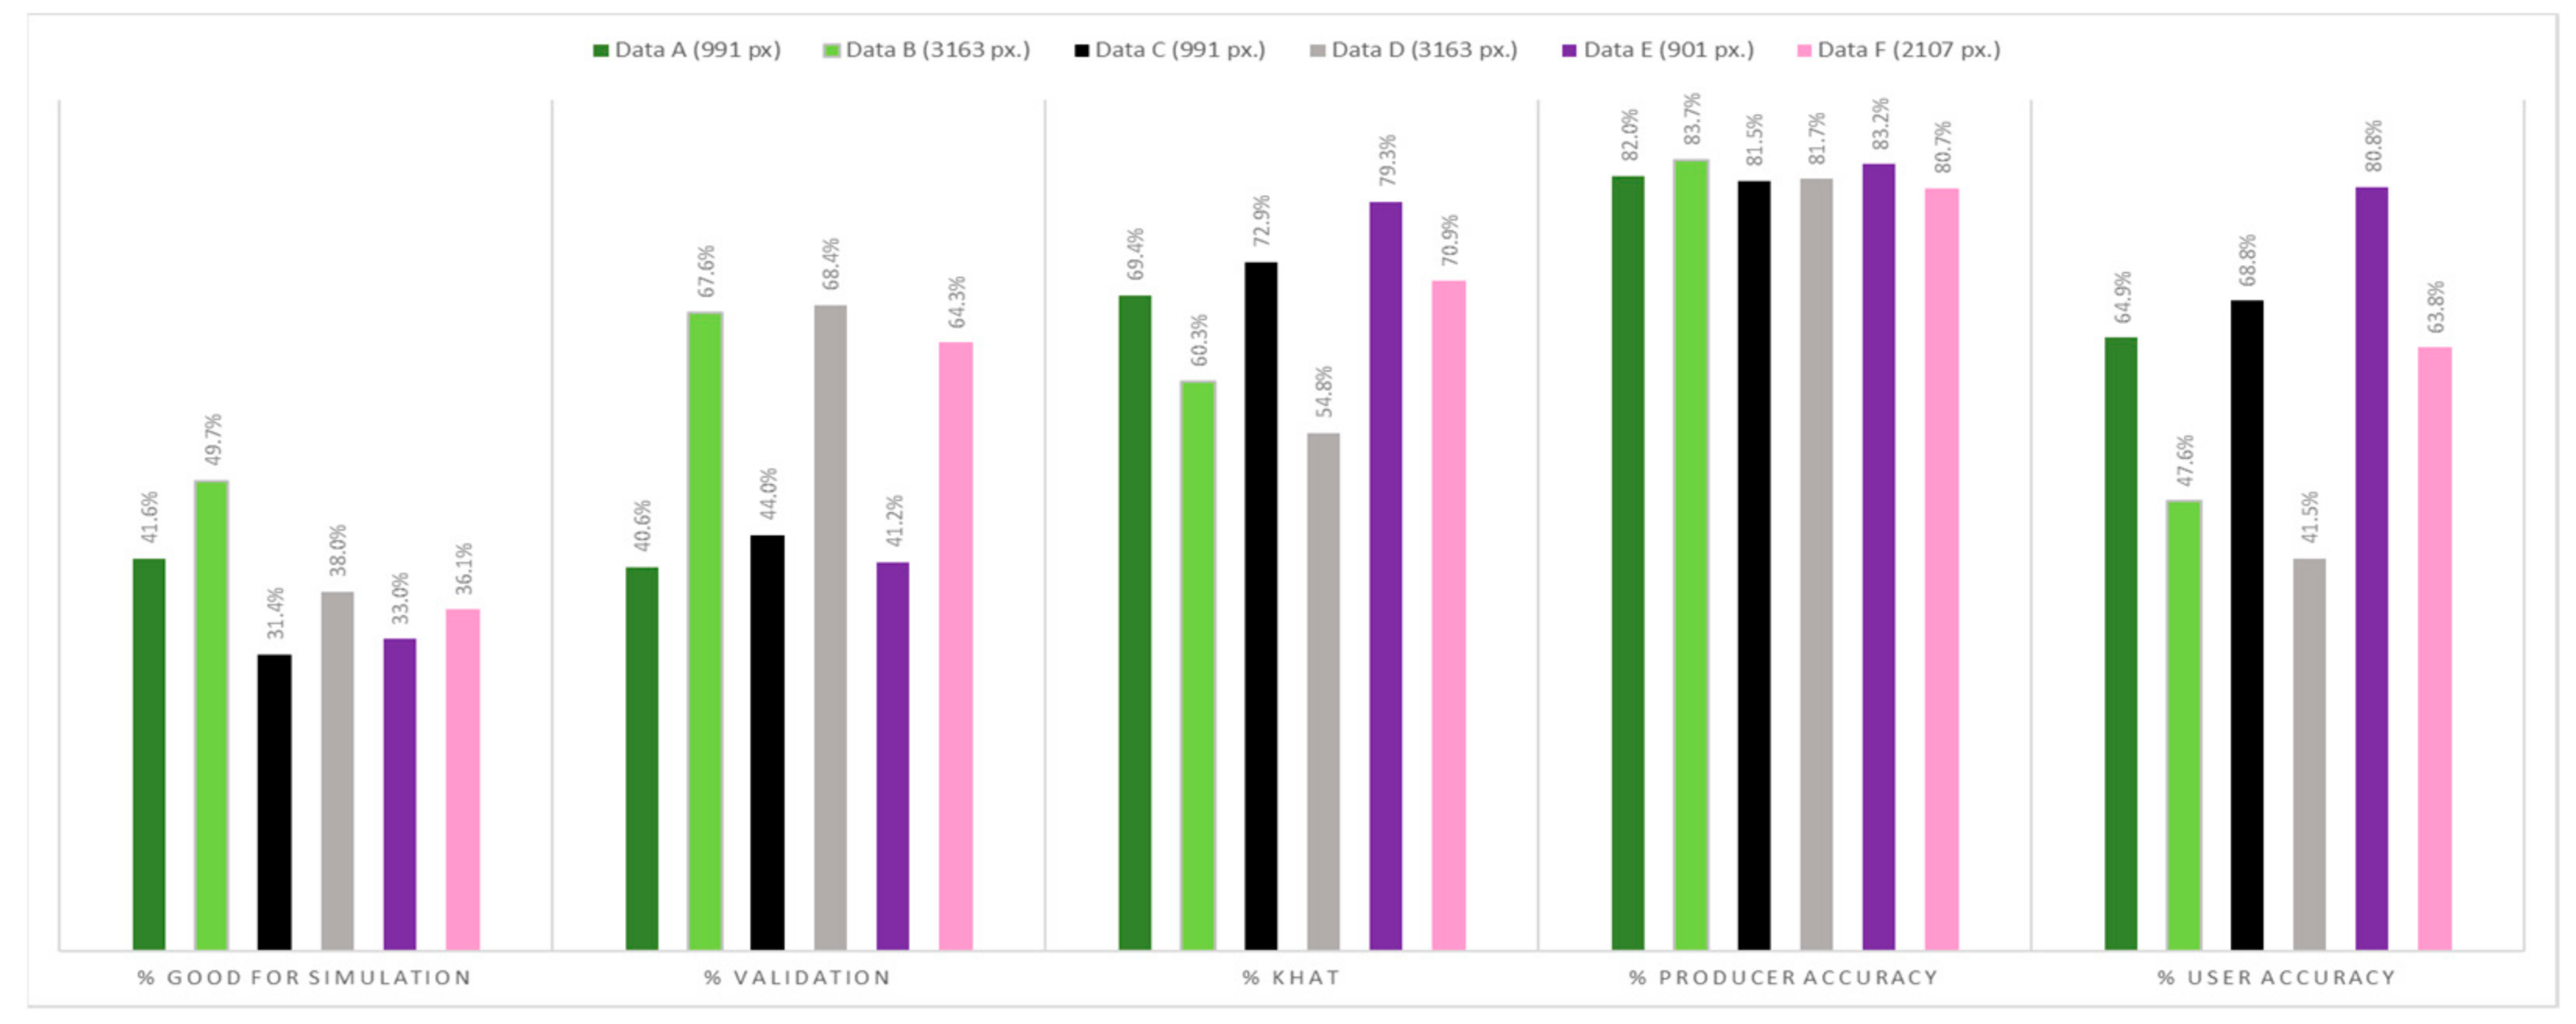
For this validation procedure, the code = 100 of SAT-VAL were assigned to the re-classified pixels which corresponded to the original inventory point data. Furthermore, some new points as new and reactivated landslides and torrent process, most of all on the areas not covered by the aerial photo of 2005, were added. In Figure 10, in fact, the biggest number of new and reactivated landslides was identified in the D areas where for almost the half of its surface only the 2006 aerial-photo was available. Here, between 50 and 110 new or reactivated landslides were detected by the used satellite-based approach. Despite those new findings the validated landslides are still under 50% with the DC datasets and under 70% for SC datasets (Figure 13). The second field SAT_POS was used to estimate the mapping accuracy and positioning of the pixels in the classified image. The majority of good quality data are found in the study areas D and B (Figure 14) but by looking at Figure 9 it can be clearly seen that area B, in terms of validation number and representative landslides, performs best considering as well the respectable KHAT. The results from this evaluation, which identify in each study site and for both datasets available accurate and precise landslides, are very important since they could be applied in the future for the creation of a landslide-susceptibility map of the same area.

6. Discussion

This study case focused on the 2005 catastrophic event in Vorarlberg shows some improvement on the producer and user accuracy, if only focused on the results delivered for the sub-areas (A, C and E), when compared to a previous attempt to adopt an object-based image analysis method on landslide detection in different areas of Austria and Italy [38]. Moreover, another similar approach proposed by the same author for a regional case study [39], thanks to the higher revisit time of 5 days and to a multi-temporal ndvi profiling method, produced a higher kappa index score and most of the open/barren land could be discarded as landslides. In this sense, the use of new satellites with higher revisit times can solve the issue related to the high false positive rate documented in this study, especially on the regional scale attempt for the areas G and H. Considering that a similar high intensity precipitation episode occurred recently only on the 11th August of 2002 [40], it is ruled out that the false positives found could have been associated to another event that occurred between September 2004 and July 2005.
The work already mentioned [26] was addressed to the visual recognition and characterisation of different types of landslides in the region of Voralberg, being the focus of our group the localisation of the main scar for each landslide. This approach is generally driven by the aim of applying point source data to generate multi-variable landslide susceptibility maps at different scales [41].
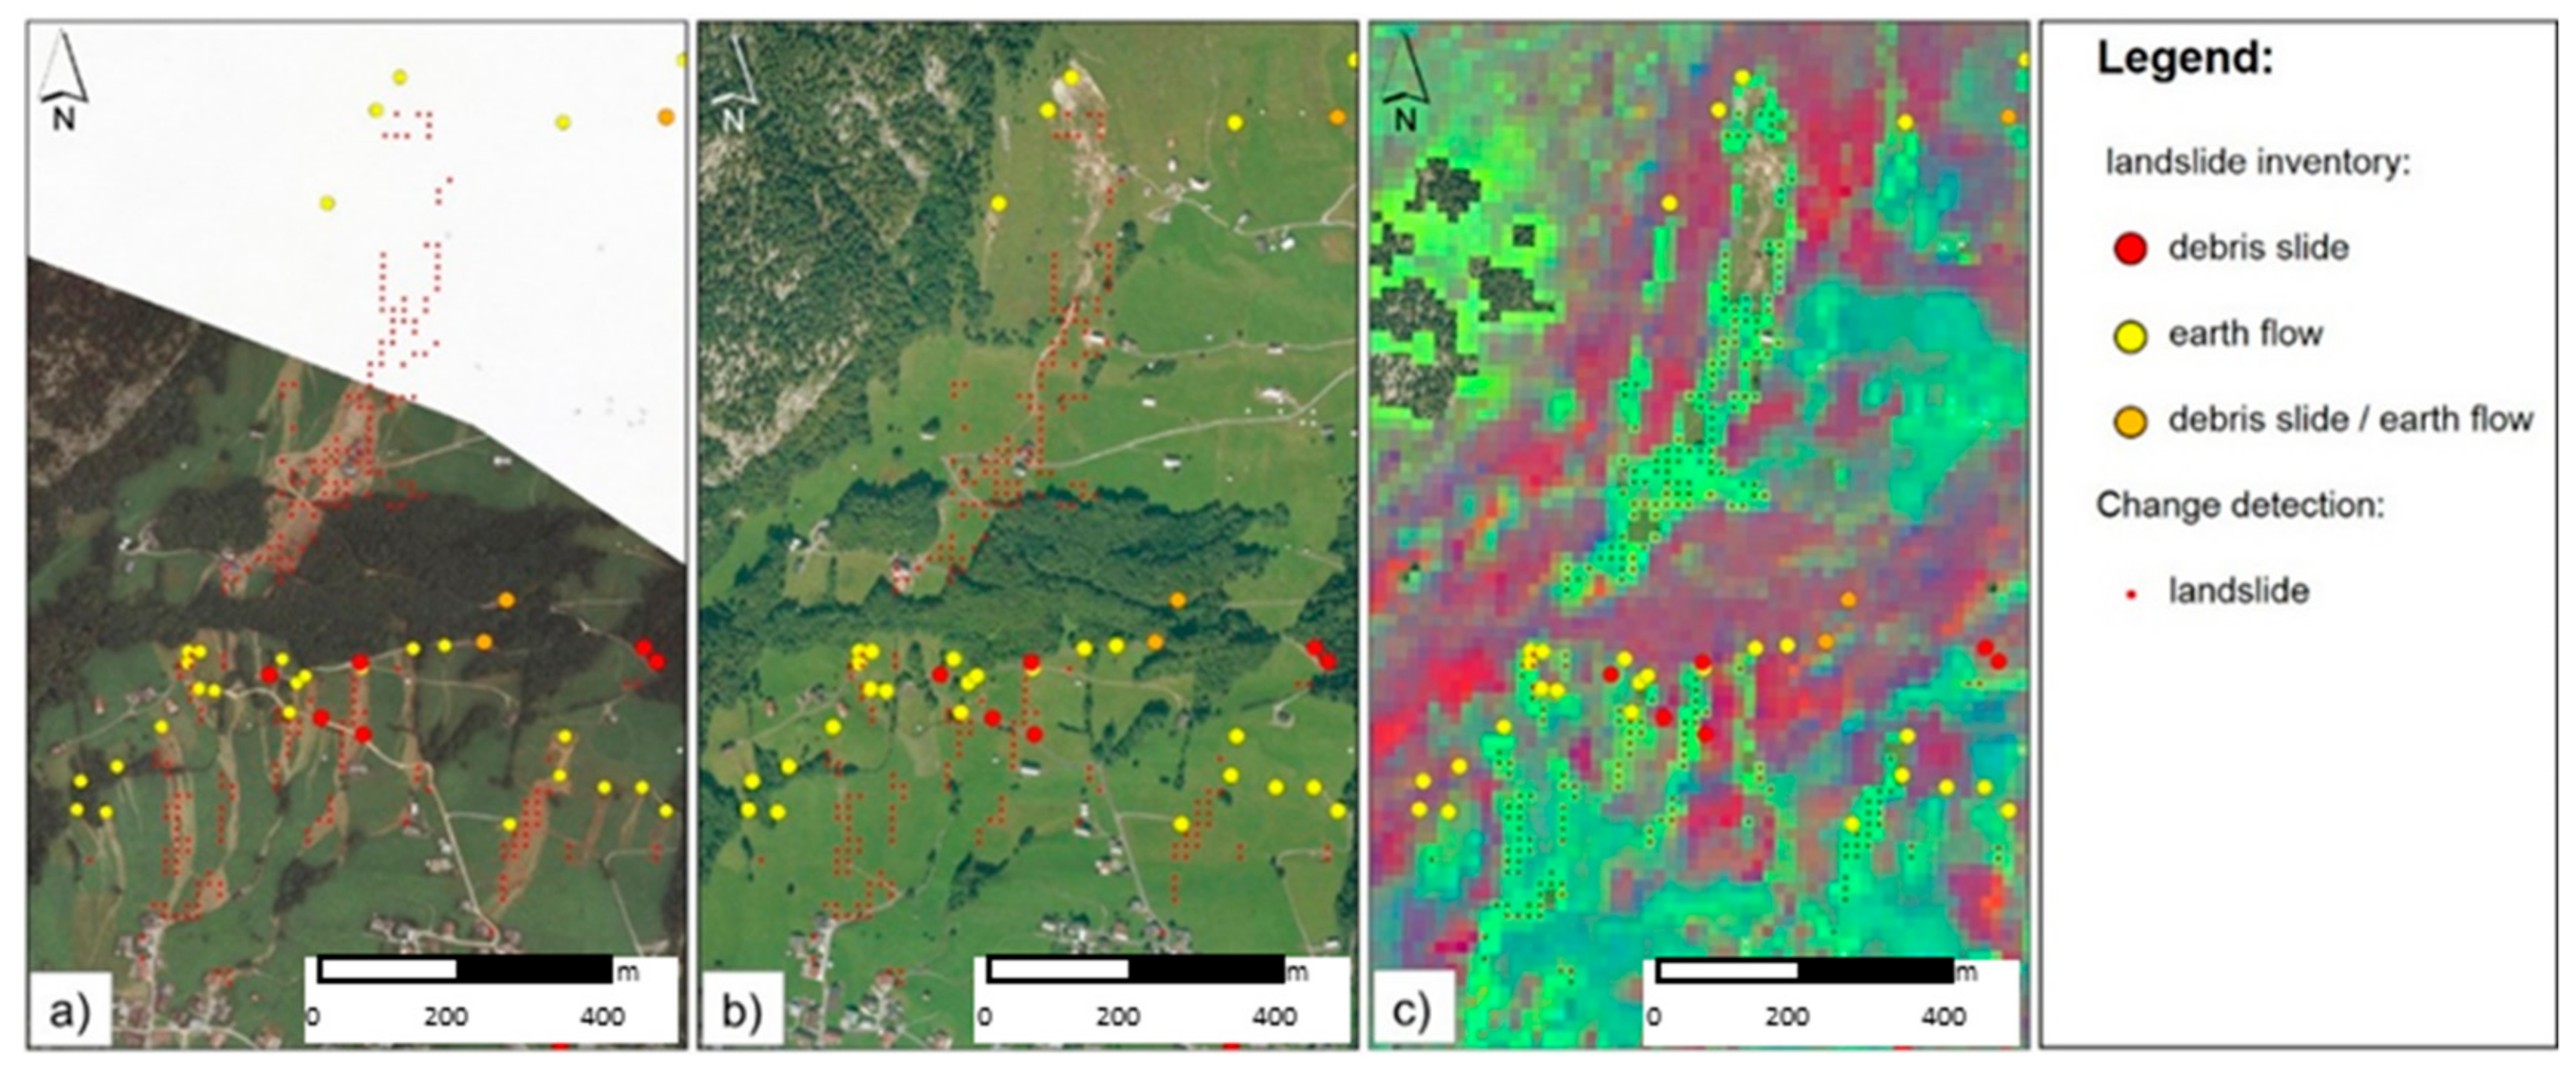
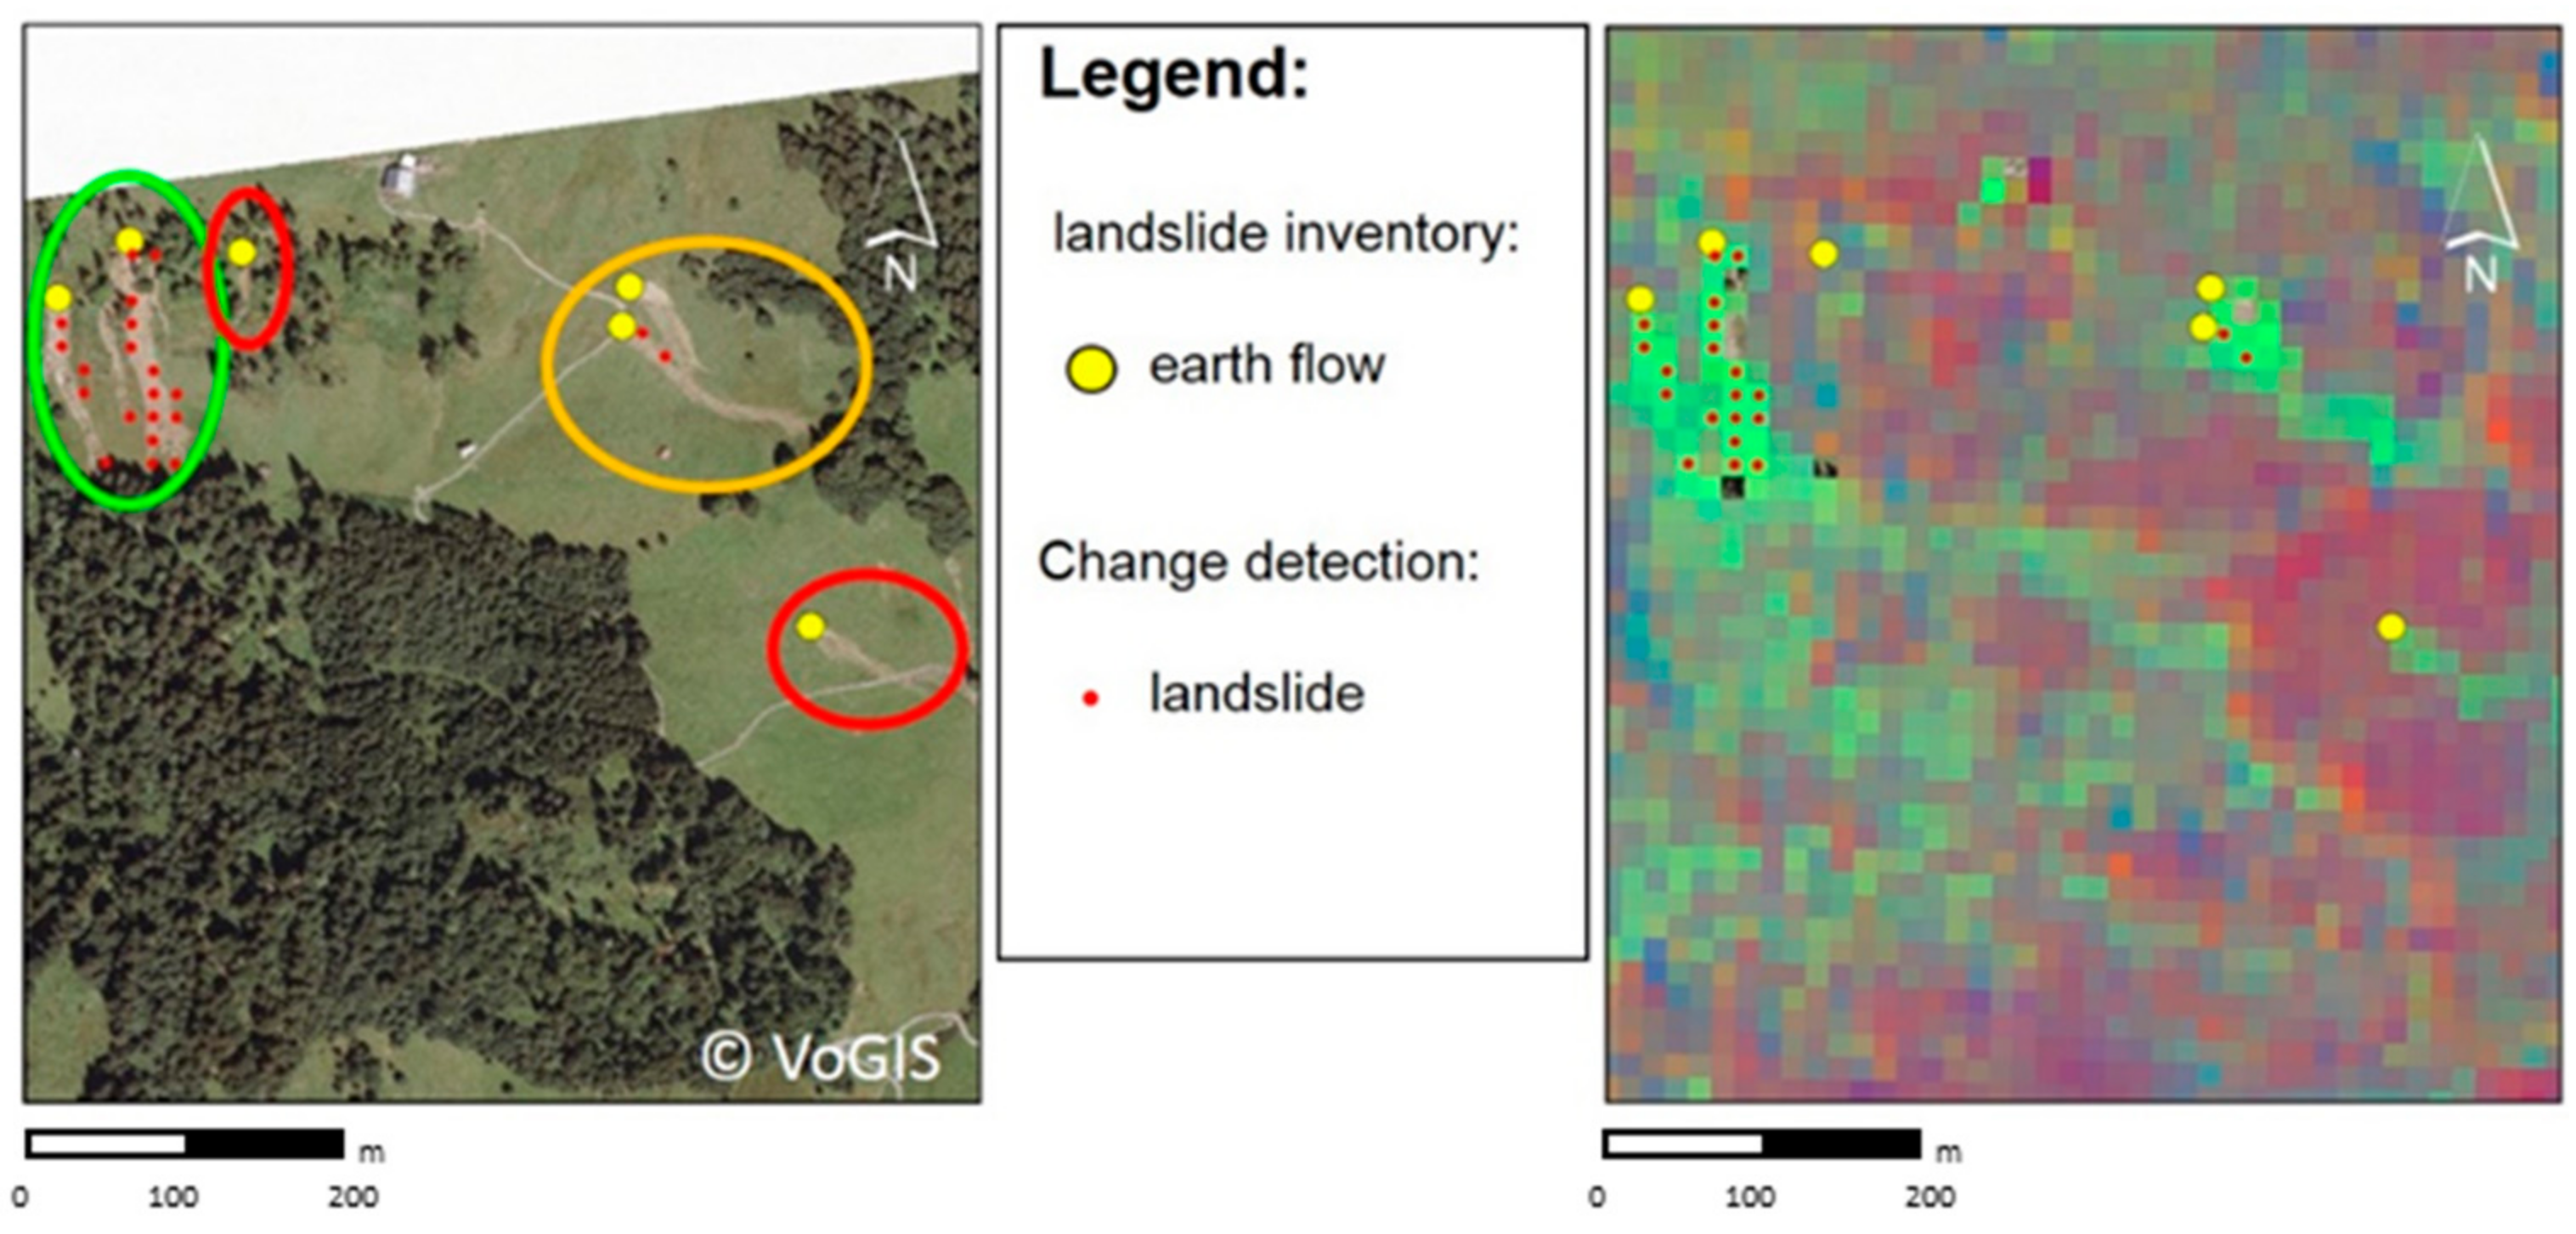
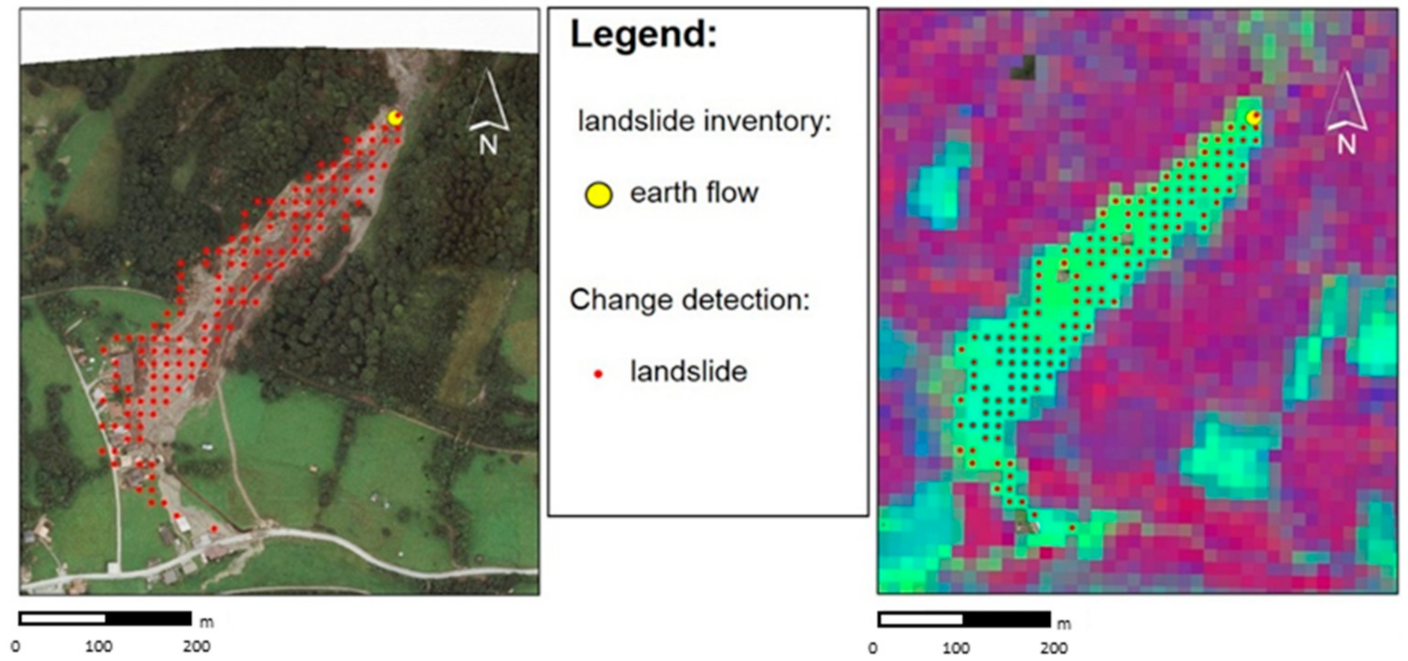
In order to highlight visually the performance of our landslide detector, a series of figures will be used as showcases. Some explanation is required to enhance the reading of the following figures:
  • the image shown beside each aerial photos (in Figures 15 and 17–19) represents the RGB composites made of three index of spectral change (introduced in Table 2);
  • the bigger points with a black contour are the validation data whereas the smaller red points without a contour are the classified pixel as a landslide with our method;
  • the minimum mapping unit defined in our approach corresponds to two pixels (450 m2) belonging to the same phenomenon, even if they are not contiguous.
The main classes established during the compilation of the landslide inventory were:
  • Debris slide: such as the two illustrated (with white points) in Figure 15 show higher contrast with the surrounding areas and shorter to nonexistant trail from the scar to the accumulation area.
  • Earth flow: such as the two illustrated (with yellow points) in Figure 15 show lower constrast with the surrounding areas but longer trail which indicates a flow-like movement over the topography. A distinctive characteristic of earth flows is the very unusual transport forms that they normally leave behind.
  • Mixed class: in the special case of a landslide difficult to distinguish due to the location of the process (forest land cover), to the quality of the aerial photo (haze, cloud or shadow) or to the complexity of the process (e.g., landslide initiated as a debris slide but evolved into an earth flow) a mixed class was adopted instead.
As already mentioned in Section 3, the major problem affecting landslide classification methods based on spectral signature analysis is the amount of water present in the mobilised debris at the time of the event. In our case by using, as verification for the model, only the three types of landslide defined above, we reduced the possibility of classifying debris flows and debris floods as gravitational phenomena affecting instable slopes.
Concerning the classification accuracy for each class of landslide, a preliminary conclusion can be drawn that, for example, for area C, 75% of the earth flows were identified with a good score (at least 300, see Table 5) in position accuracy and 87% of the total mapped landslides belong to this class. In area G, instead the percentuage of landslides classified in the inventory as earth flow is 54% of the total; moreover, here 80% of the correctly identified landslides correspond as well this class.
By summarising those outcomes in the two major sites investigated by this method and bearing in mind that only landlides bigger than two minimum mapping units (900 m2) can be recognized, the majority of slope instabilities mapped were classified in the inventories as earth flows. Even though that consideration could be interpreted as a disadvantage, earth flows are rarely detectable one year after an event with aerial-photo visual identification, whereas the other two classes still maintain a distinct morphology at high resolution [26].
The most interesting example of the positive impact of ASTER images for landslide detection can be found in the area around the village Au that lies in the central study area (data E and Data F in purple) (see Figure 15). Here, a very conspicuous number of landslides were detected and positively validated (as shown in Figure 15c in the landslide inventory process legend). In this example the second biggest earth flow was detected, spatially, almost completely (77% of the total) and validated as extremely good (class 100 in Table 5) in position accuracy. Moreover 28 landslide correctly recognized here corresponds to the inventory class earth flows, whereas six corresponded to debris slide and only three to mixed class. If the double classification results are considered here, 62% of the total landslides are detected correctly and 82% of them score high in position accuracy.
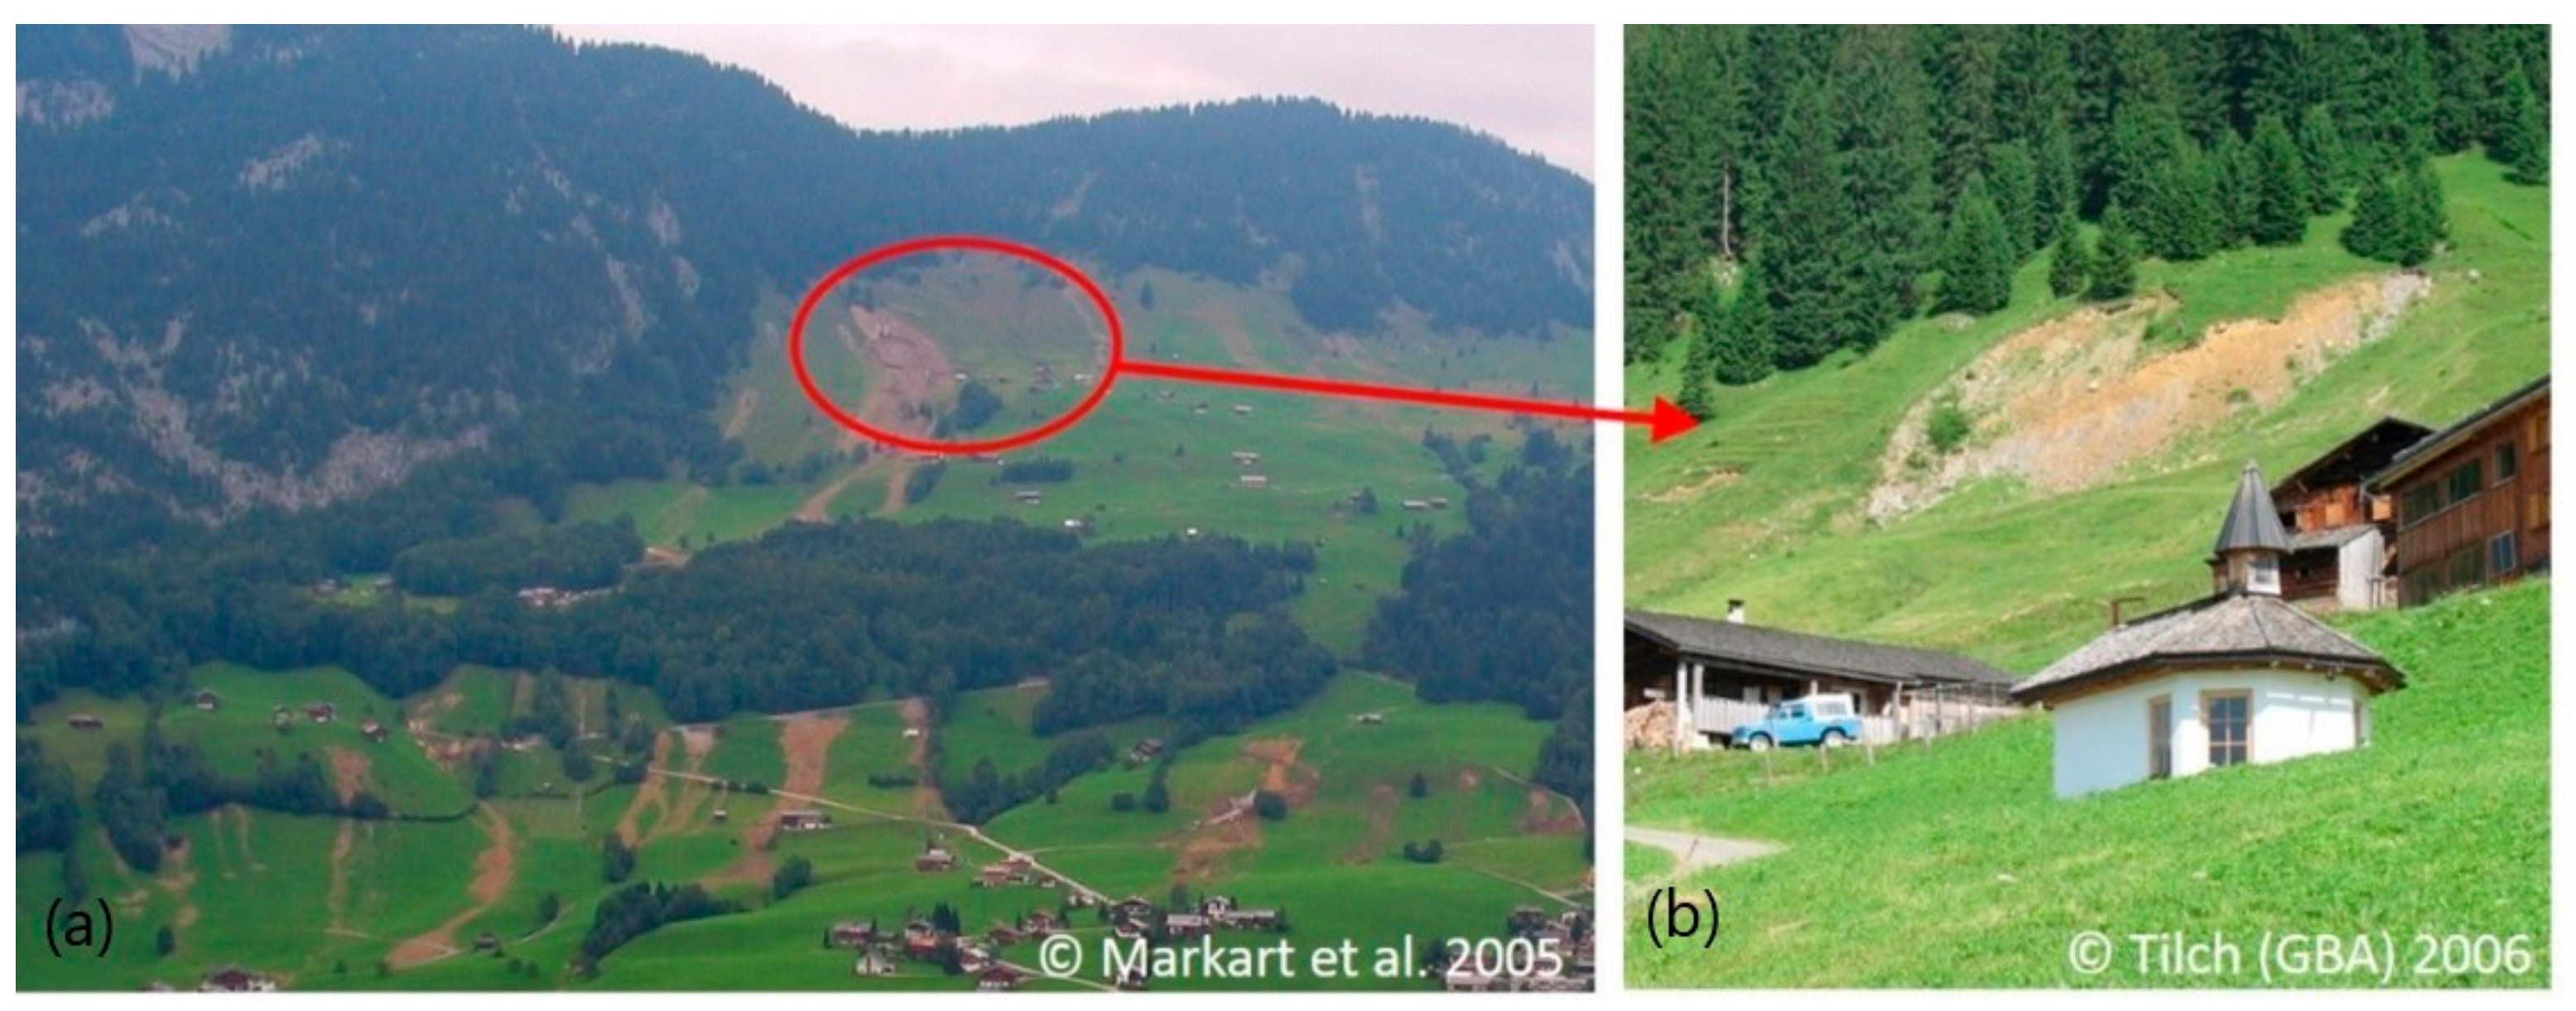
By means of the applied remote sensing method, some landslides, which could not be identified by the analysis of aerial photos due to the gap in the image for August 2005, were detected. The confirmation that this additionally processed information is correct can be shown for examples on the landslide photos, which were taken in August 2005 (Figure 16a) and during the 2006 field work (Figure 16b).
Therefore, missed information retrieval from aerial-photo analysis can be overcome by optic satellite pixel-based landslide classification. Another interesting example (Figure 17) is the area around Warth-Teschenberg on the river Lech where two landslides (in yellow) activated in 2005 were correctly identified. For those two earth flows, although the minimum mapping units are respected, the very low location accuracy prevents any further applications. On the other hand, the two old debris slides on the river bank were wrongly classified by the detector as active landslides; instead, both of them should have been categorised as river-debris floods.
Figure 18 showcases the different degrees of detectability for a group of six landslides. In fact, in Hintereggalpe, out of six cases, only three types of landslides could not be completely detected. In two cases, highlighted with the red ellipse, their surfaces are too tiny (areas smaller than 900 m2 which correspond to two minimum mapping units), whereas in the yellow circle the close proximity of two landslides allowed the classifier to identify only the one with a longer trail. A good outcome for the validation for this study case is that the three classified earth flows score very high in satellite position and accuracy scores, since for all of them the scar is very recognizable.
In Figure 19, the massive Danöfen earth flow represents the biggest landslide detected in the area by the method. In this case, it is possible to detect the whole extension and to assess extremely positively the position of the classified pixels. In fact, 71% of the total area of the landslide can be detected correctly and 80% of the pixels are inside the digitized polygon.
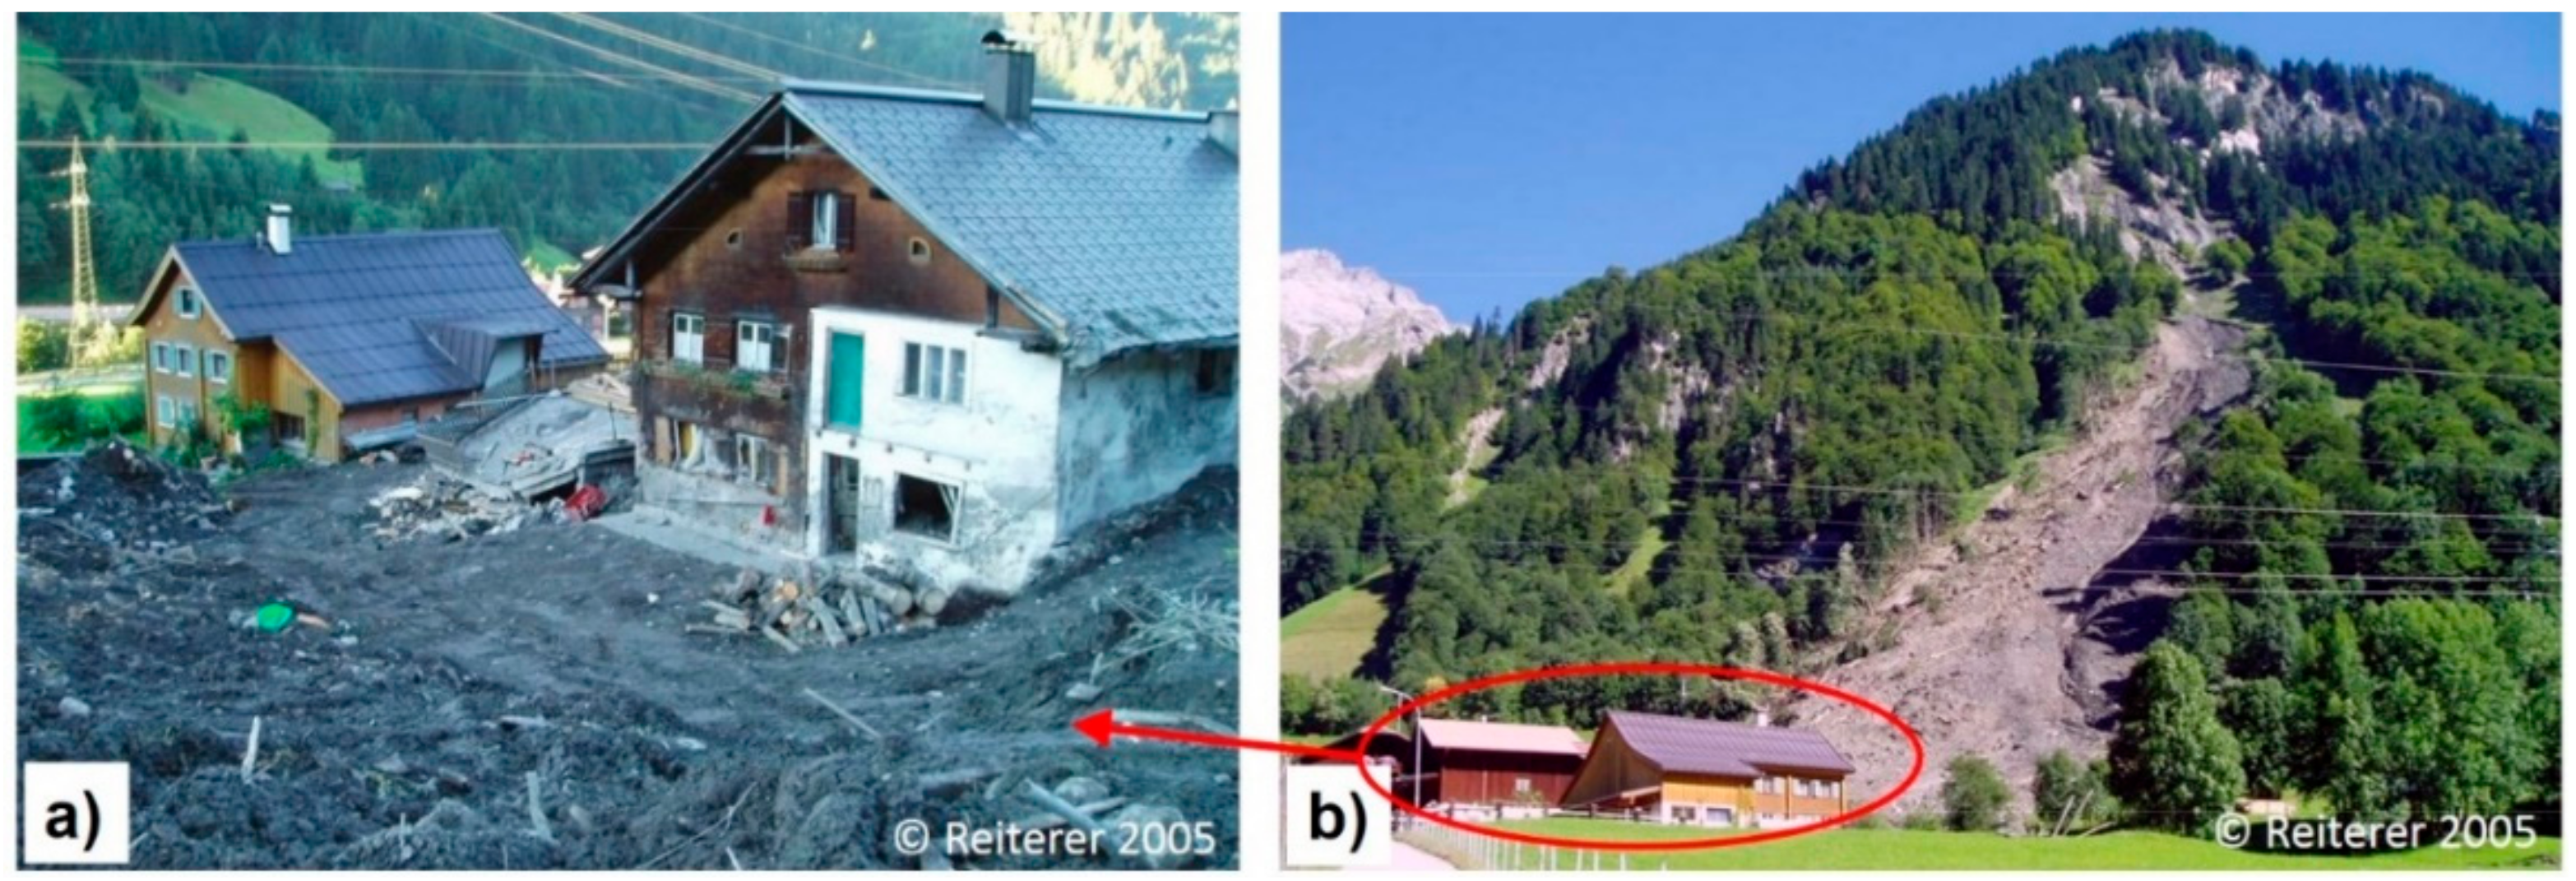
In Figure 20a the results of the devastating earth flow and in Figure 20b its impressive perspective view from the valley floor on a field photo taken the day after the event can be seen.
At last, a consideration can be made concerning the impact of different land cover types and different lithology on the classification performance.
In fact, a distinction between study area D and G (the whole Vorarlberg) can be made. Althoght for both sites, the percentuage of grassland on the total remains relatively similar, forests decrease for area G, giving more room to bare rock and shrubs (Figure 2) which are not suitable land cover types for landslide recognition based on NDVI change-detection techniques. Another interesting aspect is rock contrast of the metamorphic against sedimentary, with it being easier on lighter sediments and rocks to visually identify the landslide. The same statement cannot be made for the remote sensing method that relies on change in vegetation index and not in change of rock-vegetation contrast.

7. Conclusions

ASTER images were capable of detecting up to 82% of landslides mapped by visual cognitive interpretation of aerial-photos on a 30-times-finer resolution; more in detail, a combination of pixels classified with supervised classification SC and double classification DC (combination of SC and unsupervised classification) are particularly suitable for landslide detection at a sub-regional scale. It can be stated that the datasets for the 2005 aerial-photo extent B and central study area F can be entirely exploited, whereas in case of the whole study area (C–D) is better to rely on dataset C (with the KHAT and user accuracy in D not completely reliable). More in detail, if we combine dataset B with C and F we obtain a more reliable landslide classification for the whole study area (C–D). The conspicuous number of 110 landslides which are correctly identified and which are enough accurate in position and extension represents a very good dataset as input data for modelling landslide susceptibility maps or other hazard oriented maps. After having assessed DC pixels, another major achievement is that ASTER can be used for landslide recognition on a regional scale. In fact, by removing the class fluvial–river process from the statistics, on a regional scale an accuracy of 59% landslide recognition can be achieved. A large number of false negative pixels are detected on steep slopes also where slightly different sun elevations and viewing angles generate not-comparable shadowing effects. Those problems arise from the lack of a topographic correction performed on both scenes in exam. Sometimes the shadow and cloud masking were not efficient due to the lack of the thermal bands on 90 m resolution usually available on TERRA ASTER 1B products. The advanced ACCA cloud detection therefore could not be performed in this study. Some of those limitations could be overcome with the use of SPOT and SENTINEL-2 by applying topographic correction, better alignment of the scenes which helps to avoid geometric errors, and thanks to a higher temporal resolution (5–10 days) which allows the user in the post-processing stage to reduce the number of false positives. The feasibility of adoping a similar approach is already being investigated, based on high-resolution data, to detect landslides occurred over the course of other catastrophic event in Austria, such as Taxen valley (Salzburg) in June 2013 and Sellrain valley (Tyrol) in June 2015, with the aim of obtaining comparable mapping accuracy on results.

Author Contributions

Conceptualization, F.V. and N.T.; Data curation, F.V.; Formal analysis, F.V.; Funding acquisition, A.K.; Methodology, F.V.; Project administration, A.K.; Resources, A.K.; Software, F.V.; Validation, N.T.; Visualization, N.T.; Writing—original draft, F.V.; Writing—review & editing, N.T. and A.K. All authors have read and agreed to the published version of the manuscript.

Funding

This research was partially funded by the Österreichische Forschungsförderungsgesellschaft FFG in the Austrian Space Applications Program (ASAP 11) through the project “Land@Slide” (contract no: 847970)”.

Institutional Review Board Statement

Not applicable.

Informed Consent Statement

Not applicable.

Data Availability Statement

The data presented in this study are available on request from the corresponding author. The data are not publicly available because not yet being included completely in our landslide geo-database.

Conflicts of Interest

The authors declare no conflict of interest.

References

  1. Yang, X.; Chen, L. Using multi-temporal remote sensor imagery to detect earthquake-triggered landslides. Int. J. Appl. Earth Obs. Geoinf. 2010, 12, 487–495. [Google Scholar] [CrossRef]
  2. Genevois, R.; Tecca, P.R. The Vajont Landslide: State of the art. Ital. J. Eng. Geol. Environ. 2013. [Google Scholar] [CrossRef]
  3. Heleno, S.; Matias, M.; Pina, P.; Sousa, A.J. Semiautomated object-based classification of rain-induced landslides with VHR multispectral images on Madeira Island. Nat. Hazards Earth Syst. Sci. 2016, 16, 1035–1048. [Google Scholar] [CrossRef] [Green Version]
  4. Tsai, F.; Hwang, J.; Chen, L.; Lin, T. Post-disaster assessment of landslides in southern Taiwan after 2009 Typhoon Morakot using remote sensing and spatial analysis. Nat. Hazards Earth Syst. Sci. 2010, 10, 2179–2190. [Google Scholar] [CrossRef] [Green Version]
  5. Whitworth, M.C.Z.; Giles, D.P.; Murphy, W. Airborne remote sensing for landslide hazard assessment: A case study on the Jurassic escarpment slopes of Worcestershire; UK. Q. J. Eng. Geol. Hydrogeol. 2005, 38, 285–300. [Google Scholar] [CrossRef]
  6. Tofani, V.; Segoni, S.; Agostini, A.; Catani, F.; Casagli, N. Technical Note: Use of remote sensing for landslide studies in Europe. Nat. Hazards Earth Syst. Sci. 2013, 13, 299–309. [Google Scholar] [CrossRef]
  7. Siyahghalati, S.; Saraf, A.K.; Pradhan, B.; Jebur, M.N.; Tehrany, M.S. Rule-based semi-automated approach for the detection of landslides induced by 18 September 2011 Sikkim; Himalaya; earthquake using IRS LISS3 satellite images, Geomatics. Nat. Hazards Risk 2016, 7, 326–344. [Google Scholar] [CrossRef] [Green Version]
  8. Lacroix, P.; Zavala, B.; Berthier, E.; Audin, L. Supervised Method of Landslide Inventory Using Panchromatic SPOT5 Images and Application to the Earthquake-Triggered Landslides of Pisco (Peru; 2007; Mw8.0). Remote Sens. 2013, 5, 2590–2616. [Google Scholar] [CrossRef] [Green Version]
  9. Roessner, S.; Wetzel, H.-U.; Kaufmann, H.; Sarnagoev, A. Potential of satellite remote sensing and GIS for landslide hazard assessment in Southern Kyrgyzstan (Central Asia). Nat. Hazards 2005, 35, 395–416. [Google Scholar] [CrossRef]
  10. Guzzetti, F.; Mondini, A.; Cardinali, M.; Fiorucci, F.; Santangelo, M.; Kang-Tsung, C. Landslide inventory maps: New tools for an old problem. Earth-Sci. Rev. 2012, 112, 42–66. [Google Scholar] [CrossRef] [Green Version]
  11. Joyce, K.E.; Belliss, S.E.; Samsonov, S.V.; McNeill, S.J.; Glassey, P.J. A review of the status of satellite remote sensing and image processing techniques for mapping natural hazards and disasters. Progress in Physical Geography 2009, 33, 183–207. [Google Scholar] [CrossRef] [Green Version]
  12. Hungr, O.; Leroueil, S.; Picarelli, L. The Varnes classification of landslide types; an update. Landslide 2014, 11, 167–194. [Google Scholar] [CrossRef]
  13. Barlow, J.; Fran, J.S.; Martin, Y. High Spatial Resolution Satellite Imagery; DEM Derivatives; and Image Segmentation for the Detection of Mass Wasting Processes. Photogramm. Eng. Remote Sens. 2006, 72, 687–692. [Google Scholar] [CrossRef] [Green Version]
  14. Blaschke, T.; Feizizadeh, B.; Hoelbling, D. Object-Based Image Analysis and Digital Terrain Analysis for Locating Landslides in the Urmia Lake Basin; Iran. IEEE J. Sel. Top. Appl. Earth Obs. Remote Sens. 2014, 7. [Google Scholar] [CrossRef]
  15. Domakinis, C.; Oikonomidis, D.; Astaras, T. Landslide mapping in the coastal area between the Strymonic Gulf and Kavala (Macedonia; Greece) with the aid of remote sensing and geographical information systems. Int. J. Remote Sens. 2008, 29, 6893–6915. [Google Scholar] [CrossRef]
  16. Fauzi, M.F.A.; Wibowo, A.D.A.; Lim, S.L.; Tan, W.N. On the Detection of Possible Landslides in Post-Event Satellite Images: A Probability Map Approach. Int. J. Mach. Learn. Comput. 2015, 5. [Google Scholar] [CrossRef] [Green Version]
  17. Hussain, M.; Chen, D.; Cheng, A.; Wei, H.; Stanley, D. Change detection from remotely sensed images: From pixel-based to object-based approaches. ISPRS J. Photogramm. Remote Sens. 2013, 80, 91–106. [Google Scholar] [CrossRef]
  18. Keyport, R.N. A Comparison of Pixel-based versus object oriented analysis of landslides using historical remote sensing data. Master’s Thesis, Michigan Technological University, Houghton, MI, USA, 2013. [Google Scholar]
  19. Borghuis, A.M.; Chang, K.; Lee, H.Y. Comparison between automated and manual mapping of typhoon-triggered landslides from SPOT-5 imagery. Int. J. Remote Sens. 2007, 28, 1843–1856. [Google Scholar] [CrossRef]
  20. Liu, J.-K.; Hsiao, K.-H.; Shih, P.T.-Y. A Geomorphological Model for Landslide Detection. J. Mar. Sci. Technol. 2012, 20, 629–638. [Google Scholar]
  21. Eisank, C.; Hoelbling, D.; Friedl, B.; Chen, Y.-C.; Chang, K.-T. Expert knowledge for object-based landslide mapping in Taiwan. South-East. Eur. J. Earth Obs. Geomat. 2014, 3, 37. [Google Scholar]
  22. Wu, Z.; Hu, Z.; Fan, Q. Super-pixel-Based Unsupervised Change Detection using Multi-Dimensional Change Vector Analysis and SVM-Based Classification. ISPRS Annals of the Photogrammetry. Remote Sens. Spat. Inf. Sci. 2012, 1–7. [Google Scholar] [CrossRef] [Green Version]
  23. Mittelmeertief. Available online: https://de.wikipedia.org/wiki/Mittelmeertief (accessed on 3 June 2021).
  24. Alpenhochwasser 2005. Available online: https://de.wikipedia.org/wiki/Alpenhochwasser_2005 (accessed on 3 June 2021).
  25. Hochwasser 2005. Die Katastrophenereignisse in Tirol und Vorarlberg. Available online: http://www.naturgefahren.at/karten/chronik/Katastrophen_oestr/HW2005.html (accessed on 18 December 2019).
  26. Tilch, N. Identifizierung gravitativer Massenbewegungen mittels mittels multitemporaler Luftbildauswertung in Vorarlberg und angrenzender Gebiete. Jahrb. Geol. Bundesanst. 2014, 154, 21–39. [Google Scholar]
  27. Highland, L.M.; Bobrowsky, P. The Landslide Handbook—A Guide to Understanding Landslides; Geological Survey Circular: Reston, VA, USA, 2008; Volume 1325, p. 129. [Google Scholar]
  28. Fletcher, K. Sentinel-2: ESA’s Optical High-Resolution Mission for GMES Operational Services; (ESA SP-1322/2 March 2012); Contactivity BV: Leiden, The Netherlands, 2012; ISBN 978-92-9221-419-7. [Google Scholar]
  29. On Demand Surface Radiance TIR—Land Processes Distributed Active Archive Center 2014. Available online: https://lpdaac.usgs.gov/products/ast_09xtv003/ (accessed on 28 October 2019).
  30. Hulley, C.; Hook, S. A new methodology for cloud detection and classification with ASTER data. Geophys. Res. Lett. 2008, 35. [Google Scholar] [CrossRef]
  31. Yarbrough, L.D.; Easson, G.; Kuszmaul, J.S. Using At-Sensor Radiance and Reflectance Tasseled Cap Transforms Applied to Change Detection for the ASTER Sensor. In Proceedings of the Third International Workshop on the Analysis of Multi-temporal Remote Sensing Images: Multi Temp 2005, 16–18 May 2005, Beau Rivage Resort and Casino, Biloxi, Mississippi USA; King, R.L., Younan, N.H., Eds.; Beau Rivage Resort and Casino: Biloxi, MI, USA, 2005. [Google Scholar]
  32. Sibandze, P.; Mhangara, P.; Odindi, J.; Kganyago, M. A comparison of Normalised Difference Snow Index (NDSI) and Normalised Difference Principal Component Snow Index (NDPCSI) techniques in distinguishing snow from related land cover types. S. Afr. J. Geomat. 2014, 3. [Google Scholar] [CrossRef] [Green Version]
  33. Crist, E.P.; Kauth, R.J. The Tasseled Cap De-Mystified. Photogramm. Eng. Remote Sens. 1986, 52, 81–86. [Google Scholar]
  34. Huang, C.; Wylie, B.; Yang, L.; Homer, C.; Zylstra, G. Derivation of a Tasseled cap transformation based on LANDSAT 7 at-satellite reflectance. Int. J. Remote Sens. 2002, 23, 1741–1748. [Google Scholar] [CrossRef]
  35. Geofabrik GmbH Karlsruhe; OpenStreetMap data for Austria 2016. Available online: https://download.geofabrik.de/europe/austria.html (accessed on 28 October 2019).
  36. Mather, P.; Tso, B. Classification Methods for Remotely Sensed Data, 2nd ed.; CRC Press: Boca Raton, FL, USA, 2009; ISBN 9781420090727. [Google Scholar]
  37. Landis, J.R.; Koch, G.G. The measurement of observer agreement for categorical data. Biometrics 1977, 33, 159–174. [Google Scholar] [CrossRef] [PubMed] [Green Version]
  38. Hölbling, D.; Eisank, C.; Albrecht, F.; Vecchiotti, F.; Friedl, B.; Weinke, E.; Kociu, A. Comparing Manual and Semi-Automated Landslide Mapping Based on Optical Satellite Images from Different Sensors. Geosciences 2007, 7, 37. [Google Scholar] [CrossRef] [Green Version]
  39. Vecchiotti, F.; Tilch, N.; Haberler, A. The use of SPOT5 (Take 5) for Landslide Detection in Preparation for the Arrival of SENTINEL-2 Satellite. In Proceedings of the ESA Living Planet Symposium, Prague, Czech Republic, 9–13 May 2016. [Google Scholar]
  40. Markart, G.; Perzl, F.; Kohl, B.; Luzian, R.; Kleemayr, K. Schadereignisse 22./23. August 2005-Ereignisdokumentation und analyse von ausgewählten Gemeinden des Bezirkes Bregenz (Vorarlberg); Institut für Naturgefahren und Waldgrenzregionen Bundesforschungs- und Ausbildungszentrum für Wald, Naturgefahren und Landschaft: Wien, Austria, 2005. [Google Scholar]
  41. Schwarz, L.; Tilch, N.; Kociu, A. Landslide susceptibility mapping by means of artificial neural networks performed for the region Gasen-Haslau (eastern Styria, Austria). In Proceedings of the 6th EUREGEO—European Congress on Regional Geoscientific Cartography and Information Systems, Munich, Germany, 9–12 June 2009; Bayerisches Landesamt für Umwelt (Hg.): München, Germany, 2009; Volume 1, pp. 470–473. [Google Scholar]
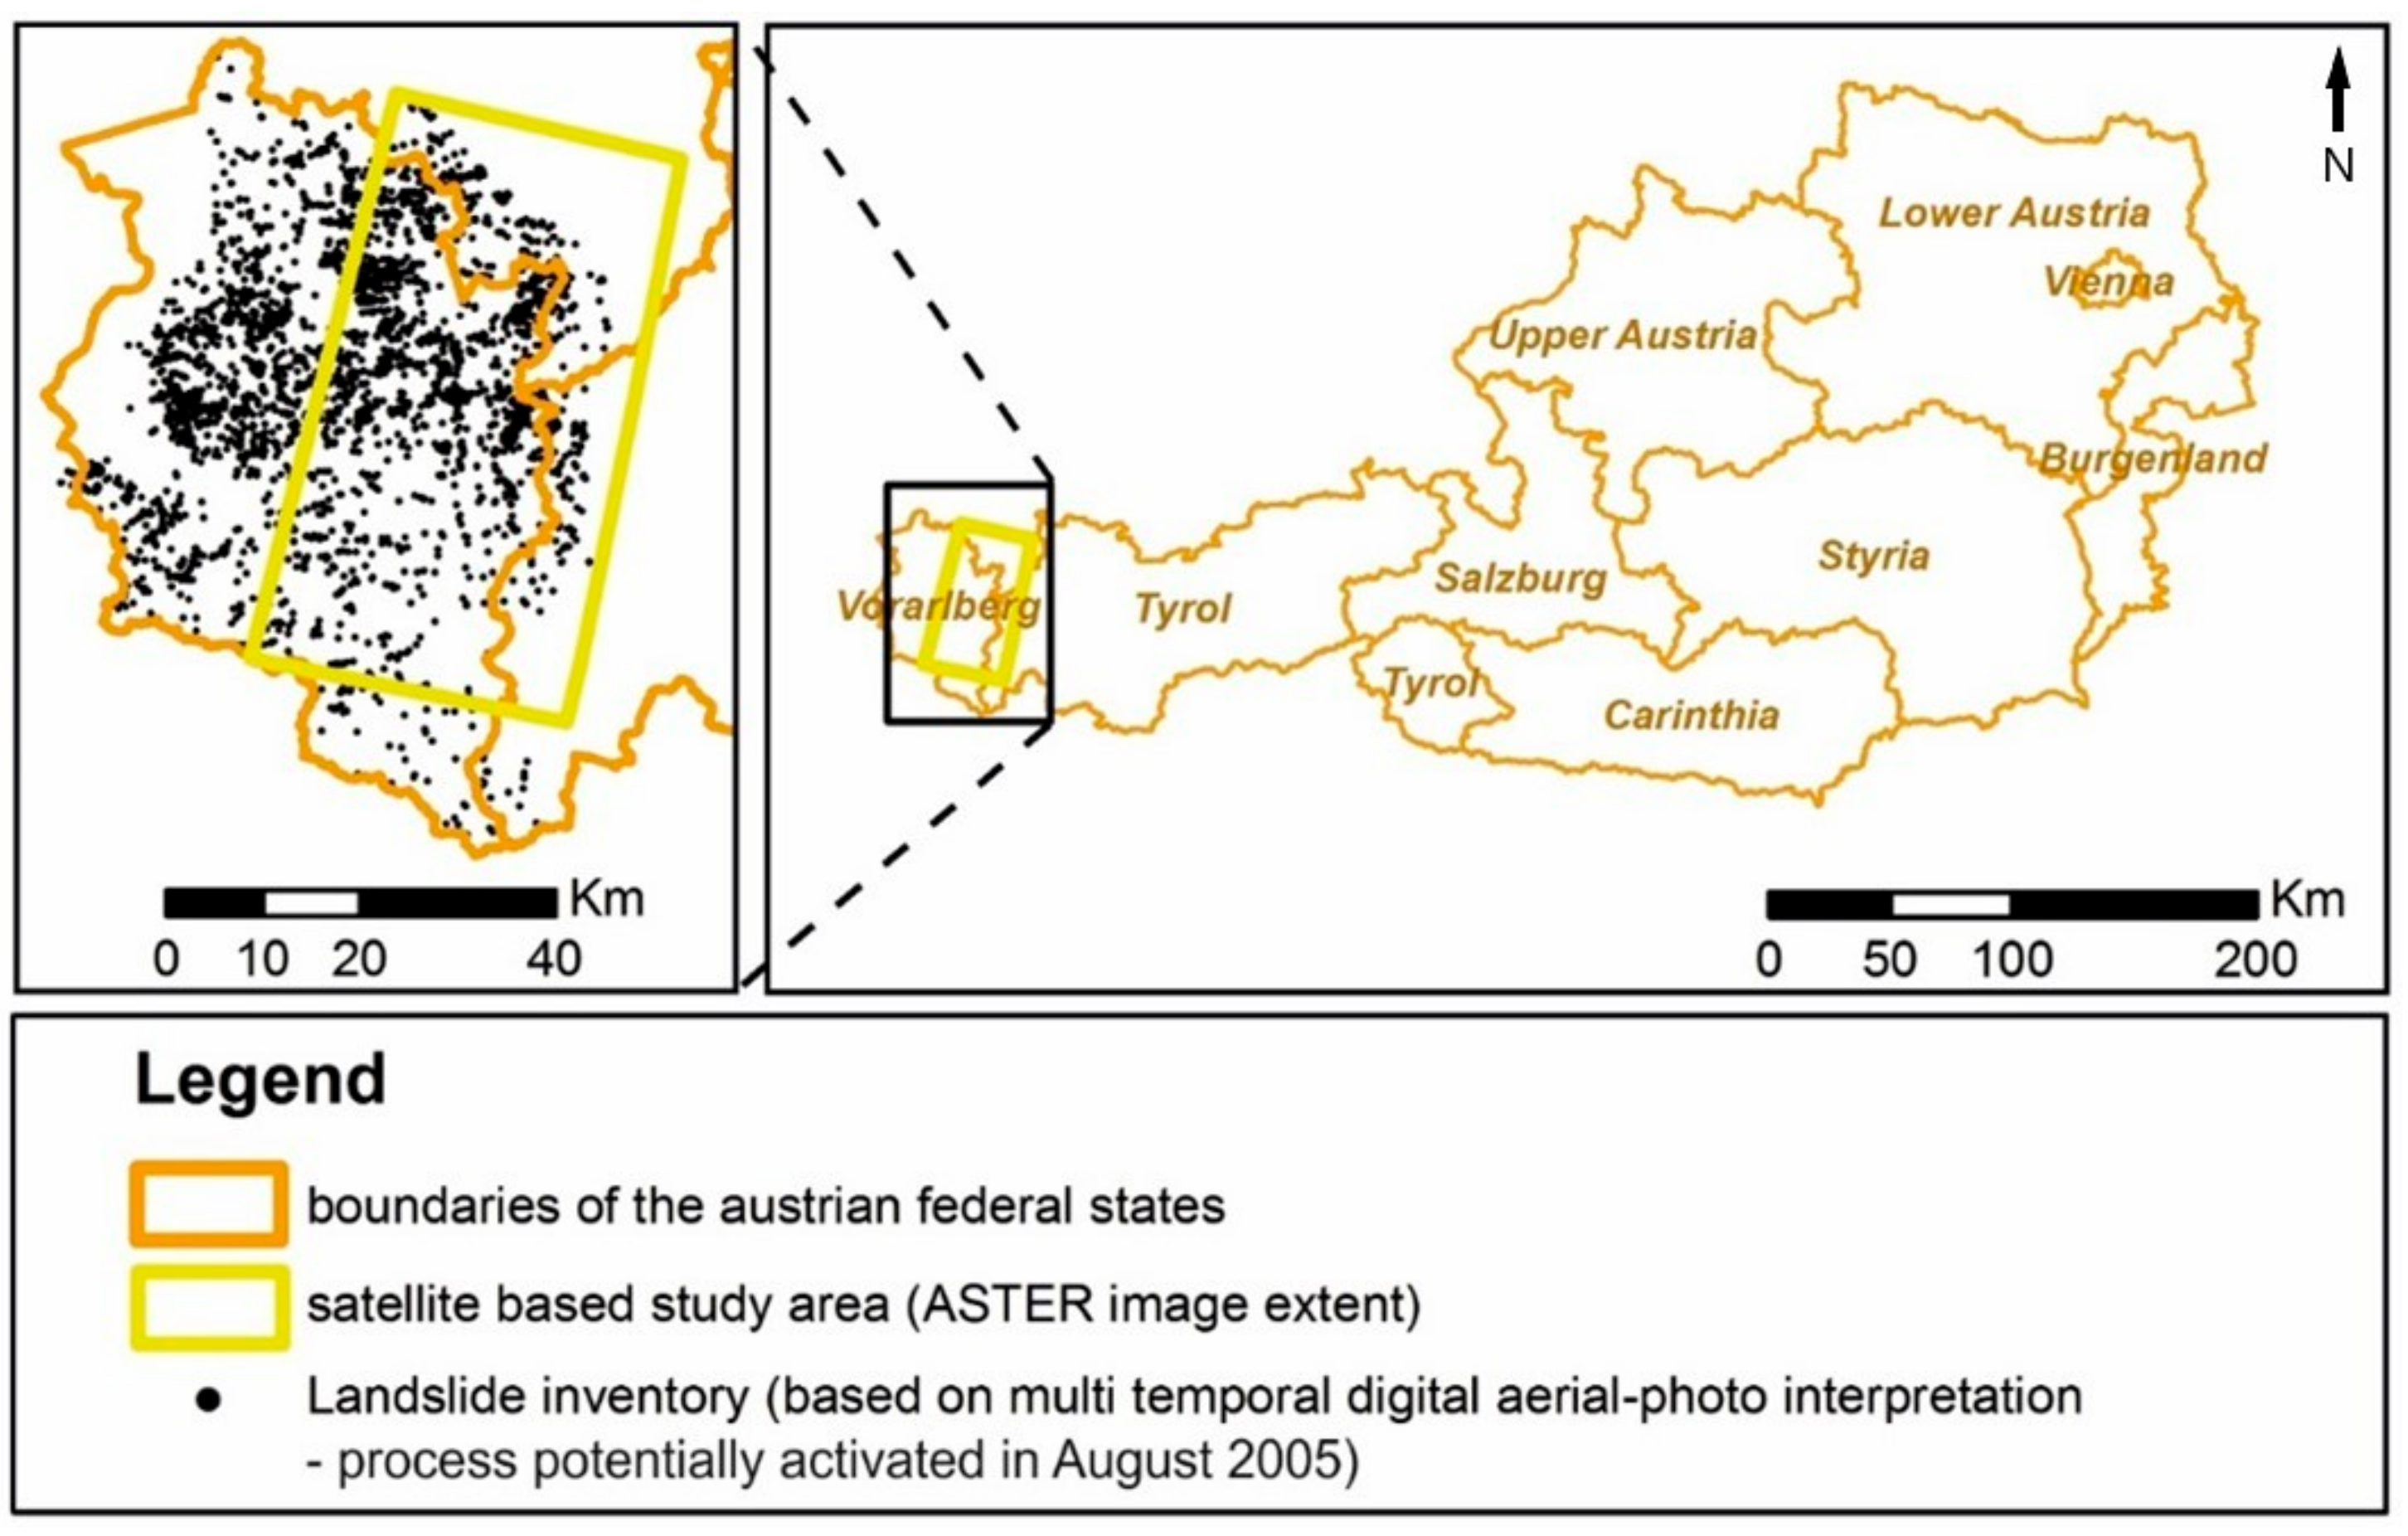
Figure 1. Study area covered by the satellite images overlaid to the landslide inventory of processes potentially activated in August 2005 (vector boundaries of Austrian Federal States© BEV).
Geosciences 11 00258 g001
Figure 2. Correlation of elevation-geomorphology, vegetation-land cover map and lithology with the landslide inventory used for the validation of the remote sensing method.
Geosciences 11 00258 g002
Figure 3. Close-up view of the area of Warth-Teschenberg on the river Lech where two types of landslides (highlighted with purple polygons) were activated in different times (before 2001: white circles and in 2005: yellow circles) (aerial-photos© VoGIS).
Geosciences 11 00258 g003
Figure 4. Close-up view of the area around the village Au (landslides highlighted with purple polygons) with the missing gap of the northern area in the aerial-photo of 2005. In the northern part of the aerial photo of 2006 a large landslide scar is visible (aerial-photos© VoGIS).
Geosciences 11 00258 g004
Figure 5. Close-up view of the destructive large Danöfen earth flow (a) and of a group of six small landslides (highlighted with purple polygons) in the area of Hintereggalpe (b) almost simultaneously activated in August 2005 (aerial-photos© VoGIS).
Geosciences 11 00258 g005
Figure 6. Main characteristics of Terra-ASTER, SPOT and Sentinel-2, and the spectral resolution and the band settings of their multispectral instruments (modified after Fletcher, [29]).
Geosciences 11 00258 g006
Figure 7. Methodology workflow for the proposed approach subdivided in (1) Image pre-processing; (2) Image processing; and (3) Image post-processing. (DTM hill shading ©VoGIS).
Geosciences 11 00258 g007
Figure 8. Confusion matrix made of TP (true positives), TN (true negatives), FN (false negatives) and FP (false positives).
Geosciences 11 00258 g008
Figure 9. The nested approach showing the subdivision of the four study areas in overlapping zones for methods assessment.
Geosciences 11 00258 g009
Figure 10. Regional landslide detection map applied to the Region of Voralberg.
Geosciences 11 00258 g010
Figure 11. Classification performance for the class landslide identified by means of the satellite analysis. The area extension of the eight datasets, represented by different colors, is shown in Figure 9.
Geosciences 11 00258 g011
Figure 12. Classification performance for the class landslides (river process excluded) identified by means of the satellite analysis. The area extension of the eight datasets, represented by different colours, is shown in Figure 9.
Geosciences 11 00258 g012
Figure 13. Percentage of validation against classification accuracy. The area extension of the six datasets, represented by different colors, is shown in Figure 7.
Geosciences 11 00258 g013
Figure 14. Number of validated landslides against number of existing inventory landslides. The area extension of the six datasets, represented by different colors, is shown in Figure 7.
Geosciences 11 00258 g014
Figure 15. Landslide classification results in the area around the village Au within the central study area (purple areas E and F) (as seen in Figure 9) overlaid to the aerial-photo 2005 (a), 2006 (b) and 09.2004–09.2005 (c) (Aerial-photos© VoGIS).
Geosciences 11 00258 g015
Figure 16. Field photos around the village of Au taken in august 2005 (a) and in field work 2006 (b).
Geosciences 11 00258 g016
Figure 17. Landslide classification results in the area of Warth-Teschenberg on the river Lech (as seen in Figure 2).
Geosciences 11 00258 g017
Figure 18. Landslide classification results in the area of Hintereggalpe (as seen in Figure 4b).
Geosciences 11 00258 g018
Figure 19. Landslide classification results of the Danöfen earth flow (as seen in Figure 4a) (Aerial-photos© VoGIS).
Geosciences 11 00258 g019
Figure 20. Details of the damages caused by the Danöfen earth flow (a); overview of the area affected by the landslide (b).
Geosciences 11 00258 g020
Table 1. Tasseled cap coefficients for TERRA-ASTER at-satellite reflectance with the spectral interval reported in brackets (in µm) for each band.
AxisB1
(0.52–0.60)
B2
(0.63–0.69)
B3
(0.76–0.86)
B4
(1.60–1.70)
B5
(2.145–2.185)
B6
(2.185–2.225)
B7
(2.235–2.285)
B8
(2.295–2.365)
B9
(2.36–2.43)
Brightness−0.2740.6760.303−0.256−0.020.415−0.2550.073−0.262
Greenness−0.006−0.6480.5640.061−0.0550.3944−0.1930.021−0.249
Wetness0.166−0.087−0.7030.1870.040.5−0.2870.03−0.318
Table 2. Composition of different change composites used for classification purposes.
Image CompositesBrightness ChangeGreenness Change/NDVIWetness Change
1Brightness1–Brightness2Greenees1–Greeneess2Wetneess1–Wetneess2
2Brightness1–Brightness2NDVI1–NDVI2Wetneess1–Wetneess2
Table 3. new classes re-coding for the classification result.
Change DetectedCode
No Change0
Fluvial–torrent process1
Fluvial–river process2
Vegetation change3
Anthropogenic change4
Erosion (unspecific process)5
Landslides10
Table 4. ASTER validation assessment.
SAT_VAL—Satellite Validation
CodeClass
0No change detected
100Landslide
200Torrent process
300Vegetation change
400Anthropogenic change
500Erosion (unspecific process)
600Shadows
700Clouds
Table 5. ASTER position assessment.
SAT_POS—Satellite Position and Accuracy
CodeClass
100extremely good (completed mapped with scar --> polygon)
200very good (almost complete, good position, with scar --> point)
300good (almost complete, good position, without scar)
400partial (good position)
500not representative, no good position
600uncertain
Publisher’s Note: MDPI stays neutral with regard to jurisdictional claims in published maps and institutional affiliations.