Simple Summary
Donkey milk is a highly nutritious food with recognized health benefits; however, its production is limited due to the low daily milk yield of donkeys. In this study, we investigated whether dietary supplementation with different doses of selenium (Se) could improve both the quantity and quality of milk in lactating donkeys. We found that the addition of 0.3 mg Se/kg DM significantly increased milk production and improved nutritional quality by elevating the content of beneficial fatty acids. This dosage also promoted the growth of beneficial gut bacteria and improved nutrient digestibility. In contrast, higher Se doses did not improve milk yield and may potentially suppress it, with an increase in the polyunsaturated to saturated fatty acid (P/S) ratio and a reduction in the atherogenicity and thrombogenicity indices. These findings provide practical guidance for the safe use of Se in donkey feeding strategies, facilitating more sustainable dairy production and yielding healthier milk for consumers.
Abstract
This study evaluated the effects of dietary selenium (Se) supplementation on lactation performance, milk fatty acid composition, and rectal microbiota and short-chain fatty acids in lactating Dezhou donkeys to determine the optimal dose. Twenty-four lactating Dezhou donkeys (estimated milk yield: 3.60 ± 0.84 kg/d; days in milk: 39.93 ± 7.02 d; body weight: 247.24 ± 26.27 kg; parity: 2.82 ± 0.48) were randomly divided into four groups (n = 6): CON (0 mg Se/kg DM), Se1 (0.15 mg Se/kg DM), Se2 (0.3 mg Se/kg DM), and Se3 (0.5 mg Se/kg DM), and were supplemented with Se yeast in the basal diet. The results showed that plasma Se concentrations increased dose-dependently. The Se2 group significantly increased milk yield, milk component yield, milk protein production efficiency, milk production efficiency, the digestibility of acid detergent fiber and neutral detergent fiber, protein biological value, and nitrogen metabolic rate, as well as the proportions of C18:1c9, C18:2c6, unsaturated fatty acids, monounsaturated fatty acids, polyunsaturated fatty acids, n-3 long-chain polyunsaturated fatty acids, the ratio of unsaturated to saturated fatty acids, the ratio of polyunsaturated to saturated fatty acids (P/S), desirable fatty acids, and (C18:0 + C18:1)/C16:0 in donkey milk, while decreasing the proportion of saturated fatty acids, atherogenicity index, and thrombogenic index. The Se2 group also increased acetate and butyrate in rectal feces, and promoted the growth of beneficial bacteria, including Christensenellaceae R-7 group, Lachnospiraceae XPB1014, and norank_f_Erysipelotrichaceae. In summary, the effects of Se supplementation were dose-dependent: 0.3 mg Se/kg DM improved milk performance and optimized milk fatty acid profiles by improving nutrient digestion and metabolism and modulating rectal bacteria structure, whereas 0.5 mg Se/kg DM showed no lactation benefits (with potential inhibitory effects) despite improving the P/S ratio and reducing the atherogenicity and thrombogenic indices.
1. Introduction
With continuous improvements in living standards and health awareness, consumer demand for high-quality, healthy food is growing. Donkey milk has attracted increasing attention as a functional food with potential benefits for human health [1]. Characterized by its low fat content and high levels of n-3 polyunsaturated fatty acids (n-3 PUFA) [2], donkey milk may be particularly suitable for individuals with cardiovascular diseases. Owing to its palatability and low levels of caseins and other allergenic proteins, it is also a suitable nutritional source for children with a cow’s milk protein allergy [3,4]. Furthermore, extensive research confirms that donkey milk possesses diverse bioactive properties, including antimicrobial [5], anticancer [6], antioxidant [7], immunomodulatory [8], and hypoallergenic activities [9]. These functional attributes underscore its potential in health promotion and disease prevention [10,11]. However, donkeys have a low milk yield, producing only about 3 kg per day [1]. Therefore, improving milk yield and optimizing the FA composition of donkey milk are of great significance.
Selenium (Se) is an essential trace element that exerts diverse, dose-dependent physiological functions, including the improvement of lactation performance, antioxidant capacity, immunity, growth, and meat quality [12,13,14]. To date, limited research has been conducted on the effects of dietary Se supplementation on lactation performance. A study by Sun et al. [15] on dairy cows showed that increasing Se supplementation induced quadratic improvements in the yield of raw milk, protein, and lactose. Se supplementation in feed typically uses additives like sodium selenite, sodium selenate, and selenium yeast. Compared to inorganic forms (e.g., sodium selenite and sodium selenate), organic selenium (such as selenomethionine and selenium yeast) exhibits higher absorption and utilization efficiencies [16]. Tong et al. [14] demonstrated that dietary Se supplementation not only effectively elevates Se levels in milk and blood but also improves lactation performance, antioxidant capacity, and immune function in lactating donkeys. Sun et al. [17] revealed that dietary supplementation with 5 mg Se/kg DM significantly reduced milk somatic cell count (SCC). Furthermore, serum Se concentrations increased dose-dependently with elevated dietary Se levels. These findings indicate that supplementation with an appropriate Se dose could effectively improve udder health and Se status in donkeys. Nevertheless, relevant research remains limited, and the underlying mechanisms are not yet fully understood.
The gut microbiota is integral to the nutritional physiology of monogastric animals, primarily owing to its direct functional association with dietary utilization [18]. Furthermore, these microbial communities play a determinant role in optimizing livestock production efficiency through their metabolic interactions with the host’s digestive system [19]. Donkeys are monogastric herbivores that rely on hindgut fermentation. The enlarged hindgut, primarily composed of the cecum and colon, enables them to extract energy and nutrients from fibrous feeds through microbial fermentation [20]. Considering the challenges of directly accessing these intestinal regions for content collection and the fact that fecal samples can represent the gut microbiota [21], we utilized fecal samples to assess the influence of Se on the gut microbiota of lactating donkeys, given that fecal samples harbor the majority of cecal microbiota and mirror the bacterial composition in the cecum [22,23]. Although the composition and function of the gut microbiota are known to affect nutrient digestibility and lactation outcomes in donkeys [24,25], the impact of dietary Se on these microbial communities in lactating jennies remains poorly understood. While studies in ruminants such as sika deer have shown that Se modulates bacterial abundance and enhances fiber degradation [26,27], comparable research in donkeys is limited. Therefore, this study aimed to investigate the effects of dietary Se supplementation on lactation performance, milk FA profiles, and rectal microbiota in lactating donkeys, and to determine the optimal Se dose, providing valuable insights for the strategic management of lactating donkey production.
2. Materials and Methods
The experiment was conducted in Inner Mongolia Grassland Yulv Science and Technology Animal Husbandry Co., Ltd. (Hohhot, China). The Animal Ethics and Welfare Committee approved the experimental procedures at the Inner Mongolia Agricultural University (NND2021050), which were under the university’s guidelines for animal research.
2.1. Animals, Diets, and Experiment Design
In a single factor completely randomized experimental design, twenty-four healthy lactating Dezhou donkeys (estimated milk yield: 3.60 ± 0.84 kg/d; days in milk: 39.93 ± 7.02 d; body weight: 247.24 ± 26.27 kg; parity: 2.82 ± 0.48) were randomly assigned to four groups (n = 6): a control (CON) group fed a basal diet, and three treatment groups (Se1, Se2, Se3) supplemented with selenium yeast to provide 0.15, 0.3, and 0.5 mg Se/kg DM, respectively. The basal diet (concentrate-to-forage ratio 30:70; Table 1), prepared as a single batch with a background Se level of 0.04 mg/kg DM, was used throughout the experiment. The selenium yeast product (SelenoSource AFTM2000, Diamond V Biological Fermentation Engineering & Technologies Shenzhen Co., Ltd., Shenzhen, China) contained 0.2% (2000 mg/kg) total Se, of which ≥98% was organic Se primarily in the form of selenomethionine. The experiment lasted 10 weeks, comprising a 2-week adaptation period and an 8-week experimental period for data and sample collection.

Table 1.
Composition and nutrient levels of basal diet (air-dry basis).
To ensure precise measurement of individual feed intake and avoid interference from social behaviors on the experimental results, the donkeys were housed in individual pens. These pens allowed for visual, auditory, and olfactory contact to meet animals’ social needs. The donkeys were kept in individual stalls (1.6 m × 2.0 m) and fed a diet of concentrate, corn silage, and alfalfa twice daily (at 07:00 and 14:00). Millet straw was offered five times daily, and water was available ad libitum. Daily feed allowances were adjusted based on the previous day’s intake to maintain a refusal rate of 5~10%. Any unconsumed feed was collected before morning feeding, and the concentrate-to-forage ratio was strictly maintained throughout the experiment.
2.2. Milk Sampling and Analysis
Milk yield was recorded daily over seven consecutive days at each biweekly sampling point (weeks 2, 4, 6, and 8). Donkeys were separated from their foals for two 3 h periods daily (07:00–10:00 and 14:00–17:00) to allow for milk accumulation. Milking was performed at 10:00 and 17:00 each day using an individual vacuum pump (JuduH5402, Judu Technology, Xingtai, China) operating at a vacuum level of 50 kPa, a pulse frequency of 60 cycles per minute, and a pulsation ratio of 60:40 (suction phase to relief phase). The milk yield (MY, kg/day) from both sessions was measured using a lactometer integrated into the milking equipment and summed to obtain the total yield over the 6 h separation period. The estimated milk yield (EMY, kg/day) was then calculated as follows: EMY (kg/day) = MY (total milk yield over 6 h) (kg/day)/6 (h) × 24 (h) [28,29]. Daily weighing of the feed provided and refused was conducted to determine the dry matter intake (DMI) for each donkey. Milk production efficiency was calculated as described below. Additionally, during the final three days of each biweekly period, morning and afternoon milk samples were composited in a 1:1 ratio. One aliquot was treated with a preservative (D & F Control Systems Inc., Beverly, MA, USA) and underwent immediate compositional analysis for protein, fat, lactose, solids-not-fat (SNF), and total solids (TS) using a MilkoScan FT+ infrared analyzer (Foss Analytical, Hillerød, Denmark), while SCC was quantified using a Foss-somatic FC counter. Both instruments were calibrated specifically for donkey milk using reference samples with known compositions determined by standard chemical methods. The remaining aliquot was stored at −20 °C for fatty acid (FA) profiling. The following calculations were applied: solids-corrected milk (SCM, kg/day) = {(12.3 × milk fat (%) content of nonstandard milk + 6.56 × SNF (%) content of nonstandard milk − 0.0752)} × EMY (kg/day) [30]. Milk production efficiency = SCM (kg/day)/DMI (kg/day) × 100. Milk protein synthesis efficiency = {EMY (kg/day) × milk protein (%)}/{DMI (kg/day) × dietary crude protein (CP) content (%)} [31].
FA methyl esters (FAMEs) were produced from 1 g samples of freeze-dried donkey milk powder according to the methodology of O’Fallon et al. [32]. FA concentrations were determined using a gas chromatograph (Agilent 7890B, Agilent Technologies, Santa Clara, CA, USA) equipped with an SP-2560 capillary column (Supelco; 100 m × 0.25 mm, 0.2 μm film thickness). The injector temperature was set at 248 °C. The oven temperature program was as follows: initiate temperature of 120 °C held for 5 min; increased to 170 °C at 3 °C/min and held for 10 min; further increased to 220 °C at 3 °C/min and held for 5 min; finally increased to 240 °C at 1 °C/min and held for 10 min. Nitrogen was used as the carrier gas at a constant flow rate of 3 mL/min with a split ratio of 9:1. The FAs were identified by comparing the retention times of sample peaks with those of a known FAME standard mixture (CRM47885, Sigma-Aldrich, St. Louis, MO, USA). Quantification was performed using the external standard method, with calibration curves established for each FA; all curves demonstrated excellent linearity.
The contents of 37 individual FAs were determined. Based on these, the following parameters were calculated: saturated fatty acid (SFA), unsaturated fatty acid (UFA), monounsaturated fatty acid (MUFA), polyunsaturated fatty acid (PUFA), n-6 PUFA, n-3 PUFA, n-6 long-chain polyunsaturated fatty acids (n-6 LCPUFA), n-3 long-chain polyunsaturated fatty acids (n-3 LCPUFA), along with the ratios of n-6 PUFA/n-3 PUFA (n-6/n-3), UFA/SFA (U/S), and PUFA/SFA (P/S). Also calculated were the values for desirable fatty acid (DFA), atherogenicity index (AI), and thrombogenic index (TI). SFA in the milk included C4:0, C6:0, C8:0, C10:0, C11:0, C12:0, C13:0, C14:0, C15:0, C16:0, C17:0, C18:0, C20:0, C21:0, C22:0, C23:0, and C24:0. MUFA included C14:1, C15:1, C16:1, C17:1, C18:1t9, C18:1c9, C20:1, C22:1, and C24:1. n-6 PUFA included C18:2t6, C18:2c6, C18:3n6, C20:2n6, C20:3n6, C20:4n6, and C22:2n6. n-6 LCPUFA included C20:2n6, C20:3n6, C20:4n6, and C22:2n6. n-3 PUFA included C18:3n3, C20:3n3, C20:5n3, and C22:6n3. n-3 LCPUFA included C20:3n3, C20:5n3, and C22:6n3. The following formulas were applied: PUFA = n-3 PUFA + n-6 PUFA; DFA = C18:0 + UFA [33]; AI = (C12:0 + 4 × C14:0 + C16:0)/UFA [34]; TI = (C14:0 + C16:0 + C18:0)/[0.5 × MUFA) + 0.5 × n-6 PUFA + 3 × n-3 PUFA + (n-3 PUFA/n-6 PUFA)] [34]; and (C18:0 + C18:1)/C16:0 [33].
2.3. Apparent Nutrient Digestion and Metabolism
Before the experiment commenced, dietary samples were collected, oven-dried at 65 °C, homogenized by crushing, sieved, and stored in a dark, well-ventilated, and low-humidity environment for subsequent nutrient composition analysis. During the eighth week of the experiment, a daily sample of 200 g of rectal feces was collected from each donkey over six consecutive days. Fecal samples from individual donkeys were homogenized and split. One aliquot was treated with 10% H2SO4 (v/v) to minimize nitrogen (N) volatilization and subsequently stored at −20 °C pending N analysis. The remaining aliquot was oven-dried at 65 °C for the determination of dry matter (DM; method 930.15), CP (method 984.13), ether extract (EE; method 920.39), and acid-insoluble ash (AIA; method 975.12) based on AOAC International methods [35]. Neutral detergent fiber (NDF) and acid detergent fiber (ADF) were determined using an Ankom 220 Fiber Analyzer (Ankom Technology, Macedon, NY, USA) following Van Soest et al. [36]. Apparent total-tract digestibility (ATTD) was calculated using the AIA method as described by Ren et al. [37], with the following formula:
where A = nutrient content in the diet (%), A1 = the same nutrient content in feces (%), B = dietary AIA content (%), and B1 = fecal AIA content (%).
ATTD (%) = 100 − [(A1 × B)/(A × B1)] × 100.
A metabolic trial was conducted during the final six days of the experimental period, following the methods outlined by Liang et al. [29]. For urine collection, donkeys were temporarily placed in a metabolic cage each morning and afternoon. During each placement, a clean plastic bucket covered with gauze was positioned on the ground for urine collection. A minimum volume of 200 mL was obtained per collection. Samples were then transferred to specimen containers (Corning Costar, Corning Incorporated, Corning, NY, USA). One aliquot remained untreated for creatinine and gross energy (GE) quantification, while the other was acidified with 10 N sulfuric acid to fix nitrogen prior to urinary nitrogen analysis [38]. All samples were stored at −20 °C.
GE in the diet, feces, and urine was determined using an oxygen bomb calorimeter (Parr 6400 Automatic Analyzer, Parr Instrument Company, Moline, IL, USA) following Jha et al. [39]. Energy digestibility and metabolizability were computed using the following formulas: Energy metabolizability = {diet GE (MJ/kg) × DMI (kg) − fecal GE (MJ/kg) × fecal output (kg) − urine GE (MJ/kg) × urine output (kg)}/{diet GE (MJ/kg) × DMI (kg)};
Where fecal output (kg) = DMI (kg) × (AIA % in feed/AIA % in feces), urine output (kg) was calculated using a creatinine-based method [29]: urine output = body weight (kg) × 24.05/urinary creatinine/113; N metabolizability = protein biological value (BV) × N digestibility; BV = {N intake (kg/day) − feces N (kg/day) − urine N (kg/day)}/{N intake (kg/day) − feces N (kg/day)} × 100%.
2.4. Blood Sampling and Analysis
Blood samples were collected via jugular venipuncture into sodium heparin tubes (Corning, NY, USA) before the morning feeding (07:00) on two consecutive days during week 8. After centrifugation at 2500× g for 15 min, the plasma was separated and stored at −20 °C. The FA content in the plasma was determined using an Agilent 7890B gas chromatograph (Agilent Technologies, Wilmington, DE, USA) equipped with an SP-2560 capillary column (Supelco; 100 m × 0.25 mm, 0.2 μm film thickness), following the method described by Wang et al. [32]. The chromatographic parameters were consistent with those used for donkey milk analysis. The Se concentration in the plasma samples was determined according to the National Food Safety Standard of China (GB5009.268-2016 [40]) with modifications. Briefly, 1 mL of plasma was digested with 20–30 mL of a nitric acid:perchloric acid mixture (2:1, v/v) for 1 h or overnight. Subsequently, the samples were heated at 300 °C on an electric hot plate until the solution became clear or light yellow. After cooling, the digest was diluted to a predetermined volume with deionized water. The Se concentration was then measured using inductively coupled plasma optical emission spectrometry (ICP-OES; ICAP 6300Duo, Thermo Fisher Scientific, Waltham, MA, USA).
2.5. Short-Chain Fatty Acids Analysis of the Feces
On the final day of the experiment, rectal feces samples were collected from lactating donkeys using sterile gloves (two collections per donkey). The samples were stored in DNase- and RNase-free tubes (Shanghai Jingke Chemical Technology Co., Ltd., Shanghai, China), immediately frozen in liquid nitrogen (−196 °C), and stored for subsequent analysis of short-chain fatty acids (SCFAs). The SCFAs analyzed included acetate, propionate, iso-butyrate, butyrate, isovalerate, and valerate. SCFAs were extracted from 1.5 g of fecal samples following the method described by Li et al. [25]. Analysis was performed using a Shimadzu 2014 gas chromatograph (Shimadzu Corporation, Kyoto, Japan) equipped with a DB-FFAP column (60 m × 0.25 mm × 0.5 μm). Nitrogen was used as the carrier gas. The oven, detector, and injector temperatures were set at 120 °C, 250 °C, and 220 °C, respectively. Quantification was achieved by comparison with known standards (Supelco Volatile Fatty Acid Standard Mix, Sigma-Aldrich, St. Louis, MO, USA).
2.6. Rectal Microbiome Analysis
Total microbial DNA was extracted from thawed fecal samples using the E.Z.N.A. Soil DNA Kit (Omega Bio-tek, Norcross, GA, USA) according to the manufacturer’s protocol. DNA quality was assessed by measuring purity and concentration with a NanoDrop2000 spectrophotometer (Thermo Fisher Scientific, Wilmington, DE, USA) and verifying integrity by 1% agarose gel electrophoresis. The V3–V4 hypervariable region of the bacterial 16S rRNA genes was amplified with primers 338F (5′-ACTCCTACGGGAGGCAGCAG-3′) and 806R (5′-GGACTACHVGGGTWTCTAAT-3′) in 20 μL PCR reactions. The reaction mixture contained 4 μL of 5× FastPfu Buffer, 2 μL of 2.5 mM dNTPs, 0.8 μL each primer (5 μM), 0.4 μL of FastPfu Polymerase, 0.2 μL of BSA, and 10 ng template DNA. Amplification was performed using an ABI GeneAmp 9700 thermocycler (Applied Biosystems, Foster City, CA, USA). Amplicons from triplicate PCRs per sample were pooled, electrophoresed on 2% agarose gels, and purified using a PCR Clean-Up Kit (YuHua, Taizhou, China). After quantification with a Qubit 4.0 Fluorometer (Thermo Fisher Scientific), the purified amplicons were subjected to paired-end sequencing (2 × 300 bp) on Illumina MiSeq PE300 platform (Majorbio, Shanghai, China) following standardized protocols.
After initial processing with fastp (version 0.19.6), paired-end reads were merged using FLASH (version 1.2.7) with stringent parameters: truncating reads at sites with average quality <20 (50 bp window), discarding reads <50 bp or with ambiguous bases, assembling overlaps >10 bp (max mismatch 0.2), and matching barcodes/primers with exact barcode and ≤2 primer mismatches. Processed sequences were clustered into OTU at 97% similarity using UPARSE (version 7.1, http://drive5.com/uparse/, accessed on 17 June 2024). Taxonomic classification of representative OTU sequences was performed using the RDP Classifier (version 2.2) against the SILVA v138 16S rRNA database with a confidence threshold of 0.7. Subsequent analyses included alpha-diversity analysis (http://www.mothur.org/wiki/Calculators, accessed on 17 June 2024), construction of Venn diagrams, community composition analysis, intergroup significance testing at the phylum and genus levels, LEfSe analysis, and calculation of Spearman rank correlation coefficients between environmental factors and prominent genera. The resulting numerical matrices were visualized as heatmaps, where colors indicate the magnitude of values within the matrix. Beta diversity was assessed through principal coordinate analysis (PCoA) based on Bray–Curtis distances. All statistical analyses and visualizations were implemented in R. (version 3.3.1).
2.7. Statistical Analysis
All statistical analyses were performed using SAS software (version 8.1). The PROC MIXED procedure was applied to lactation performance and SCC using the model Yijkm = μ + Ci + Wj + Ci × Wj + bXjk + Sim + εijkm, where the terms are as follows: Yijkm (dependent variable), μ (overall mean), Ci (fixed effect of dietary Se level), Wj (fixed effect of lactation week: 2, 4, 6, 8), Ci × Wj (effect of the interaction between diet treatment and lactation week), bXjk (covariate from pretrial week 0), Sim (random effect of donkey), and εijkm (residual error). Nutrient digestibility, nitrogen and energy metabolism indicators, plasma Se concentration, FA composition in blood and milk, SCFA concentrations in rectal feces, and alpha-diversity indices were analyzed using the GLM procedure for normally distributed data; otherwise, the Kruskal–Wallis test was applied. Differences across treatments were analyzed using Duncan’s multiple range test, and data are reported as least-squares means along with standard errors. Differentially abundant bacterial genera in the rectal microbiota were identified using linear discriminant analysis effect size (LEfSe), with a significance threshold set at a logarithmic LDA score of >2.5. Spearman’s correlation analysis was performed to examine the associations between differentially abundant bacteria genera and SCFA concentrations, FA profiles, nutrient digestion and metabolism rates, and lactation performance. A p-value < 0.05 was considered statistically significant, while 0.05 ≤ p-value < 0.10 was considered a trend toward significance.
3. Results
3.1. Lactation Performance
As shown in Table 2, dietary Se supplementation significantly affected DMI, lactation performance, and SCC in lactating donkeys. Compared with the CON group, donkeys in the Se2 group had significantly greater (p < 0.05) EMY, milk production efficiency, milk protein synthesis efficiency, and yields of lactose, SNF, and TS. The fat yield was significantly improved (p = 0.008) in the Se1, Se2, and Se3 groups compared to the CON group. The protein yield in the Se2 group demonstrated an increasing trend compared to both the CON and Se1 groups (p = 0.063). Compared with the CON group, SCC in the Se2 and Se3 groups was significantly decreased (p = 0.019).
Table 2.
Effects of Se supplementation on DMI, lactation performance, and SCC.
3.2. Nutrient Digestibility
As shown in Table 3, compared to the CON group, the apparent digestibility of ADF was significantly increased in the Se2 and Se3 groups (p = 0.036), while the NDF in the Se2 and Se3 groups showed a tendency to increase compared to that in the CON group (p = 0.064). The protein biological value and nitrogen metabolic rate in the Se2 group were significantly higher than those in the CON, Se1, and Se3 groups (p = 0.019; p = 0.012).
Table 3.
Effects of Se supplementation on apparent total-tract nutrient digestibility, energy, and protein metabolic ratio of lactating donkeys.
3.3. Plasma Selenium Concentration and Fatty Acid Composition in Plasma and Milk
As presented in Table 4, the concentration of plasma Se in the Se1, Se2, and Se3 groups was significantly increased (p < 0.0001) compared to the CON group. The concentration in the Se3 group was also significantly greater than that in the Se1 group, and no significant differences were observed between the Se2 group and either the Se1 or Se3 groups. Compared to the CON group, the proportions of C17:0, C15:1, and C22:1 in the Se1, Se2, and Se3 groups were significantly increased (p = 0.046; p < 0.0001; p < 0.0001), while the proportions of C20:1 were opposite (p = 0.005). The proportions of C4:0, C6:0, C8:0, C11:0, C17:1, UFA, MUFA, n-3 LCPUFA, U/S, and P/S in the Se2 and Se3 groups were significantly increased (p < 0.05). Conversely, the proportions of C18:0 and SFA were significantly decreased (p = 0.007; p = 0.011). The proportions of C22:0, C22:2n6, C20:3n3, and C20:5n3 in the Se2 group were significantly increased (p < 0.05). Conversely, the proportions of C13:0, C18:2t6, C18:3n6, and TI were significantly decreased (p < 0.05). DFA in the Se2 group showed a greater tendency to increase than that in the CON group (p = 0.079). The proportion of C21:0 in the Se1 and Se3 groups were significantly increased (p < 0.0001). The proportion of C22:6n3 in the Se3 group showed a greater tendency to increase than that in CON group (p = 0.089). Compared with the CON group, the proportion of C10:0 in the Se3 group was significantly increased, and that in the Se2 group was significantly decreased (p < 0.0001).
Table 4.
Effects of Se supplementation on plasma Se concentration and FA composition in lactating donkeys.
The effects of different levels of Se in the diet on the milk FA composition of lactating donkeys are presented in Table 5. Compared to the CON group, the proportions of C6:0, C13:0, C16:1, C18:1c9, C22:2n6, C20:3n3, UFA, MUFA, n-3 LCPUFA, U/S, DFA, and (C18:0 + C18:1)/C16:0 in the Se1, Se2, and Se3 groups were significantly increased (p < 0.05), while the proportions of C18:1t9, C22:1, SFA, and TI were opposite (p < 0.05). The proportions of C11:0, C18:2c6, PUFA, and P/S in the Se2 and Se3 groups were significantly increased (p < 0.05). Conversely, the proportions of C16:0, C20:0, and AI exhibited a significant decrease (p = 0.002; p < 0.001; p < 0.001), while the proportion of C18:0 demonstrated a declining trend (p = 0.065). The proportions of C4:0, C8:0, and C10:0 in the Se2 group were significantly increased (p = 0.003; p = 0.034; p = 0.001). The proportions of C14:1, C18:3n3, n-3 PUFA, and n-6 PUFA in the Se3 group were significantly increased (p < 0.05). Conversely, the proportion of C12:0 was significantly decreased (p = 0.023). Compared with the CON group, the proportion of C15:0 in the Se1 and Se3 groups was significantly increased, and that in the Se2 group was significantly decreased (p < 0.001). Compared to the Se1 group, the proportions of C20:1 in the Se3 group had a tendency to decrease (p = 0.080). Compared to the Se1 and Se3 groups, the proportions of C20:2n6 and n-6 LCPUFA in the Se2 group were significantly decreased (p = 0.018).
Table 5.
Effects of Se supplementation on FA composition in milk of lactating donkeys.
The effects of different levels of Se in the diet on the milk FA yield of lactating donkeys are presented in Table 6. Compared to the CON group, the proportions of C6:0, C13:0, C20:4n6, C22:2n6, U/S, and (C18:0 + C18:1)/C16:0 in the Se1, Se2, and Se3 groups were significantly increased (p < 0.05). Conversely, the proportions of C22:1 and TI were significantly decreased (p = 0.004; p < 0.0001). Additionally, there was a trend toward an increase in the proportion of C20:3n6 (p = 0.058). The proportions of C8:0, C10:0, C16:1, C18:1c9, C20:3n3, UFA, and n-3 LCPUFA in the Se1 and Se2 groups were significantly increased (p < 0.05), while the proportions of C18:1t9 were opposite (p < 0.0001). The proportions of C11:0, C18:3n3, PUFA, n-3PUFA, and P/S in the Se2 and Se3 groups were significantly increased (p < 0.05). Conversely, the proportions of AI exhibited a significant decrease (p < 0.001). The proportions of C4:0, C18:2c6, UFA, and DFA in the Se2 group were significantly increased (p < 0.05), while the proportion of n-6PUFA demonstrated an increasing trend (p = 0.056). The proportions of C12:0, C16:0, and SFA in the Se3 group were significantly decreased (p = 0.005; p = 0.006; p = 0.001). Compared to the Se1 and Se2 groups, the proportions of C20:1 in the Se3 group were significantly decreased (p = 0.022).
Table 6.
Effects of Se supplementation on FA yield in milk of lactating donkeys.
3.4. Short-Chain Fatty Acids in the Rectal Feces
As shown in Table 7, acetate, butyrate, isovalerate, and acetate-to-propionate ratio increased in the Se2 and Se3 groups compared with the CON group (p < 0.05). The total volatile fatty acid (Total VFA) level in the Se3 group was increased compared with the CON group (p = 0.046). There were no significant differences in propionate, isobutyrate, and valerate concentrations between the CON and AOE groups (p > 0.05).
Table 7.
Effects of Se supplementation on SCFAs of rectal feces in lactating donkeys.
3.5. Fecal Bacterial Richness, Diversity, and Composition
The rarefaction curves of Sobs reached a plateau (Figure 1), indicating that the sequencing depth in this study was adequate to capture the diversity and structure of the rectal microbiota. The α-diversity analysis revealed that there were no differences (p > 0.05) in the Sobs, Shannon, Simpson, Ace, and Chao1 indices among the treatment groups. The coverage index for each group reached 0.98, demonstrating that the sequencing depth was adequate for subsequent analysis (Table 8). The PCoA revealed a clear separation of the rectal microbiota at the genus level among the four treatment groups (Figure 2), indicating that Se intake levels significantly influenced microbial community structure. Non-repeat sequences were clustered into OTUs at a 97% similarity threshold, yielding 2921 OTUs in total. Among these, 99, 139, 114, and 119 unique OTUs were identified in the CON, Se1, Se2, and Se3 groups, respectively (Figure 3).
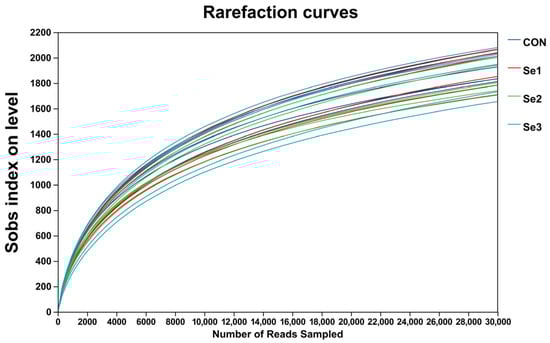
Figure 1.
Observed OTU (Sobs) rarefaction curves of rectal bacteria across selenium supplementation groups. CON = supplemented with 0 mg of Se/kg DM, Se1 = supplemented with 0.15 mg of Se/kg DM, Se2 = supplemented with 0.3 mg of Se/kg DM, Se3 = supplemented with 0.5 mg of Se/kg DM.
Table 8.
Effects of Se supplementation on bacterial α-diversity in rectum of lactating donkeys.
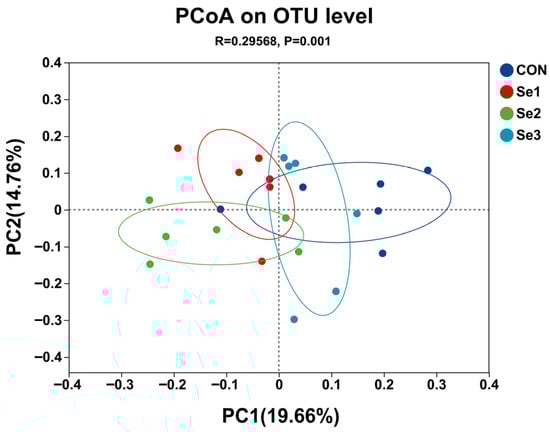
Figure 2.
Principal coordinate analysis (PCoA) of rectal bacteria composition at genus level across selenium supplementation groups. CON = supplemented with 0 mg of Se/kg DM, Se1 = supplemented with 0.15 mg of Se/kg DM, Se2 = supplemented with 0.3 mg of Se/kg DM, Se3 = supplemented with 0.5 mg of Se/kg DM.
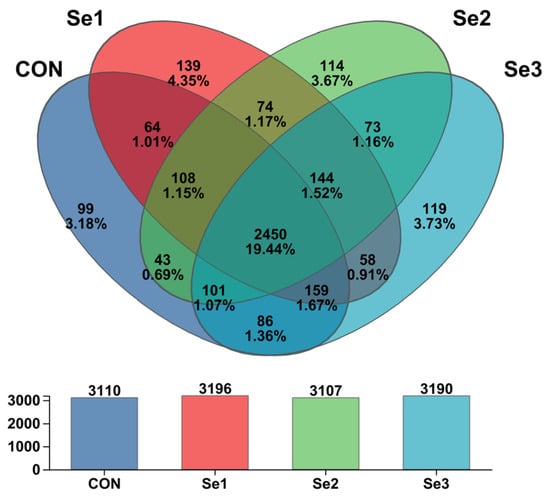
Figure 3.
Venn analysis graph of rectum bacteria at OTU level across selenium supplementation groups. CON = supplemented with 0 mg of Se/kg DM, Se1 = supplemented with 0.15 mg of Se/kg DM, Se2 = supplemented with 0.3 mg of Se/kg DM, Se3 = supplemented with 0.5 mg of Se/kg DM.
3.6. Significantly Different Rectum Bacteria Among the CON, Se1, Se2, and Se3 Groups
To elucidate the effects of different Se intake levels on the rectal bacterial structure of donkeys, we analyzed the bacterial changes at the phylum and genus levels across the four treatment groups. At the phylum level, the rectal microbiota was predominantly composed of Firmicutes, Bacteroidota, Spirochaetota, Verrucomicrobiota, and Actinobacteriota (Table 9). Compared with the Se1 group, the Se2 group increased the relative abundance of Actinobacteriota (p < 0.05). No significant changes were found between the CON, Se3, and the other groups. LEfSe analysis identified bacterial taxa with significantly different abundances among the four groups (Figure 4). The relative abundances of Lachnospiraceae_AC2044_group, Anaerosporobacter, norank_f__Lachnospiraceae, and norank_f__norank_o__Oscillospirales were significantly higher in the Se1 group than in the CON, Se2 and Se3 groups. In the Se2 group, the relative abundances of Christensenellaceae_R-7_group, Lachnospiraceae_XPB1014, norank_f_Erysipelotrichaceae, Phoenicibacter, and norank_f_norank_o_Saccharimonadales were significantly increased. The Se3 group showed an increased relative abundance of Paludicola. In contrast, Se supplementation decreased the relative abundances of Prevotella, Phascolarctobacterium, Ruminococcus, Prevotellaceae_UCG-003, and Nitrosomonas in the rectum.
Table 9.
Effects of Se supplementation on the composition of rectal bacteria at phyla level (more than 1% of total bacteria).
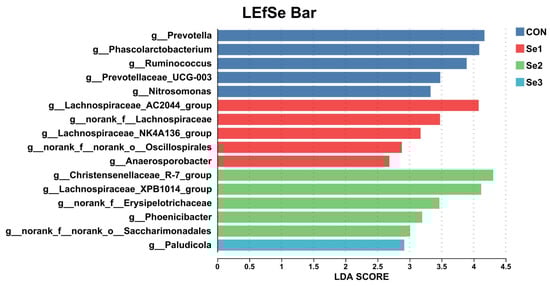
Figure 4.
Effects of Se supplementation on the composition of rectal bacteria at the genus level. LDA scoreS > 2.5 were defined as significant difference. CON = supplemented with 0 mg of Se/kg DM, Se1 = supplemented with 0.15 mg of Se/kg DM, Se2 = supplemented with 0.3 mg of Se/kg DM, Se3 = supplemented with 0.5 mg of Se/kg DM.
3.7. Correlation Analysis of Differential RECTAL Bacteria Genus with Nutrient Digestion and Metabolism Rate, Lactation Performance, Milk FA Composition, and SCFA
A correlation heatmap based on Spearman’s correlation coefficient was generated to visualize the relationships among lactation performance, nutrient digestion and metabolism rates, milk FA composition, SCFA concentrations, and differentially abundant rectal bacteria (Figure 5, Figure 6 and Figure 7). The analysis between the significant differential bacteria and lactation performance revealed that the yields of TS and SNF were positively associated with norank_f__norank_o__Saccharimonadales and Christensenellaceae_R-7_group, but negatively associated with Prevotella. Lactose yield and EMY were positively associated with norank_f__norank_o__Saccharimonadales, Christensenellaceae_R-7_group, and Anaerosporobacter, but were negatively with Prevotella. Additionally, lactose yield was positively correlated with Phoenicibacter. Fat yield was positively associated with Lachnospiraceae_XPB1014, norank_f__Lachnospiraceae, Anaerosporobacter, norank_f__norank_o__Saccharimonadales, Christensenellaceae_R-7_group, Phoenicibacter, and norank_f_Erysipelotrichaceae, but was negatively with Prevotella, Phascolarctobacterium, and Prevotellaceae_UCG-003. Protein yield was positively associated with Lachnospiraceae_XPB1014, norank_f__Lachnospiraceae, Anaerosporobacter, norank_f__norank_o__Saccharimonadales, Christensenellaceae_R-7_group, Phoenicibacter, and norank_f_Erysipelotrichaceae, but was negatively with Ruminococcus, Nitrosomonas, Prevotella, Phascolarctobacterium, norank_f_norank_o_Oscillospirales, and Paludicola. Milk production efficiency was positively associated with norank_f__norank_o__Saccharimonadales, Phoenicibacter and norank_f_Erysipelotrichaceae, but was negatively with Prevotella, Ruminococcus, Prevotellaceae_UCG-003, norank_f_norank_o_Oscillospirales, and Paludicola. Milk protein synthesis efficiency was positively associated with norank_f_norank_o_Saccharimonadales, Phoenicibacter, Christensenellaceae_R-7_group, and Lachnospiraceae_XPB1014, but was negatively with Ruminococcus, Prevotellaceae_UCG-003, Prevotella, and Phascolarctobacterium.
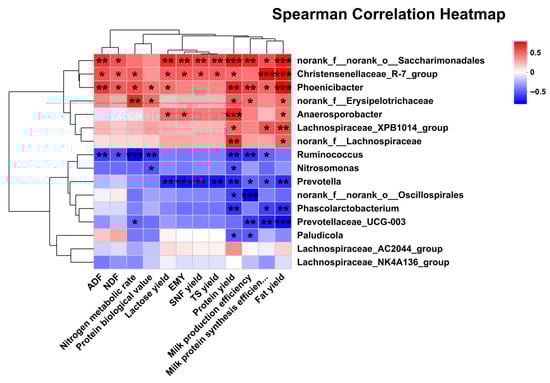
Figure 5.
Pearson correlation analysis of differential bacteria genus with nutrient digestion and metabolism rate and lactation performance. Red indicates a positive correlation; blue indicates a negative correlation. * p < 0.05; ** p < 0.01; *** p < 0.001. Abbreviations: EMY = estimated milk yield.
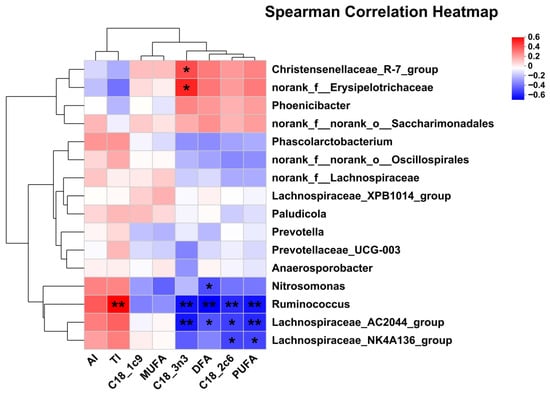
Figure 6.
Pearson correlation analysis of differential bacteria genus and milk FA composition. Red indicates a positive correlation; blue indicates a negative correlation. * p < 0.05; ** p < 0.01. Abbreviations: AI = atherogenicity index (C12:0 + (4 × C14:0) + C16:0)/UFA; TI = thrombogenic index (C14:0 + C16:0 + C18:0)/[0.5 (MUFA) + 0.5 (n-6 PUFA) + 3 (n-3 PUFA) + (n-3 PUFA/n-6 PUFA)]; DFA = desirable fatty acid (C18:0 + UFA).
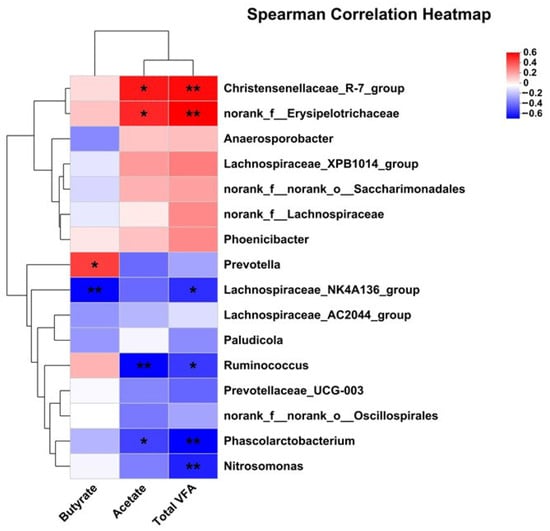
Figure 7.
Pearson correlation analysis of differential bacteria genus and SCFA. Red indicates a positive correlation; blue indicates a negative correlation. * p < 0.05; ** p < 0.01.
In addition, the correlation analysis between significantly differential bacteria and nutrient digestion and metabolism rate revealed that ADF and NDF were positively associated with norank_f_norank_o_Saccharimonadales, Christensenellaceae_R-7_group, and Phoenicibacter, but were negatively with Ruminococcus. Protein biological value was positively associated with Phoenicibacter and norank_f_Erysipelotrichaceae, but was negatively with Ruminococcus and Nitrosomonas. Nitrogen metabolic rate was positively associated with Phoenicibacter, Christensenellaceae_R-7_group, and norank_f_Erysipelotrichaceae, but was negatively with Ruminococcus and Prevotellaceae_UCG-003.
The correlation analysis between significantly differential bacteria and milk FA composition revealed that C18:2c6 and PUFA were negatively associated with Lachnospiraceae_NK4A136_group, Lachnospiraceae_AC2044_group, and Ruminococcus. DFA was negatively associated with Ruminococcus, Lachnospiraceae_AC2044_group, and Nitrosomonas. C18:3n3 was negatively associated with Lachnospiraceae_AC2044_group and Ruminococcus, but was positively with Christensenellaceae_R-7_group and norank_f_Erysipelotrichaceae. TI was positively associated with Ruminococcus.
The correlation analysis between significantly differential bacteria and SCFA revealed that acetate was positively associated with Christensenellaceae_R-7_group and norank_f_Erysipelotrichaceae, but was negatively with Ruminococcus and Phascolarctobacterium. Butyrate was positively associated with Prevotella, but was negatively with Lachnospiraceae_NK4A136_group. Total VFA was positively associated with Christensenellaceae_R-7_group and norank_f_Erysipelotrichaceae, but was negatively with Ruminococcus, Lachnospiraceae_NK4A136_group, Phascolarctobacterium, and Nitrosomonas.
4. Discussion
4.1. Effects on Lactation Performance
Previous research on the impact of Se supplementation on lactation performance has predominantly focused on dairy cows [41], sheep [42], and sows [17], with limited studies specifically addressing lactating donkeys. Although Se is known to improve lactation in dairy cows [43,44], the optimal dosage and specific physiological responses in donkeys were previously unclear. This study found that supplementation with 0.3 mg Se/kg DM significantly increased milk yield, milk component yield, milk production efficiency, and milk protein synthesis efficiency. In contrast, supplementation with 0.5 mg Se/kg DM resulted in no improvement and even showed a potential inhibitory trend, suggesting that 0.3 mg Se/kg DM represents the optimal effective dose. Notably, the DMI of donkeys in the Se2 group remained unaffected. This indicates an increased efficiency of dietary nutrient utilization, which could explain the increased milk production. This finding was substantiated by the significant increase in the digestibility of NDF and ADF, as well as the BV and the N metabolic rate, observed in the Se2 group. From a physiological perspective, Se supplementation has been reported to strengthen mammary gland capillary distribution and increase vascular area [45], providing a histological basis for improved milk production. Furthermore, as shown in studies by Tong et al. [14] and Arshad et al. [46], Se supplementation improves lactation performance by improving mammary gland health, boosting antioxidant status, and reducing the incidence of mastitis. However, beyond a certain threshold, Se can exert pro-oxidant effects [47]. This may explain the inhibited lactation performance in the Se3 group of our study, which occurred despite a dose-dependent increase in plasma Se concentration. This potential mechanism, however, requires further validation.
Donkeys are monogastric herbivores that rely on hindgut fermentation. Their enlarged cecum and colon enable them to derive energy and nutrients from fibrous feeds through microbial fermentation [20]. The observed increase in milk yield may be closely related to the composition of the rectal microbiota. Since the rectal microbiota can, to a certain extent, reflect the microbial status in the cecum [22,23], and given that changes in the gut microbiota structure can affect cecal digestive function [48], the improvements in nutrient digestion and milk production observed in the Se2 group demonstrate the beneficial, dose-dependent effects of Se on gut microbiota. Se2 supplementation modulated specific beneficial bacterial genera. It significantly increased the abundance of Christensenellaceae_R-7_group, a probiotic commonly found in the intestinal tract and mucosa that is considered to be involved in amino acid and lipid metabolism [49]. Spearman correlation analysis revealed that Christensenellaceae_R-7_group was positively correlated with N metabolic rate, milk protein synthesis efficiency, protein yield, fat yield, acetate concentration, and the digestibility of ADF and NDF. Acetate serves as a primary substrate for milk fat synthesis [50]. LEfSe analysis also indicated significant enrichment of the probiotics Lachnospiraceae_XPB1014_group and norank_f_Erysipelotrichaceae in the Se2 group. Si et al. [51] had found that Lachnospiraceae_XPB1014_group was positively correlated with milk fat yield, which is consistent with this study. Erysipelotrichaceae predominantly participate in protein catabolism [52]. We found a positive correlation between Erysipelotrichaceae and the N metabolic rate, BV, protein yield, milk protein production efficiency, and milk production efficiency. Furthermore, the Erysipelotrichaceae also exhibited a positive correlation with acetate. Thus, the increased abundance of these bacteria may be the main reason for the improvements in nutrient digestibility and lactation performance observed in the Se2 group. In contrast, the abundance of these key beneficial genera was significantly lower in the high-dose Se3 group than in the Se2 group. This reduction may be a result of excessive blood Se concentrations.
4.2. Effects on Fatty Acid Composition of Milk
Supplementation with 0.3 mg Se/kg DM significantly increased the proportion of SFA in milk, notably elevating levels of short- and medium-chain fatty acids (SMCFA; C4:0, C6:0, C8:0, and C10:0). This elevation in SMCFA may be attributed to increased rectal concentrations of acetate and butyrate, which serve as substrates for the de novo synthesis of milk FAs in mammary epithelial cells [53]. The current study also confirmed that dietary supplementation with 0.3 and 0.5 mg Se/kg DM significantly increased the proportion of UFA in donkey milk. The underlying mechanism may be related to the Se-enhanced antioxidant capacity. This is supported by our plasma Se analysis, which showed a dose-dependent increase in concentration, and is consistent with our previous finding that these Se doses improved serum antioxidant function and reduced reactive oxygen species levels in lactating donkeys [14]. Furthermore, Yang et al. [54] reported that Se protects cell membranes from oxidative damage induced by reactive oxygen species and lipid hydroperoxides by inhibiting free radical generation. Supporting these findings, Ianni et al. [55] observed in dairy cows that dietary Se supplementation at 0.45 mg Se/kg DM significantly decreased the SFA content while increasing the concentration of C18:2c6 (a UFA) in milk.
Feed composition directly influences cecum fermentation and microbiota composition [56]. Consequently, dietary Se supplementation may increase UFA concentrations by modulating these processes in lactating donkeys. In this study, supplementation with 0.3 and 0.5 mg Se/kg DM increased the levels of C18:1c9, C18:2c6, and C18:3n3 in milk while decreasing the proportion of C18:0. This shift suggests that Se may inhibit the biohydrogenation (BH) process, leading to an accumulation of intermediate UFAs. Studies have found that Prevotella and Ruminococus may be involved in BH processes [57,58]. Our Spearman correlation analysis revealed that C18:2c6, C18:3n3, DFA, and PUFA were negatively correlated with Ruminococus, whereas TI showed a positive correlation. Furthermore, dietary supplementation with 0.3 mg Se/kg DM significantly increased the relative abundance of the Christensenellaceae R-7 group. This bacterial group can degrade plant cellulose and hemicellulose, converting them into SCFAs for host energy absorption [59]. Given that cellulose-hydrolyzing bacteria are involved in BH, we propose that Se may affect BH by increasing the abundance of Christensenellaceae_R-7_group and decreasing the abundance of Ruminococus—a causal relationship that warrants validation. The observed positive correlation between the abundance of the Christensenellaceae_R-7_group and milk C18:3n3 levels further suggests that this bacterial genus may play a pivotal role in C18:3n3 metabolism, potentially through its ability to convert C18:3n3 into beneficial metabolites for the host. Proposed metabolic pathways include the conversion of C18:3n3 to EPA and DHA, as well as the biosynthesis of health-promoting secondary metabolites via alternative biochemical routes. As C18:3n3 and its derivatives are known to confer anti-inflammatory and cardiovascular benefits [60], the Christensenellaceae R-7 group may indirectly improve host health by regulating C18:3n3 metabolism. Nevertheless, the precise molecular mechanisms require further elucidation.
P/S is an important indicator for assessing dietary nutritional value, with a recommended value of >0.45 considered desirable [61]. TI and AI are used to evaluate the fat quality of milk; lower values indicate a higher content of anti-atherosclerotic FA or a greater proportion of beneficial UFA [62]. In the present study, dietary supplementation with 0.3 and 0.5 mg Se/kg DM increased the P/S ratio, DFA, and the (C18:0 + C18:1)/C16:0 ratio, while decreasing AI and TI indices. These improvements enhance the nutritional value of donkey milk for human consumption, with the 0.5 mg Se/kg DM dose showing superior efficacy. MUFAs function beneficially in the regulation of plasma lipids and lipoproteins, resulting in decreased inflammation, oxidative stress, and coagulation, and improved glucose homeostasis and blood pressure control [63]. Our results showed that Se supplementation significantly increased MUFA. This suggests that the improvement in the antioxidant function of donkey milk previously observed with Se supplementation [14] may potentially be partially mediated by the increased MUFA proportion, though the specific underlying mechanism remains to be further explored and verified due to the complexity of the antioxidant regulatory network in milk.
In summary, dietary Se supplementation in lactating donkeys exhibits dose-dependent effects. A dose of 0.3 mg Se/kg DM was optimal, significantly improving lactation performance and milk yield. It also increased the proportions of beneficial FAs, such as C18:1c9, C18:2c6, C18:3n3, MUFA, PUFA, n-3 PUFA, and DFA; consequently, the overall FA profile of donkey milk was optimized. Although the 0.5 mg Se/kg DM dose showed no improvement and even a potential inhibitory effect on lactation performance, it was more effective at increasing the P/S ratio and reducing the AI and TI indices. Nonetheless, several limitations of this study should be acknowledged. First, the generalizability of our findings may be limited as they are based exclusively on lactating Dezhou donkeys. Furthermore, the study was constrained by a small sample size and a lack of functional analyses for the key bacterial genera identified. Consequently, the mechanistic insights remain associative and warrant further validation.
5. Conclusions
Dietary Se supplementation in lactating donkeys exhibits a dose-dependent effect: 0.3 mg Se/kg DM is the optimal level, as it significantly improves lactation performance and milk protein synthesis efficiency, increases the milk yield and proportions of FA, such as C18:1c9, C18:2c6, C18:3n3, MUFA, PUFA, n-3 PUFA, and DFA, and thereby optimizes FA profiles in donkey milk. The underlying mechanism may be related to promoting the digestion and metabolism of nutrients, as well as the enrichment of beneficial rectal bacteria such as Christensenellaceae R-7 group, Lachnospiraceae XPB1014, and norank_f_Erysipelotrichaceae. The 0.5 mg Se/kg DM dose showed no improvement or even a tendency to decrease lactation performance, but had better effects in increasing indices like the P/S ratio and decreasing AI and TI indices.
Author Contributions
Conceptualization, S.Y., Q.Z., and F.M.; data curation, X.G., F.H., and F.M.; formal analysis, Z.W.; funding acquisition, S.Y.; investigation, Y.G.; methodology, S.Y., Y.G., and Y.Z.; project administration, Q.Z., Z.W., and M.T.; resources, M.T.; supervision, X.G.; validation, F.H., M.T., and L.L.; visualization, Y.Z. and L.L.; writing—original draft preparation, F.M. and Z.W.; writing—review and editing, S.Y. All authors have read and agreed to the published version of the manuscript.
Funding
This work was financially supported by the National Natural Science Foundation of China (Project No. 32160794) and the Basic Research Fund for Universities in Inner Mongolia Autonomous Region (Project No. BR251030).
Institutional Review Board Statement
The experimental procedures were approved by the Animal Ethics and Welfare Committee at Inner Mongolia Agricultural University (NND2021050) and conducted in accordance with the university’s animal research guidelines.
Informed Consent Statement
Not applicable.
Data Availability Statement
The raw 16S rRNA gene sequencing data have been deposited in the National Center for Biotechnology Information (NCBI) database under BioProject accession PRJNA1289364.
Acknowledgments
The authors gratefully acknowledge Inner Mongolia Grassland Yulv Science and Technology Animal Husbandry Co., Ltd. (Helinger County, China) for providing the test base for this study’s feeding trial. Thanks also go to all members of the Inner Mongolia Key Laboratory of Animal Nutrition and Feed Science for their contributions.
Conflicts of Interest
The authors declare no competing interests.
Abbreviations
The following abbreviations are used in this manuscript:
| AI | Atherogenicity index |
| AIA | Acid-insoluble ash |
| ATTD | Apparent total-tract digestibility |
| BH | Biohydrogenation |
| BV | Protein biological value |
| DFA | Desirable fatty acid |
| EE | Ether extract |
| EMY | Estimated milk yield |
| FA | Fatty acid |
| GE | Gross energy |
| MY | Milking yield |
| SCFA | Short-chain fatty acid |
| SCM | Solids-corrected milk |
| SMCFA | Short-and medium-chain fatty acid |
| TI | Thrombogenic index |
| Total VFA | Total volatile fatty acid |
References
- Papademas, P.; Mousikos, P.; Aspri, M. Valorization of donkey milk: Technology, functionality, and future prospects. JDS Commun. 2022, 3, 228–233. [Google Scholar] [CrossRef]
- Cimmino, F.; Catapano, A.; Villano, I.; Di Maio, G.; Petrella, L.; Traina, G.; Pizzella, A.; Tudisco, R.; Cavaliere, G. Invited review: Human, cow, and donkey milk comparison: Focus on metabolic effects. J. Dairy Sci. 2023, 106, 3072–3085. [Google Scholar] [CrossRef]
- Mignone, L.E.; Wu, T.; Horowitz, M.; Rayner, C.K. Whey protein: The “whey” forward for treatment of type 2 diabetes? World J. Diabetes 2015, 6, 1274–1284. [Google Scholar] [CrossRef]
- Vincenzetti, S.; Pucciarelli, S.; Polzonetti, V.; Polidori, P.; Durazzo, A. Role of proteins and of some bioactive peptides on the nutritional quality of donkey milk and their impact on human health. Beverages 2017, 3, 34. [Google Scholar] [CrossRef]
- Brumini, D.; Criscione, A.; Bordonaro, S.; Vegarud, G.E.; Marletta, D. Whey proteins and their antimicrobial properties in donkey milk: A brief review. Dairy Sci. Technol. 2016, 96, 1–14. [Google Scholar] [CrossRef]
- Esener, O.; Balkan, B.M.; Armutak, E.I.; Uvez, A.; Yildiz, G.; Hafizoglu, M.; Yilmazer, N.; Gurel-Gurevin, E. Donkey milk kefir induces apoptosis and suppresses proliferation of Ehrlich ascites carcinoma by decreasing iNOS in mice. Biotech. Histochem. 2018, 93, 424–431. [Google Scholar] [CrossRef] [PubMed]
- Li, L.; Liu, X.; Guo, H. The nutritional ingredients and antioxidant activity of donkey milk and donkey milk powder. Food Sci. Biotechnol. 2017, 27, 393–400. [Google Scholar] [CrossRef] [PubMed]
- Yvon, S.; Olier, M.; Leveque, M.; Jard, G.; Tormo, H.; Haimoud-Lekhal, D.A.; Peter, M.; Eutamène, H. Donkey milk consumption exerts anti-inflammatory properties by normalizing antimicrobial peptides levels in Paneth’s cells in a model of ileitis in mice. Eur. J. Nutr. 2018, 57, 155–166. [Google Scholar] [CrossRef]
- Martini, M.; Altomonte, I.; Tricò, D.; Lapenta, R.; Salari, F. Current knowledge on functionality and potential therapeutic uses of donkey milk. Animals 2021, 11, 1382. [Google Scholar] [CrossRef]
- Khan, I.T.; Nadeem, M.; Imran, M.; Ullah, R.; Ajmal, M.; Jaspal, M.H. Antioxidant properties of milk and dairy products: A comprehensive review of the current knowledge. Lipids Health Dis. 2019, 18, 41. [Google Scholar] [CrossRef]
- Carroccio, A.; Cavataio, F.; Montalto, G.; D’Amico, D.; Alabrese, L.; Iacono, G. Intolerance to hydrolysed cow’s milk proteins in infants: Clinical characteristics and dietary treatment. Clin. Exp. Allergy 2000, 30, 1597–1603. [Google Scholar] [CrossRef]
- Gong, J.; Ni, L.; Wang, D.; Shi, B.; Yan, S. Effect of dietary organic selenium on milk selenium concentration and antioxidant and immune status in midlactation dairy cows. Livest. Sci. 2014, 170, 84–90. [Google Scholar] [CrossRef]
- Mahan, D.C.; Cline, T.R.; Richert, B. Effects of dietary levels of selenium-enriched yeast and sodium selenite as selenium sources fed to growing-finishing pigs on performance, tissue selenium, serum glutathione peroxidase activity, carcass characteristics, and loin quality. J. Anim. Sci. 1999, 77, 2172–2179. [Google Scholar] [CrossRef]
- Tong, M.; Li, S.; Hui, F.; Meng, F.; Li, L.; Shi, B.; Zhao, Y.; Guo, X.; Guo, Y.; Yan, S. Effects of dietary selenium yeast supplementation on lactation performance, antioxidant status, and immune responses in lactating donkeys. Antioxidants 2024, 13, 275. [Google Scholar] [CrossRef] [PubMed]
- Sun, P.; Wang, J.; Liu, W.; Bu, D.P.; Liu, S.J.; Zhang, K.Z. Hydroxy-selenomethionine: A novel organic selenium source that improves antioxidant status and selenium concentrations in milk and plasma of mid-lactation dairy cows. J. Dairy Sci. 2017, 100, 9602–9610. [Google Scholar] [CrossRef]
- Ye, R.; Huang, J.; Wang, Z.; Chen, Y.; Dong, Y. Trace element selenium effectively alleviates intestinal diseases. Int. J. Mol. Sci. 2021, 22, 11708. [Google Scholar] [CrossRef]
- Sun, L.; Liu, G.; Xu, D.; Wu, Z.; Ma, L.; Victoria, S.M.; Baumgard, L.H.; Bu, D. Milk selenium content and speciation in response to supranutritional selenium yeast supplementation in cows. Anim. Nutr. 2021, 7, 1087–1094. [Google Scholar] [CrossRef]
- Puniya, A.K.; Singh, R.; Kamra, D.N. Rumen Microbiology: From Evolution to Revolution; Springer: New Delhi, India, 2015; pp. 153–168. [Google Scholar] [CrossRef]
- Jewell, K.A.; McCormick, C.A.; Odt, C.L.; Weimer, P.J.; Suen, G. Ruminal bacterial community composition in dairy cows is dynamic over the course of two lactations and correlates with feed efficiency. Appl. Environ. Microbiol. 2015, 81, 4697–4710. [Google Scholar] [CrossRef] [PubMed]
- Edwards, J.E.; Schennink, A.; Burden, F.; Long, S.; van Doorn, D.A.; Pellikaan, W.F.; Dijkstra, J.; Saccenti, E.; Smidt, H. Domesticated equine species and their derived hybrids differ in their fecal microbiota. Anim. Microbiome 2020, 2, 8. [Google Scholar] [CrossRef]
- Grimm, P.; Philippeau, C.; Julliand, V. Faecal parameters as biomarkers of the equine hindgut microbial ecosystem under dietary change. Animal 2017, 11, 1136–1145. [Google Scholar] [CrossRef] [PubMed]
- Kim, H.B.; Isaacson, R.E. The pig gut microbial diversity: Understanding the pig gut microbial ecology through the next generation high throughput sequencing. Vet. Microbiol. 2015, 177, 242–251. [Google Scholar] [CrossRef]
- Stanley, D.; Geier, M.S.; Chen, H.; Hughes, R.J.; Moore, R.J. Comparison of fecal and cecal microbiotas reveals qualitative similarities but quantitative differences. BMC Microbiol. 2015, 15, 51. [Google Scholar] [CrossRef]
- Guo, Y.; Yin, G.; Hui, F.; Guo, X.; Shi, B.; Zhao, Y.; Yan, S. Effects of dietary energy level on antioxidant capability, immune function and rectal microbiota in late gestation donkeys. Front. Microbiol. 2024, 15, 1308171. [Google Scholar] [CrossRef]
- Li, S.Y.; Tong, M.M.; Li, L.; Hui, F.; Meng, F.Z.; Zhao, Y.L.; Guo, Y.M.; Guo, X.Y.; Shi, B.L.; Yan, S.M. Rectal microbiomes and serum metabolomics reveal the improved effect of Artemisia ordosica crude polysaccharides on the lactation performance, antioxidant status, and immune responses of lactating donkeys. J. Dairy Sci. 2024, 107, 6696–6716. [Google Scholar] [CrossRef]
- Cui, X.; Wang, Z.; Tan, Y.; Chang, S.; Zheng, H.; Wang, H.; Yan, T.; Guru, T.; Hou, F. Selenium yeast dietary supplement affects rumen bacterial population dynamics and fermentation parameters of Tibetan sheep (Ovis aries) in alpine meadow. Front. Microbiol. 2021, 12, 663945. [Google Scholar] [CrossRef] [PubMed]
- Sun, W.; Shi, H.; Gong, C.; Liu, K.; Li, G. Effects of different yeast selenium levels on rumen fermentation parameters, digestive enzyme activity and gastrointestinal microflora of sika deer during antler growth. Microorganisms 2023, 11, 1444. [Google Scholar] [CrossRef] [PubMed]
- Li, J.X.; Lu, D.L.; Yu, S.J.; Zhang, W.L.; Zainaguli, J.J.L.K.; Zhou, J.H.; Huang, X.X. The analysis of donkey milk production and the research of estimated milk production day. Grass Feed. Livest. 2013, 6, 26. [Google Scholar] [CrossRef]
- Liang, X.S.; Yue, Y.X.; Zhao, Y.L.; Guo, Y.M.; Guo, X.Y.; Shi, B.L.; Yan, S.M. Effects of dietary concentrate to forage ratio on milk performance, milk amino acid composition and milk protein synthesis of lactating donkeys. Anim. Feed Sci. Technol. 2022, 292, 115454. [Google Scholar] [CrossRef]
- Tyrrell, H.F.; Reid, J.T. Prediction of the energy value of cow’s milk. J. Dairy Sci. 1965, 48, 1215–1223. [Google Scholar] [CrossRef]
- Leiber, F.; Dorn, K.; Probst, J.K.; Isensee, A.; Ackermann, N.; Kuhn, A.; Spengler Neff, A. Concentrate reduction and sequential roughage offer to dairy cows: Effects on milk protein yield, protein efficiency and milk quality. J. Dairy Res. 2015, 82, 272–278. [Google Scholar] [CrossRef]
- O’Fallon, J.V.; Busboom, J.R.; Nelson, M.L.; Gaskins, C.T. A direct method for fatty acid methyl ester synthesis: Application to wet meat tissues, oils, and feedstuffs. J. Anim. Sci. 2007, 85, 1511–1521. [Google Scholar] [CrossRef]
- Wereńska, M.; Haraf, G.; Wołoszyn, J.; Goluch, Z.; Okruszek, A.; Teleszko, M. Fatty acid profile and health lipid indices of goose meat in relation to various types of heat treatment. Poult. Sci. 2021, 100, 101237. [Google Scholar] [CrossRef]
- Ulbricht, T.L.V.; Southgate, D.A.T. Coronary heart disease: Seven dietary factors. Lancet 1991, 338, 985–992. [Google Scholar] [CrossRef]
- Helrich, K. Official Methods of Analysis of AOAC International: Food Composition, Additives, Natural Contaminants, 18th ed.; AOAC International: Arlington, VA, USA, 2006; Volume 2. [Google Scholar]
- Van Soest, P.J.; Robertson, J.B.; Lewis, B.A. Methods for dietary fiber, neutral detergent fiber, and nonstarch polysaccharides in relation to animal nutrition. J. Dairy Sci. 1991, 74, 3583–3597. [Google Scholar] [CrossRef]
- Ren, H.; Bai, H.; Su, X.; Pang, J.; Li, X.; Wu, S.; Cao, Y.; Cai, C.; Yao, J. Decreased amylolytic microbes of the hindgut and increased blood glucose implied improved starch utilization in the small intestine by feeding rumen-protected leucine in dairy calves. J. Dairy Sci. 2020, 103, 4218–4235. [Google Scholar] [CrossRef] [PubMed]
- Reynolds, C.K.; Humphries, D.J.; Kirton, P.; Kindermann, M.; Duval, S.; Steinberg, W. Effects of 3-nitrooxypropanol on methane emission, digestion, and energy and nitrogen balance of lactating dairy cows. J. Dairy Sci. 2014, 97, 3777–3789. [Google Scholar] [CrossRef] [PubMed]
- Jha, R.; Overend, D.N.; Simmins, P.H.; Hickling, D.; Zijlstra, R.T. Chemical characteristics, feed processing quality, growth performance and energy digestibility among wheat classes in pelleted diets fed to weaned pigs. Anim. Feed Sci. Technol. 2011, 170, 78–90. [Google Scholar] [CrossRef]
- GB5009.268-2016; Determination of Multi-Elements in Foods. Standards Press of China: Beijing, China, 2016.
- Li, Y.; Liu, J.X.; Xiong, J.L.; Wang, Y.M.; Zhang, W.X.; Wang, D.M. Effect of hydroxyselenomethionine on lactation performance, blood profiles, and transfer efficiency in early-lactating dairy cows. J. Dairy Sci. 2019, 102, 6167–6173. [Google Scholar] [CrossRef]
- Bai, X.; Li, F.; Li, F.; Guo, L. Different dietary sources of selenium alter meat quality, shelf life, selenium deposition, and antioxidant status in Hu lambs. Meat Sci. 2022, 194, 108961. [Google Scholar] [CrossRef]
- Hachemi, M.A.; Sexton, J.R.; Briens, M.; Whitehouse, N.L. Efficacy of feeding hydroxy-selenomethionine on plasma and milk selenium in mid-lactation dairy cows. J. Dairy Sci. 2023, 106, 2374–2385. [Google Scholar] [CrossRef]
- Xiao, M.; Wang, Y.; Wei, M.; Peng, W.; Wang, Y.; Zhang, R.; Zheng, Y.; Ju, J.; Dong, C.; Du, L.; et al. Effects of nanoselenium on the performance, blood indices, and milk metabolites of dairy cows during the peak lactation period. Front. Vet. Sci. 2024, 11, 1418165. [Google Scholar] [CrossRef]
- Vonnahme, K.A.; Wienhold, C.M.; Borowicz, P.P.; Neville, T.L.; Redmer, D.A.; Reynolds, L.P.; Caton, J.S. Supranutritional selenium increases mammary gland vascularity in postpartum ewe lambs. J. Dairy Sci. 2011, 94, 2850–2858. [Google Scholar] [CrossRef]
- Arshad, M.A.; Ebeid, H.M.; Hassan, F.U. Revisiting the effects of different dietary sources of selenium on the health and performance of dairy animals: A review. Biol. Trace Elem. Res. 2021, 199, 3319–3337. [Google Scholar] [CrossRef]
- Czauderna, M.; Białek, M.; Krajewska, K.A.; Ruszczyńska, A.; Bulska, E. Selenium supplementation into diets containing carnosic acid, fish and rapeseed oils affects the chemical profile of whole blood in lambs. J. Anim. Feed Sci. 2017, 26, 192–203. [Google Scholar] [CrossRef]
- Yang, Q.; Liu, H.; Jafari, H.; Liu, B.; Wang, Z.; Su, J.; Wang, F.; Yang, G.; Sun, M.; Cheng, J.; et al. Corrigendum: Metabolic changes before and after weaning in Dezhou donkey foals in relation to gut microbiota. Front. Microbiol. 2025, 16, 1557933. [Google Scholar] [CrossRef]
- Waters, J.L.; Ley, R.E. The human gut bacteria Christensenellaceae are widespread, heritable, and associated with health. BMC Biol. 2019, 17, 83. [Google Scholar] [CrossRef]
- Xue, M.Y.; Sun, H.Z.; Wu, X.H.; Liu, J.X.; Guan, L.L. Multi-omics reveals that the rumen microbiome and its metabolome together with the host metabolome contribute to individualized dairy cow performance. Microbiome 2020, 8, 64. [Google Scholar] [CrossRef] [PubMed]
- Si, B.; Liu, K.; Huang, G.; Chen, M.; Yang, J.; Wu, X.; Li, N.; Tang, W.; Zhao, S.; Zheng, N.; et al. Relationship between rumen bacterial community and milk fat in dairy cows. Front. Microbiol. 2023, 14, 1247348. [Google Scholar] [CrossRef] [PubMed]
- Hugenholtz, F.; Davids, M.; Schwarz, J.; Müller, M.; Tomé, D.; Schaap, P.; Hooiveld, G.J.E.J.; Smidt, H.; Kleerebezem, M. Metatranscriptome analysis of the microbial fermentation of dietary milk proteins in the murine gut. PLoS ONE 2018, 13, e0194066. [Google Scholar] [CrossRef] [PubMed]
- Cozma, A.; Miere, D.; Filip, L.; Andrei, S.; Banc, R.; Loghin, F. A review of the metabolic origins of milk fatty acids. Not. Sci. Biol. 2013, 5, 270–274. [Google Scholar] [CrossRef]
- Yang, F.L.; Li, X.S.; He, B.X. Effects of vitamins and trace elements supplementation on milk production in dairy cows A review. Afr. J. Biotechnol. 2011, 10, 2574–2578. [Google Scholar] [CrossRef]
- Ianni, A.; Bennato, F.; Martino, C.; Innosa, D.; Grotta, L.; Martino, G. Effects of selenium supplementation on chemical composition and aromatic profiles of cow milk and its derived cheese. J. Dairy Sci. 2019, 102, 6853–6862. [Google Scholar] [CrossRef]
- Li, S.; Liu, T.; Wang, K.; Li, C.; Wu, F.; Yang, X.; Zhao, M.; Chen, B.; Chen, X. The ratios of dietary non-fibrous carbohydrate (NFC) to neutral detergent fiber (NDF) influence intestinal immunity of rabbits by regulating gut microbiota composition and metabolites. Front. Microbiol. 2023, 14, 1146787. [Google Scholar] [CrossRef]
- Toral, P.G.; Belenguer, A.; Shingfield, K.J.; Hervás, G.; Toivonen, V.; Frutos, P. Fatty acid composition and bacterial community changes in the rumen fluid of lactating sheep fed sunflower oil plus incremental levels of marine algae. J. Dairy Sci. 2012, 95, 794–806. [Google Scholar] [CrossRef] [PubMed]
- Buccioni, A.; Pallara, G.; Pastorelli, R.; Bellini, L.; Cappucci, A.; Mannelli, F.; Minieri, S.; Roscini, V.; Rapaccini, S.; Mele, M.; et al. Effect of dietary chestnut or quebracho tannin supplementation on microbial community and fatty acid profile in the rumen of dairy ewes. BioMed Res. Int. 2017, 2017, 4969076. [Google Scholar] [CrossRef]
- Wang, B.; Ma, M.P.; Diao, Q.Y.; Tu, Y. Saponin-induced shifts in the rumen microbiome and metabolome of young cattle. Front. Microbiol. 2019, 10, 356. [Google Scholar] [CrossRef]
- Adkins, Y.; Kelley, D.S. Mechanisms underlying the cardioprotective effects of omega-3 polyunsaturated fatty acids. J. Nutr. Biochem. 2010, 21, 781–792. [Google Scholar] [CrossRef] [PubMed]
- Simopoulos, A.P. The importance of the omega-6/omega-3 fatty acid ratio in cardiovascular disease and other chronic diseases. Exp. Biol. Med. (Maywood) 2008, 233, 674–688. [Google Scholar] [CrossRef]
- Rizzo, F.A.; Júnior, J.S.; Scheibler, R.B.; Fluck, A.C.; de Vargas, D.P.; Nörnberg, J.L.; Fioreze, V.I.; da Silva, J.L.S.; Costa, O.A.D. Biofortification of cow milk through dietary supplementation with sunflower oil: Fatty acid profile, atherogenicity, and thrombogenic index. Trop. Anim. Health Prod. 2023, 55, 269. [Google Scholar] [CrossRef]
- Bermudez, B.; Lopez, S.; Ortega, A.; Varela, L.M.; Pacheco, Y.M.; Abia, R.; Muriana, F.J. Oleic acid in olive oil: From a metabolic framework toward a clinical perspective. Curr. Pharm. Des. 2011, 17, 831–843. [Google Scholar] [CrossRef] [PubMed]
Disclaimer/Publisher’s Note: The statements, opinions and data contained in all publications are solely those of the individual author(s) and contributor(s) and not of MDPI and/or the editor(s). MDPI and/or the editor(s) disclaim responsibility for any injury to people or property resulting from any ideas, methods, instructions or products referred to in the content. |
© 2025 by the authors. Licensee MDPI, Basel, Switzerland. This article is an open access article distributed under the terms and conditions of the Creative Commons Attribution (CC BY) license (https://creativecommons.org/licenses/by/4.0/).