3.1. Animal Intake by RSPCA over Time
Overall, between December 2018 and November 2022, 198,545 animals were taken in by the RSPCA. At centres, these were recorded as dogs, cats, rabbits, other companion animals, wildlife and equines, while at branches, they were categorised as dogs, cats, rabbits, miscellaneous animals and wildlife. The ‘other’ and ‘miscellaneous’ categories included pet rodents, ferrets, fish, exotics and captive birds; for consistency, we will refer to both of these categories as ‘miscellaneous’.
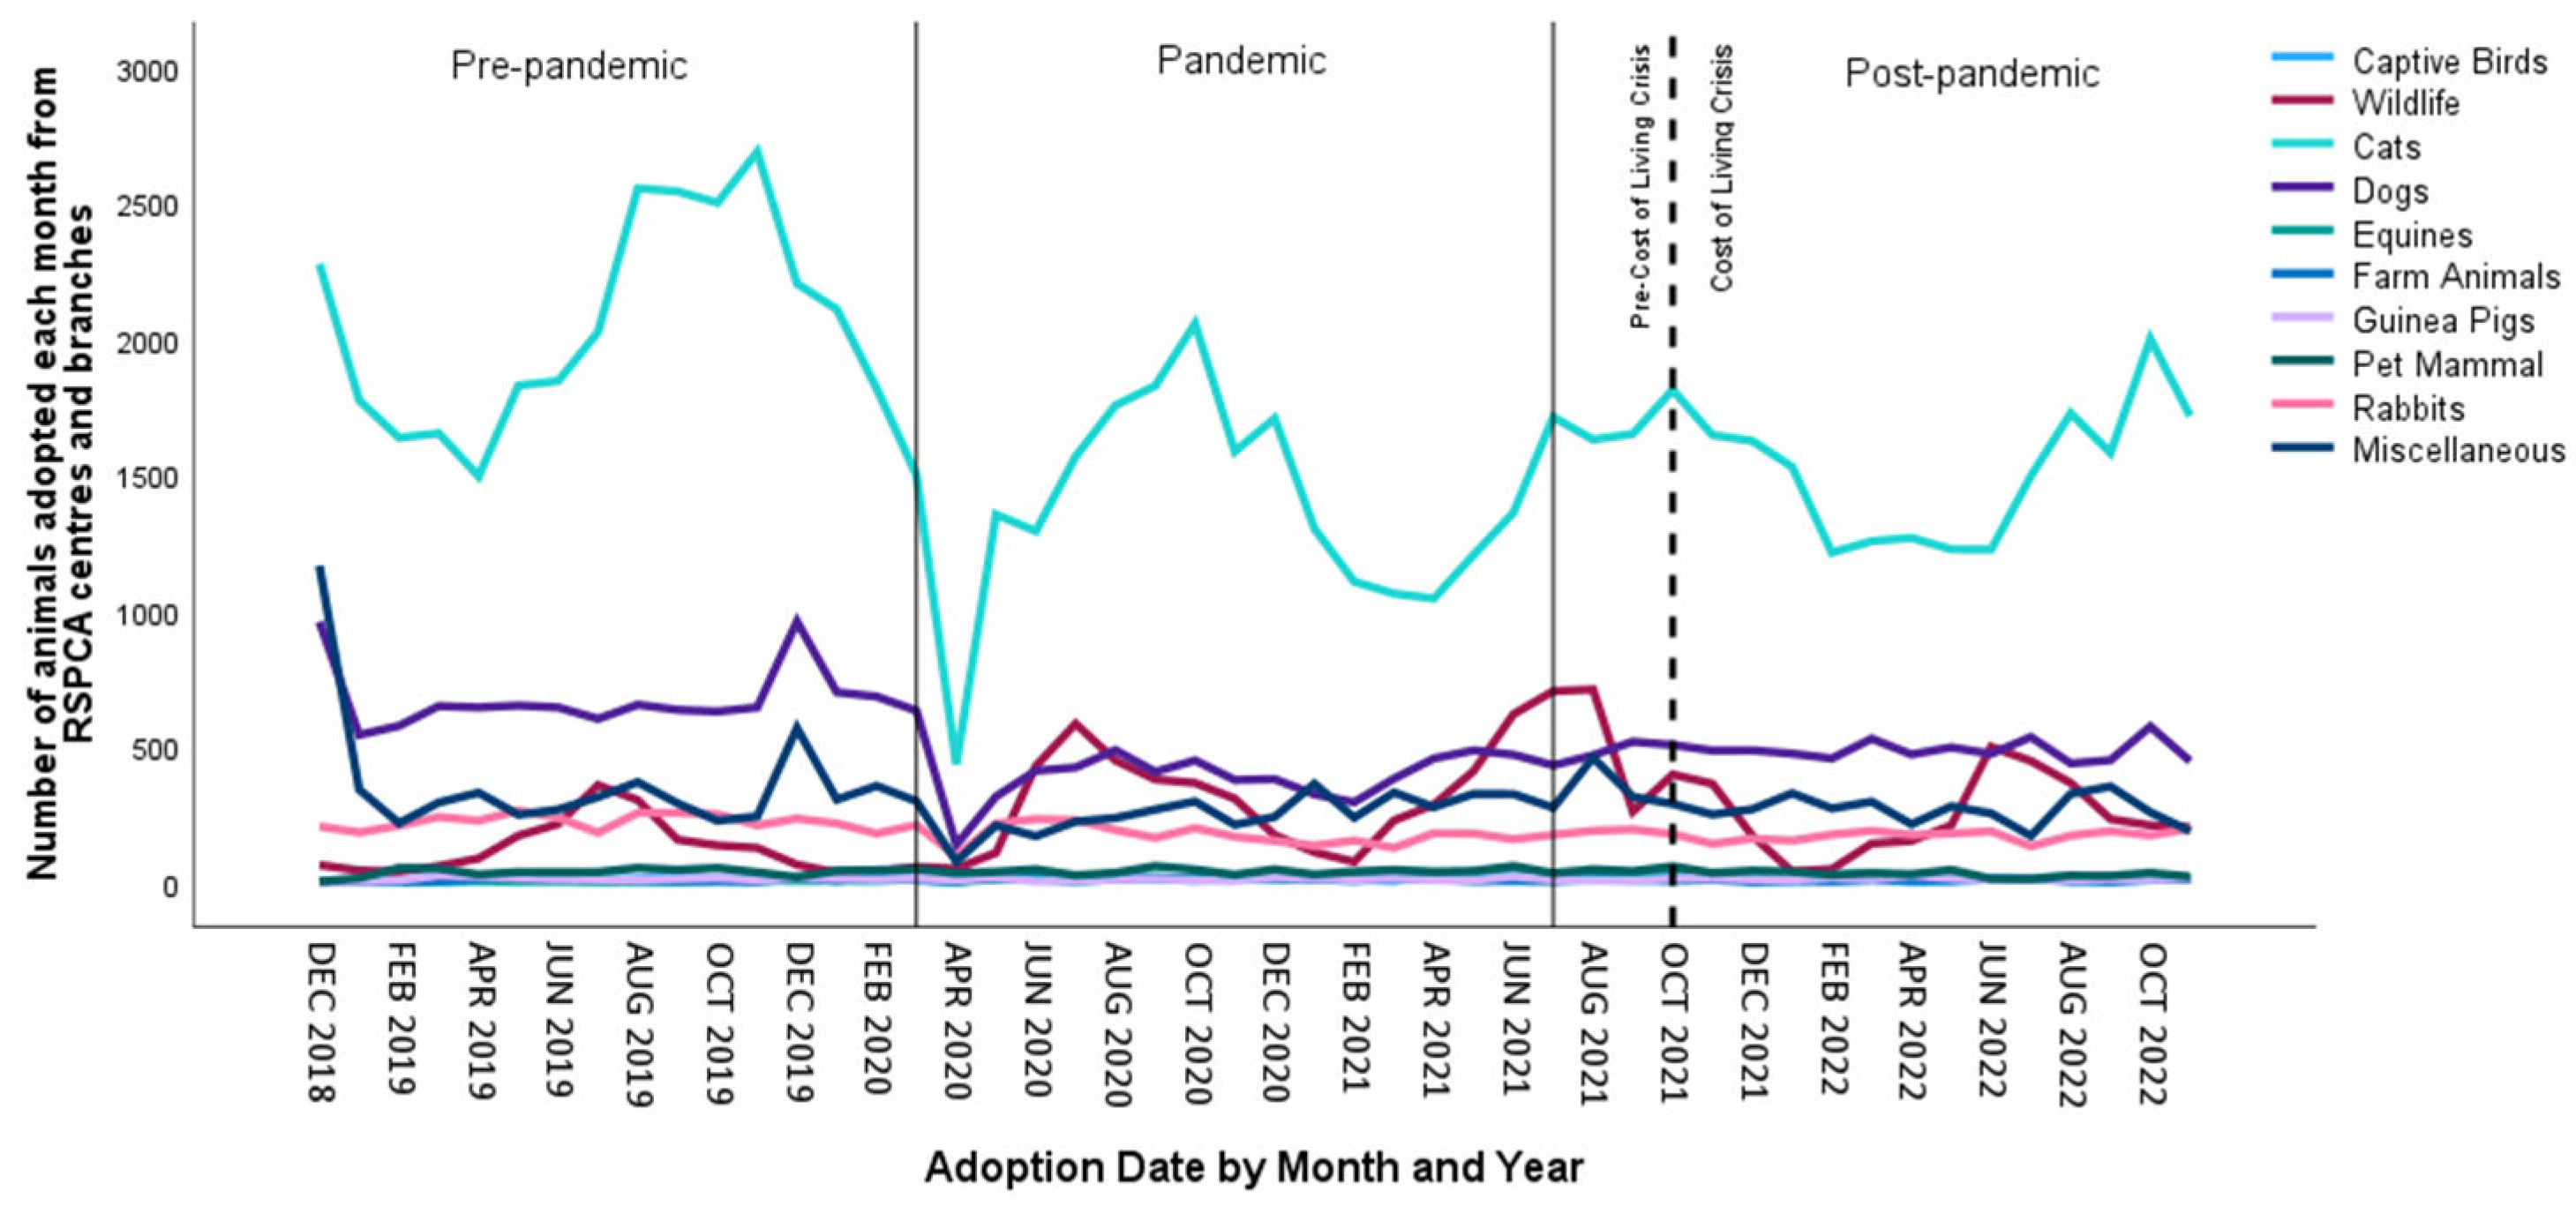
Figure 1 shows the total number of animals taken in each month by RSPCA centres and branches during the three time periods related to the pandemic and the two time periods related to the COLC.
Table 1 displays the means and standard deviations for the same time periods related to these two major events.
Figure 1 shows no clear trend across time for any animal type. When looking at cats, we can see evidence of some autocorrelation, meaning that points closer together tend to be more similar to each other than they are to points further apart. It also appears that cat intake peaks during the summer months of July–August in all years which shows seasonality. Wildlife intake also peaks during the summer.
- (a)
Animal Centres
One-way Anovas showed that there were significant differences in the numbers of animals taken in by RSPCA centres depending on the pandemic status for all categories except miscellaneous animals, with
F(2,45) = 1.64,
p = 0.103 and
η2 = 0.068—that is, for dogs,
F(2,45) = 20.22,
p < 0.001 and
η2 = 0.473; for cats,
F(2,45) = 19.58,
p < 0.001 and
η2 = 0.465; for rabbits,
F(2,45) = 4.92,
p = 0.006 and
η2 = 0.179; for equines,
F(2,45) = 5.63,
p = 0.004 and
η2 = 0.200; and for wildlife,
F(2,45) = 3.04,
p = 0.029 and
η2 = 0.119. Although not significant overall, a clear spike in the intake of miscellaneous animals is evident for the period around Christmas of 2020 (
Figure 1). This reflects an occurrence where a larger number (in this case, 1663) of animals had to be taken in at one point in time. As this reportedly happens from time to time, we did not consider it an outlier. Post hoc Tukey tests uncovered that significantly fewer dogs, cats and rabbits were taken in during the pandemic compared to before (all
p < 0.001). Following the pandemic, significantly more dogs (
p = 0.025) and rabbits (
p = 0.013) were taken in compared to during the pandemic, but most of the other animal categories showed a downward trend in intake post-pandemic. For dogs (
p < 0.001), cats (
p < 0.001), equines (
p = 0.003) and wildlife (
p = 0.023), significantly fewer animals were taken in post-pandemic compared to pre-pandemic.
- (ii)
Cost-of-Living Crisis
Contrary to our prediction, the numbers of animals taken in by centres during the COLC were actually lower than prior to the crisis for all animal types except rabbits (pre-COLC mean 250.24; COLC mean 252.21, t(46) = −0.10, p = 0.461). These trends were significant for cats (pre-COLC mean 2146.09; COLC mean 1855.86, t(45.94) = 2.57, p = 0.007), equines (pre-COLC mean 56.88; COLC mean 31.29, t(46) = 1.92, p = 0.031) and miscellaneous animals (pre-COLC mean 607.09; COLC mean 423.57, t(39.72) = 2.80, p = 0.004), but not for dogs (pre-COLC mean 731.74; COLC mean 689.43, t(44.60) = 0.922, p = 0.181) or wildlife (pre-COLC mean 540.03; COLC mean 408.71, t(46) = 1.21, p = 0.116).
- (b)
RSPCA Branches
One-way Anovas showed that there were significant differences in the numbers of animals taken in by RSPCA branches depending on the pandemic status for all categories except miscellaneous animals, with F(2,45) = 1.38, p = 0.131 and η2 = 0.058—that is, for dogs, F(2,45) = 45.84, p < 0.001 and η2 = 0.671; for cats, F(2,45) = 16.86, p < 0.001 and η2 = 0.428; for rabbits, F(2,45) = 6.80, p = 0.002 and η2 = 0.232; and for wildlife, F(2,45) = 4.20, p = 0.011 and η2 = 0.157. For dogs (p < 0.001), cats (p < 0.001) and rabbits (p = 0.003), significantly fewer animals were taken in during the pandemic. Post-pandemic, numbers rose again for dogs (p = 0.001), but not to pre-pandemic levels. For cats and rabbits, the rise in numbers post-pandemic was not significantly different to pandemic levels. Wildlife showed a distinctly opposite pattern with more animals being taken in during the pandemic (p = 0.008), and while this reduced post-pandemic, it remained higher than at pre-pandemic levels, although not significantly so. There was a downward trend in the intake of miscellaneous animals.
- (ii)
Cost-of-Living Crisis
Contrary to our prediction, and similar to the pattern in centres, the numbers of animals taken in by branches during the COLC were lower than prior to the crisis for all animal types. These trends were significant for cats (pre-COLC mean 1681.56; COLC mean 1477.00, t(45.57) = 2.35, p = 0.006) and rabbits (pre-COLC mean 185.38; COLC mean 166.93, t(42.50) = 1.83, p = 0.019), but not for miscellaneous animals (pre-COLC mean 352.65; COLC mean 290.14, t(46) = 1.13, p = 0.067), dogs (pre-COLC mean 521.38; COLC mean 488.86, t(40.04) = 1.01, p = 0.075) or wildlife (pre-COLC mean 513.88; COLC mean 404.07, t(46) = 1.02, p = 0.075).
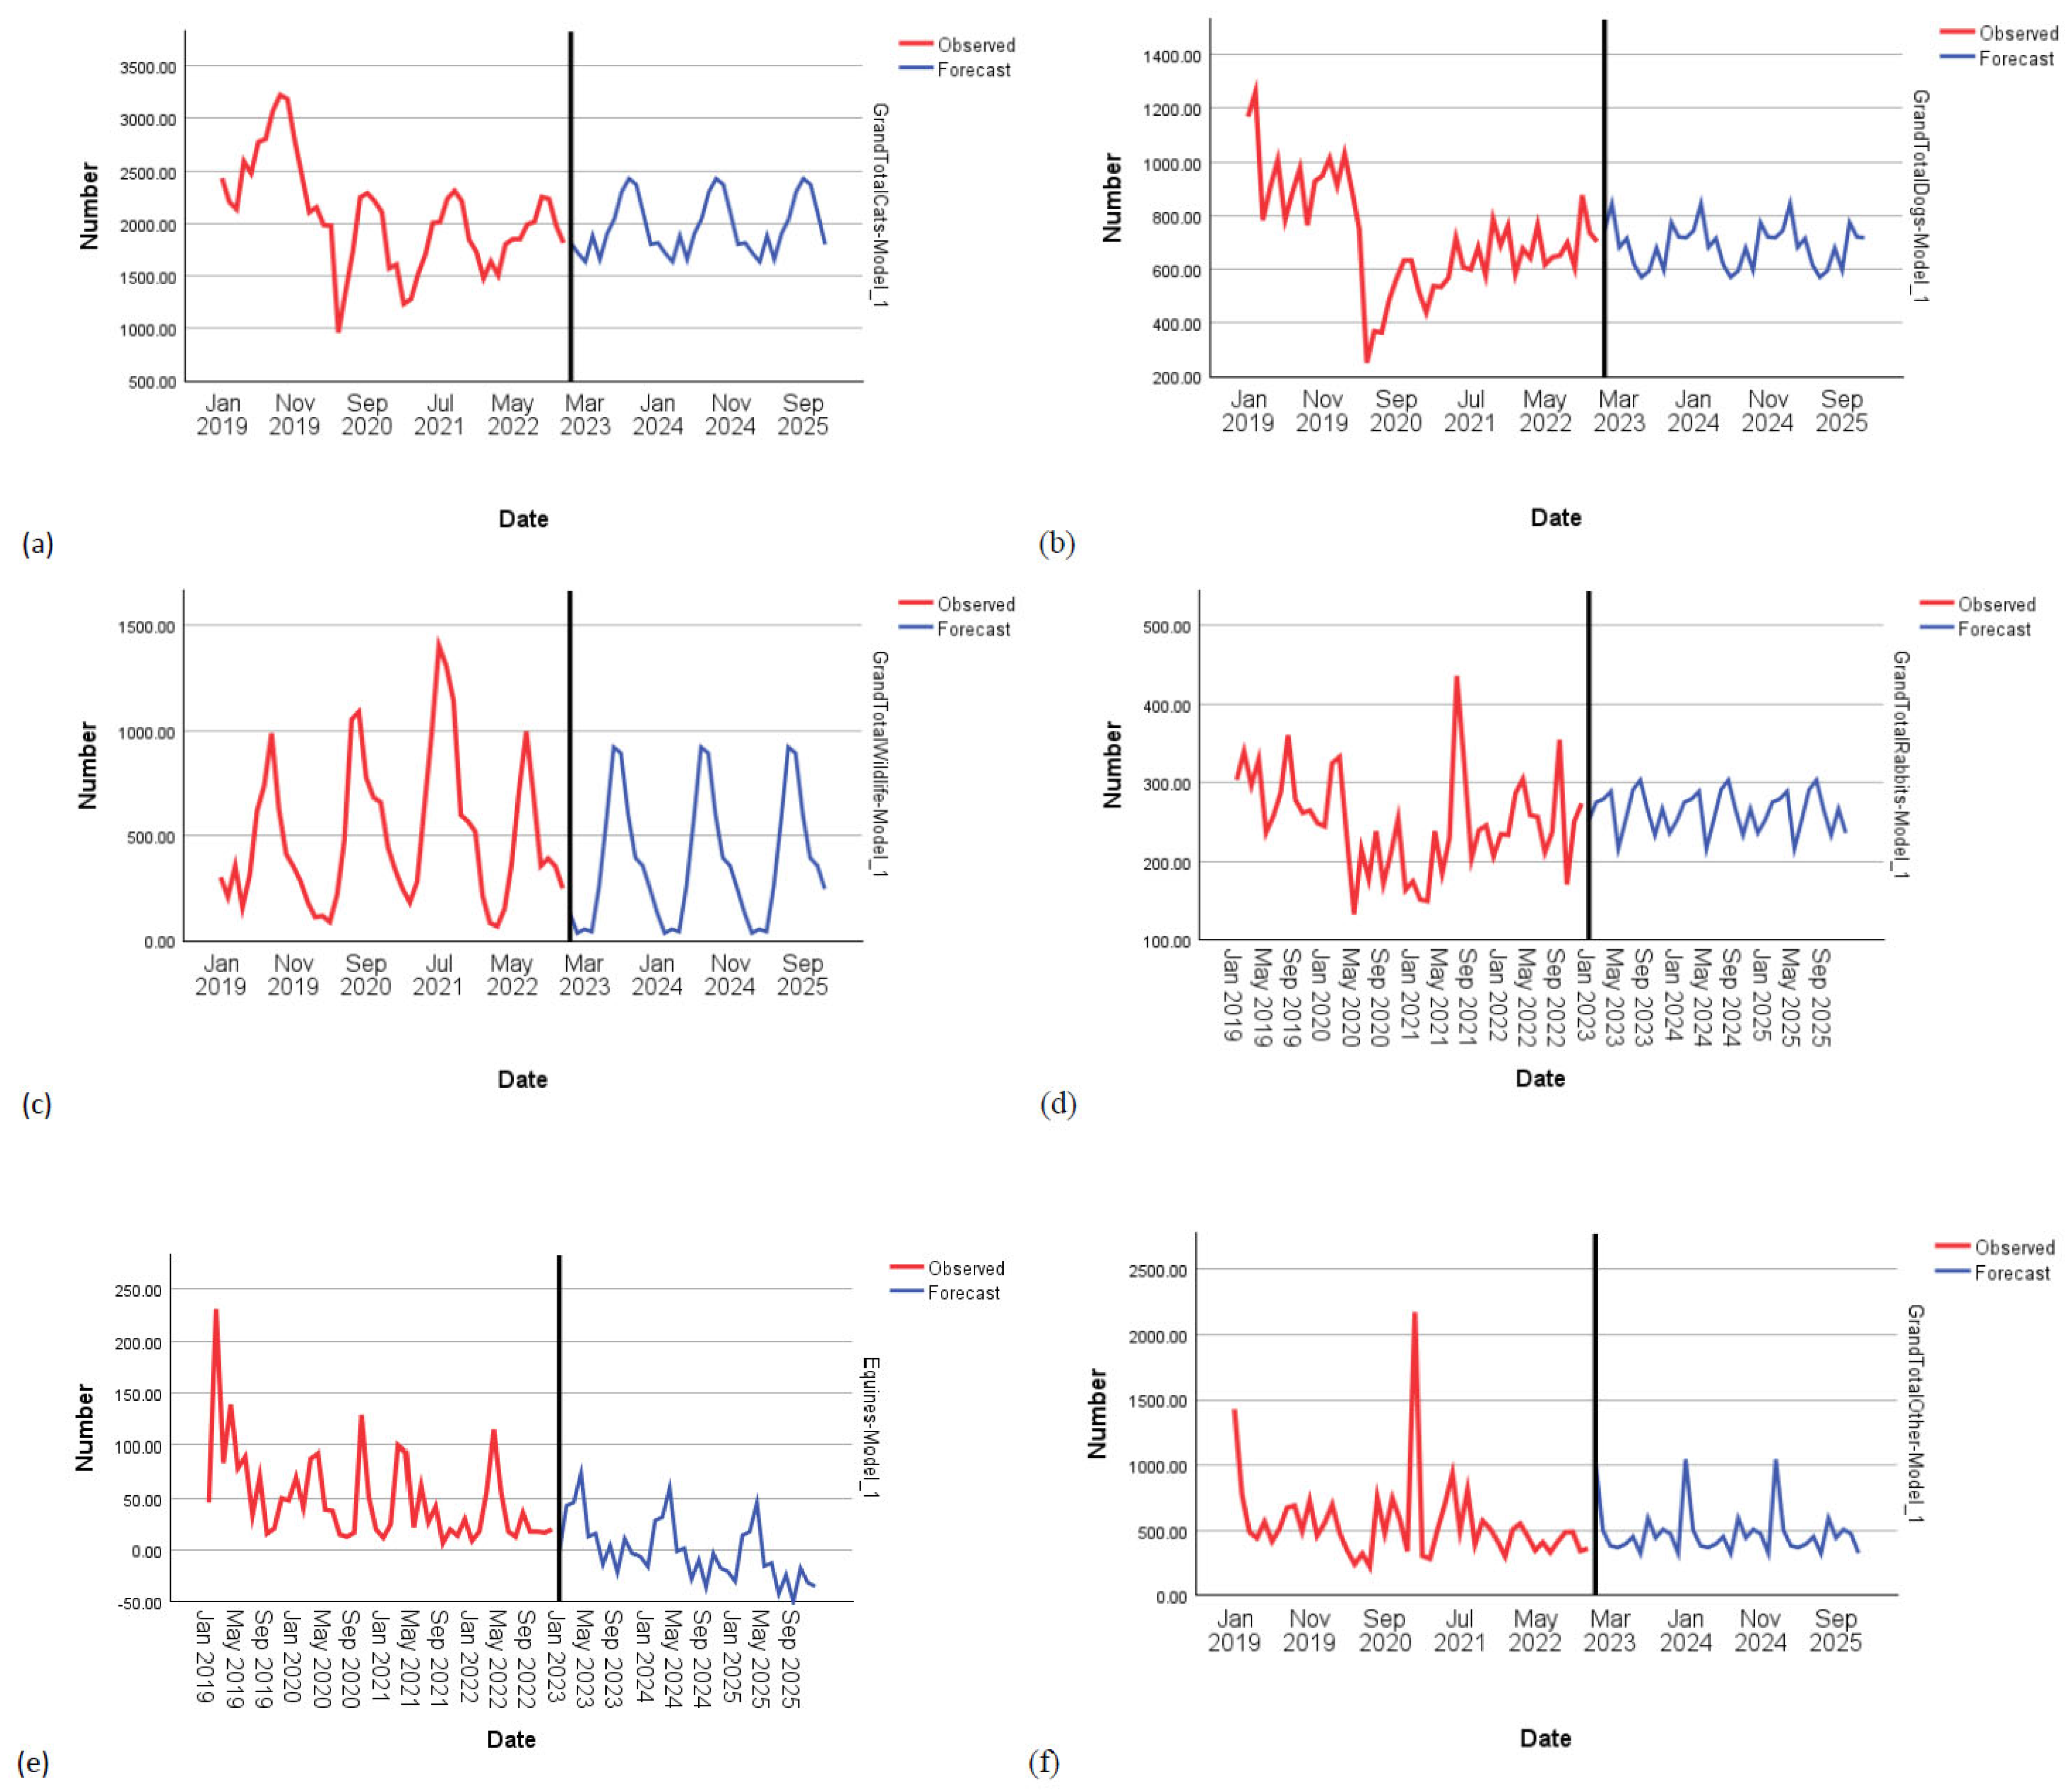
We then examined both the pandemic and the COLC in an interrupted time series model. As can be seen in
Figure 1, the patterns of intake over time are changeable. This makes the data appropriate for a time series analysis which has stationarity as an assumption as opposed to trending data.
Simple seasonal models were the best fit for rabbit (
R2 = 0.676,
p < 0.001), wildlife (
R2 = 0.616,
p < 0.001) and miscellaneous animal (
R2 = 0.852,
p < 0.001) intake, while a Winters’ Additive model fit the equine data better (
R2 = 0.871,
p < 0.001). ARIMA models were better for dogs (1,1,0)(0,0,0) and cats (0,1,3)(0,1,0) (
Figure 1). Taking dogs as an example, the numbers in brackets relate to the following parameters: 1 refers to autoregression (AR), the middle 1 refers to first differencing (simple upward trend for component I), and the final 0 refers to the moving average (MA) component. The closure of RSPCA sites significantly reduced the intake of dogs, with 157 fewer dogs per month (
R2 = 0.429,
p < 0.001) being taken in compared to when sites were open. The pandemic resulted in 764 fewer cats (
R2 = 0.586,
p < 0.001) and 507 fewer dogs (
R2 = 0.429,
p < 0.001) per month being taken in compared to pre-pandemic levels. The COLC had no effect in the time series analysis.
Table 2 below shows that the pandemic was responsible for significant reductions in dogs and cats being taken in, while the closure of RSPCA sites was responsible for fewer dogs being taken in.
Figure 2 shows the trends in the intake data for each animal type together with predictions forecasted to 2025.
3.2. Animal Adoptions from the RSPCA over Time
In total, 142,737 animals were adopted from the RSPCA over the four years, recorded as dogs, cats, rabbits, pet mammals, guinea pigs, captive birds, farm animals and equines at the centres, and as dogs, cats, rabbits, miscellaneous animals and wildlife at the branches. We include wildlife here, but it should be noted that wildlife are not rehomed but rather rehabilitated and released back into the wild.
Figure 3 shows the total adoptions of animals from the RSPCA over time. For cats, dogs and rabbits, this is a combined total from both centres and branches; for the remaining categories, the figures are from centres or branches only. The peaks for cat adoptions occur during the autumn months, which corresponds to the intake during the preceding summer months.
Table 3 below shows clearly that adoptions of dogs, cats and rabbits fell in the pandemic but started to rise again post-pandemic, but not yet to pre-pandemic levels. The COLC may have influenced the reduction in adoptions of these animals too.
- (a)
Animal Centres
One-way Anovas showed that there were significant differences in the numbers of animals adopted from RSPCA centres depending on the pandemic status, with F(2,45) = 9.51, p < 0.001 and η2 = 0.297 for cats, F(2,45) = 4.45, p = 0.009 and η2 = 0.165 for rabbits, and F(2,45) = 22.10, p < 0.001 and η2 = 0.496 for equines, with all other groups being not significant. Post hoc Tukey tests uncovered that significantly fewer cats were adopted during the pandemic compared to before (p < 0.001). However, significantly more equines were adopted during the pandemic compared to before (p < 0.001). Significantly fewer cats (p = 0.001) and rabbits (p = 0.007) were adopted post-pandemic compared to pre-pandemic (p < 0.001), while equines were adopted more post-pandemic compared to before (p < 0.001).
- (ii)
Cost-of-Living Crisis
Supporting our prediction, and in contrast to the pattern with intakes, the numbers of animals adopted from centres during the COLC were significantly lower than prior to the crisis for most animal types: cats (pre-COLC mean 241.94; COLC mean 195.92, t(45.96) = 1.68, p = 0.005), rabbits (pre-COLC mean 34.94; COLC mean 26.00, t(46) = 1.96, p = 0.025), pet mammals (pre-COLC mean 38.37; COLC mean 27.69, t(46) = 2.74, p = 0.002) and farm animals (pre-COLC mean 7.57; COLC mean 4.85, t(46) = 1.74, p = 0.022). These reductions were not significant for captive birds (pre-COLC mean 12.34; COLC mean 10.23, t(46) = 0.84, p = 0.102) or dogs (pre-COLC mean 76.06; COLC mean 74.38, t(43.00) = 0.28, p = 0.195). For equines (pre-COLC mean 10.77; COLC mean 15.92, t(46) = −1.67, p = 0.025) and guinea pigs (pre-COLC mean 9.66; COLC mean 11.46, t(46) = −1.00, p = 0.070), there were more adoptions during the COLC.
- (b)
RSPCA Branches
One-way Anovas showed that there were significant differences in the number of animals adopted from RSPCA branches depending on the pandemic status for dogs, with F(2,45) = 38.75, p < 0.001 and η2 = 0.633, cats, with F(2,45) = 12.75, p < 0.001 and η2 = 0.362, rabbits, with F(2,45) = 16.66, p < 0.001 and η2 = 0.425, and miscellaneous animals, with F(2,45) = 2.55, p = 0.045 and η2 = 0.102. Significantly fewer dogs, cats and rabbits (all p < 0.001) were adopted during the pandemic compared to pre-pandemic, although this was not significant for miscellaneous animals. For wildlife, however, significantly more animals were released during the pandemic, with F(2,45) = 6.97, p = 0.001 and η2 = 0.236, and there was a significant increase post-pandemic compared to before (p = 0.013). Significantly fewer dogs (p < 0.001), cats (p = 0.001) and rabbits (p < 0.001) were adopted post-pandemic compared to pre-pandemic (p < 0.001), while equines were adopted more post-pandemic compared to before (p < 0.001).
- (ii)
Cost-of-Living Crisis
Supporting our prediction, and in contrast to the pattern with intakes, the numbers of animals adopted from branches during the COLC were significantly lower than prior to the crisis for dogs (pre-COLC mean 451.40; COLC mean 409.31, t(41.329) = 1.43, p = 0.040), cats (pre-COLC mean 1468.49; COLC mean 1303.08, t(46) = 1.36, p = 0.045) and rabbits (pre-COLC mean 160.06; COLC mean 143.54, t(40.482) = 2.42, p = 0.005), but not for miscellaneous animals (pre-COLC mean 311.49; COLC mean 264.23, t(46) = 0.980, p = 0.083) or wildlife (pre-COLC mean 244.03; COLC mean 235.54, t(46) = 0.141, p = 0.222).
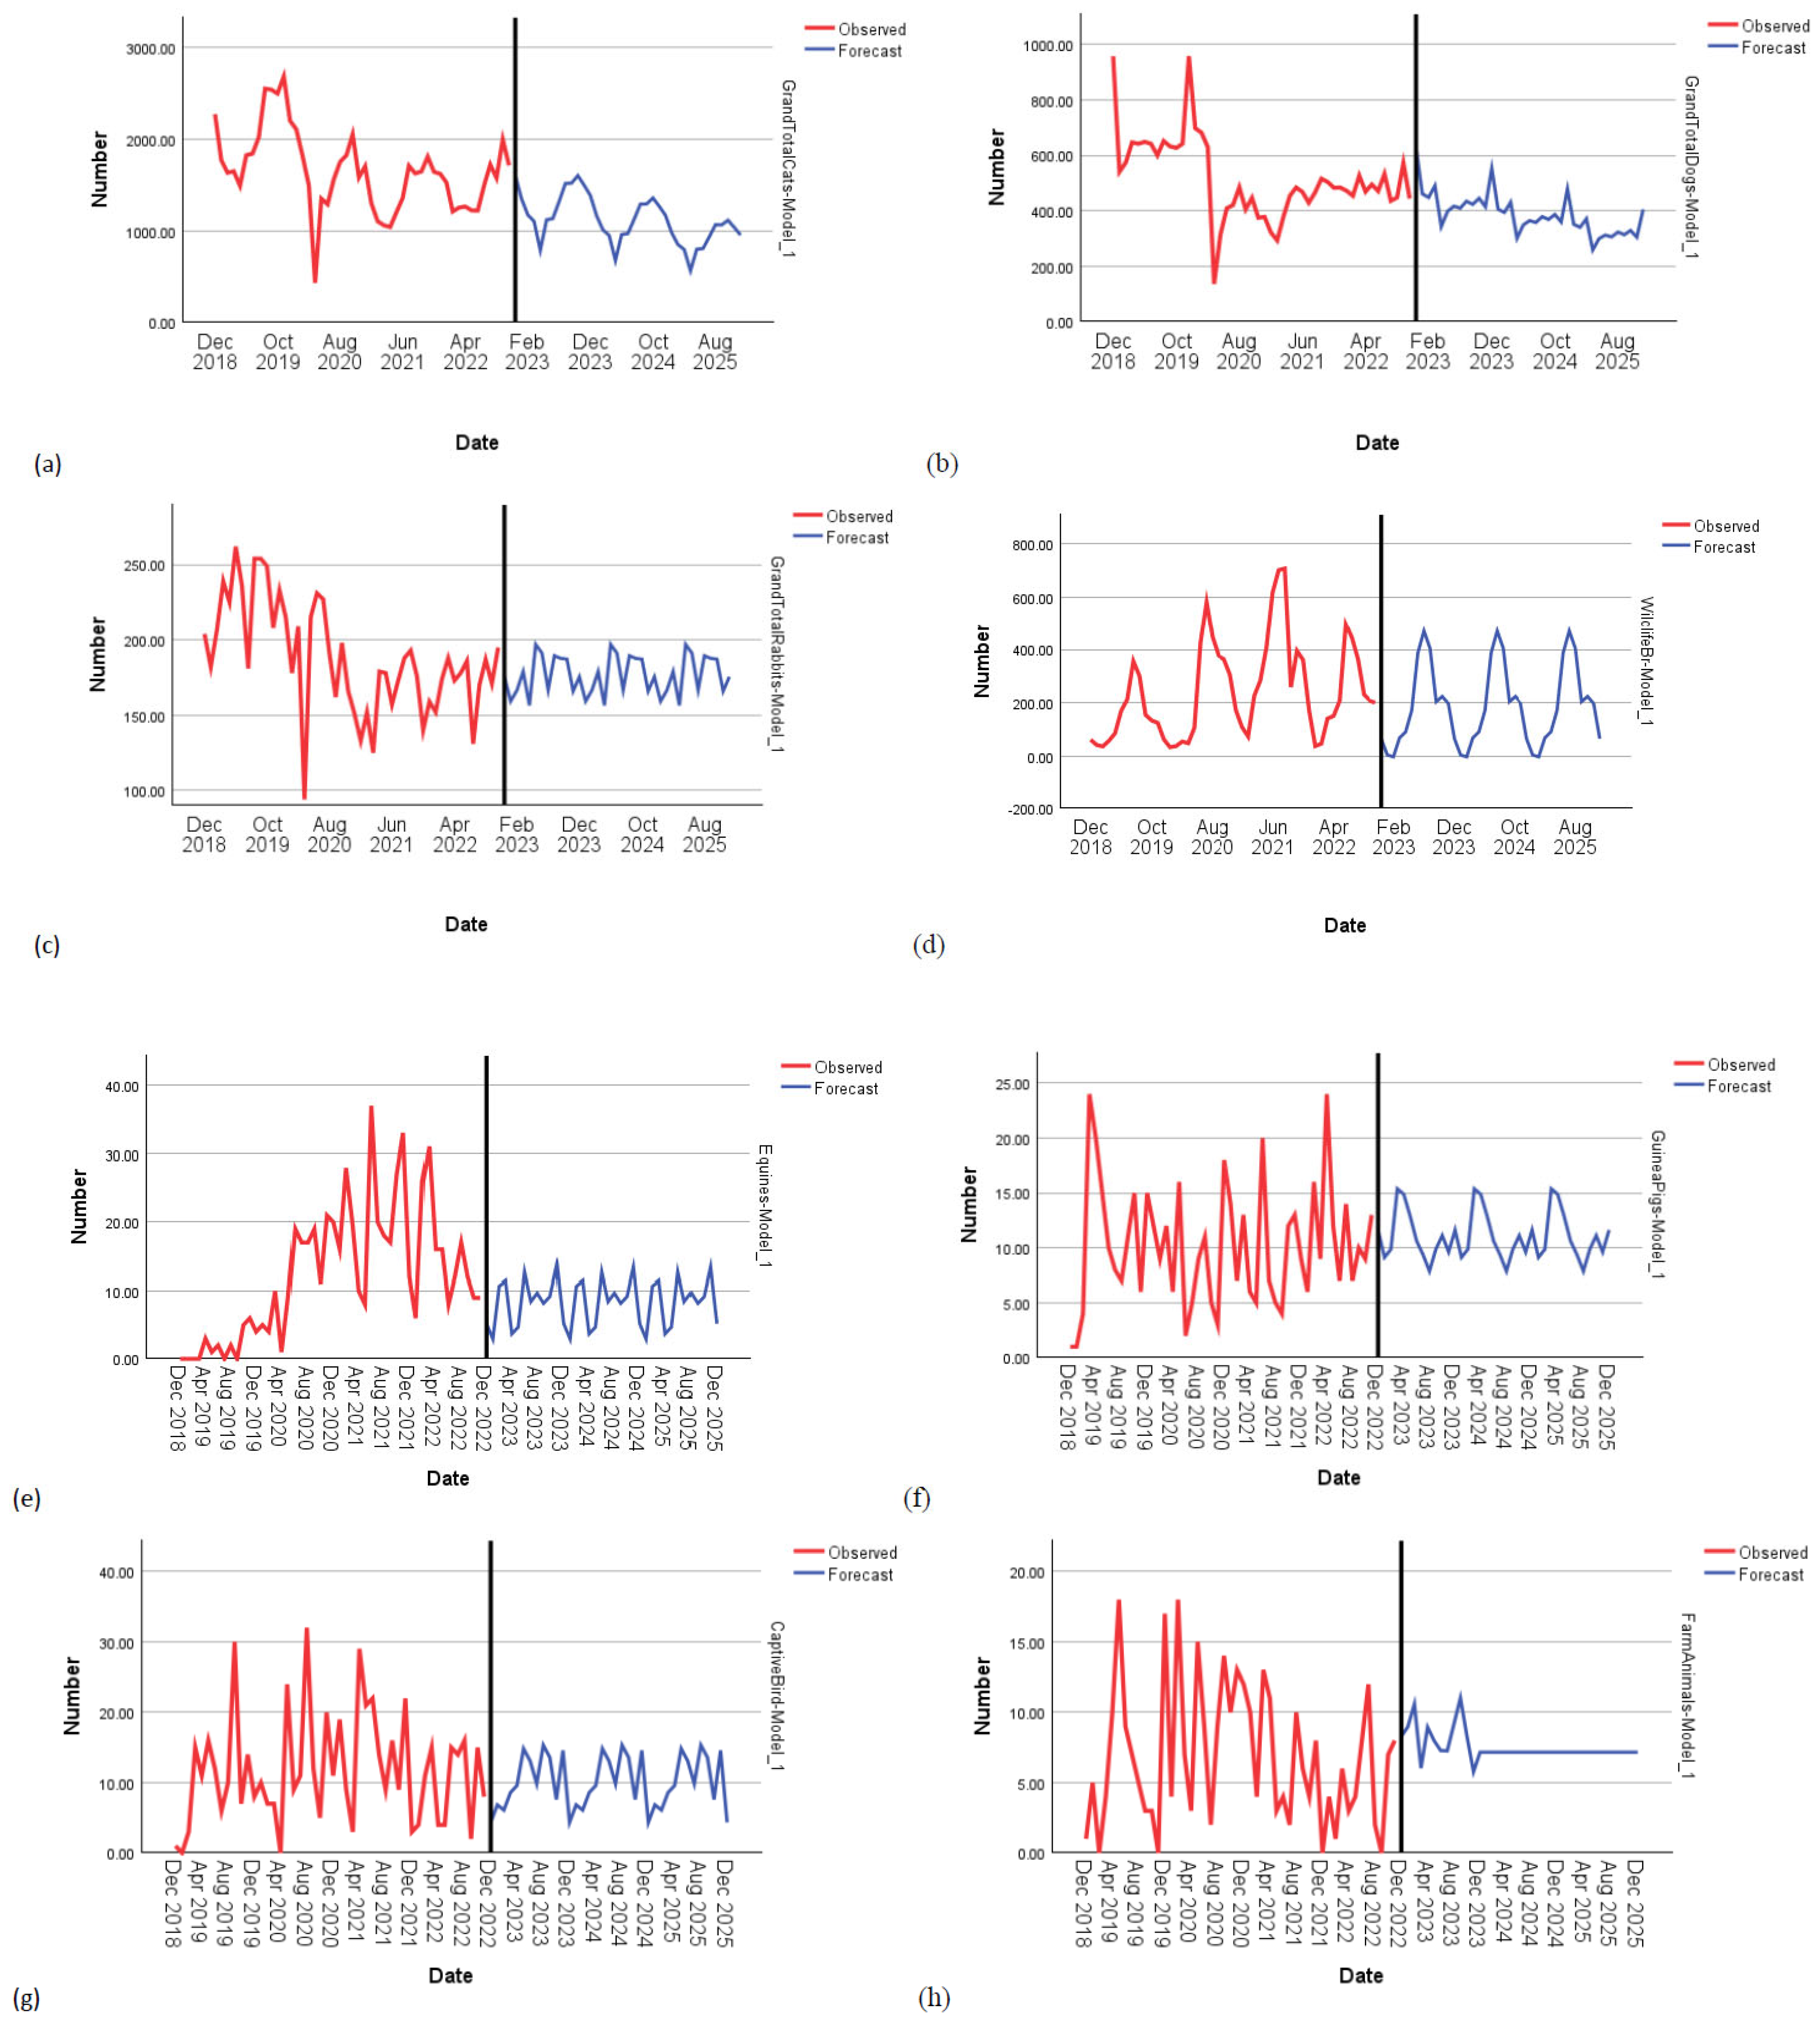
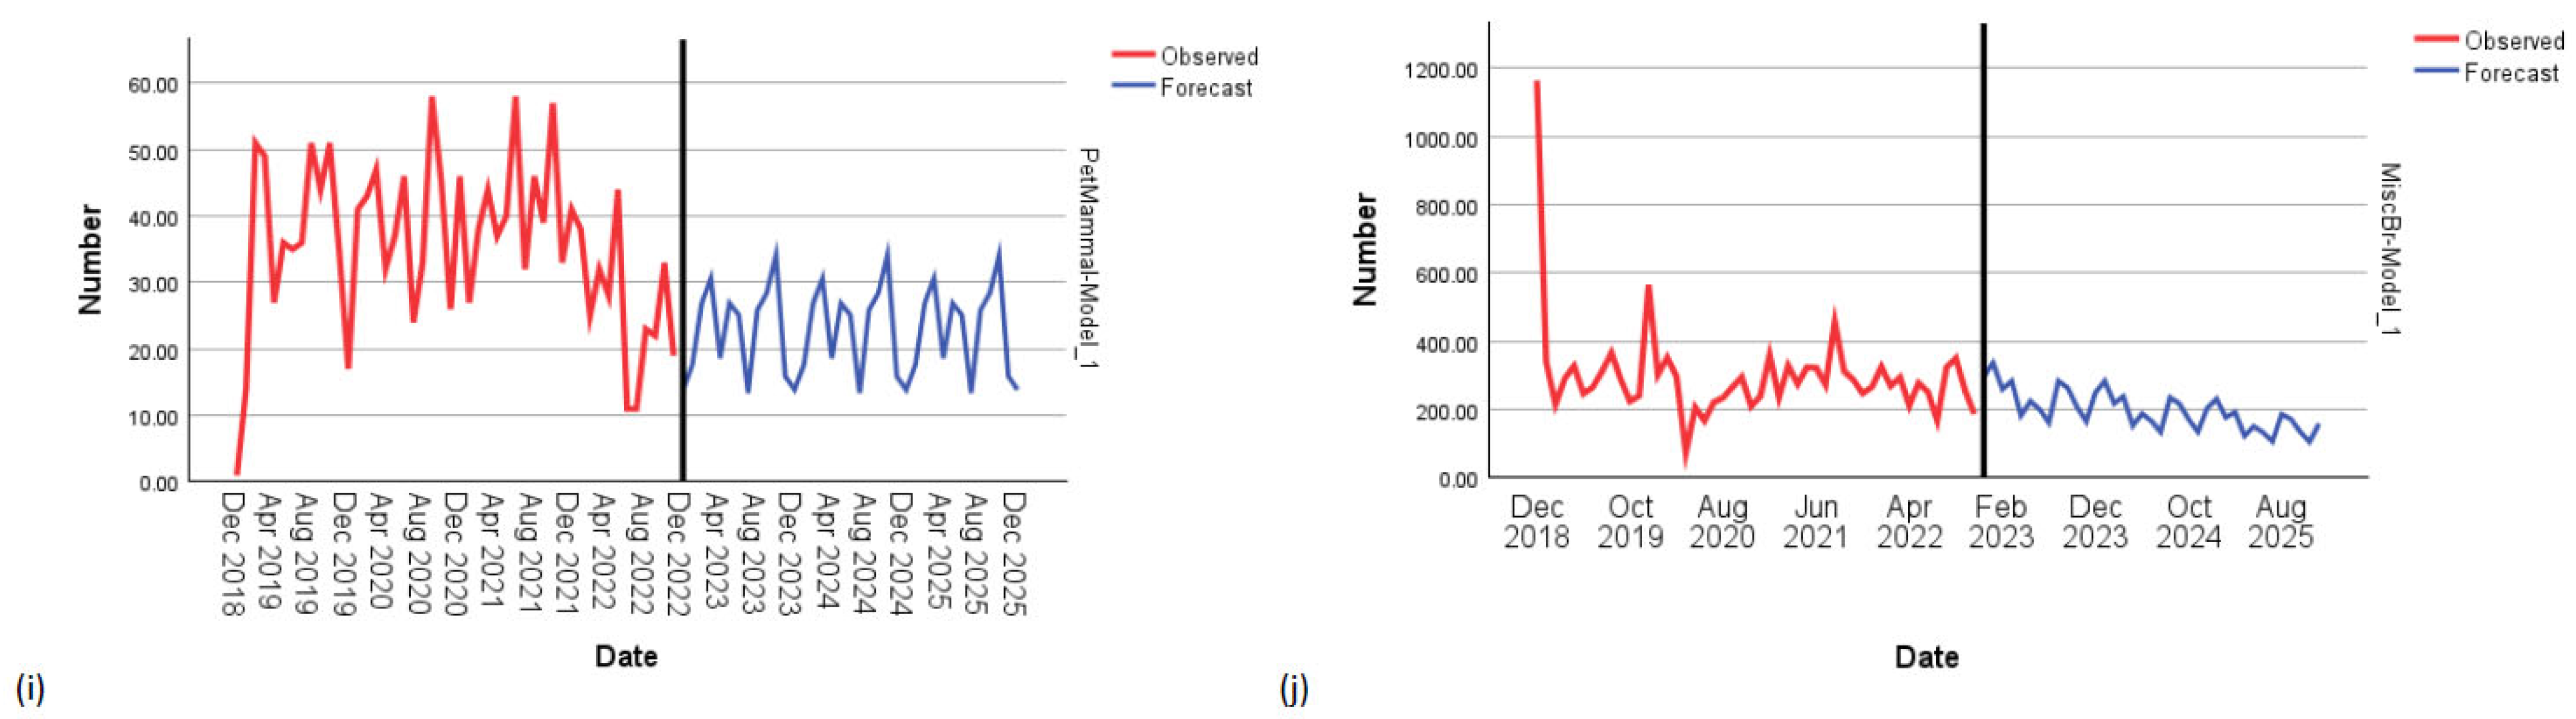
We then examined both the pandemic and the COLC in an interrupted time series model, along with closure as a covariate. As can be seen in
Figure 3, the patterns of adoption over time are also changeable.
Simple seasonal models were the best fit for pet mammal (
R2 = 0.766,
p < 0.001), guinea pig (
R2 = 0.805,
p < 0.001), captive bird (
R2 = 0.824,
p < 0.001) and equine (
R2 = 0.665,
p < 0.001) adoptions, and for wildlife release (
R2 = 0.704,
p < 0.001). ARIMA models were better for dogs (0,1,0)(0,0,0), cats (0,1,0)(1,0,0), rabbits (0,1,1)(0,0,0) and farm animals (0,0,0)(0,0,1). For miscellaneous animals, a Winters’ Multiplicative model was the best fit (
R2 = 0.624,
p < 0.001) (
Figure 3). The closure of RSPCA sites significantly reduced the adoption of animals, with 520 fewer cats per month (
R2 = 0.484,
p < 0.001) and 57 fewer rabbits (
R2 = 0.388,
p < 0.001) per month. The pandemic significantly impacted the adoption of animals, with 997 fewer cats (
R2 = 0.484,
p < 0.001) and 494 fewer dogs (
R2 = 0.326,
p < 0.001) being adopted each month.
Table 4 below shows that the pandemic and the closure of the RSPCA were responsible for significant changes in the adoption of animals.
Figure 4 shows the trends in the adoption data for each animal type together with predictions forecasted to 2025.
- a.
Length of Stay before Adoption
We also examined adoption by the length of stay for cats (
Table 5), dogs (
Table 6) and rabbits (
Table 7).
Table 5 shows that cats stayed waiting to be rehomed for longer during the pandemic than pre-pandemic (
p < 0.001) and longer again post-pandemic (
p < 0.001). One-way Anova showed these differences to be significant (
F(2) = 146.35,
p < 0.001,
η2 = 0.024). It is noteworthy that the length of stay increased despite the number of cats decreasing.
Table 6 shows that dogs stayed waiting to be rehomed for longer during the pandemic than pre-pandemic (
p < 0.001), but in contrast to the picture with cats, the length of stay returned to pre-pandemic levels in the post-pandemic period (
p < 0.001). One-way Anova showed these differences to be significant (
F(2) = 9.944,
p < 0.001,
η2 = 0.005).
Table 7 shows that rabbits stayed waiting to be rehomed for longer during the pandemic than pre-pandemic (
p < 0.001) and longer again post-pandemic (
p < 0.001). One-way Anova showed these differences to be significant (
F(2) = 102.047,
p < 0.001,
η2 = 0.109). It is noteworthy that the length of stay increased despite the number of rabbits decreasing.
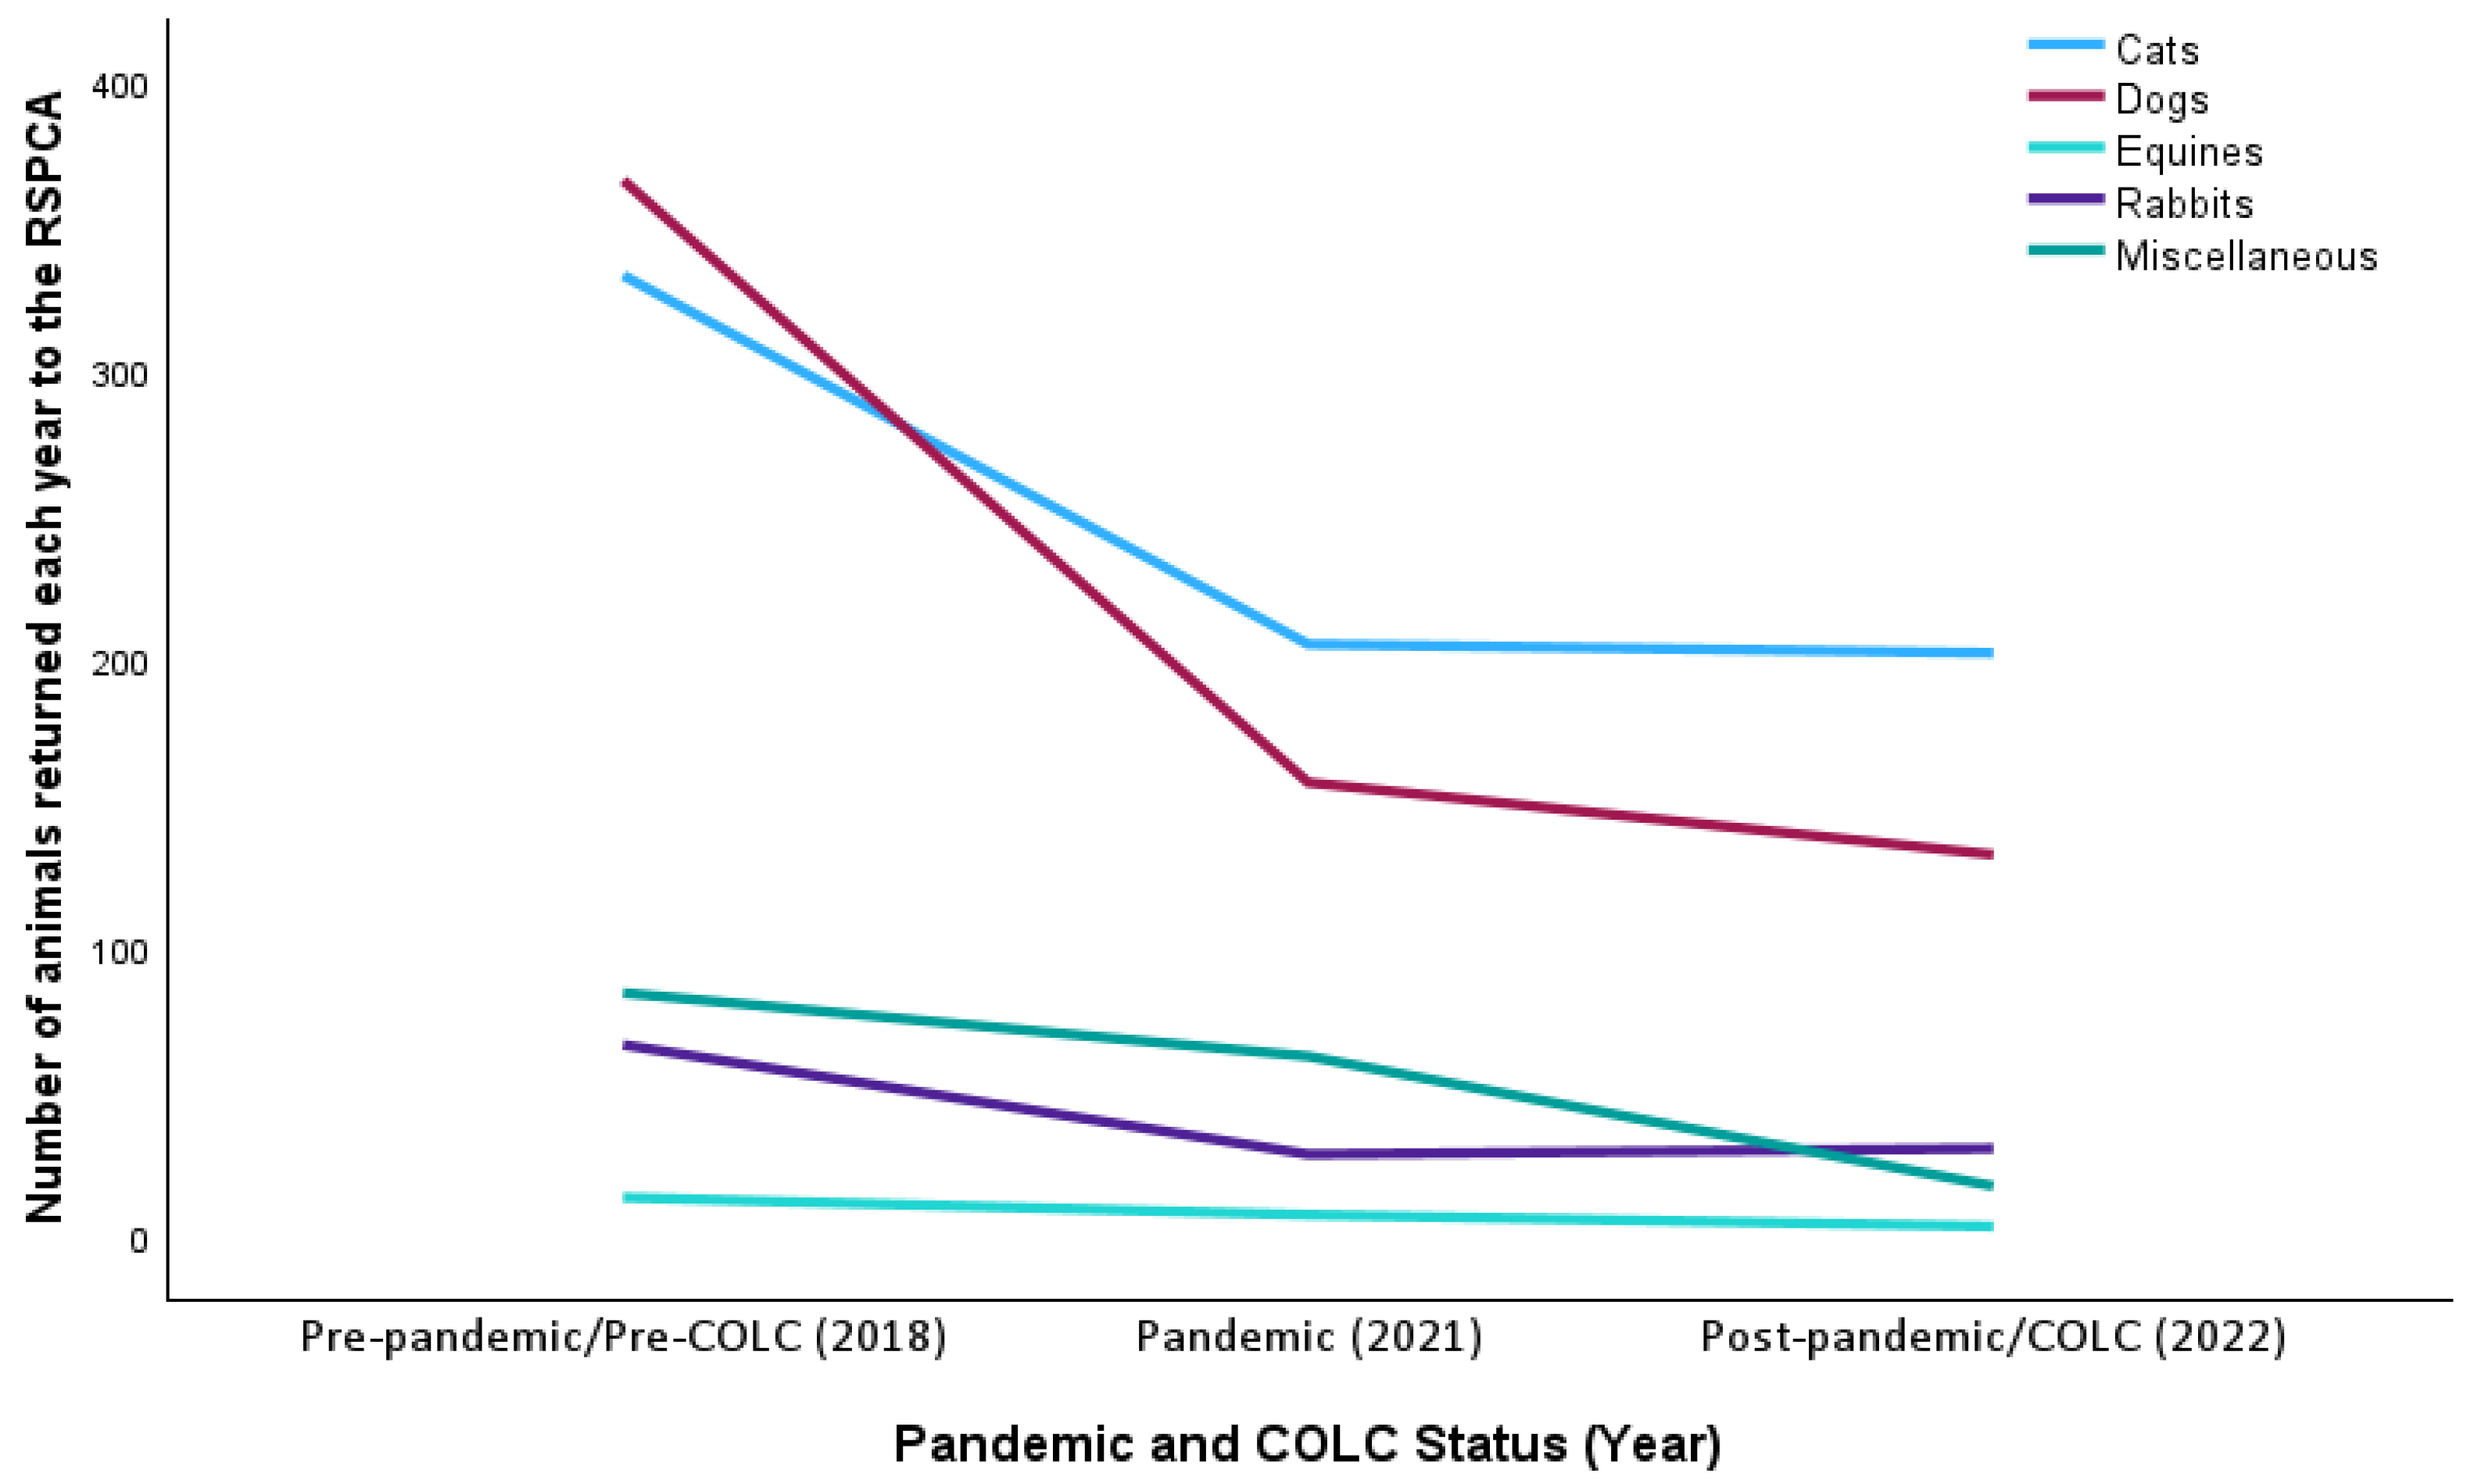
3.3. Animals Returned to RSPCA over Time
The data provided by the RSPCA for returns were coded in a different way, not separated into centres and branches, and recorded purely by year. Unfortunately, due to a system change in record-keeping, there were no return data available for 2019 or 2020. So, for return data only, we decided to code the year 2018 as pre-pandemic, 2021 as pandemic and 2022 as post-pandemic. For the COLC, we compared 2022 with 2018. Returns were recorded for cats, dogs, equines, rabbits and miscellaneous animals (
Figure 5).
- (i)
COVID-19 Pandemic
Figure 3 shows a downward trend in returns for all animal types except rabbits, for which returns dropped during the pandemic but rose again post-pandemic.
- (ii)
Cost-of-Living Crisis
Through a comparison of the data from 2018, representing before the COLC, with 2022, during the crisis, a similar downward trend in the return of all animal types is clear.
As the numbers were smaller and restricted to records by year only, we decided not to run analyses of variance and the ITS on the return data. However, we examined the data in more detail in terms of time after adoption and reasons for returns.
Table 8 shows that for all animal types, fewer animals were returned within six months of having been adopted.
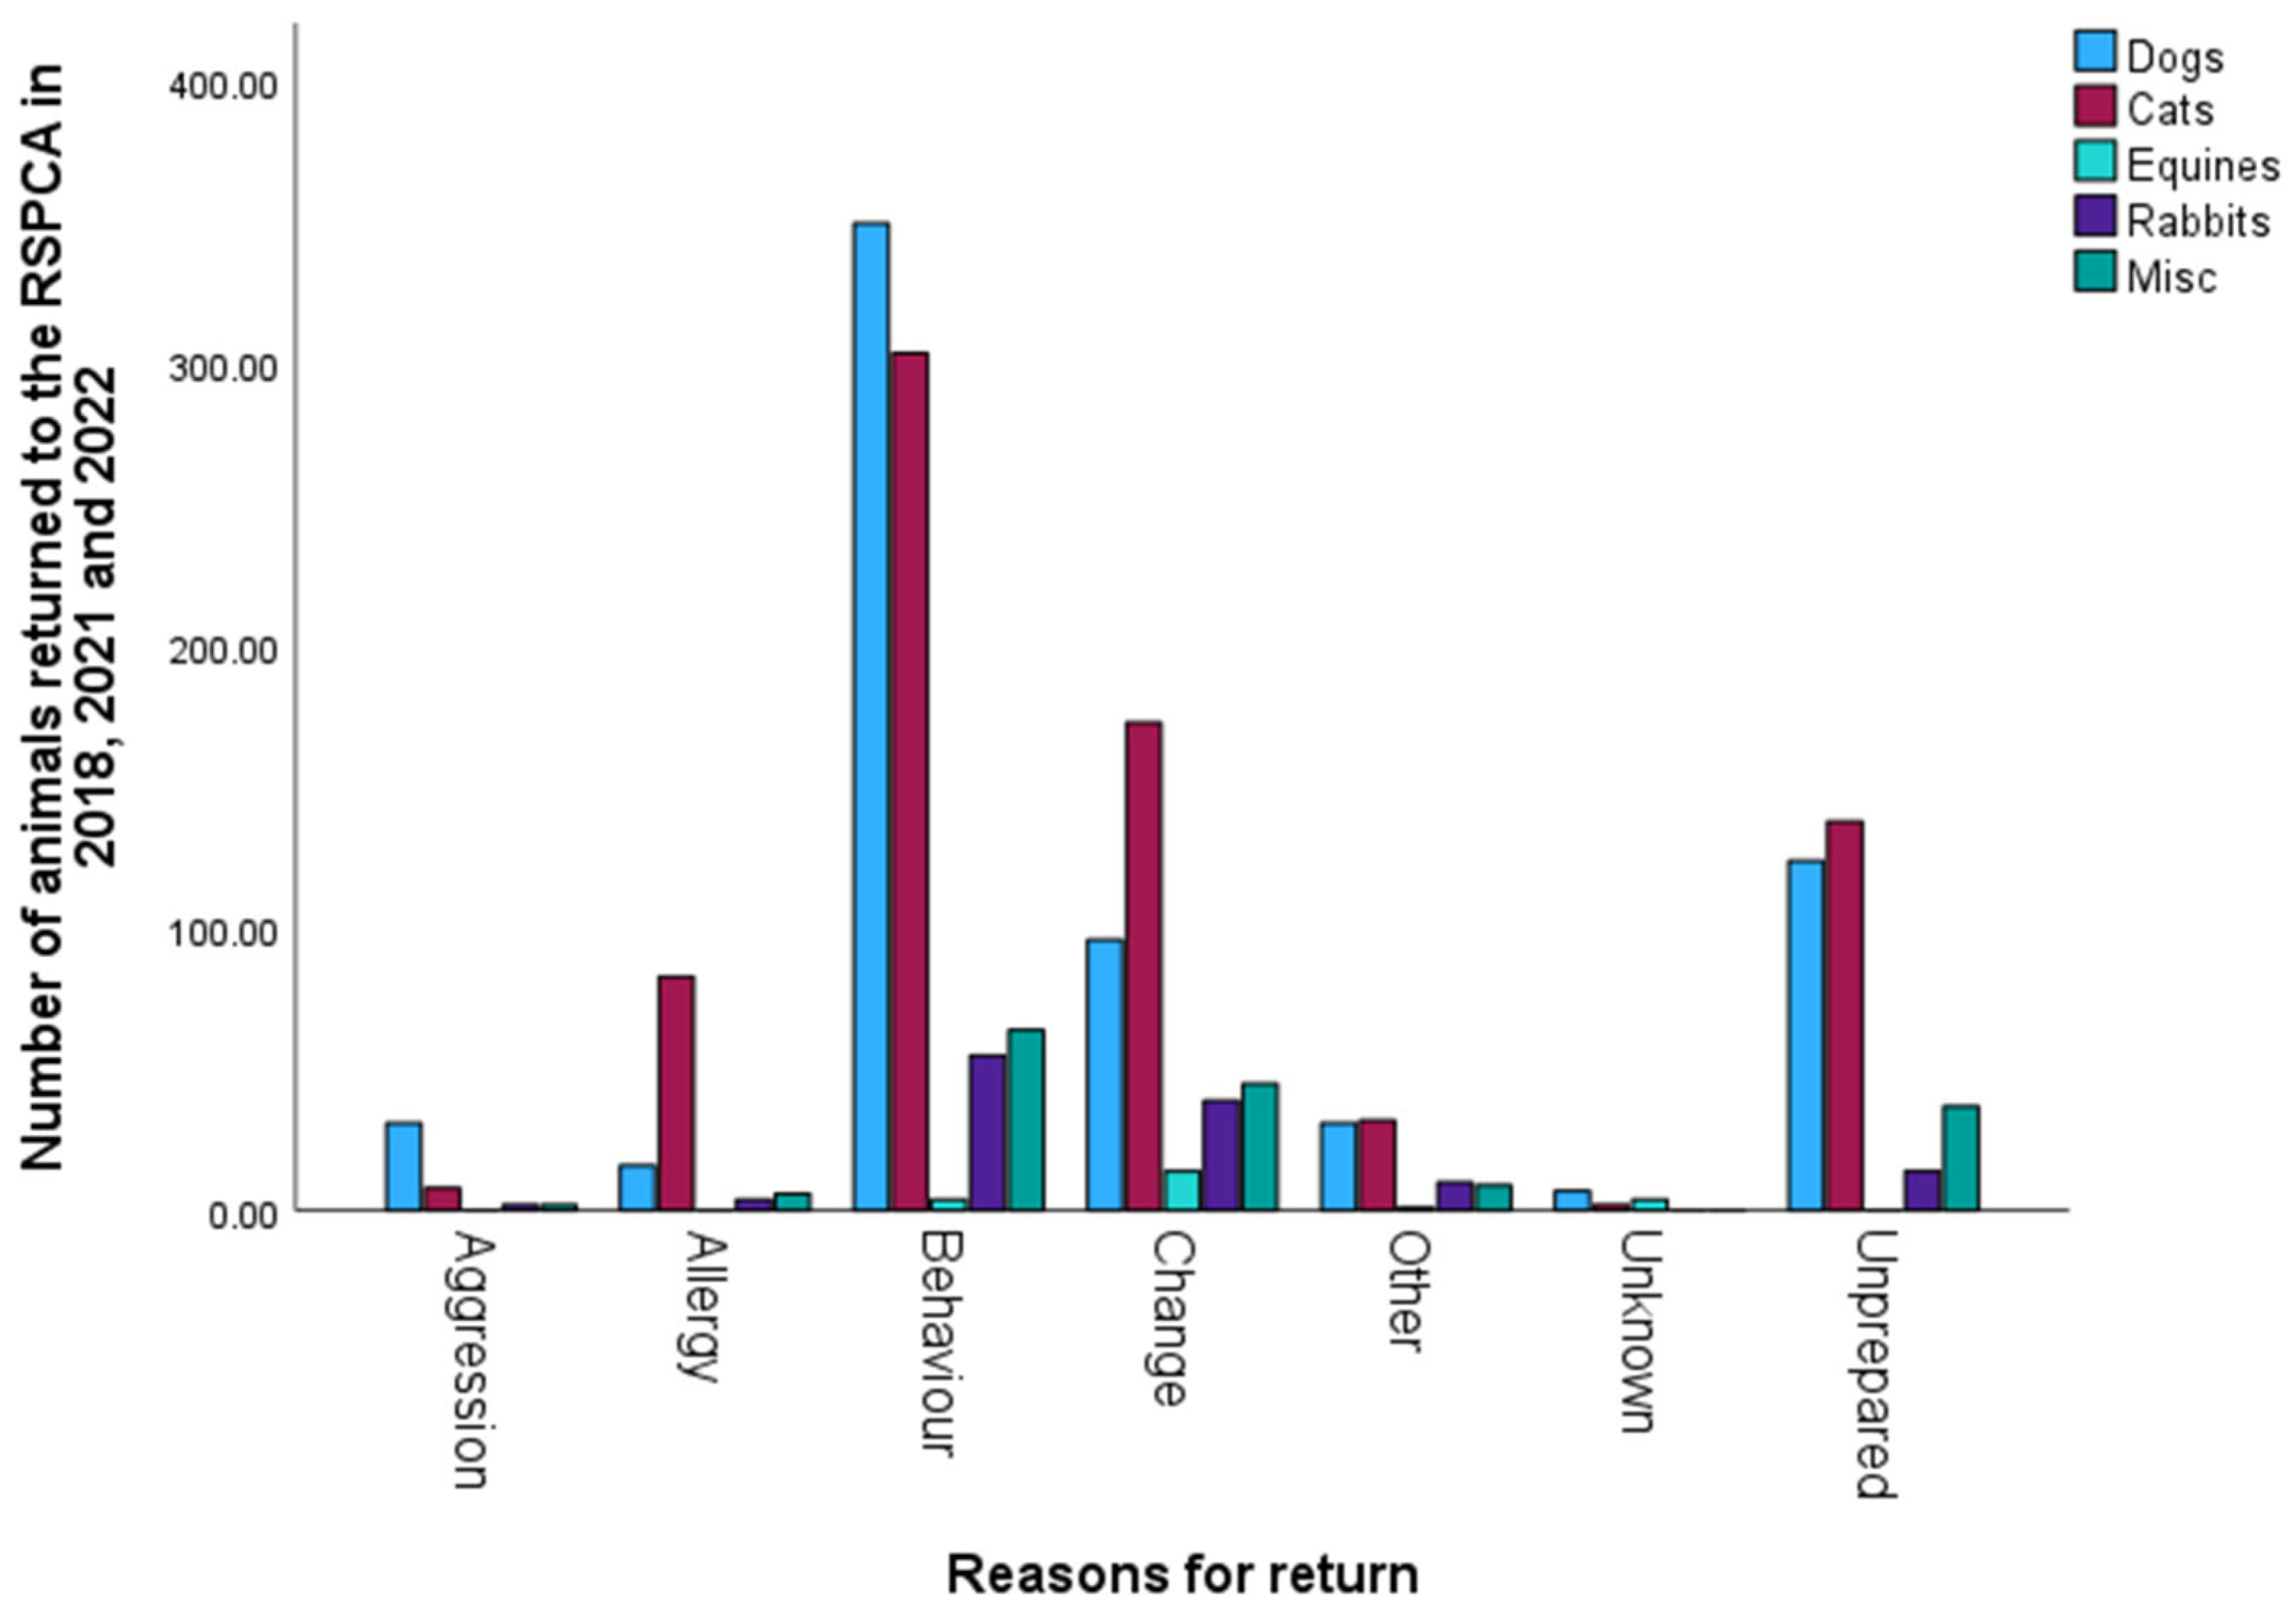
When animals were returned to the RSPCA, a record was made of the reasons, and these were categorised into the following: aggression, behavioural traits, change in financial position/environment, owner allergy, and unprepared for commitment. There was also an unknown category and the following categories, which we combined into ‘other’: centre management discretion, elective intake, stray dog, cat or equine and RSPCA-generated. Temporary boarding for equines and an ’unowned sick/injured’ category for miscellaneous animals (both having counts < 5) were not included as they were deemed not to be returned animals.
Significant associations were found between each animal type and the reasons they were returned to the RSPCA (
Figure 6). Dogs were more likely to be returned due to behaviour problems, followed by owners being unprepared for the commitment and a change in circumstances (χ
2(30) = 3275,
n = 655,
p < 0.001). Cats were returned more often due to behavioural issues, a change in circumstances and owners being unprepared (χ
2(36) = 4440,
n = 740,
p < 0.001). For equines, most returns were due to a change in circumstances (χ
2(6) = 46,
n = 23,
p < 0.001). Rabbits were returned more often due to behavioural issues and a change in circumstances (χ
2(25) = 620,
n = 124,
p < 0.001). Behavioural issues, a change in circumstances and owners being unprepared were also the main reasons why miscellaneous animals were returned (χ
2(25) = 815,
n = 163,
p < 0.001).


