Simple Summary
Avian leukosis is a vertically transmitted disease that severely impacts the development of indigenous chicken breeds in China. This study aimed to identify genetic resistance factors against avian leukosis virus subgroup J in Chengkou mountain chickens. By analyzing 500 laying hens using whole-genome sequencing, researchers discovered key genes and signaling pathways associated with disease resistance, which may influence immune responses and cellular functions to combat viral infection. These findings provide valuable molecular markers for breeding disease-resistant chickens and offer new insights into the pathogenesis and control strategies of avian leukosis, contributing to sustainable poultry farming.
Abstract
Avian leukosis (AL), a major vertically transmitted infectious disease, poses a significant challenge to the conservation and industrial development of indigenous chicken breeds in China. In this study, Chengkou mountain chickens were used as a model to systematically identify genetic markers associated with resistance to avian leukosis virus subgroup J (ALV-J) through a genome-wide association study (GWAS). Genomic DNA was extracted from 500 hens at 300 days of age, and cloacal swabs, plasma, and egg white samples were collected to assess the ALV-J infection status. A total of 325 ALV-positive (ALV+) and 175 ALV-negative (ALV−) individuals were identified. Based on 10× whole-genome resequencing and stringent quality control, 12,644,463 high-quality SNPs were obtained. GWAS revealed a significant enrichment of SNPs on chromosome 6 (Chr6), from which 218 SNPs significantly associated with ALV-J resistance and 49 candidate genes were identified. Gene Ontology (GO) and Kyoto Encyclopedia of Genes and Genomes (KEGG) enrichment analyses showed that many of these genes, including PTPN13, TTF2, TIAL1, DLG2, FBXL7, CDH5, and CDH11, are involved in tumorigenesis and immunosuppression through the JAK/STAT signaling pathway and cell adhesion molecule pathways. Additionally, candidate genes, such as ANKH, SLC4A7, and SLC5A1, were found to potentially regulate ALV-J infection by modulating membrane transport and inflammatory responses. This study is the first to identify ALV-J resistance-associated genetic markers in Chengkou mountain chickens, revealing key genes related to immune regulation, membrane function, and tumor development. The findings provide a foundational molecular basis for disease-resistant breeding in poultry.
1. Introduction
Avian leukosis (AL) is a viral infectious disease in poultry caused by the avian leukosis virus (ALV), characterized by severe immunosuppression and tumorigenic potential. Livestock production, particularly poultry farming, plays a pivotal role in the socio-economic development of many countries worldwide. Among poultry species, the domestic chicken (Gallus gallus domesticus) stands out due to its short generation interval and adaptability to a wide range of agro-ecological environments, making it one of the most widely distributed avian species globally [1]. As the most extensively raised livestock species, chickens serve as a vital source of high-quality protein and supplemental income for rural households, especially in resource-limited regions. Their popularity is largely attributed to their advantageous traits, including robust disease resistance, adaptability to harsh environments, and efficient utilization of low-quality feed resources [2].
ALV belongs to the C-type retrovirus family and possesses a lipid envelope [3,4]. It is classified into 11 subgroups (A–K) based on the gp85 envelope glycoprotein [5], among which the J subgroup (ALV-J) exhibits the highest pathogenicity [6], with widespread prevalence and substantial economic consequences globally. ALV transmission occurs both vertically and horizontally [7], complicating eradication efforts. Clinically, ALV infection leads to tumor formation, immune suppression, and increased mortality in poultry [8], particularly under intensive farming conditions that facilitate viral spread. Although p27 antigen-based diagnostic assays have been applied in eradication programs, current control strategies remain challenged by the virus’s long incubation period and limitations in detection methods [9].
In recent years, genome-wide association studies (GWASs) have made remarkable contributions to disease-resistance research. By detecting linkage disequilibrium between genetic variants and traits of interest, GWAS enables the identification of significant single nucleotide polymorphisms (SNPs) correlated with phenotypic variation, providing powerful insights into the genetic architecture of disease resistance [10,11,12]. For example, Wossenie Mebratie et al. employed a mixed linear model to identify 11 quantitative trait loci (QTLs) and numerous SNPs associated with body weight and feed conversion efficiency in poultry [13]. Similar GWAS approaches have been applied to traits such as egg quality and disease resistance [14]. In studies of avian influenza resistance, Anna Wolc and colleagues utilized SNP arrays to identify resistance-associated genomic regions, offering key targets for selective breeding, although causal genes remain elusive due to the polygenic nature of the trait [15]. In another study, Xiao et al. identified significantly enriched SNPs on chromosome 5 associated with Salmonella resistance, laying the groundwork for breeding against pullorum disease [16]. Collectively, these findings underscore the utility of GWAS in poultry genetic improvement and disease resistance and provide a valuable reference for future investigations into ALV resistance loci and candidate genes [17,18].
ALV infection is known to reduce egg production, induce tumorigenesis, and suppress the immune system, thereby posing a serious threat to poultry health. Although it is known that ALV enters host cells via specific receptors such as Tva, Tvb, Tvc, and chNHE1, the genetic basis of host resistance remains poorly understood, with limited studies addressing resistance loci and genes associated with ALV-J. The indigenous Chengkou mountain chicken, a local Chinese breed, exhibits strong adaptability and disease resistance. Preliminary long-term AL eradication programs involving multiple generations of birds revealed a significant variation in infection rates among different populations. Notably, some groups exhibited markedly lower infection rates after several rounds of purification, while others showed no obvious improvement, suggesting a potential genetic basis for resistance. In this context, the present study aims to identify resistance-associated loci against ALV-J through whole-genome resequencing and GWAS, thereby providing a genetic foundation for resistance breeding in poultry.
2. Materials and Methods
2.1. Sample Collection
The experimental population consisted of Chengkou mountain chickens, a native Chinese breed, all raised under identical husbandry conditions. The experimental cohort was established based on preliminary avian leukosis (AL) screening, from which 500 hens—approximately 300 days of age—were randomly selected from three genetic lines: A, R, and D. For each individual, cloacal swabs, egg white, plasma, and whole blood samples were collected according to experimental requirements. In addition, liver, spleen, and kidney tissues were sampled from both ALV-positive and uninfected control groups of 17-week-old hens from the D line, with three biological replicates per group.
2.2. Phenotypic Data Collection
Serum samples were tested for ALV-J antibodies using a commercial ELISA kit (IDEXX, Beijing, China), following the manufacturer’s instructions. Plasma, egg white, and cloacal swab samples were analyzed for ALV p27 antigen using an ELISA kit provided by Harbin Gosun Biological Technology Co., Ltd. (Harbin, China), in accordance with the supplied protocol. A sample was considered positive if the OD630 nm of the positive control well exceeded 0.20 and the OD630 nm of the negative control well was below 0.10. Samples with an S/P value ≥ 0.20 were classified as positive, while those with an S/P value < 0.20 were deemed negative. Upon obtaining preliminary results, cloacal swabs, egg whites, and serum samples were recollected and subjected to repeat p27 antigen ELISA tests to confirm the phenotypic data for sequencing candidates. Individuals were classified as ALV-positive (ALV+) if any one of the three sample types yielded a positive result. Conversely, individuals were defined as ALV-negative (ALV−) only if all three tests returned negative results. For each genetic line, an equal proportion of individuals with no prior record of ALV positivity was selected as the uninfected control group.
2.3. Genotypic Data Acquisition
Genomic DNA was extracted using the PCI (phenol–chloroform–isoamyl alcohol) method [19], and the DNA quality was assessed using the Agilent 5400 system (Agilent, Wilmington, DE, USA). Sequencing libraries were prepared using the TruSeq Nano DNA HT sample preparation kit (Illumina, San Diego, CA, USA), with unique index sequences incorporated into each sample fragment. The libraries were sequenced on the Illumina NovaSeq 6000 platform, generating 150 bp paired-end reads with an average insert size of approximately 350 bp and a sequencing depth of 10×.
2.4. Data Processing
2.4.1. Quality Control
Raw sequencing reads were filtered based on the following criteria: (1) removal of reads with ≥10% unidentified nucleotides (N); (2) removal of reads with >50% low-quality bases (Phred score < 5); (3) removal of reads with adapter sequence alignment ≥10 nucleotides, allowing ≤10% mismatches; (4) removal of duplicate sequences resulting from PCR amplification, defined as read pairs with identical sequences.
2.4.2. Alignment to the Reference Genome
Filtered high-quality reads were aligned to the chicken reference genome (bGalGal1.mat.broiler.GRCg7b, from the NCBI database) using the BWA software (version 0.7.8). Duplicate reads were removed using SAMTOOLS (version 0.1.19) [20].
2.4.3. Variant Calling and Annotation
SNPs were identified using GATK. The resulting variants were filtered with Plink (version 1.07) and Vcftools (version 0.1.15) using the following thresholds: QD < 2.0, MQ < 40.0, FS > 60.0, SOR > 3.0, MQRankSum < –12.5, and ReadPosRankSum < –8.0. Vcftools was further used to retain high-quality SNPs with parameters --max-missing 0.9 and --maf 0.05. SNP annotation was conducted using ANNOVAR (HG19).
2.4.4. Phylogenetic Tree Analysis
Following SNP detection, the genetic distance between individuals was calculated using the high-quality filtered SNPs. A distance matrix was generated using Treebest (version 1.9.2), and a phylogenetic tree was constructed based on the neighbor-joining method [21].
2.4.5. Principal Component Analysis (PCA)
PCA was performed using the GCTA software package (version 1.24.2) [22] based solely on autosomal SNP data from n individuals. Multiallelic sites (more than two alleles) and mismatched data were excluded. Each SNP at position (i, k) was encoded as 0 (homozygous for the reference allele), 1 (heterozygous), or 2 (homozygous for the alternative allele). A standardized genotype matrix M (n × S) was calculated as follows:
where E(d_k) is the average genotype at SNP k. The sample covariance matrix X (n × n) was calculated using X = MMᵀ/S.
2.4.6. Population Structure Analysis
The population structure was analyzed using PLINK, and the genetic structure and lineage information were further inferred using sNMF, frappe, or Admixture (version 1.3.0). The ancestral proportions were estimated by integrating sparse non-negative matrix factorization (sNMF) with least-squares optimization. The optimal number of ancestral populations was determined at the first inflection point of the cross-entropy curve. This estimate was then validated by comparing the results from the phylogenetic tree and PCA.
2.4.7. Genome-Wide Association Study
Fisher’s exact test was applied to evaluate the association between two categorical variables using 2 × 2 contingency tables. For the GWAS analysis, GEMMA (version 0.94.1) was used to compute the kinship matrix (K), while GCTA (version 1.24.2) was used to estimate the population structure (Q) [23,24,25].
2.4.8. Result Visualization
To determine the significance threshold for p-values, a Bonferroni correction was applied, with a p-value threshold of 5 × 10⁻⁶ set to identify SNPs significantly associated with the trait. Here, n represents the total number of SNPs analyzed, and chr denotes the number of chromosomes.
Q–Q plots and Manhattan plots were generated using the CMplot package.
2.4.9. GO and KEGG Enrichment Analyses
GO functional enrichment and KEGG pathway analyses were performed on SNPs identified above the significance threshold in the genome-wide association study using the KOBAS online platform, based on the Gene Ontology (GO) database (http://geneontology.org) and the Kyoto Encyclopedia of Genes and Genomes (KEGG) database (http://www.kegg.jp/kegg, accessed on 27 March 2025) [26,27]. GO terms and KEGG pathways with adjusted p-values < 0.05 were considered statistically significant.
2.5. RNA-Seq Analysis
2.5.1. Sample Collection
Tissue samples were rinsed with phosphate-buffered saline (PBS) and trimmed into small pieces before being immersed in RNAlater stabilization solution. After incubation at room temperature, the RNAlater solution was discarded, and only the tissue specimens were retained. The samples were then stored at −80 °C until further use. Subsequently, the preserved tissues were sent to Novogene Co., Ltd. (Beijing, China) for transcriptome sequencing.
2.5.2. Data Processing
Low-quality and contaminant reads were removed from the raw FASTQ data using FastQC to obtain clean reads. These clean reads were then aligned to the chicken reference genome (GCF_016699485.2) using HISAT2 (version 2.1.0), and only reads that successfully mapped to the genome were retained for downstream analysis [28,29]. The sample correlation was assessed using Pearson correlation coefficients and a principal component analysis (PCA). Gene expression levels were quantified using HTSeq (version 0.6.0), and differential expression analysis was performed with DESeq2. The genes were considered differentially expressed if they met the criteria of p ≤ 0.05 and |log2(fold change)| ≥ 1 [30].
2.6. Quantitative Real-Time PCR (qRT-PCR)
Three candidate genes were randomly selected for quantitative real-time PCR (qRT-PCR) validation. The reactions were performed using a SYBR Premix Ex Taq II kit (Takara, Japan). The thermal cycling conditions were as follows: initial denaturation at 95 °C for 2 min; followed by 40 cycles of 95 °C for 5 s and 60 °C for 30 s; and a melting curve analysis consisting of 95 °C for 10 s, 65 °C for 5 s, and 95 °C for 5 s. The gene expression levels were calculated using the 2−ΔΔCT method based on threshold cycle (CT) values. A statistical analysis and bar graph visualization were performed using the GraphPad Prism software (Bioc 3.15). Differences with p < 0.05 or p < 0.01 were considered statistically significant [31].
3. Results
3.1. Genotypic and Phenotypic Data
Phenotypic Data
In this study, families with significant differences in ALV infection status were selected from populations that had undergone multiple generations of avian leukosis purification. A total of 1050 chickens were sampled for cloacal swabs, egg white, and serum. Using ELISA to detect the ALV p27 antigen, 500 individuals were selected for whole-genome resequencing, comprising 325 ALV+ and 175 ALV– individuals, yielding an ALV–/ALV+ ratio of approximately 2:1 (Table A1).
3.2. SNP Detection
3.2.1. Alignment to the Reference Genome
Genomic DNA was extracted from a total of 500 chickens and subjected to whole-genome sequencing. The DNA quality assessment results are presented in Table A2. The chicken reference genome size was 1,049,948,333 base pairs. The alignment rate of the population samples ranged from 98.44% to 99.64%, with an average sequencing depth of 12.08× and an average genome coverage of 98.50%.
3.2.2. SNP Detection and Annotation
A total of 20,959,220 raw SNPs were initially detected, and after filtering, 12,644,463 high-quality SNPs were retained. A remarkable accumulation of SNPs was observed around the 5 Mb region on chromosome 6 (Chr6). Annotation revealed that most of the filtered SNPs were enriched in intronic and intergenic regions, while a smaller proportion were located in upstream, exonic, and downstream regions of genes. A further analysis showed that the majority of SNP variations were caused by base transitions (Table A3).
3.3. Population Genetic Diversity Analysis
The phylogenetic tree revealed clear clustering patterns consistent with the line-specific classifications (Lines A, R, and D), as recorded during the sample collection (Figure 1A). A principal component analysis (PCA) showed that some individuals from Line D clustered with Lines A and R, while, overall, the three lines demonstrated good intra-line clustering and clear inter-line separation (Figure 1B). When the number of ancestral populations was set to three, each individual’s genome exhibited clear structural grouping (Figure 1C), indicating that the 500 resequenced samples originated from three ancestral populations.
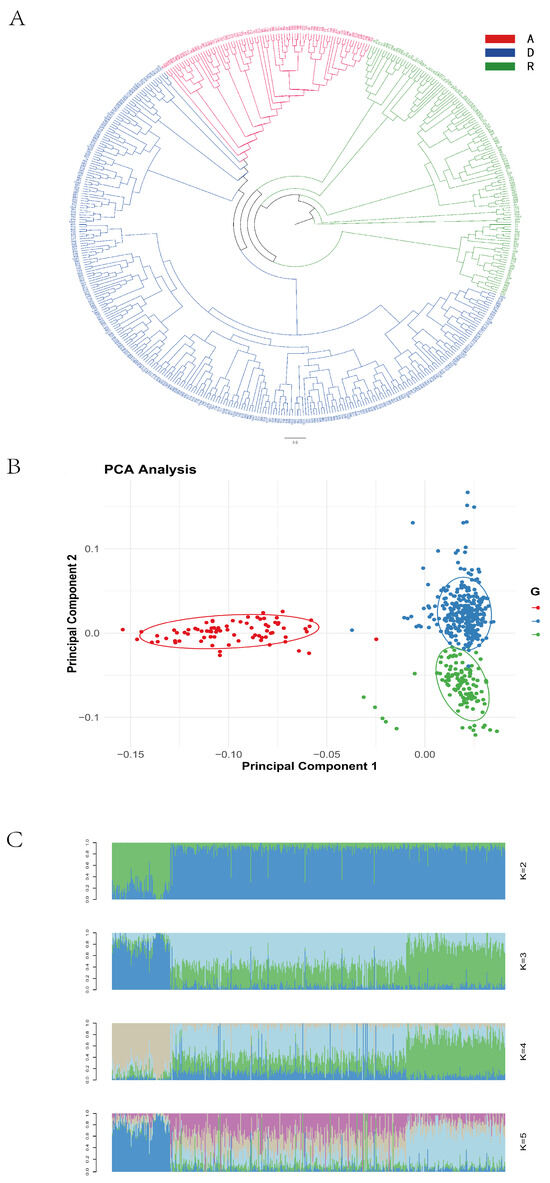
Figure 1.
Population genetic diversity. (A) Phylogenetic tree; (B) principal component analysis plot; (C) population genetic structure plot.
Based on the results of the population diversity analyses, the sequenced samples were determined to originate from three ancestral populations. This finding is consistent with the three lines recorded during sample collection, confirming the accuracy of population classification and validating the feasibility of conducting a line-specific genome-wide association analysis in the subsequent steps.
3.4. Genome-Wide Association Analysis
Genome-wide association analysis revealed significant loci on chromosomes 1, 2, 4, 14, 20, 28, and the Z chromosome, as illustrated in the Manhattan plot (Figure 2A). No continuous regions of significance were observed on the Z sex chromosome. A total of 218 SNPs surpassing the genome-wide significance threshold were identified and mapped to 49 candidate genes. Functional annotations showed that two SNPs were located in exonic regions, including one synonymous mutation and one non-synonymous mutation (on chromosome Z). Additionally, 76 SNPs were located in intergenic regions (Table A4). Table 1 lists the top 20 SNPs and their corresponding genes, including a synonymous SNP on chromosome 1 with the most significant p-value.
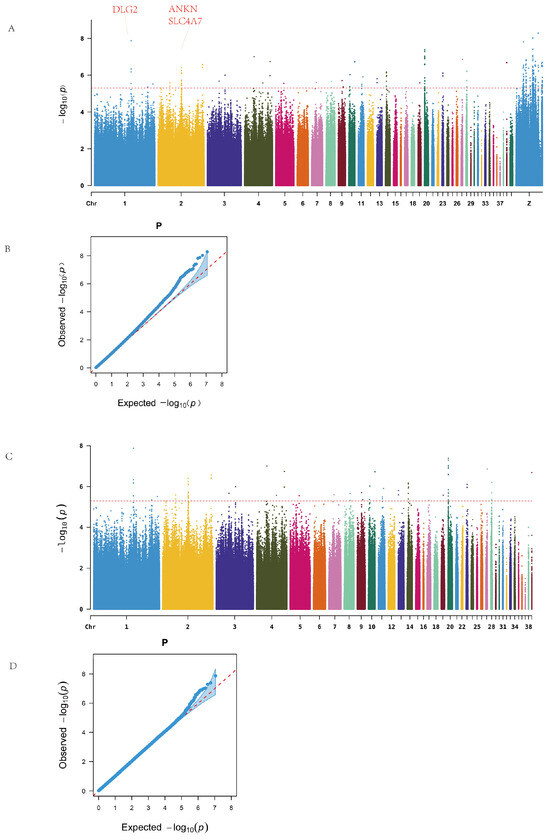
Figure 2.
Manhattan and Q–Q plots. (A) Overall Manhattan. (B) Overall Q–Q. (C) Excluding sex chromosomes Manhattan. (D) Excluding sex chromosomes Q–Q.

Table 1.
The top 20 p-values of SNPs.
Among the significantly enriched genes, the Z chromosome harbored the largest number of SNPs, with BNC2 and NRG1 annotated with 15 and 13 SNPs, respectively. On the autosomes, ANKH on chromosome 2 and EIF6 on chromosome 20 exhibited substantial SNP enrichment. Additionally, genes such as FBXL7 and SLC4A7 were also significantly enriched (Table A5).
Since no continuous high-signal SNP regions were observed on the Z chromosome, and to avoid the dilution of potential association signals by the high mutation load on the sex chromosome, we excluded the Z chromosome data from the subsequent analyses. This adjustment also aimed to better explore intra- and inter-line differences among chicken populations. Therefore, follow-up genome-wide association analyses for ALV resistance were conducted both within individual lines and across the entire population to further identify potential associated loci and candidate genes.
After removing sex chromosome data, the resulting Manhattan plot revealed continuous high-signal regions on chromosomes 1, 2, and 20 (Figure 2B). A total of 78 significant SNPs were identified, spanning 17 intergenic regions and 21 genes, including one synonymous mutation located in an exon. Notable candidate genes included ANKH (12 associated SNPs), EIF6 (11 SNPs), and SLC4A7, DLG2, and FBXL7, which are widely implicated in cellular inflammation, immune response, and tumor development.
Further within-line analysis revealed the following findings:
In Line A, a total of 26 ALV-negative and 48 ALV-positive individuals were analyzed. After excluding SNPs on the sex chromosome, genome-wide association analysis identified continuous clusters of significant variants on chromosomes 1, 4, 6, and 28 (Figure 3A). In total, 34 significant SNPs were detected, mapped to 12 candidate genes. The most significant SNP on chromosome 22 was located in an intergenic region, while 11 SNPs on chromosome 1 were concentrated in a single intergenic region. Twelve SNPs were located within gene regions, corresponding to nine genes, among which PTPN13 and TIAL1 are associated with cancer and immune function (Table A6).
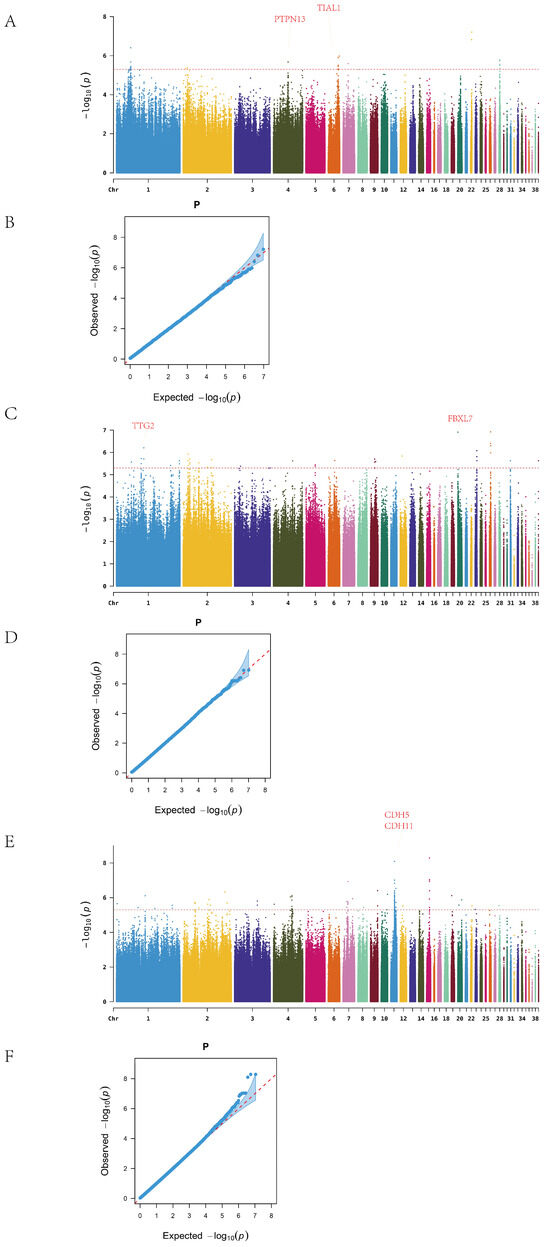
Figure 3.
Manhattan and Q–Q plots. (A) A series Manhattan. (B) A series Q–Q. (C) R series Manhattan. (D) R series Q–Q. (E) D series Manhattan. (F) D series Q–Q.
In Line R, after excluding sex chromosome data, the Manhattan plot revealed significant SNPs on chromosomes 1, 2, 9, 23, and 26 (Figure 3B). A total of 46 SNPs were identified, distributed across 13 chromosomes and mapped to 20 candidate genes. The most significant SNP on chromosome 26 was located between NGF and FANCE; NGF is known to be involved in nerve growth, while FANCE plays a key role in the Fanconi anemia pathway. On chromosome 1, 14 SNPs were detected, with 7 mapping to the TTF2 gene, which is associated with thyroid development.
In Line D, 92 significant SNPs were identified across 16 chromosomes after removal of sex-linked loci, and these were mapped to 21 candidate genes. High-density SNP regions were detected on chromosomes 1, 4, 7, 11, and 15 (Figure 3C). The most significant SNP on chromosome 15 was located in the YWHAH gene, which has been implicated in viral encephalitis and tumor progression. On chromosome 11, 30 SNPs were concentrated in the intergenic region between CDH5 and CDH11, both members of the cadherin family, which are involved in cancer and vascular disease. In addition, the identification of SLC5A1, a member of the solute carrier (SLC) family, supports the relevance of this gene family in ALV resistance, consistent with previous findings related to SLC4A7.
Q–Q plots confirmed that the observed p-value distribution closely followed the expected uniform distribution, indicating no systematic bias in the GWAS results.
3.5. GO and KEGG Enrichment Analyses
To comprehensively evaluate the functional roles of candidate genes annotated from significant SNPs, Gene Ontology (GO) and Kyoto Encyclopedia of Genes and Genomes (KEGG) enrichment analyses were performed under the threshold of p < 0.05.
Before excluding sex chromosomes, the enriched terms included 9 biological processes, 3 cellular components, 15 molecular functions, and 4 KEGG pathways (Figure 4A,B). The top 20 GO terms with the highest enrichment scores are shown in the figure.
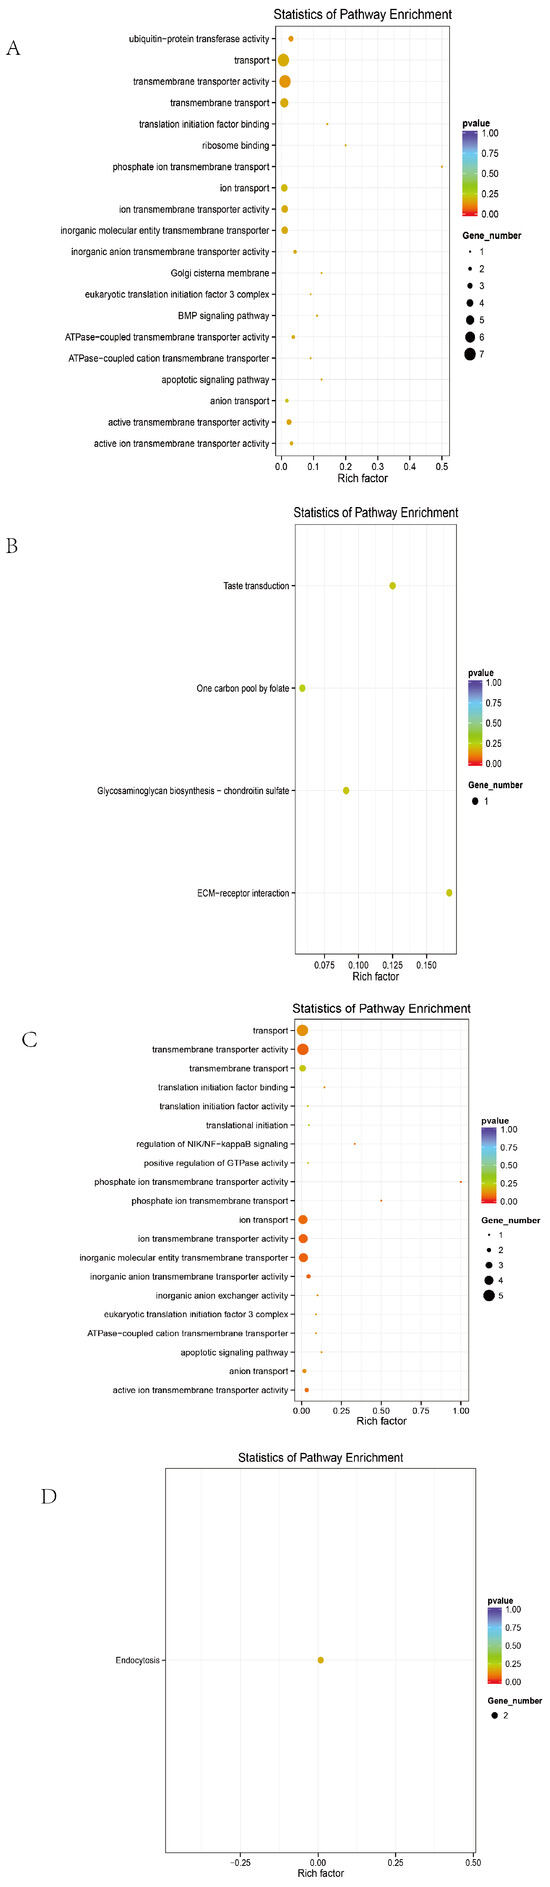
Figure 4.
Overall GO and KEGG plots. (A) GO map of the entire group without excluding sex chromosomes. (B) KEGG map of the entire group without excluding sex chromosomes. (C) GO map of the entire group after excluding sex chromosomes. (D) KEGG map of the entire group after excluding sex chromosomes.
After excluding sex chromosomes, an enrichment analysis revealed 16 biological processes, 1 cellular component, 14 molecular functions, and 9 KEGG pathways (Figure 4C,D).
Line-specific analyses yielded the following results:
In Line A, 26 biological processes, 10 cellular components, 16 molecular functions, and 10 KEGG pathways were enriched (Figure 5A,B).
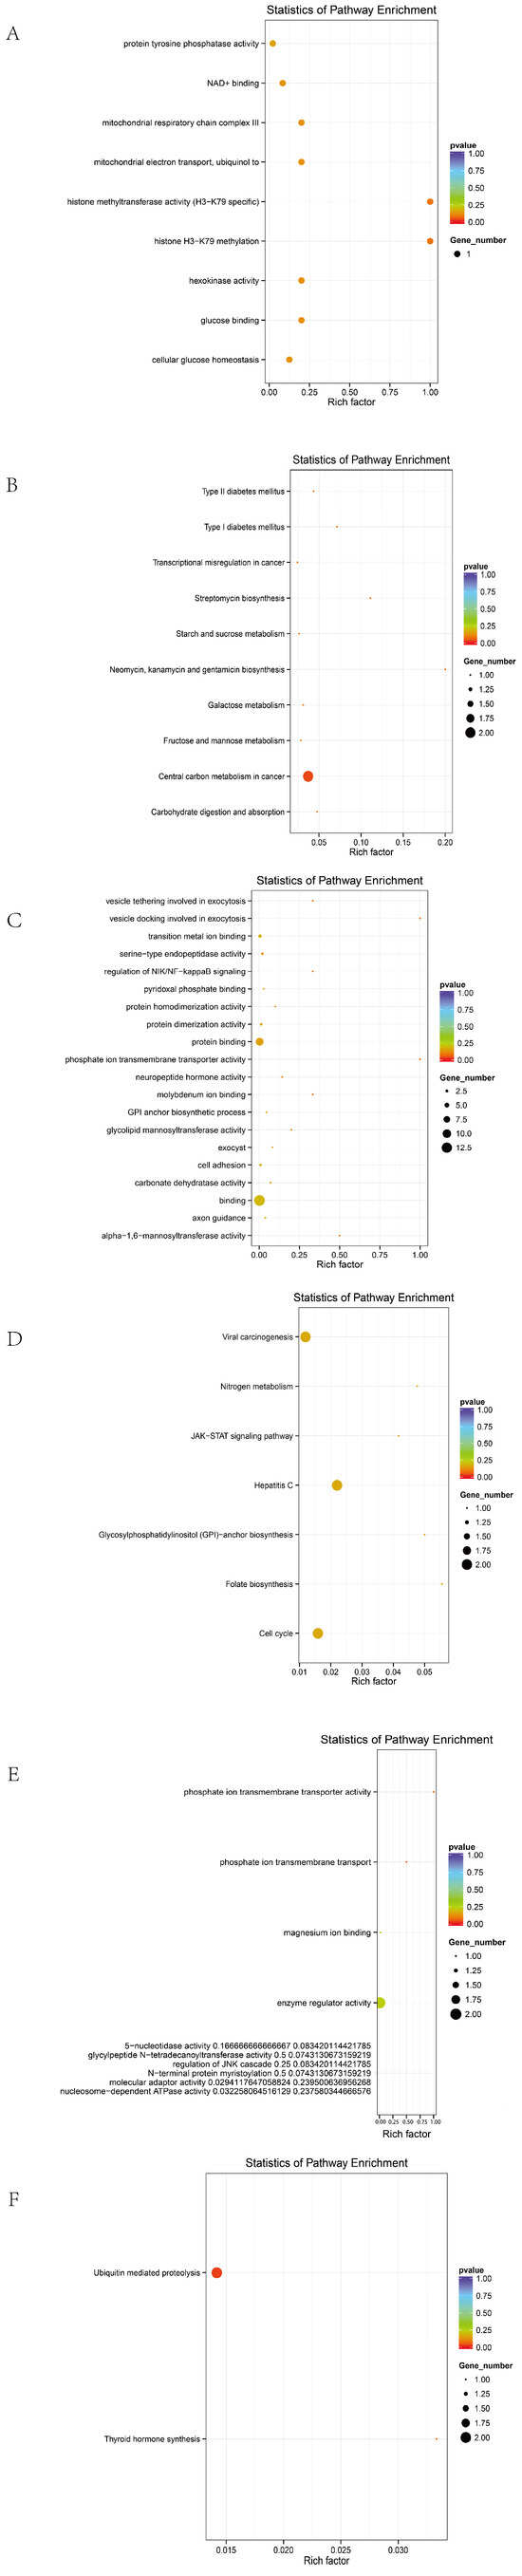
Figure 5.
GO and KEGG maps of different strains. (A) GO diagram of series A. (B) A KEGG diagram. (C) R system GO diagram. (D) R series KEGG diagram. (E) D GO diagram. (F) D series KEGG diagram.
In Line R, 25 biological processes, 10 molecular functions, and 2 KEGG pathways were identified (Figure 5C,D).
In Line D, 39 biological processes, 3 cellular components, 22 molecular functions, and 7 KEGG pathways were significantly enriched (Figure 5E,F).
Candidate genes were significantly enriched in membrane-associated signaling pathways and tumorigenesis-related mechanisms, including membrane transporter activity, transmembrane transport, cellular metabolism, endoplasmic reticulum function, ion transport, and cancer-related functions. Representative genes included SLC4A7, SLC5A1, ANKH, EIF6, DLG2, FBXL7, and CDH5.
A KEGG analysis further indicated that these genes are involved in the JAK/STAT signaling pathway, ECM–receptor interaction, glycosaminoglycan biosynthesis, folate-mediated one-carbon metabolism, and other pathways, which are potentially associated with the tumorigenic mechanisms in ALV-infected individuals.
3.6. Identification of Candidate Genes by RNA-Seq Analysis
To validate the potential functions of candidate genes identified through GWAS, we integrated RNA-Seq data and performed an intersection analysis between differentially expressed genes and a randomly selected subset of three GWAS candidate genes (ANKH, CDH11, and SLC5A1). All three genes exhibited significant differential expression in the RNA-Seq analysis (p < 0.05) (Table A7).
3.7. qRT-PCR Validation of Candidate Gene Expression
Three candidate genes (ANKH, DLG2, and SLC4A7) were randomly selected for qRT-PCR validation (Figure 6). Under ALV-J infection, ANKH exhibited significant differential expression in the liver, spleen, and kidney tissues. Both DLG2 and SLC4A7 showed significant changes in expression in the liver and kidney tissues.
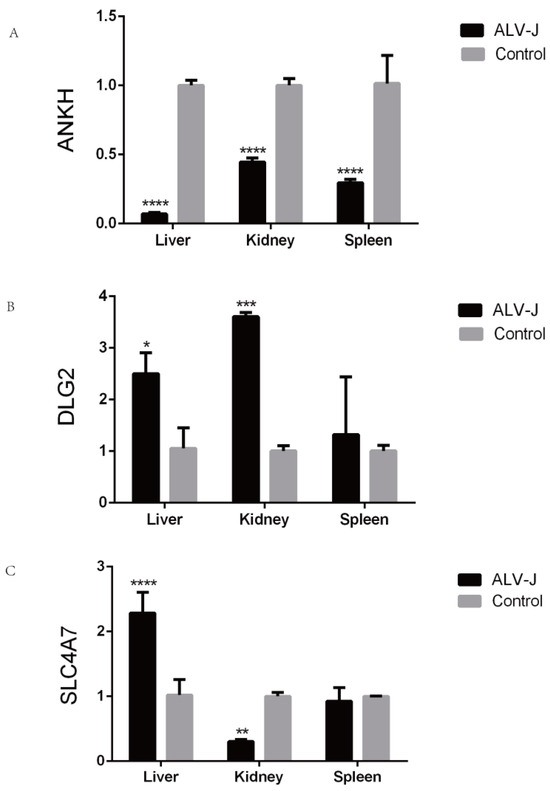
Figure 6.
qPCR analysis verifies the expression of candidate genes. (A) Expression of ANKH in different tissues. (B) Expression of DLG2 in different tissues. (C) Expression of SLC4A7 in different tissues. *: p < 0.05, **: p < 0.01, ***: p < 0.001, ****: p < 0.0001.
4. Discussion
Avian leukosis virus subgroup J (ALV-J) is a highly contagious disease in poultry, characterized by rapid transmission and the lack of effective vaccines, resulting in substantial economic losses to the poultry industry. Although continuous screening and culling strategies have helped to control the spread of ALV-J, these approaches have not completely eliminated the virus from poultry populations. In 2006, researchers identified the sodium–hydrogen exchanger 1 (NHE1) as a cellular receptor for ALV-J [32]. The study demonstrated that quails and certain wild birds exhibited resistance to ALV-J, while turkeys and some domestic chicken breeds were susceptible. However, the specific genetic loci associated with ALV-J resistance remain largely unknown. In this study, a genome-wide association study (GWAS) was used to identify genetic variants associated with ALV-J susceptibility, providing insights into the host’s genetic determinants of infection.
GWAS revealed several loci significantly associated with ALV-J infection, particularly within genes related to immune response, cancer progression, and membrane function. Among these, PTPN13, a known tumor suppressor, showed a strong association with ALV-J susceptibility. PTPN13 is involved in regulating cell death and migration, and its dysregulation in various cancers suggests that it may influence ALV-J infection by modulating immune responses and intracellular signaling pathways [33,34,35].
Another notable gene, TTF2, a thyroid-specific transcription factor, has been implicated in the pathogenesis of multiple cancers, including thyroid carcinoma [36,37,38]. ALV integrates into the host genome and can activate or disrupt proto-oncogene expression, leading to abnormal cell proliferation such as lymphoma. Given ALV’s reliance on host transcriptional machinery, TTF2 may affect the efficiency of viral replication or integration, thereby influencing susceptibility to ALV-J.
TIAL1, a gene involved in RNA splicing and DNA repair, plays a critical role in B cell development. Mutations in TIAL1 may impair B cell maturation, contributing to immune tolerance and persistent ALV-J infection [39]. In addition, genes such as DLG2 [40,41,42] and FBXL7 [43] are involved in tumor progression and immune regulation. ALV-J infection has been shown to suppress JAK-STAT signaling by upregulating SOCS3 (suppressor of cytokine signaling 3), thereby inhibiting innate immune responses and promoting viral replication [44]. The enrichment of these genes in the JAK-STAT pathway suggests that they may influence ALV-J susceptibility by modulating host immunity.
As ALV-J initiates infection by binding to specific receptors on the host cell membrane, genes involved in membrane structure and function are critical for viral entry and propagation. In this study, several candidate genes associated with membrane function were identified, including ANKH, SLC4A7, SLC5A1, and members of the cadherin (CDH) family. These genes are essential for ion transport, cell adhesion, and maintenance of cellular homeostasis—processes that are vital for viral infection.
ANKH encodes a transmembrane protein responsible for inorganic pyrophosphate transport [45]. Mutations in ANKH have been linked to ion transport disorders and inflammatory conditions, such as arthritis [46,47]. Our findings suggest that ANKH may alter ionic homeostasis at the cell surface, thereby influencing ALV-J binding and entry.
SLC4A7 and SLC5A1, members of the solute carrier family, are involved in bicarbonate and glucose transport, respectively. Enrichment of these genes in pathways related to ion transport and cancer metabolism suggests that their dysfunction may alter membrane permeability, facilitating viral invasion and disease progression [48,49,50,51,52,53,54,55,56,57]. Furthermore, their association with cancer-related pathways supports the notion that changes in membrane function influence both viral infection and tumorigenesis.
The cadherin family genes CDH5 and CDH11 are crucial for cell–cell adhesion and tissue integrity. These proteins are known to participate in tumor immune responses and can enhance antitumor immunity. Notably, CDH5 and CDH11 were enriched in the JAK-STAT signaling pathway, which has been associated with immune regulation. High expression of CDH5 can enhance CD8+ T cell activity, thereby suppressing tumor growth. Their enrichment in this pathway suggests a role in modulating host susceptibility to ALV-J by influencing immune signaling [58,59,60].
In addition to identifying candidate genes, this study highlights several key biological pathways involved in ALV-J infection and immune suppression. The JAK-STAT signaling pathway, crucial for immune cell signal transduction, was significantly enriched. This pathway has been linked to various immune disorders and cancers [61,62,63,64]. In chicken macrophages and DF-1 cells, ALV-J infection has been shown to reduce STAT1 phosphorylation, impairing interferon responses and facilitating immune evasion [65]. Thus, ALV-J may promote tumorigenesis by disrupting JAK-STAT signaling and weakening host antiviral defenses.
Enrichment of the extracellular matrix (ECM)–receptor interaction pathway was also observed. This pathway plays a pivotal role in cell adhesion, migration, and proliferation during tumor development [66], and its involvement in cancers such as prostate and gastric cancer is well-documented [67,68,69]. ALV may disrupt ECM-receptor interactions, thereby promoting viral entry, immune evasion, and tumorigenesis. Additional enriched pathways, including glycosaminoglycan biosynthesis and folate-mediated one-carbon metabolism, are involved in cell proliferation, migration, and survival—processes often dysregulated in cancer [70,71,72,73,74].
Although this study successfully identified potential loci associated with ALV-J resistance in Chengkou mountain chickens via GWAS, several limitations should be acknowledged. Firstly, despite applying Bonferroni correction, false positives may still arise due to multiple testing and residual population stratification. Secondly, phenotypic misclassification may affect the strength of association signals. While RNA-Seq and qPCR validations were partially conducted, further functional genomics studies and cross-population validations are necessary to confirm the biological relevance of these candidate loci.
5. Conclusions
This study identified multiple candidate genes and signaling pathways associated with immune regulation, cell membrane function, and tumorigenesis through a genome-wide association analysis. Genetic variations in these genes may underlie differences in susceptibility to ALV-J infection among various chicken lines. However, the precise mechanisms by which these genes influence ALV-J infection and immunosuppression require further investigation. Future research will focus on functional studies of these candidate genes—particularly gene knockout and overexpression experiments—to elucidate their specific roles in ALV-J pathogenesis.
In addition, the application of these genetic markers in selective breeding programs for ALV-J-resistant poultry should be considered a long-term strategy for disease control. Nonetheless, challenges such as underdeveloped breeding systems and limited funding for local chicken breeds remain significant barriers to implementation. Overall, this study provides new insights into the genetic susceptibility of poultry to ALV-J infection and lays a foundational framework for future disease-resistance breeding efforts.
Author Contributions
Conceptualization, X.L. and H.W.; writing—original draft preparation, Y.L.; visualization, M.T.; software, G.Y.; data curation, Q.X.; resources, Q.W. All authors have read and agreed to the published version of the manuscript.
Funding
This work was financially supported by the Project of Chongqing Agricultural Science Innovation (NW202209), the Fundamental Research Funds for the Central Universities (XDJK2020C018), the Chongqing Science and Enterprise Consortium Germplasm Resources Collection and Utilization and Variety Trial (KQ202301), Breeding of New Breeds (Synthetic Line) of High-Quality Chickens for Both Meat and Eggs (cstc2021 jscx-gksbX0004), and the National Natural Science Foundation of China (31802054).
Institutional Review Board Statement
The Animal Ethics Committee of Southwestern University approved all animal procedures (LAC2023-2-0224).
Informed Consent Statement
Not applicable.
Data Availability Statement
The whole-genome sequencing data generated in this study are available in the NCBI database under accession number PRJNA1242535.
Conflicts of Interest
The authors declare no conflicts of interest.
Appendix A
Table A1.
Sample phenotype grouping.
Table A1.
Sample phenotype grouping.
| Strains | Quantity | Positivity Rate |
|---|---|---|
| A | 74 | 64.86% |
| R | 126 | 65.08% |
| D | 300 | 65.00% |
| The whole group | 500 | 65.00% |
Table A2.
DNA quality testing.
Table A2.
DNA quality testing.
| Sample Number | Concentration (ng/μL) | Volume (μL) | Total Volume (μg) |
|---|---|---|---|
| 2 | 333.92 | 60 | 20.0352 |
| 4 | 323.06 | 60 | 19.38384 |
| 5 | 92.96 | 60 | 5.5776 |
| 6 | 62.35 | 60 | 3.74076 |
| 7 | 254.11 | 60 | 15.24678 |
| 8 | 39.93 | 60 | 2.39562 |
| 10 | 82.13 | 60 | 4.92768 |
| 12 | 72.61 | 60 | 4.35636 |
| 13 | 137.45 | 60 | 8.24706 |
| 14 | 185.33 | 60 | 11.12004 |
| 15 | 84.86 | 60 | 5.09166 |
| 17 | 57.82 | 60 | 3.46932 |
| 18 | 383.7 | 60 | 23.02212 |
| 19 | 105.67 | 60 | 6.33996 |
| 21 | 48.39 | 60 | 2.9031 |
| 23 | 242.63 | 60 | 14.55762 |
| 24 | 343.41 | 60 | 20.60436 |
| 26 | 426.85 | 60 | 25.61112 |
| 27 | 102.87 | 60 | 6.17226 |
| 29 | 102.04 | 60 | 6.12258 |
| 33 | 173.82 | 60 | 10.4292 |
| 34 | 393.56 | 60 | 23.61348 |
| 36 | 441.25 | 60 | 26.47494 |
| 39 | 410 | 60 | 24.6 |
| 40 | 145.3 | 60 | 8.71794 |
| 41 | 251.94 | 60 | 15.11664 |
| 42 | 301.73 | 60 | 18.10368 |
| 43 | 169.51 | 60 | 10.1703 |
| 44 | 158.16 | 60 | 9.48972 |
| 48 | 88.47 | 60 | 5.30814 |
| 49 | 388.93 | 60 | 23.33592 |
| 51 | 453.35 | 60 | 27.20106 |
| 53 | 171.04 | 60 | 10.26264 |
| 54 | 96.82 | 60 | 5.80944 |
| 55 | 213.54 | 60 | 12.81264 |
| 56 | 190.93 | 60 | 11.45568 |
| 58 | 150.67 | 60 | 9.0402 |
| 59 | 356.21 | 60 | 21.37248 |
| 62 | 72.28 | 60 | 4.33698 |
| 63 | 71.15 | 60 | 4.26912 |
| 64 | 111.14 | 60 | 6.66816 |
| 65 | 119.59 | 60 | 7.17552 |
| 70 | 115.36 | 60 | 6.92154 |
| 72 | 108.66 | 60 | 6.51954 |
| 74 | 373.25 | 60 | 22.395 |
| 76 | 143.62 | 60 | 8.61714 |
| 78 | 189.07 | 60 | 11.3439 |
| 83 | 130.06 | 60 | 7.80372 |
| 85 | 426 | 60 | 25.56 |
| 87 | 676 | 60 | 40.56 |
| 91 | 87.84 | 60 | 5.27028 |
| 94 | 449.58 | 60 | 26.97504 |
| 95 | 580 | 60 | 34.8 |
| 96 | 57.9 | 60 | 3.47388 |
| 98 | 197.61 | 60 | 11.85642 |
| 99 | 450 | 60 | 27 |
| 103 | 145.95 | 60 | 8.7567 |
| 104 | 125.93 | 60 | 7.5558 |
| 105 | 448.76 | 60 | 26.92566 |
| 108 | 688 | 60 | 41.28 |
| 109 | 194.82 | 60 | 11.68944 |
| 110 | 238.42 | 60 | 14.3052 |
| 113 | 176.43 | 60 | 10.58556 |
| 118 | 53.21 | 60 | 3.19272 |
| 119 | 110.32 | 60 | 6.61896 |
| 121 | 48.26 | 60 | 2.8953 |
| 122 | 74.11 | 60 | 4.44636 |
| 125 | 8.6 | 60 | 0.51612 |
| 130 | 179.7 | 60 | 10.78212 |
| 131 | 105.82 | 60 | 6.34932 |
| 132 | 416 | 60 | 24.96 |
| 136 | 95.84 | 60 | 5.7501 |
| 138 | 236.14 | 60 | 14.16858 |
| 140 | 312.09 | 60 | 18.72558 |
| 144 | 638 | 60 | 38.28 |
| 145 | 59.33 | 60 | 3.55956 |
| 147 | 53.13 | 60 | 3.18756 |
| 150 | 65.92 | 60 | 3.9552 |
| 152 | 92.91 | 60 | 5.5743 |
| 153 | 120.31 | 60 | 7.21854 |
| 157 | 86.46 | 60 | 5.18742 |
| 158 | 395.69 | 60 | 23.7414 |
| 159 | 327.93 | 60 | 19.67598 |
| 164 | 249.29 | 60 | 14.95746 |
| 170 | 95.15 | 60 | 5.70894 |
| 171 | 51.24 | 60 | 3.07452 |
| 174 | 131.11 | 60 | 7.86636 |
| 175 | 70.19 | 60 | 4.21158 |
| 176 | 135.27 | 60 | 8.11626 |
| 178 | 132.02 | 60 | 7.92138 |
| 988 | 914 | 60 | 54.84 |
| 989 | 806 | 60 | 48.36 |
| 990 | 906 | 60 | 54.36 |
| 992 | 864 | 60 | 51.84 |
| 993 | 738 | 60 | 44.28 |
| 995 | 1080 | 60 | 64.8 |
| 996 | 734 | 60 | 44.04 |
| 997 | 812 | 60 | 48.72 |
| 998 | 746 | 60 | 44.76 |
| 999 | 1180 | 60 | 70.8 |
| 1002 | 914 | 60 | 54.84 |
| 1003 | 578 | 60 | 34.68 |
| 1006 | 712 | 60 | 42.72 |
| 1007 | 742 | 60 | 44.52 |
| 1009 | 956 | 60 | 57.36 |
| 1014 | 734 | 60 | 44.04 |
| 1017 | 872 | 60 | 52.32 |
| 1018 | 774 | 60 | 46.44 |
| 1022 | 912 | 60 | 54.72 |
| 1026 | 1040 | 60 | 62.4 |
| 1027 | 906 | 60 | 54.36 |
| 1028 | 950 | 60 | 57 |
| 1029 | 704 | 60 | 42.24 |
| 1030 | 832 | 60 | 49.92 |
| 1031 | 626 | 60 | 37.56 |
| 1032 | 648 | 60 | 38.88 |
| 1033 | 936 | 60 | 56.16 |
| 1035 | 856 | 60 | 51.36 |
| 1036 | 788 | 60 | 47.28 |
| 1037 | 916 | 60 | 54.96 |
| 1038 | 1056.57 | 60 | 63.39444 |
| 1041 | 668 | 60 | 40.08 |
| 1042 | 484 | 60 | 29.04 |
| 1043 | 752 | 60 | 45.12 |
| 1044 | 624 | 60 | 37.44 |
| 1045 | 706 | 60 | 42.36 |
| 1046 | 760 | 60 | 45.6 |
| 1047 | 764 | 60 | 45.84 |
| 1048 | 554 | 60 | 33.24 |
| 180 | 130.45 | 60 | 7.82676 |
| 182 | 559.31 | 60 | 33.55836 |
| 183 | 264.75 | 60 | 15.88494 |
| 188 | 237.23 | 60 | 14.23362 |
| 194 | 406 | 60 | 24.36 |
| 197 | 396.05 | 60 | 23.76318 |
| 199 | 24.28 | 60 | 1.45656 |
| 202 | 231.18 | 60 | 13.87086 |
| 207 | 81.14 | 60 | 4.8681 |
| 215 | 56.76 | 60 | 3.40578 |
| 219 | 308.82 | 60 | 18.52908 |
| 228 | 175.81 | 60 | 10.54872 |
| 239 | 95.67 | 60 | 5.74038 |
| 245 | 34.44 | 60 | 2.06658 |
| 246 | 67.65 | 60 | 4.05888 |
| 252 | 106.88 | 60 | 6.4125 |
| 257 | 89.11 | 60 | 5.34648 |
| 260 | 43.49 | 60 | 2.6094 |
| 266 | 53.42 | 60 | 3.20538 |
| 273 | 264.17 | 60 | 15.85026 |
| 275 | 247.17 | 60 | 14.83044 |
| 285 | 86.55 | 60 | 5.19282 |
| 297 | 95.03 | 60 | 5.70168 |
| 303 | 123.18 | 60 | 7.39068 |
| 308 | 46.62 | 60 | 2.7969 |
| 313 | 41.99 | 60 | 2.51922 |
| 318 | 40.32 | 60 | 2.4189 |
| 319 | 71.24 | 60 | 4.2744 |
| 320 | 161.38 | 60 | 9.68268 |
| 322 | 90.1 | 60 | 5.40618 |
| 477 | 445.09 | 60 | 26.70522 |
| 480 | 60.41 | 60 | 3.62472 |
| 481 | 73.05 | 60 | 4.38288 |
| 482 | 83 | 60 | 4.98018 |
| 483 | 106.92 | 60 | 6.41502 |
| 484 | 153.53 | 60 | 9.21156 |
| 491 | 76.04 | 60 | 4.5624 |
| 492 | 44.66 | 60 | 2.67972 |
| 493 | 56.68 | 60 | 3.4008 |
| 494 | 252.67 | 60 | 15.1602 |
| 496 | 88.11 | 60 | 5.28672 |
| 498 | 51.33 | 60 | 3.07992 |
| 501 | 64.2 | 60 | 3.85224 |
| 503 | 222.73 | 60 | 13.36356 |
| 507 | 62.04 | 60 | 3.72216 |
| 508 | 54.51 | 60 | 3.27042 |
| 511 | 43.16 | 60 | 2.5893 |
| 512 | 264.55 | 60 | 15.87306 |
| 516 | 44.7 | 60 | 2.68218 |
| 517 | 49.93 | 60 | 2.99598 |
| 522 | 52.72 | 60 | 3.16326 |
| 523 | 74.03 | 60 | 4.44156 |
| 526 | 71.29 | 60 | 4.2774 |
| 527 | 38.27 | 60 | 2.29602 |
| 536 | 65.01 | 60 | 3.9006 |
| 537 | 358.86 | 60 | 21.53172 |
| 538 | 57.96 | 60 | 3.4773 |
| 539 | 153.7 | 60 | 9.22188 |
| 540 | 37.69 | 60 | 2.26122 |
| 542 | 64.75 | 60 | 3.88476 |
| 543 | 117.92 | 60 | 7.07538 |
| 544 | 140.3 | 60 | 8.4177 |
| 545 | 127.35 | 60 | 7.64094 |
| 548 | 77.15 | 60 | 4.62882 |
| 549 | 118.49 | 60 | 7.10922 |
| 551 | 66.21 | 60 | 3.97272 |
| 558 | 90.19 | 60 | 5.41134 |
| 559 | 356.5 | 60 | 21.38988 |
| 567 | 250.12 | 60 | 15.00696 |
| 568 | 198.34 | 60 | 11.9004 |
| 569 | 162.51 | 60 | 9.75066 |
| 571 | 142.54 | 60 | 8.55252 |
| 572 | 634 | 60 | 38.04 |
| 573 | 536 | 60 | 32.16 |
| 574 | 694 | 60 | 41.64 |
| 575 | 630 | 60 | 37.8 |
| 579 | 514 | 60 | 30.84 |
| 586 | 622 | 60 | 37.32 |
| 588 | 632 | 60 | 37.92 |
| 590 | 620 | 60 | 37.2 |
| 591 | 712 | 60 | 42.72 |
| 592 | 608 | 60 | 36.48 |
| 594 | 562 | 60 | 33.72 |
| 595 | 752 | 60 | 45.12 |
| 598 | 674 | 60 | 40.44 |
| 599 | 732 | 60 | 43.92 |
| 600 | 626 | 60 | 37.56 |
| 601 | 868 | 60 | 52.08 |
| 602 | 784 | 60 | 47.04 |
| 604 | 395.93 | 60 | 23.7558 |
| 719 | 488.21 | 60 | 29.2923 |
| 723 | 530 | 60 | 31.8 |
| 724 | 728 | 60 | 43.68 |
| 725 | 530 | 60 | 31.8 |
| 726 | 800 | 60 | 48 |
| 324 | 352.69 | 60 | 21.16158 |
| 332 | 334.49 | 60 | 20.06934 |
| 334 | 203.39 | 60 | 12.20364 |
| 335 | 200.28 | 60 | 12.0165 |
| 336 | 181.36 | 60 | 10.88142 |
| 337 | 400 | 60 | 24 |
| 344 | 307.96 | 60 | 18.47772 |
| 345 | 149.27 | 60 | 8.95602 |
| 347 | 360 | 60 | 21.6 |
| 348 | 316 | 60 | 18.96 |
| 352 | 197.95 | 60 | 11.8767 |
| 358 | 485.43 | 60 | 29.1255 |
| 360 | 616 | 60 | 36.96 |
| 361 | 704 | 60 | 42.24 |
| 362 | 219.06 | 60 | 13.14342 |
| 364 | 21.09 | 60 | 1.26558 |
| 369 | 282.26 | 60 | 16.93548 |
| 370 | 464 | 60 | 27.84 |
| 372 | 538 | 60 | 32.28 |
| 374 | 508 | 60 | 30.48 |
| 375 | 57.33 | 60 | 3.43962 |
| 377 | 738 | 60 | 44.28 |
| 381 | 266.58 | 60 | 15.99456 |
| 386 | 356.41 | 60 | 21.38448 |
| 387 | 435 | 60 | 26.1 |
| 393 | 25.58 | 60 | 1.53456 |
| 395 | 397.42 | 60 | 23.84514 |
| 396 | 450 | 60 | 27 |
| 405 | 700 | 60 | 42 |
| 407 | 790 | 60 | 47.4 |
| 408 | 808 | 60 | 48.48 |
| 409 | 646 | 60 | 38.76 |
| 412 | 1.98 | 60 | 0.1188 |
| 416 | 336 | 60 | 20.16 |
| 423 | 392 | 60 | 23.52 |
| 424 | 379.03 | 60 | 22.74198 |
| 426 | 32.25 | 60 | 1.935 |
| 727 | 24.89 | 60 | 1.4931 |
| 728 | 475 | 60 | 28.5 |
| 729 | 326.1 | 60 | 19.56594 |
| 730 | 590 | 60 | 35.4 |
| 737 | 44.43 | 60 | 2.66598 |
| 742 | 353.21 | 60 | 21.19272 |
| 743 | 494.82 | 60 | 29.68932 |
| 744 | 354 | 60 | 21.24 |
| 745 | 218 | 60 | 13.08 |
| 747 | 744 | 60 | 44.64 |
| 748 | 41.7 | 60 | 2.50194 |
| 750 | 584 | 60 | 35.04 |
| 753 | 582 | 60 | 34.92 |
| 758 | 85.61 | 60 | 5.13642 |
| 761 | 404.97 | 60 | 24.29838 |
| 762 | 339.41 | 60 | 20.36484 |
| 763 | 26.26 | 60 | 1.57566 |
| 764 | 192.53 | 60 | 11.55204 |
| 765 | 482 | 60 | 28.92 |
| 766 | 538 | 60 | 32.28 |
| 767 | 554 | 60 | 33.24 |
| 769 | 454 | 60 | 27.24 |
| 771 | 32.76 | 60 | 1.96578 |
| 772 | 448 | 60 | 26.88 |
| 774 | 430 | 60 | 25.8 |
| 777 | 430 | 60 | 25.8 |
| 778 | 980 | 60 | 58.8 |
| 780 | 1200 | 60 | 72 |
| 781 | 1120 | 60 | 67.2 |
| 782 | 928 | 60 | 55.68 |
| 785 | 872 | 60 | 52.32 |
| 786 | 552 | 60 | 33.12 |
| 787 | 718 | 60 | 43.08 |
| 788 | 556 | 60 | 33.36 |
| 790 | 696 | 60 | 41.76 |
| 791 | 670 | 60 | 40.2 |
| 792 | 388 | 60 | 23.28 |
| 794 | 552 | 60 | 33.12 |
| 795 | 370 | 60 | 22.2 |
| 796 | 508 | 60 | 30.48 |
| 797 | 482 | 60 | 28.92 |
| 800 | 582 | 60 | 34.92 |
| 801 | 586 | 60 | 35.16 |
| 804 | 646 | 60 | 38.76 |
| 805 | 538 | 60 | 32.28 |
| 807 | 718 | 60 | 43.08 |
| 811 | 462 | 60 | 27.72 |
| 816 | 444 | 60 | 26.64 |
| 818 | 770 | 60 | 46.2 |
| 819 | 212 | 60 | 12.72 |
| 820 | 610 | 60 | 36.6 |
| 823 | 694 | 60 | 41.64 |
| 824 | 484 | 60 | 29.04 |
| 825 | 348 | 60 | 20.88 |
| 826 | 426 | 60 | 25.56 |
| 427 | 213.91 | 60 | 12.8343 |
| 428 | 269.27 | 60 | 16.15608 |
| 429 | 152.9 | 60 | 9.17424 |
| 430 | 107.76 | 60 | 6.46554 |
| 433 | 149.21 | 60 | 8.95242 |
| 434 | 116.57 | 60 | 6.99396 |
| 435 | 320.71 | 60 | 19.24272 |
| 437 | 163.09 | 60 | 9.78528 |
| 439 | 130.83 | 60 | 7.8498 |
| 440 | 262 | 60 | 15.72 |
| 446 | 415.8 | 60 | 24.94776 |
| 447 | 239.65 | 60 | 14.37912 |
| 448 | 89.74 | 60 | 5.38464 |
| 454 | 298.74 | 60 | 17.92458 |
| 460 | 340 | 60 | 20.4 |
| 461 | 298 | 60 | 17.88 |
| 462 | 466.71 | 60 | 28.0023 |
| 463 | 341.99 | 60 | 20.51946 |
| 465 | 310.13 | 60 | 18.60762 |
| 467 | 179.5 | 60 | 10.76982 |
| 468 | 144.64 | 60 | 8.6784 |
| 473 | 162.82 | 60 | 9.7689 |
| 474 | 306.45 | 60 | 18.387 |
| 605 | 127.74 | 60 | 7.66434 |
| 606 | 268.72 | 60 | 16.1232 |
| 609 | 233.97 | 60 | 14.03808 |
| 612 | 336.64 | 60 | 20.19858 |
| 615 | 255.17 | 60 | 15.31038 |
| 616 | 283.12 | 60 | 16.98696 |
| 617 | 484 | 60 | 29.04 |
| 618 | 102.1 | 60 | 6.12576 |
| 619 | 194.28 | 60 | 11.65698 |
| 620 | 119.26 | 60 | 7.15542 |
| 624 | 107.45 | 60 | 6.44724 |
| 626 | 368.37 | 60 | 22.1022 |
| 627 | 106.09 | 60 | 6.36558 |
| 628 | 236.8 | 60 | 14.2077 |
| 631 | 99.48 | 60 | 5.9685 |
| 633 | 95.01 | 60 | 5.70048 |
| 634 | 103.34 | 60 | 6.2001 |
| 635 | 109.99 | 60 | 6.59928 |
| 636 | 64.64 | 60 | 3.8781 |
| 637 | 87.75 | 60 | 5.26512 |
| 638 | 100.91 | 60 | 6.05466 |
| 639 | 88.95 | 60 | 5.33718 |
| 641 | 132.69 | 60 | 7.96158 |
| 643 | 204.28 | 60 | 12.25674 |
| 650 | 76.79 | 60 | 4.60728 |
| 651 | 168.02 | 60 | 10.0812 |
| 653 | 209.06 | 60 | 12.54336 |
| 655 | 418.67 | 60 | 25.12032 |
| 658 | 380.74 | 60 | 22.84446 |
| 661 | 205.38 | 60 | 12.32256 |
| 662 | 298.04 | 60 | 17.8824 |
| 664 | 591.32 | 60 | 35.47932 |
| 665 | 386.54 | 60 | 23.19234 |
| 666 | 366.54 | 60 | 21.9921 |
| 667 | 211.01 | 60 | 12.66084 |
| 668 | 305.35 | 60 | 18.32118 |
| 670 | 505.6 | 60 | 30.33582 |
| 678 | 473.56 | 60 | 28.41378 |
| 680 | 583.45 | 60 | 35.00706 |
| 682 | 376.9 | 60 | 22.61406 |
| 686 | 426.4 | 60 | 25.5837 |
| 687 | 442.71 | 60 | 26.56266 |
| 688 | 500.23 | 60 | 30.01392 |
| 690 | 555.19 | 60 | 33.31152 |
| 692 | 268.51 | 60 | 16.11084 |
| 694 | 284.53 | 60 | 17.07192 |
| 695 | 448 | 60 | 26.88 |
| 696 | 333.69 | 60 | 20.02128 |
| 697 | 455.07 | 60 | 27.30432 |
| 700 | 569.97 | 60 | 34.19796 |
| 703 | 314.46 | 60 | 18.8676 |
| 705 | 253.77 | 60 | 15.22632 |
| 708 | 280.86 | 60 | 16.85178 |
| 709 | 271.21 | 60 | 16.2723 |
| 712 | 185.48 | 60 | 11.12892 |
| 713 | 249.57 | 60 | 14.97444 |
| 714 | 416.3 | 60 | 24.97824 |
| 715 | 354.83 | 60 | 21.29004 |
| 717 | 37.29 | 60 | 2.23746 |
| 718 | 184.58 | 60 | 11.0745 |
| 827 | 95.29 | 60 | 5.71764 |
| 828 | 267.7 | 60 | 16.06188 |
| 829 | 256.28 | 60 | 15.37698 |
| 830 | 275.84 | 60 | 16.5504 |
| 831 | 312.1 | 60 | 18.72618 |
| 832 | 780 | 60 | 46.8 |
| 834 | 219.74 | 60 | 13.18446 |
| 835 | 90.31 | 60 | 5.41872 |
| 836 | 285.74 | 60 | 17.14422 |
| 837 | 462 | 60 | 27.72 |
| 841 | 231.66 | 60 | 13.8996 |
| 843 | 411.4 | 60 | 24.68382 |
| 848 | 397.33 | 60 | 23.83998 |
| 849 | 466 | 60 | 27.96 |
| 850 | 502 | 60 | 30.12 |
| 851 | 366.59 | 60 | 21.99516 |
| 852 | 648 | 60 | 38.88 |
| 853 | 37.03 | 60 | 2.22174 |
| 854 | 486 | 60 | 29.16 |
| 859 | 460 | 60 | 27.6 |
| 861 | 701 | 60 | 42.06 |
| 862 | 348.1 | 60 | 20.88582 |
| 866 | 402 | 60 | 24.12 |
| 868 | 191.16 | 60 | 11.46966 |
| 870 | 544 | 60 | 32.64 |
| 872 | 301.79 | 60 | 18.10752 |
| 873 | 478.29 | 60 | 28.69764 |
| 874 | 289.01 | 60 | 17.34066 |
| 875 | 542 | 60 | 32.52 |
| 878 | 29.34 | 60 | 1.76064 |
| 879 | 21.14 | 60 | 1.2681 |
| 881 | 544 | 60 | 32.64 |
| 882 | 195.73 | 60 | 11.74362 |
| 883 | 548 | 60 | 32.88 |
| 884 | 369.57 | 60 | 22.17396 |
| 885 | 318.24 | 60 | 19.09434 |
| 888 | 486 | 60 | 29.16 |
| 889 | 460 | 60 | 27.6 |
| 891 | 202.48 | 60 | 12.1488 |
| 892 | 220.65 | 60 | 13.23882 |
| 893 | 352 | 130 | 45.76 |
| 895 | 235.94 | 130 | 30.67259 |
| 899 | 30.94 | 60 | 1.85628 |
| 900 | 353.51 | 130 | 45.95578 |
| 901 | 238 | 130 | 30.94 |
| 902 | 502 | 130 | 65.26 |
| 903 | 50.78 | 130 | 6.60192 |
| 904 | 334 | 130 | 43.42 |
| 905 | 448.44 | 130 | 58.29658 |
| 911 | 334.39 | 130 | 43.4708 |
| 912 | 356.51 | 130 | 46.34635 |
| 913 | 397.44 | 130 | 51.6672 |
| 914 | 475.32 | 130 | 61.79121 |
| 915 | 478.27 | 130 | 62.17497 |
| 916 | 392.98 | 130 | 51.0875 |
| 918 | 1020 | 130 | 132.6 |
| 919 | 428.47 | 130 | 55.70074 |
| 920 | 375.92 | 130 | 48.86947 |
| 921 | 485.96 | 130 | 63.1747 |
| 922 | 468.72 | 130 | 60.93305 |
| 927 | 404.72 | 130 | 52.61334 |
| 929 | 443.53 | 130 | 57.65908 |
| 930 | 338.17 | 130 | 43.96197 |
| 931 | 339.01 | 130 | 44.07109 |
| 932 | 350.68 | 130 | 45.5878 |
| 933 | 389.93 | 130 | 50.69103 |
| 934 | 354.19 | 130 | 46.04418 |
| 935 | 457.94 | 130 | 59.53194 |
| 936 | 362.48 | 130 | 47.12214 |
| 938 | 389.07 | 130 | 50.57949 |
| 939 | 361.36 | 130 | 46.97729 |
| 943 | 332.7 | 130 | 43.25116 |
| 944 | 363.62 | 130 | 47.27042 |
| 946 | 442.77 | 130 | 57.55997 |
| 953 | 413.29 | 130 | 53.72718 |
| 954 | 344.66 | 130 | 44.80531 |
| 955 | 322.2 | 130 | 41.88639 |
| 956 | 336.58 | 130 | 43.75504 |
| 957 | 384.55 | 130 | 49.99129 |
| 958 | 436.97 | 130 | 56.8061 |
| 959 | 326.5 | 130 | 42.4451 |
| 960 | 357.26 | 130 | 46.44377 |
| 962 | 380.7 | 130 | 49.49116 |
| 963 | 410.2 | 130 | 53.32613 |
| 964 | 402.55 | 130 | 52.3315 |
| 965 | 484.12 | 130 | 62.93573 |
| 966 | 356.09 | 130 | 46.29136 |
| 968 | 413.37 | 130 | 53.73797 |
| 969 | 480.94 | 130 | 62.52277 |
| 970 | 351.21 | 130 | 45.65696 |
| 975 | 420.35 | 130 | 54.64524 |
| 976 | 446.57 | 130 | 58.05415 |
| 977 | 360.81 | 130 | 46.90517 |
| 980 | 406.76 | 130 | 52.87924 |
| 981 | 465.2 | 130 | 60.47574 |
| 982 | 433.07 | 130 | 56.29845 |
| 983 | 483.84 | 130 | 62.89907 |
| 985 | 454.13 | 130 | 59.03711 |
| 986 | 340.35 | 130 | 44.24519 |
| 987 | 474.46 | 130 | 61.67928 |
| 876 | 464 | 60 | 27.84 |
Table A3.
Statistics of SNP detection and annotation results.
Table A3.
Statistics of SNP detection and annotation results.
| Category | Number of SNPs | |
|---|---|---|
| Upstream | 181,049 | |
| Exonic | Stopgain | 437 |
| Exonic | Stoploss | 53 |
| Exonic | Synonymous | 129,104 |
| Exonic | Non-synonymous | 59,403 |
| Intronic | 5,746,658 | |
| Splicing | 226 | |
| Downstream | 166,387 | |
| Upstream/Downstream | 9724 | |
| Intergenic | 6,350,604 | |
| Ts | 8,995,777 | |
| Tv | 3,648,686 | |
| ts/tv | 2.465 | |
| Total | 12,644,463 |
Table A4.
Significant SNP classification annotation result statistics.
Table A4.
Significant SNP classification annotation result statistics.
| Category | Number of SNPs | |
|---|---|---|
| Upstream | 2 | |
| Exonic | Synonymous | 1 |
| Exonic | Non-synonymous | 1 |
| Intronic | 138 | |
| Intergenic | 76 | |
| Total | 218 |
Table A5.
Information table of significant SNPs on sex chromosomes (top 20 p-values).
Table A5.
Information table of significant SNPs on sex chromosomes (top 20 p-values).
| Chr | Num_snp | LOG10 (Peak p-Value) | Peak-Effect |
|---|---|---|---|
| Chr1 | 1 | 8.87361 | exon, synonymous |
| ChrZ | 3 | 8.28455 | intronic(gene_DTWD2) |
| ChrZ | 13 | 8.02251 | intronic(gene_NRG1) |
| Chr1 | 3 | 7.87361 | intergenic(/) |
| ChrZ | 9 | 7.81761 | intronic(gene_ANKDD1B) |
| Chr20 | 11 | 7.38612 | intergenic(gene_EIF6(dist = 1613)) |
| Chr20 | 3 | 7.29405 | intronic(gene_FAM83C) |
| Chr4 | 1 | 7.00458 | intergenic(/) |
| ChrZ | 3 | 6.87857 | intergenic(/) |
| Chr27 | 1 | 6.86258 | intronic(gene_HAP1) |
| ChrZ | 15 | 6.82981 | intronic(gene_BNC2) |
| ChrZ | 5 | 6.75517 | intergenic(/) |
| Chr4 | 1 | 6.74306 | intergenic(/) |
| Chr10 | 1 | 6.72638 | intronic(gene_UACA) |
| ChrZ | 1 | 6.69983 | intergenic(/) |
| Chr39 | 1 | 6.68551 | intronic(gene_SCYL1) |
| ChrZ | 3 | 6.62974 | intronic(gene_TRIM36) |
| Chr2 | 2 | 6.57298 | intronic(gene_TRAPPC9) |
| ChrZ | 2 | 6.55467 | intergenic(/) |
| ChrZ | 1 | 6.5532 | intergenic(/) |
Table A6.
Information table of significant SNPs in A series (top 10 p-values).
Table A6.
Information table of significant SNPs in A series (top 10 p-values).
| chr | LOG10 (p-Value) | Peak-Effect |
|---|---|---|
| Chr28 | 5.54968 | downstream(gene_ANKRD24) |
| Chr6 | 5.32531 | downstream(gene_MCMBP) |
| Chr6 | 5.32531 | downstream(gene_MCMBP) |
| Chr28 | 5.49501 | downstream(gene_UQCR11) |
| Chr1 | 5.43904 | intergenic(gene_BTG1(dist = 180,311), gene_PLEKHG7(dist = 2624)) |
| Chr1 | 5.44633 | intergenic(gene_DCN(dist = 309,120), gene_BTG1(dist = 34,815)) |
| Chr1 | 5.38578 | intergenic(gene_LOC100858183(dist = 190,260), gene_EPYC(dist = 90,243)) |
| Chr1 | 5.36285 | intergenic(gene_LOC100858183(dist = 194,698), gene_EPYC(dist = 85,805)) |
| Chr1 | 5.36285 | intergenic(gene_LOC100858183(dist = 198,500), gene_EPYC(dist = 82,003)) |
| Chr1 | 5.67468 | intergenic(gene_LOC100858183(dist = 201,260), gene_EPYC(dist = 79,243)) |
Table A7.
Differential gene table.
Table A7.
Differential gene table.
| Gene | Organization | p-Value | ALV Expression | Control Expression |
|---|---|---|---|---|
| CDH11 | Kidney | 0.012442 | 357.8311495 | 830.4326925 |
| ANKH | Liver | 0.002114 | 2278.261492 | 926.0824854 |
| SLC5A1 | Spleen | 0.005622 | 47.73315057 | 129.0051109 |
References
- Mohammadifar, A.; Mohammadabadi, M.R. The Effect of Uncoupling Protein Polymorphisms on Growth, Breeding Value of Growth and Reproductive Traits in the Fars Indigenous Chicken. Iran. J. Appl. Anim. Sci. 2017, 7, 679–685. [Google Scholar]
- Khabiri, A.; Toroghi, R.; Mohammadabadi, M.; Tabatabaeizadeh, S. Introduction of a Newcastle Disease Virus Challenge Strain (Sub-Genotype VII.1.1) Isolated in Iran. Vet. Res. Forum 2023, 14, 221–228. [Google Scholar] [CrossRef]
- Li, Y.; Liu, X.; Liu, H.; Xu, C.; Liao, Y.; Wu, X.; Cao, W.; Liao, M. Isolation, Identification, and Phylogenetic Analysis of Two Avian Leukosis Virus Subgroup J Strains Associated with Hemangioma and Myeloid Leukosis. Vet. Microbiol. 2013, 166, 356–364. [Google Scholar] [CrossRef]
- Xu, M.; Qian, K.; Shao, H.; Yao, Y.; Nair, V.; Ye, J.; Qin, A. 3’UTR of ALV-J Can Affect Viral Replication through Promoting Transcription and mRNA Nuclear Export. J. Virol. 2023, 97, e0115223. [Google Scholar] [CrossRef] [PubMed]
- Wang, G.J.; Chen, Y.; Zhao, R.; Yan, H.Y.; Li, K.; Li, W.G.; Xin, A.G. Isolation and Whole-Genome Genetic Evolution Analysis of Subgroup J Avian Leukosis Virus in Silky Fowl. Chin. Vet. Sci. 2023, 53, 1122–1130. [Google Scholar] [CrossRef]
- Qu, Y.; Liu, L.; Niu, Y.; Qu, Y.; Li, N.; Sun, W.; Lv, C.; Wang, P.; Zhang, G.; Liu, S. Viral Proliferation and Expression of Tumor-Related Gene in Different Chicken Embryo Fibroblasts Infected with Different Tumorigenic Phenotypes of Avian Leukosis Virus Subgroup J. Poult. Sci. 2016, 95, 2383–2390. [Google Scholar] [CrossRef]
- Payne, L.N.; Nair, V. The Long View: 40 Years of Avian Leukosis Research. Avian Pathol. 2012, 41, 11–19. [Google Scholar] [CrossRef]
- Xu, Q.Q.; Wang, F.; Sun, P.; Wang, W.X. Recent Advances in ALV-J Research: Domestic and International Perspectives. Chin. J. Vet. Sci. 2018, 38, 1820–1824. [Google Scholar] [CrossRef]
- Cai, B.Y.; Tian, Q.Z.; Dai, J.H.; Mu, X.H.; Bai, Y.B. Investigation and Eradication of ALV Infection in Different Local Chicken Breeds. Livest. Poult. Ind. 2021, 32, 1–3+6. [Google Scholar] [CrossRef]
- Tan, Y.G.; Cao, H.Y.; Dong, X.Y.; Mao, H.G.; Lu, L.; Jiang, J.B.; Ma, Y.Z.; Yin, Z.Z. Genome-Wide Association Study of Growth and Carcass Traits in Ninghai Yellow Chickens and Guangxi Yellow Chickens Based on 600K SNP Chip Technology. J. Agric. Biotechnol. 2019, 27, 1434–1444. [Google Scholar]
- Ni, Y.L. Development of ISIS EM-BLASSO Software Package for Multi-Locus Genome-Wide Association Analysis. Master’s Thesis, Nanjing Agricultural University, Nanjing, China, 2017. [Google Scholar]
- Flint-Garcia, S.A.; Thornsberry, J.M.; Buckler, E.S. Structure of Linkage Disequilibrium in Plants. Annu. Rev. Plant Biol. 2003, 54, 357–374. [Google Scholar] [CrossRef]
- Mebratie, W.; Reyer, H.; Wimmers, K.; Bovenhuis, H.; Jensen, J. Genome Wide Association Study of Body Weight and Feed Efficiency Traits in a Commercial Broiler Chicken Population, a Re-Visitation. Sci. Rep. 2019, 9, 922. [Google Scholar] [CrossRef] [PubMed]
- Liu, Z.; Sun, C.; Yan, Y.; Li, G.; Shi, F.; Wu, G.; Liu, A.; Yang, N. Genetic Variations for Egg Quality of Chickens at Late Laying Period Revealed by Genome-Wide Association Study. Sci. Rep. 2018, 8, 10832. [Google Scholar] [CrossRef] [PubMed]
- Wolc, A.; Drobik-Czwarno, W.; Fulton, J.E.; Arango, J.; Jankowski, T.; Dekkers, J.C.M. Genomic Prediction of Avian Influenza Infection Outcome in Layer Chickens. Genet. Sel. Evol. 2018, 50, 21. [Google Scholar] [CrossRef] [PubMed]
- Xiao, L.; He, C.; Luo, L.; Yang, K.; Yang, L.; Xu, K.; Zheng, Y.; Gu, C.; Huang, Q.; Meng, H. Genome-Wide Association Study Identified Genes in the Response to Salmonella Pullorum Infection in Chickens. Anim. Genet. 2019, 50, 403–406. [Google Scholar] [CrossRef]
- Shook, G.E. Selection for Disease Resistance. J. Dairy Sci. 1989, 72, 1349–1362. [Google Scholar] [CrossRef]
- Zhang, L.; Li, P.; Liu, R.; Zheng, M.; Sun, Y.; Wu, D.; Hu, Y.; Wen, J.; Zhao, G. The Identification of Loci for Immune Traits in Chickens Using a Genome-Wide Association Study. PLoS ONE 2015, 10, e0117269. [Google Scholar] [CrossRef]
- Molecular Cloning: A Laboratory Manual (3rd Edition). Chin. Sci. Bull. 2002, 47, 1888. [CrossRef]
- Danecek, P.; Bonfield, J.K.; Liddle, J.; Marshall, J.; Ohan, V.; Pollard, M.O.; Whitwham, A.; Keane, T.; McCarthy, S.A.; Davies, R.M.; et al. Twelve Years of SAMtools and BCFtools. GigaScience 2021, 10, giab008. [Google Scholar] [CrossRef]
- Saitou, N.; Nei, M. The Neighbor-Joining Method: A New Method for Reconstructing Phylogenetic Trees. Mol. Biol. Evol. 1987, 4, 406–425. [Google Scholar] [CrossRef]
- Yang, J.; Lee, S.H.; Goddard, M.E.; Visscher, P.M. GCTA: A Tool for Genome-Wide Complex Trait Analysis. Am. J. Hum. Genet. 2011, 88, 76–82. [Google Scholar] [CrossRef] [PubMed]
- Yu, J.; Pressoir, G.; Briggs, W.H.; Vroh Bi, I.; Yamasaki, M.; Doebley, J.F.; McMullen, M.D.; Gaut, B.S.; Nielsen, D.M.; Holland, J.B.; et al. A Unified Mixed-Model Method for Association Mapping That Accounts for Multiple Levels of Relatedness. Nat. Genet. 2006, 38, 203–208. [Google Scholar] [CrossRef]
- Zhou, X.; Stephens, M. Genome-Wide Efficient Mixed-Model Analysis for Association Studies. Nat. Genet. 2012, 44, 821–824. [Google Scholar] [CrossRef]
- Lu, Z.; Yue, Y.; Yuan, C.; Liu, J.; Chen, Z.; Niu, C.; Sun, X.; Zhu, S.; Zhao, H.; Guo, T.; et al. Genome-Wide Association Study of Body Weight Traits in Chinese Fine-Wool Sheep. Animals 2020, 10, 170. [Google Scholar] [CrossRef] [PubMed]
- Kramarz, B.; Huntley, R.P.; Rodríguez-López, M.; Roncaglia, P.; Saverimuttu, S.C.C.; Parkinson, H.; Bandopadhyay, R.; Martin, M.-J.; Orchard, S.; Hooper, N.M.; et al. Gene Ontology Curation of Neuroinflammation Biology Improves the Interpretation of Alzheimer’s Disease Gene Expression Data. J. Alzheimer’s Dis. 2020, 75, 1417–1435. [Google Scholar] [CrossRef] [PubMed]
- Corfitsen, H.T.; Krantz, B.; Larsen, A.; Drago, A. Molecular Pathway Analysis Associates Alterations in Obesity-Related Genes and Antipsychotic-Induced Weight Gain. Acta Neuropsychiatr. 2020, 32, 72–83. [Google Scholar] [CrossRef]
- Bray, N.L.; Pimentel, H.; Melsted, P.; Pachter, L. Near-Optimal Probabilistic RNA-Seq Quantification. Nat. Biotechnol. 2016, 34, 525–527. [Google Scholar] [CrossRef] [PubMed]
- Liao, Y.; Smyth, G.K.; Shi, W. featureCounts: An Efficient General Purpose Program for Assigning Sequence Reads to Genomic Features. Bioinformatics 2014, 30, 923–930. [Google Scholar] [CrossRef]
- Love, M.I.; Huber, W.; Anders, S. Moderated Estimation of Fold Change and Dispersion for RNA-Seq Data with DESeq2. Genome Biol. 2014, 15, 550. [Google Scholar] [CrossRef]
- Taylor, S.C.; Nadeau, K.; Abbasi, M.; Lachance, C.; Nguyen, M.; Fenrich, J. The Ultimate qPCR Experiment: Producing Publication Quality, Reproducible Data the First Time. Trends Biotechnol. 2019, 37, 761–774. [Google Scholar] [CrossRef]
- Chai, N.; Bates, P. Na+/H+ Exchanger Type 1 Is a Receptor for Pathogenic Subgroup J Avian Leukosis Virus. Proc. Natl. Acad. Sci. USA 2006, 103, 5531–5536. [Google Scholar] [CrossRef] [PubMed]
- Mcheik, S.; Aptecar, L.; Coopman, P.; D’Hondt, V.; Freiss, G. Dual Role of the PTPN13 Tyrosine Phosphatase in Cancer. Biomolecules 2020, 10, 1659. [Google Scholar] [CrossRef] [PubMed]
- Huang, W.; Bei, L.; Eklund, E.A. Fas-Associated Phosphatase 1 Mediates Fas Resistance in Myeloid Progenitor Cells Expressing the Bcr–Abl Oncogene. Leuk. Lymphoma 2013, 54, 619–630. [Google Scholar] [CrossRef]
- Krishnamurthy, D.; Barrios, A.M. Profiling Protein Tyrosine Phosphatase Activity with Mechanistic Probes. Curr. Opin. Chem. Biol. 2009, 13, 375–381. [Google Scholar] [CrossRef]
- Lin, M.F.; Lee, M.S.; Zhou, X.W.; Andressen, J.C.; Meng, T.C.; Johansson, S.L.; West, W.W.; Taylor, R.J.; Anderson, J.R.; Lin, F.F. Decreased Expression of Cellular Prostatic Acid Phosphatase Increases Tumorigenicity of Human Prostate Cancer Cells. J. Urol. 2001, 166, 1943–1950. [Google Scholar] [CrossRef] [PubMed]
- Barlési, F.; Pinot, D.; Legoffic, A.; Doddoli, C.; Chetaille, B.; Torre, J.-P.; Astoul, P. Positive Thyroid Transcription Factor 1 Staining Strongly Correlates with Survival of Patients with Adenocarcinoma of the Lung. Br. J. Cancer 2005, 93, 450–452. [Google Scholar] [CrossRef]
- Nettore, I.C.; Mirra, P.; Ferrara, A.M.; Sibilio, A.; Pagliara, V.; Kay, C.S.K.; Lorenzoni, P.J.; Werneck, L.C.; Bruck, I.; Dos Santos, L.H.C.; et al. Identification and Functional Characterization of a Novel Mutation in the NKX2-1 Gene: Comparison with the Data in the Literature. Thyroid 2013, 23, 675–682. [Google Scholar] [CrossRef]
- Gao, Y.; Chen, F.; Niu, S.; Lin, S.; Li, S. Replication and Meta-Analysis of Common Gene Mutations in TTF1 and TTF2 with Papillary Thyroid Cancer. Medicine 2015, 94, e1246. [Google Scholar] [CrossRef]
- Osma-Garcia, I.C.; Capitan-Sobrino, D.; Mouysset, M.; Aubert, Y.; Maloudi, O.; Turner, M.; Diaz-Muñoz, M.D. The Splicing Regulators TIA1 and TIAL1 Are Required for the Expression of the DNA Damage Repair Machinery during B Cell Lymphopoiesis. Cell Rep. 2022, 41, 111869. [Google Scholar] [CrossRef]
- Keane, S.; Herring, M.; Rolny, P.; Wettergren, Y.; Ejeskär, K. Inflammation Suppresses DLG2 Expression Decreasing Inflammasome Formation. J. Cancer Res. Clin. Oncol. 2022, 148, 2295–2311. [Google Scholar] [CrossRef]
- Shao, Y.W.; Wood, G.A.; Lu, J.; Tang, Q.-L.; Liu, J.; Molyneux, S.; Chen, Y.; Fang, H.; Adissu, H.; McKee, T.; et al. Cross-Species Genomics Identifies DLG2 as a Tumor Suppressor in Osteosarcoma. Oncogene 2019, 38, 291–298. [Google Scholar] [CrossRef] [PubMed]
- Keane, S.; Améen, S.; Lindlöf, A.; Ejeskär, K. Low DLG2 Gene Expression, a Link between 11q-Deleted and MYCN-Amplified Neuroblastoma, Causes Forced Cell Cycle Progression, and Predicts Poor Patient Survival. Cell Commun. Signal. 2020, 18, 65. [Google Scholar] [CrossRef]
- Mo, G.; Fu, H.; Hu, B.; Zhang, Q.; Xian, M.; Zhang, Z.; Lin, L.; Shi, M.; Nie, Q.; Zhang, X. SOCS3 Promotes ALV-J Virus Replication via Inhibiting JAK2/STAT3 Phosphorylation During Infection. Front. Cell. Infect. Microbiol. 2021, 11, 748795. [Google Scholar] [CrossRef] [PubMed]
- Camuzi, D.; Buexm, L.A.; Lourenço, S.d.Q.C.; Grazziotin, R.; Guaraldi, S.; Valverde, P.; Rapozo, D.; Brooks, J.M.; Mehanna, H.; Ribeiro Pinto, L.F.; et al. FBXL7 Body Hypomethylation Is Frequent in Tumors from the Digestive and Respiratory Tracts and Is Associated with Risk-Factor Exposure. Int. J. Mol. Sci. 2022, 23, 7801. [Google Scholar] [CrossRef] [PubMed]
- Collins, M.T.; Boehm, M. It ANKH Necessarily So. J. Clin. Endocrinol. Metab. 2011, 96, 72–74. [Google Scholar] [CrossRef]
- Williams, C.J. The Role of ANKH in Pathologic Mineralization of Cartilage. Curr. Opin. Rheumatol. 2016, 28, 145–151. [Google Scholar] [CrossRef]
- Vijen, S.; Hawes, C.; Runions, J.; Russell, R.G.G.; Wordsworth, B.P.; Carr, A.J.; Pink, R.C.; Zhang, Y. Differences in Intracellular Localisation of ANKH Mutants That Relate to Mechanisms of Calcium Pyrophosphate Deposition Disease and Craniometaphyseal Dysplasia. Sci. Rep. 2020, 10, 7408. [Google Scholar] [CrossRef]
- Lee, H.J.; Kwon, M.H.; Lee, S.; Hall, R.A.; Yun, C.C.; Choi, I. Systematic Family-Wide Analysis of Sodium Bicarbonate Cotransporter NBCn1/SLC4A7 Interactions with PDZ Scaffold Proteins. Physiol. Rep. 2014, 2, e12016. [Google Scholar] [CrossRef]
- Sedlyarov, V.; Eichner, R.; Girardi, E.; Essletzbichler, P.; Goldmann, U.; Nunes-Hasler, P.; Srndic, I.; Moskovskich, A.; Heinz, L.X.; Kartnig, F.; et al. The Bicarbonate Transporter SLC4A7 Plays a Key Role in Macrophage Phagosome Acidification. Cell Host Microbe 2018, 23, 766–774.e5. [Google Scholar] [CrossRef]
- Lee, S.; Axelsen, T.V.; Jessen, N.; Pedersen, S.F.; Vahl, P.; Boedtkjer, E. Na+,HCO3−-Cotransporter NBCn1 (Slc4a7) Accelerates ErbB2-Induced Breast Cancer Development and Tumor Growth in Mice. Oncogene 2018, 37, 5569–5584. [Google Scholar] [CrossRef]
- Pedersen, S.H.F. Acid-Base Transporters in the Context of Tumor Heterogeneity. Pflüg. Arch. 2024, 476, 689–701. [Google Scholar] [CrossRef]
- Zhou, Y.; Ma, X.; Sun, J. Update on the Relationship between the SLC4A7 Variant Rs4973768 and Breast Cancer Risk: A Systematic Review and Meta-Analysis. J. Int. Med. Res. 2023, 51, 3000605231166517. [Google Scholar] [CrossRef] [PubMed]
- Boedtkjer, E. Na+,HCO3− Cotransporter NBCn1 Accelerates Breast Carcinogenesis. Cancer Metastasis Rev. 2019, 38, 165–178. [Google Scholar] [CrossRef] [PubMed]
- Dong, J.; Zhong, J.-W.; Xu, Y.-L.; Ma, Y.; Duan, X.-H. Research progress on structure, function and disease correlation of solute carrier family 4. Acta Physiol. Sin. 2023, 75, 137–150. [Google Scholar]
- Han, L.; Qu, Q.; Aydin, D.; Panova, O.; Robertson, M.J.; Xu, Y.; Dror, R.O.; Skiniotis, G.; Feng, L. Structure and Mechanism of the SGLT Family of Glucose Transporters. Nature 2022, 601, 274–279. [Google Scholar] [CrossRef] [PubMed]
- Rieg, T.; Vallon, V. Development of SGLT1 and SGLT2 Inhibitors. Diabetologia 2018, 61, 2079–2086. [Google Scholar] [CrossRef]
- Peran, I.; Dakshanamurthy, S.; McCoy, M.D.; Mavropoulos, A.; Allo, B.; Sebastian, A.; Hum, N.R.; Sprague, S.C.; Martin, K.A.; Pishvaian, M.J.; et al. Cadherin 11 Promotes Immunosuppression and Extracellular Matrix Deposition to Support Growth of Pancreatic Tumors and Resistance to Gemcitabine in Mice. Gastroenterology 2021, 160, 1359–1372.e13. [Google Scholar] [CrossRef]
- Hendrix, M.J.; Seftor, E.A.; Meltzer, P.S.; Gardner, L.M.; Hess, A.R.; Kirschmann, D.A.; Schatteman, G.C.; Seftor, R.E. Expression and Functional Significance of VE-Cadherin in Aggressive Human Melanoma Cells: Role in Vasculogenic Mimicry. Proc. Natl. Acad. Sci. USA 2001, 98, 8018–8023. [Google Scholar] [CrossRef]
- Li, Y.; Wu, Q.; Lv, J.; Gu, J. A Comprehensive Pan-Cancer Analysis of CDH5 in Immunological Response. Front. Immunol. 2023, 14, 1239875. [Google Scholar] [CrossRef]
- Owen, K.L.; Brockwell, N.K.; Parker, B.S. JAK-STAT Signaling: A Double-Edged Sword of Immune Regulation and Cancer Progression. Cancers 2019, 11, 2002. [Google Scholar] [CrossRef]
- Xue, C.; Yao, Q.; Gu, X.; Shi, Q.; Yuan, X.; Chu, Q.; Bao, Z.; Lu, J.; Li, L. Evolving Cognition of the JAK-STAT Signaling Pathway: Autoimmune Disorders and Cancer. Signal Transduct. Target. Ther. 2023, 8, 204. [Google Scholar] [CrossRef]
- Mirtti, T.; Leiby, B.E.; Abdulghani, J.; Aaltonen, E.; Pavela, M.; Mamtani, A.; Alanen, K.; Egevad, L.; Granfors, T.; Josefsson, A.; et al. Nuclear Stat5a/b Predicts Early Recurrence and Prostate Cancer-Specific Death in Patients Treated by Radical Prostatectomy. Hum. Pathol. 2013, 44, 310–319. [Google Scholar] [CrossRef] [PubMed]
- Boyle, D.L.; Soma, K.; Hodge, J.; Kavanaugh, A.; Mandel, D.; Mease, P.; Shurmur, R.; Singhal, A.K.; Wei, N.; Rosengren, S.; et al. The JAK Inhibitor Tofacitinib Suppresses Synovial JAK1-STAT Signalling in Rheumatoid Arthritis. Ann. Rheum. Dis. 2015, 74, 1311–1316. [Google Scholar] [CrossRef] [PubMed]
- Xin, P.; Xu, X.; Deng, C.; Liu, S.; Wang, Y.; Zhou, X.; Ma, H.; Wei, D.; Sun, S. The Role of JAK/STAT Signaling Pathway and Its Inhibitors in Diseases. Int. Immunopharmacol. 2020, 80, 106210. [Google Scholar] [CrossRef]
- Feng, M.; Xie, T.; Li, Y.; Zhang, N.; Lu, Q.; Zhou, Y.; Shi, M.; Sun, J.; Zhang, X. A Balanced Game: Chicken Macrophage Response to ALV-J Infection. Vet. Res. 2019, 50, 20. [Google Scholar] [CrossRef] [PubMed]
- Bao, Y.; Wang, L.; Shi, L.; Yun, F.; Liu, X.; Chen, Y.; Chen, C.; Ren, Y.; Jia, Y. Transcriptome Profiling Revealed Multiple Genes and ECM-Receptor Interaction Pathways That May Be Associated with Breast Cancer. Cell. Mol. Biol. Lett. 2019, 24, 38. [Google Scholar] [CrossRef]
- Andersen, M.K.; Rise, K.; Giskeødegård, G.F.; Richardsen, E.; Bertilsson, H.; Størkersen, Ø.; Bathen, T.F.; Rye, M.; Tessem, M.-B. Integrative Metabolic and Transcriptomic Profiling of Prostate Cancer Tissue Containing Reactive Stroma. Sci. Rep. 2018, 8, 14269. [Google Scholar] [CrossRef]
- Yan, P.; He, Y.; Xie, K.; Kong, S.; Zhao, W. In Silico Analyses for Potential Key Genes Associated with Gastric Cancer. PeerJ 2018, 6, e6092. [Google Scholar] [CrossRef]
- Rahbari, N.N.; Kedrin, D.; Incio, J.; Liu, H.; Ho, W.W.; Nia, H.T.; Edrich, C.M.; Jung, K.; Daubriac, J.; Chen, I.; et al. Anti-VEGF Therapy Induces ECM Remodeling and Mechanical Barriers to Therapy in Colorectal Cancer Liver Metastases. Sci. Transl. Med. 2016, 8, 360ra135. [Google Scholar] [CrossRef]
- Nguyen-Ngoc, K.-V.; Cheung, K.J.; Brenot, A.; Shamir, E.R.; Gray, R.S.; Hines, W.C.; Yaswen, P.; Werb, Z.; Ewald, A.J. ECM Microenvironment Regulates Collective Migration and Local Dissemination in Normal and Malignant Mammary Epithelium. Proc. Natl. Acad. Sci. USA 2012, 109, E2595–E2604. [Google Scholar] [CrossRef]
- Hu, B.; Zou, X.; Yu, Y.; Jiang, Y.; Xu, H. METTL3 Promotes SMSCs Chondrogenic Differentiation by Targeting the MMP3, MMP13, and GATA3. Regen. Ther. 2023, 22, 148–159. [Google Scholar] [CrossRef] [PubMed]
- Kalhan, S.C. One-Carbon Metabolism, Fetal Growth and Long-Term Consequences. Nestle Nutr. Inst. Workshop Ser. 2013, 74, 127–138. [Google Scholar] [CrossRef] [PubMed]
- Assaraf, Y.G. Molecular Basis of Antifolate Resistance. Cancer Metastasis Rev. 2007, 26, 153–181. [Google Scholar] [CrossRef] [PubMed]
Disclaimer/Publisher’s Note: The statements, opinions and data contained in all publications are solely those of the individual author(s) and contributor(s) and not of MDPI and/or the editor(s). MDPI and/or the editor(s) disclaim responsibility for any injury to people or property resulting from any ideas, methods, instructions or products referred to in the content. |
© 2025 by the authors. Licensee MDPI, Basel, Switzerland. This article is an open access article distributed under the terms and conditions of the Creative Commons Attribution (CC BY) license (https://creativecommons.org/licenses/by/4.0/).