Simple Summary
There is little information about the consequences of variation in birth weight due to intrauterine growth on postnatal growth and development of lambs. This study, therefore, investigated the effects of birth weight on postnatal growth, fattening performance, muscle mass development, muscle fibre characteristics, and meat quality in Karayaka lambs. The results of the study show that heavier-born lambs develop better, which is reflected in fattening performance and carcass characteristics. Although there was no difference in meat quality parameters, it was found a significant difference in the fibre area of Type I fibres in the longissimus thoracis et lumborum muscle due to birth weight. The results of the study provide essential insights into the complex relationship between birth weight and various physiological values such as carcass parameters, muscle mass development, and muscle fibre characteristics in post-weaning fattening of Karayaka lambs.
Abstract
This investigation aimed to assess the influence of birth weight on post-weaning fattening performance, meat quality, muscle fibre characteristics, and carcass traits in Karayaka lambs. The study categorized the lambs into three distinct groups based on birth weight: low birth weight (LBW), medium birth weight (MBW), and high birth weight (HBW). Throughout the fattening phase, the lambs were given ad libitum access to food and water, culminating in the slaughter at the end of the study. Following slaughter, warm and cold carcasses were weighted, and specific muscles (longissimus thoracis et lumborum [LTL], semitendinosus [ST], and semimembranosus [SM]) were isolated for the evaluation of muscle weights, muscle fibre types (Type I, Type IIA, and Type IIB), and muscle fibre numbers. Carcass characteristics were also determined, including eye muscle (LTL) fat, loin thickness, and meat quality characteristics, such as pH, colour, texture, cooking loss, and water-holding capacity. The statistical analysis revealed highly significant differences among the experimental groups concerning muscle weights and warm and cold carcass weights (p < 0.01), with the lambs in the HBW group exhibiting a notably higher carcass yield (in females: 45.65 ± 1.34% and in males: 46.18 ± 0.77%) and LTL, ST, and SM (except for female lambs) muscle weights than the lambs in LBW group (p < 0.01). However, apart from the texture of LTL and ST muscles, no significant differences in meat quality parameters were observed among the treatment groups (p > 0.05). Notably, the birth weight of lambs did not impart a discernible effect on the total number and metabolic activity of muscle fibres in LTL, ST, and SM muscles. Nonetheless, a noteworthy distinction in the fibre area of Type I fibres in the LTL muscle of male lambs (LBW: 30.4 ± 8.9, MBW: 29.1 ± 7.3 and HBW; 77.3 ± 15.4) and in the ST muscle of female lambs (LBW: 44.1 ± 8.1, MBW: 38.8 ± 7.7 and HBW: 36.9 ± 7.1) were evident among the birth weight groups (p < 0.05). The study also found that the mean fat thickness values of eye muscles in Karayaka lambs, as obtained by ultrasonic tests, were below the typical range for sheep. In synthesis, the outcomes of this study underscore the considerable impact of birth weight on slaughtered and carcass weights, emphasizing the positive association between higher birth weights and enhanced carcass yield. Remarkably, despite these pronounced effects on carcass traits, the birth weight did not demonstrate a statistically significant influence on meat quality or overall muscle fibre characteristics, except for the area of Type I fibres in the LTL muscle. This nuanced understanding contributes valuable insights into the intricate relationship between birth weight and various physiological and carcass parameters in Karayaka lambs undergoing post-weaning fattening.
1. Introduction
Lamb production is one of the most critical parts of sheep farming. Developing countries raise different domestic sheep breeds tailored to the region. There are over 42 million sheep in Türkiye [1], and the survival of the sheep business depends heavily on the advancement of the local breeds. Among these native breeds, the Karayaka sheep breed is intensively bred in the Black Sea region. They are a carpet-wool breed also kept for meat production. Karayaka is well adapted to harsh environmental conditions such as poor climates and pasture [2].
Birth weight is the primary factor influencing the newborn’s viability and long-term health [3,4], and knowing the controllable factors affecting live weight is essential to the agricultural economy. All mammalian species have an uncomplicated birth and a birth weight that maximizes the newborn’s viability. When birth weight deviates from this optimum, there is only a range in which the newborn will survive until reproductive age. Certain genetic factors are responsible for variations in birth weight. While low birth weight causes an increase in neonatal mortality, high birth weight can lead to an increase in difficult birth or maternal mortality [5].
Maternal nutrition level during pregnancy significantly affects the weight gain of the placenta and fetus, altering the birth weight of the offspring [6], while its level in the middle and late periods of pregnancy affects the offspring’s postnatal skeletal muscle fibre number and composition [7,8]. Transitioning from the fetal period to postnatal life requires the maturation of biological systems necessary for survival and growth [9]. Appropriate environmental and nutritional conditions may allow healthy but low-birth-weight lambs to survive and grow rapidly [10]. However, the period before the onset of rapid growth may be longer in low-birth-weight lambs, indicating that their metabolic systems require a more extended period to adapt to postnatal life [11]. Prolonging the adaptation period necessary for survival after birth may affect postnatal productivity, skeletal muscle growth, the formation of body structures such as fat and connective tissue, and meat yield and even quality [8,11,12,13].
According to Barker’s “Fetal Origin of Adult Diseases” hypothesis, the size of the placenta in the fetal period affects the amount of nutrients transferred to the fetus. Adequate feeding in the early period of pregnancy increases the size of the placenta; the increase in placental size means more nutrients are available or transferred to the fetus, and thus the birth weight increases [14]. The first half of the gestation period, in which muscle fibres are programmed in the fetus, coincides with the decrease in grass growth in pasture areas in the northern hemisphere. Therefore, pasture grazing may not fully meet maternal nutritional needs during gestation in such cases. Maternal malnutrition may adversely affect the development of the fetus and cause a wide variation in birth weight [15]. Previous studies showed that maternal nutrition level in the critical periods of pregnancy (for example, between the 30th and 80th days) in sheep and cattle affects birth weight and postpartum muscle development and fattening performance [7,16,17].
The prenatal period is critical for muscle fibre development since it involves an increase in the number of muscle fibres. There is, however, no apparent increase in the number of muscle fibres in the postpartum period [18]. The feeding strategies applied in the early stages of this critical prenatal period when the muscle fibres are formed may change the muscles’ cellular activity and subsequently affect the meat quality depending on the birth weight, postpartum muscle development, and slaughter weight. In sheep, hyperplasia of fetal muscle fibres begins at ~30 or 32 days and is completed at ~85–90 days gestation [19]. Prenatal development of muscle fibres may affect the meat quality obtained when animals reach adult body weight. The characteristics of the skeletal muscle tissue vary according to breed [20], sex [21], hormone level [22], growth term [23], nutrition [8], and muscle location [24]. The intrinsic properties of the muscle vary according to the muscle fiber composition of the skeletal muscle tissue. This change determines the meat’s colour, odour, flavour, juiciness, tenderness, and texture [25]. The metabolic and contractile properties of skeletal muscle tissue vary depending on the muscle fibre composition [20,21]. The determining relationship between muscle fibres and meat quality characteristics will contribute to the programming of better-quality meat production. The total number, diameter, type, and composition of muscle fibers forming the muscle are essential in determining meat quality after slaughter [20]. Only a few studies have simultaneously assessed the meat quality and muscle fibre characteristics in Karayaka lambs. This study aimed to ascertain how differing birth weights affected the ability of the Karayaka lambs to fatten, the features of the carcass, some meat quality parameters, and the muscle fibre characteristics.
2. Materials and Methods
2.1. Animals
The experiment was conducted at the Agricultural Research Unit of Gaziosmanpasa University in Tokat, Türkiye, during the breeding season (September to March) (40031′ N, 36053′ E, 650 m above sea level). Forty-three newborn lambs, born to Karayaka ewes at least in the second parturition and ranging from 2 to 3 years of age, were dried and weighed before suckling. Lambs were then divided into three groups: low birth weight (LBW; <3.59 kg), medium birth weight (MBW; 3.59–4.89 kg), and high birth weight (HBW; >4.89 kg). Birth weight groups were determined as lambs with one standard deviation difference of the average considering the average weight of all lambs born in the same flock and period. Table 1 presents the distribution numbers of lambs by birth weight and sex.

Table 1.
The distribution numbers of lambs by sex.
2.2. Growth and Fattening of Lambs
All lambs were kept in the pen with dams for two weeks after lambing and allowed to suckle their dams freely. The ewes were fed an average of 200 g concentrate (15% crude protein, 2800 kcal/kg dry matter metabolizable energy) and alfalfa of 1 kg per day for two weeks. Ewes were allowed to pasture for daytime grazing two weeks after birth and suckle their lambs overnight in sheepfold until weaning. In addition to pasture grazing, the ewes were fed an average of 150 g of concentrate per day during lactation. When all lambs were two months old, they were treated with protection against internal and external parasites and introduced to a creep-feed concentrated diet (15% crude protein, 2500 kcal/kg dry matter metabolizable energy) fed ad libitum with good quality alfalfa as a supplement to ewe’s milk. At three months of age, all lambs were weaned, and feed and water were withheld overnight to assess fasting body weight the next day at weaning. After weaning, all lambs were subjected to a two-month fattening period and slaughtered at five months of age. The lambs were fed a mixed diet of ad libitum alfalfa hay and concentrated feed during the fattening period. Water and mineral stones were freely available during the fattening period. The nutrient contents of experimental feeds were provided by the manufacturer (Güven Yem A. Ş., Çorum, Türkiye) and shown in Table 2.
Table 2.
Nutrient contents of concentrate and alfalfa hay (% on dry matter basis).
2.3. Measurements and Muscle Sample Collection
At the end of the fattening period, feed and water were withdrawn overnight to determine fasting body weight the following day. All lambs were transported to a local slaughterhouse after being weighed, and standard commercial slaughter procedure was carried out. Before slaughter, the loin thickness of eye muscle of longissimus thoracis et lumborum muscle (LTL) was measured in all lambs by an ultrasonic linear prop (Falco Vet. Linear prop 8.0 MHz; Pie et al., The Netherlands) as described by Ulutas et al. [2]. The pelt, head, feet, internal organs (spleen, lungs, liver, and kidney), empty reticulorumen, and empty intestine were weighed after slaughter. Warm carcass weights were also measured after removing all internal organs. Immediately after slaughter, LTL, semitendinosus (ST), and semimembranosus (SM) skeletal muscles were isolated and weighed from the right side of the carcasses. Two samples measuring of 5 × 2 × 2 cm (approximately 50 g) were taken from the mid-sections of LTL, ST, and SM muscles. Fat and connective tissue were trimmed from muscle samples, immediately covered with aluminium foil, frozen in liquid nitrogen, and stored at −80 °C until histochemical analysis of muscle fibres. In addition to internal fat, pelvic and kidney fat were isolated and weighed. All carcasses with isolated muscles were chilled for 24 h at 4 °C. To determine meat quality traits, approximately 150–200 g muscle samples were collected from the central parts of the mid-section of the whole LTL and ST muscles from the left side of the carcasses after 24 h chilled storage. The fat and connective tissue of LTL and ST muscle samples were trimmed before meat quality analysis and storage at 4 °C.
2.4. Meat Quality Analyses
Tenderness, pH, and colour characteristics of LTL and ST muscle samples were specified as described by Şen et al. [28]. The pH value was determined using the meat pH meter with a puncture electrode (Testo 205, Lenzkirch, Germany) at 1 and 24 h postmortem. Meat colour as L* (lightness), a* (redness) and b* (yellowness) value was determined using a chromometer (Konica Minolta CR-300, Minolta Co., Ltd., Osaka, Japan) at 1 and 24 h postmortem. The water-holding capacity of LTL and ST muscle samples (approximately 25 g) was specified by the filter paper press method [29] with some modifications. About 3.0 g of intact muscle sample was weighed and placed on a previously desiccated and weighed filter paper (Whatman No. 1, 11 cm in diameter) with two thin plastic films. After weighing the meat sample, the filter paper and plastic film with the meat sample were placed between wood plates. Loads of 2.5 kg were applied for 5 min using weights. After accurately removing the compressed meat sample, it was rapidly weighed to determine the percentage water-holding capacity of the meat sample. Cooking loss was analyzed as described by Mitchaothai et al. [30] in LTL and ST muscle samples. Approximately 50.0 g muscle samples were put in a plastic bag and then cooked for 40 min in a water bath at 70 °C constant temperatures. The samples were then exposed to running water for approximately 15 min to cool to room temperature. The samples were weighed before and after cooking to determine the percentage of cooking loss.
2.5. Histochemical Determination of Muscle Fibre Type Composition
Contractile types (Type I, IIA, and IIB) of muscle fibres in LTL, ST, and SM muscles were analyzed using myosin ATPase staining at pH 4.2, as described by Broke and Keiser [31] and Şen et al. [8]. Metabolic types (oxidative and glycolytic) of muscle fibres in LTL, ST, and SM muscles were determined using the succinate dehydrogenase (SDH) activity staining described by Nachlas et al. [32]. Six transverse serial muscle sections (10 mm thick) from muscle samples were obtained using a cryostat (Microtome E, Thermo Electron Corporation, Basingstoke, UK) at −20 °C. Sections were allowed to dry; three of the muscle sections were used for ATPase staining, while the remaining three were used for SDH activity staining. Muscle fibres were counted using a microscope (Nikon Eclipse E600, Nikon Corporation, Tokyo, Japan) linked to an image analysis software (Laica Q Win V3.4 Processing-Analysis Software). Four areas were selected randomly from the sections to determine fibre type composition and myofibre diameter. Myofibre diameter was measured from ~25 fibres of each fibre type from each area coun ted. Figure 1 and Figure 2 present pictures of stained muscle fibres from LTL, ST, and SM muscles for myosin ATPase (pH 4.2) and SDH activity staining, respectively.
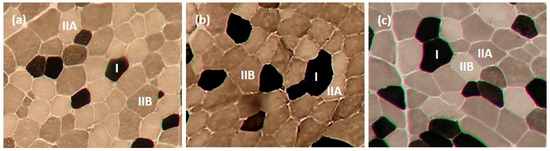
Figure 1.
Contractile types of muscle fibre identified by Myosin ATPase staining in longissimus thoracis et lumborum (a), semitendinosus (b), and semimembranosus (c) muscles (10×). The darkest muscle fibre is Type I, the intermediate muscle fibre is Type IIB, and the lightest muscle fibre is Type IIA.
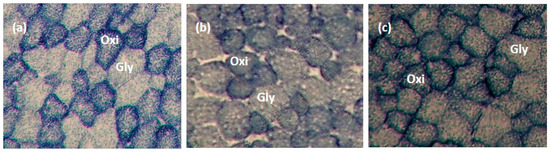
Figure 2.
Metabolic types of muscle fibre were identified by succinate dehydrogenase (SDH) activity staining in longissimus thoracis et lumborum (a), semitendinosus (b), and semimembranosus (c) muscles (10×). The darkest blue muscle fibre is oxidative (oxi; Type I), and the lightest blue muscle fibre is glycolytic (gly; Type IIA and Type IIB).
2.6. Statistical Analyses
The effect of birth weight on the postnatal growth rate, carcass composition, muscle fibre characteristics, meat quality of lambs, and other traits was analyzed as a complete randomized design using the general linear model of the Statistical Analysis System [33]. One-way ANOVA was used to compare the gender within each birth weight group and to compare initial and final pH and color characteristics. Tukey’s multiple comparison tests compared the differences in the mean values, and results were computed as mean ± standard error of the mean (SEM). Relationships between birth weight and other traits were determined by Pearson’s correlation analysis. Statistical significance was considered at p < 0.05.
3. Results
The results of Pearson correlation analysis between birth weight and other traits were not significant (p > 0.05). Table 3 shows the results of weaning weight, slaughter weight, daily weight gain, eye muscle values, and carcass characteristics of Karayaka lambs with different birth weights. The study found no significant differences among birth weight groups regarding weaning weight in female lambs, but HBW male lambs had higher (p < 0.05) weaning weight than LBW and MBW male lambs. Slaughter weight and total weight gain in HBW female lambs were higher (p < 0.05) than in LBW female lambs. Similarly, HBW male lambs had higher (p < 0.05) slaughter weights than LBW and MBW male lambs. Although the total weight gain of MBW male lambs was higher (p < 0.05) than LBW male lambs, the birth weights of male and female lambs were similar in the LBW, MBW, and HBW groups. Significant differences in the weaning weight (except for the weaning weight of LBW lambs), slaughter weight, and total weight gain were detected between male and female lambs (p < 0.05) in birth weight groups. However, there were no significant correlations among birth weight, fattening performance, and carcass characteristics in male and female lambs. There were no significant differences among birth weight groups in fat thickness above the eye muscle, but female lambs had higher (p < 0.05) fat thickness than male lambs in each birth weight group. Although loin thickness values of the eye muscle in female lambs were similar in birth weight groups, HBW male lambs had higher (p < 0.05) loin thickness than LBW male lambs. Moreover, male lambs in MBW and HBW groups had thicker (p < 0.05) eye muscles than female lambs in the same birth weight groups. In addition, the difference among the birth weight groups in terms of LTL, ST, SM (except for the SM muscle of female lambs) muscle weights, warm, cold carcass weights, and yields were significant (p < 0.01). Additionally, MBW and HBW male lambs had more significant LTL and SM muscle weights (p < 0.05) than female lambs in the same birth weight groups (except for the SM muscle of MBW lambs). Warm and cold carcass weights of male lambs were significantly higher than female lambs (p < 0.05) in each birth weight group (except for the cold carcass of LBW lambs).
Table 3.
Fattening performance and carcass characteristics of Karayaka lambs.
Table 4 shows several traits of the meat quality in the LTL and ST muscles of female and male Karayaka lambs at various birth weights. The study found no significant differences among the birth weight groups for meat quality attributes, including water-holding capacity, and cooking loss in LTL and ST muscles (p > 0.05). There were no significant differences among birth weight groups in texture values of ST muscle in both sexes, but HBW female lambs had higher (p < 0.05) texture values than LBW female lambs in LTL muscle. Although there were no significant differences among birth weight groups in pH values of LTL and ST muscles in both sexes, the pH values measured at 1st hour in both muscles of female and male lambs in the birth weight groups were higher than those measured at the 24th hour (p < 0.05). The water-holding capacity values of LTL and ST muscles in female lambs were higher (p > 0.05) than in male lambs in each birth weight group. Similarly, cooking loss values of LTL muscle in female lambs were higher (p > 0.05) than in male lambs in each birth weight group. Table 5 also presents colour measurement (L*, a*, and b*) values in LTL and ST muscles at the 1st hour and 24th hour after slaughtering Karayaka female and male lambs at different birth weights. There was no difference in the L, a, and b colour values in the LTL and ST muscles among the birth weight groups after the 1st and 24th hours (p > 0.05). The data presented in Table 5 also indicate that there was no significant difference in the mean L*, a*, and b* values of the LTL and ST muscles from male and female lambs at the 1st and 24th hours postmortem. Within the same birth weight groups, however, the variations in the colour averages (L*, a*, and b* values) were significant at the 1st and 24th hours (p < 0.05).
Table 4.
Meat quality characteristics in LTL and ST muscles.
Table 5.
Colour values in LTL and ST muscles †.
Table 6 shows the area of muscle fibres in LTL, ST, and SM muscles of Karayaka lambs at different birth weights. In the LTL muscle, there was a significant difference (p < 0.05) in the area of Type I muscle fibres among the birth weight groups in male lambs; lambs with high birth weight had the largest Type I muscle fibre area (p < 0.05). Additionally, male lambs in the HBW group had larger (p < 0.05) Type I muscle fibre areas than female lambs in the same birth weight group. Similarly, female lambs with high birth weight had the largest Type I muscle fibre area (p < 0.05) in ST muscle. There was, however, no difference among the birth weight groups and sexes in terms of other muscle fibre (Type IIA and IIB) areas. The data for different muscle fibre numbers in LTL, ST, and SM muscles are presented in Table 7. There was no statistical difference in Type I, IIA, and IIB muscle fibre numbers among the birth weight groups. Moreover, the metabolic activity ratios of muscle fibre in LTL, ST, and SM muscles were similar. However, male lambs had higher (p < 0.05) Type IIA muscle fibre numbers in LTL muscle than female lambs in each birth weight group. Additionally, LBW male lambs had higher (p < 0.05) Type IIB and total muscle fibre numbers than female lambs in LTL muscle. However, no significant correlations existed between birth weight and muscle fibre characteristics in male and female lambs.
Table 6.
Muscle fibre area (μm2) in LTL, ST, and SM muscles.
Table 7.
The mean number of Type I, IIA, and IIB fibres/mm2 muscle area in LTL, ST, and SM muscles.
4. Discussion
Birth weight is one of the most important factors affecting the growth of the newborn. Sušić et al. [34] reported that there is a relationship between birth weight, subsequent live weight development, and fattening performance. The present study underscores the observation that lambs within the high birth weight category attained elevated slaughter weights. It has been determined that birth weight significantly affects slaughter weight in Karayaka lambs. This aligns with the findings by Şen et al. [28], who reported a slaughter weight of 35.6 kg in a corresponding study. In contrast, the slaughter weights recorded in both MBW and HBW groups in the current investigation surpassed those reported by Şen et al. [28]. According to Boggs and Merkel [35], the typical range of the area of the eye muscle and the depth of fat (fat thickness) above the 12th and 13th rib in lambs following fattening should be between 3.81 and 9.14 cm2 and 0.508 and 1.27 cm, respectively. The current study found that the mean fat thickness values of Karayaka lambs, as determined by ultrasonic tests, were below the previously stated range [35]. In this investigation, higher weights of both warm and cold carcasses were observed in the HBW group. The male Karayaka lambs in the HBW group exhibited higher weights both warm and cold carcasses, surpassing Şen et al.’s [28] documented weights for the same breed. In contrast, studies by Greenwood et al. [36,37] suggest that birth weight may alter the postnatal growth of individual organs and some skeletal muscle mass without influencing their combined weight at equivalent body weights. Although there was no relationship between birth weight and carcass characteristics in the current study, our observation of carcass weight increase as birth weight increases emphasizes that the effect of birth weight on post-fattening carcass weights should be evaluated. The greater fattening weights of lambs with high birth weights can be considered the cause of birth weight variance. The greater fattening weights of lambs with high birth weights can be considered the cause of birth weight variance in the present study.
The ability of fresh meat to retain water following rigour mortis and its texture are two crucial meat quality attributes significantly impacted by its pH levels. According to Aksoy et al. [38], meat quality is, therefore, greatly influenced by the pH value. Sañudo et al. [39] found that there might be notable variations in pH levels across different sheep breeds. For the same race, however, this distinction could not be acknowledged. Texture measures at the 24th and 1st hours marks exhibited no conspicuous variations. The final pH levels between 5.8 and 6.0 reduce the sensory tenderness score [40]. The postmortem pH values of LTL and ST muscles in lambs of varying birth weights were under 5.8 and greater than 6.0, respectively. Essentially, the physical qualities of meat, such as water-holding capacity and cooking loss, influence the yield and quality of meat products. Water-holding capacity and cooking loss values are also connected to postmortem biochemical features such as proteolysis, muscle protein shrinkage (actin and myosin), and cell wall breakdown. These biological processes influence intercellular water release. The water-holding capability of meat increases qualities such as tenderness and juiciness [38]. The water-holding capacity of the ST and LTL muscles was lower in this study than in previous studies by Aksoy et al. [38] and Şen et al. [28].
Furthermore, the colour of meat serves as a crucial indicator of product freshness, with consumers preferring light red or pink lamb meat [41]. This study showed no variations in L*, a*, and b* values among the birth weight groups in ST and LTL muscles at the 1st and 24th hours. On the other hand, the average L*, a*, and b* values between the 1st and 24th hours were significantly different in each birthweight group. According to Ugurlu et al. [42], the values of L*, a*, and b*, as determined at the postmortem 24 h point in sheep breeds in Türkiye, ranged from 37.91 to 42.72, 16.08 to 21.26, and 5.60 to 8.45, respectively. The 24th hour values of L*, a*, and b* were all within the acceptable ranges.
In line with previous research, a recent study by Şen et al. [8] outlined that the maternal nutrition level during the mid-gestation period (from 30 to 80 days), during which skeletal muscle fibres partially begin and complete the growth and development, has a significant impact on the offspring’s growth performance, carcass composition, fibre types, muscle fibre muscle area in mm2, and growth (diameter) of skeletal muscle fibre [7,16,17]. Despite the absence of a discernible increase in the number of muscle fibres during the postpartum period, the prenatal period is crucial for developing muscle fibres since this is the period when they proliferate and differentiate [18]. The quantity and type of muscle fibres in a lamb remain unaffected by environmental factors, including feeding, movement, and maintenance throughout the postnatal stage. However, these factors, particularly nutrition, impact muscle fibre diameter. Fahey et al. [7] and Dwyer et al. [43] suggested that a significant increase in muscle fibre diameter may result from a reduced total number of muscle fibers. Nevertheless, in the present study, muscle fibre compositions and numbers remained unaffected by birth weight in both muscles and sexes. These results were in contrast to previous studies in which the mean fibre number in ST muscle of high birth weight lambs was higher than that of low-birth-weight female lambs [44]. The finding that muscle fibre number was unaffected by birth weight, despite the LBW lambs having nearly 65% of the weight of HBW lambs at birth, aligns with the results of Greenwood et al. [36]. In the present study, ewes were exposed to similar environmental conditions during the critical period for prenatal muscle fibres. However, differences were detected in the Type I muscle fibres in the LTL muscle of male lambs and the ST muscle of females due to the disparity in the birth weight of the lambs.
The differentiation between muscle fibres based on their contraction speed is achieved using the histochemical test for myofibrillar ATPase activity. Measures of ATPase activity can be interpreted in terms of contraction speed since myosin ATPase activity and muscle contraction velocity are positively associated [18]. Similarly, the histochemical test for SDH activity staining distinguishes oxidative and nonoxidative (or, more accurately, “less” oxidative) fibres. High-oxidative fibres use oxidative phosphorylation in the mitochondria to produce ATP, and muscle cells with a higher number of mitochondria will have a greater capacity for oxidation. The SDH enzyme, situated in the inner membrane of the mitochondrion and attached to the cristae, oxidizes succinate to fumarate in the citric acid cycle. Succinate is oxidized during this process, resulting in the production of NADH in its reduced form. The staining intensity increases with the amount of SDH (and hence, mitochondrial) activity a fibre contains, as does the ATPase assay. Compared to nonoxidative fibres, which only feature sporadic purple speckles, oxidative fibres exhibit a more densely speckled appearance. In this investigation, the numbers of Type I, IIA, IIB, and total muscle fibres in LTL, ST, and SM muscles were similar across all the weight groups for both sexes. The metabolic activity ratios for each muscle group were also the same for all groups, as expected for individuals of the same breed.
5. Conclusions
In conclusion, this study underscores the significant impact of birth weight on slaughter weight in lambs, and this implies that higher birth weight may contribute to increased carcass yield, a crucial consideration in the sheep industry. Interestingly, while birth weight emerged as a pivotal factor influencing carcass weights after fattening, it did not exhibit a discernible effect on meat quality characteristics. These results suggest that, within the parameters studied, birth weight may not directly determine meat quality in lambs. Notably, the study identified a specific area of impact related to muscle fibre types, as an increase in Type I muscle fibre area was observed in lambs with higher birth weights. This finding may contribute to understanding the complex interplay between birth weight and muscle fibre development. This study informs future strategies for optimizing carcass yield in the context of birth weight variations.
Author Contributions
Conceptualization, M.K.; methodology, E.Ş., U.Ş., Y.A. and Ü.Ç.; validation, M.K. and Z.U.; formal analysis, M.K., Z.U. and, E.Ş.; investigation, M.K., Z.U., E.Ş., U.Ş., Y.A. and Ü.Ç.; resources, M.K. and Z.U.; data curation, E.Ş. and U.Ş.; writing—original draft preparation, M.K., E.Ş. and U.Ş.; writing—review and editing, E.Ş., U.Ş. and M.K.; visualization, M.K., Z.U., E.Ş., U.Ş., Y.A. and Ü.Ç.; supervision, M.K. and Z.U.; project administration, M.K.; funding acquisition, M.K. All authors have read and agreed to the published version of the manuscript.
Funding
This research was funded by TUBITAK (108 O 392) to carry out this study.
Institutional Review Board Statement
The animal study protocol was approved by the Ethics Committee of The Local Animal Care and Ethics Committee of Gaziosmanpasa University, Tokat, Türkiye, ensuring compliance with EC Directive 86/609/EEC for animal experiments.
Informed Consent Statement
Not applicable.
Data Availability Statement
The data presented in this study are available on request from the corresponding author. The data are not publicly available due to privacy and ethical concerns.
Conflicts of Interest
The authors declare no conflicts of interest.
References
- Şen, U.; Önder, H.; Şirin, E.; Özyürek, S.; Piwcynsky, D.; Kolenda, M.; Ocak Yetişgin, S. Placental characteristics classification of various native Turkish sheep breeds. Animals 2021, 11, 930. [Google Scholar] [CrossRef]
- Ulutaş, Z.; Aksoy, Y.; Şirin, E.; Saatci, M. Introducing the Karayaka sheep breed with its traits and influencing factors. Pak. J. Biol. Sci. 2008, 11, 1051–1054. [Google Scholar] [CrossRef] [PubMed]
- Cogswell, M.E.; Yip, R. The influence of fetal and maternal factors on the distribution of birth weight. Semin. Perinatol. 1995, 19, 222–240. [Google Scholar] [CrossRef]
- Godfrey, K.M.; Barker, D.J.P. Fetal nutrition and adult disease. Am. J. Clin. Nutr. 2000, 71, 1344–1352. [Google Scholar] [CrossRef] [PubMed]
- Alexander, G. Birth Weight of Lambs: Influences and Consequences. In Size at Birth; Elliot, K., Knight, J., Eds.; Elsevier: Amsterdam, The Netherlands, 1974; pp. 215–245. [Google Scholar]
- Redmer, D.A.; Wallace, D.; Reynolds, L.P. Effect of nutrient intake during gestation on fetal and placental growth and vascular development. Domest. Anim. Endocrinol. 2004, 27, 199–217. [Google Scholar] [CrossRef] [PubMed]
- Fahey, A.J.; Brameld, J.M.; Parr, T.; Buttery, P.J. The effect of maternal undernutrition before muscle differentiation on the muscle fibre development of the newborn lamb. J. Anim. Sci. 2005, 83, 2564–2571. [Google Scholar] [CrossRef]
- Şen, U.; Şirin, E.; Aksoy, Y.; Ensoy, Ü.; Ulutaş, Z.; Kuran, M. The effect of maternal nutrition level during mid-gestation on lambs’ postnatal muscle fibre composition and meat quality. Anim. Prod. Sci. 2016, 56, 834–843. [Google Scholar] [CrossRef]
- Mellor, D.J. Integration of perinatal events, pathophysiological changes and consequences for the newborn lamb. Br. Vet. J. 1988, 144, 552–569. [Google Scholar] [CrossRef]
- Greenwood, P.L.; Hunt, A.S.; Hermanson, J.W.; Bell, A.W. Effects of birth weight and postnatal nutrition on neonatal sheep: I. Body growth and composition, and some aspects of energetic efficiency. J. Anim. Sci. 1998, 76, 2354–2367. [Google Scholar] [CrossRef]
- Greenwood, P.L.; Hunt, A.S.; Slepetis, R.M.; Finnerty, K.D.; Alston, C.; Beermann, D.H.; Bell, A.W. Effects of birth weight and postnatal nutrition on neonatal sheep: III. Regulation of energy metabolism. J. Anim. Sci. 2002, 80, 2850–2861. [Google Scholar] [CrossRef]
- Rehfeldt, C.; Te Pas, M.F.W.; Wimmers, K.; Brameld, J.M.; Nissen, P.M.; Berri, C.; Valente, L.M.P.; Power, D.M.; Picard, B.; Stickland, N.C.; et al. Advances in research on the prenatal development of skeletal muscle in animals in relation to the quality of muscle-based food. I. Regulation of myogenesis and environmental impact. Animals 2011, 5, 703–717. [Google Scholar] [CrossRef]
- Kenyon, P.R.; Blair, H.T. Foetal programming in sheep: Effects on production. Small Rumin. Res. 2014, 118, 16–30. [Google Scholar] [CrossRef]
- Godfrey, K.M.; Barker, D.J. Fetal programming and adult health. Public. Health Nutr. 2001, 4, 611–624. [Google Scholar] [CrossRef]
- Ocak, N.; Cam, M.A.; Kuran, M. The effect of high dietary protein levels during late gestation on colostrum yield and lamb survival rate in singleton-bearing ewes. Small Rumin. Res. 2005, 56, 89–94. [Google Scholar] [CrossRef]
- Wu, G.; Bazer, F.W.; Wallace, J.M.; Spencer, T.E. Board-invited review: Intrauterine growth retardation: Implications for the animal sciences. J. Anim. Sci. 2006, 84, 2316–2337. [Google Scholar] [CrossRef]
- Kuran, M.; Ulutaş, Z.; Ocak, N.; Şirin, E. Effect of Maternal Nutrition Level on Post-Natal Muscle Fiber Development and Meat Quality of Lambs; TÜBİTAK-TBAG (105T277, TBAG-U/148), Project Final Result Report; The Scientific and Technological Research Council of Türkiye: Ankara, Türkiye, 2008; p. 243. [Google Scholar]
- Du, M.; Tong, J.; Zhao, J.; Underwood, K.R.; Zhu, M.; Ford, S.P.; Nathanielsz, P.W. Fetal programming of skeletal muscle development in ruminant animals. J. Anim. Sci. 2010, 88, E51–E60. [Google Scholar] [CrossRef] [PubMed]
- Brameld, J.M.; Daniel, Z.C.T.R. In utero effects on livestock muscle development and body composition. Aust. J. Exp. Agric. 2008, 48, 921–929. [Google Scholar] [CrossRef]
- Ryu, Y.C.; Choi, Y.M.; Lee, S.H.; Shin, H.G.; Choe, J.H.; Kim, J.M. Comparing the histochemical characteristics and meat quality traits of different pig breeds. Meat Sci. 2008, 80, 363–369. [Google Scholar] [CrossRef] [PubMed]
- Ozawa, S.; Mitsuhashi, T.; Mitsumoto, M.; Matsumoto, S.; Itoh, N.; Itagaki, K. The characteristics of muscle fibre types of longissimus thoracis muscle and their influences on the quantity and quality of meat from Japanese Black steers. Meat Sci. 2000, 54, 65–70. [Google Scholar] [CrossRef] [PubMed]
- Rehfeldt, C.; Fiedler, I.; Stickland, N.C. Number and size of muscle fibres in relation to meat production. In Muscle Development of Livestock Animals: Physiology, Genetics and Meat Quality; te Pas, M.F.W., Everts, M.E., Haagmans, H.P., Eds.; CABI Publishing: London, UK, 2004; p. 400. [Google Scholar]
- Gondret, F.; Lefaucheur, L.; Juin, H.; Louveau, I.; Lebret, B. Low birth weight is associated with enlarged muscle fibre area and impaired meat tenderness of the longissimus muscle in pigs. J. Anim. Sci. 2006, 84, 93–103. [Google Scholar] [CrossRef] [PubMed]
- Hwang, Y.H.; Kim, G.D.; Jeong, J.Y.; Hur, S.J.; Joo, S.T. The relationship between muscle fibre characteristics and meat quality traits of highly marbled Hanwoo (Korean native cattle) steers. Meat Sci. 2010, 86, 456–461. [Google Scholar] [CrossRef]
- Bünger, L.; Navajas, E.A.; Stevenson, L.; Lambe, N.R.; Maltin, C.A.; Simm, G.; Fisher, A.V.; Chang, K.C. Muscle fibre characteristics of two contrasting sheep breeds: Scottish Blackface and Texel. Meat Sci. 2009, 81, 372–381. [Google Scholar] [CrossRef]
- Alderman, G. Prediction of the energy value of compound feeds. In Recent Advances in Animal Nutrition, 1st ed.; Haresign, W., Cole, D.J.A., Eds.; Butterworths: London, UK, 1985; pp. 3–52. [Google Scholar]
- Menke, K.H.; Steingass, H. Estimation of the energetic feed value obtained from chemical analysis and in vitro gas production using rumen fluid. Anim. Res. Develop. 1988, 28, 7–55. [Google Scholar]
- Şen, U.; Şirin, E.; Ulutaş, Z.; Kuran, M. Fattening performance, slaughter, carcass and meat quality traits of Karayaka lambs. Trop. Anim. Health Prod. 2011, 43, 409–416. [Google Scholar] [CrossRef]
- Joo, S.T. Determination of water-holding capacity of porcine musculature based on released water method using optimal load. Korean J. Food Sci. Anim. Resour. 2018, 38, 823–828. [Google Scholar]
- Mitchaothai, J.; Yuangklang, C.; Wittayakun, S.; Vasupen, K.; Wongsutthavas, S.; Srenanul, P.; Hovenier, R.; Everts, H.; Beynen, A.C. Effect of dietary fat type on meat quality and fatty acid composition of various tissues in growing-finishing swine. Meat Sci. 2006, 105, 1067–1075. [Google Scholar] [CrossRef]
- Broke, M.M.; Keiser, K. Muscle fibre type: How many and what kind? Archiv. Neurol. 1970, 23, 369–370. [Google Scholar] [CrossRef]
- Nachlas, M.M.; Tsou, K.C.; De Souza, D.E.; Cheng, C.S.; Seligman, A.M. Cytochemical demonstration of succinic dehydrogenous by the use of a new p-nitrophenyl substituted ditetrazole. J. Histochem. Cytochem. 1957, 5, 420–436. [Google Scholar] [CrossRef] [PubMed]
- Minitab. Minitab for Windows (Version 12.11); Minitab Inc.: State College, PA, USA, 1998. [Google Scholar]
- Sušić, V.; Pavić, V.; Mioč, B.; Štoković, I.; Kabalin, A.E. Seasonal variations in lamb birth weight and mortality. Vet. Arhiv 2005, 75, 375–381. [Google Scholar]
- Boggs, D.L.; Merkel, R.A. Live Animal Carcass Evaluation and Selection Manual, 4th ed.; Kendall Hunt: Dubuque, IA, USA, 1993; p. 187. [Google Scholar]
- Greenwood, P.L.; Hunt, A.S.; Hermanson, J.W.; Bell, A.W. Effects of birth weight and postnatal nutrition on neonatal sheep: II. Skeletal muscle growth and development. J. Anim. Sci. 2000, 78, 50–61. [Google Scholar] [CrossRef] [PubMed]
- Greenwood, P.L.; Hunt, A.S.; Bell, A.W. Effects of birth weight and postnatal nutrition on neonatal sheep: IV. Organ growth. J. Anim. Sci. 2004, 82, 422–428. [Google Scholar] [CrossRef] [PubMed]
- Aksoy, Y.; Çiçek, Ü.; Şen, U.; Şirin, E.; Uğurlu, M.; Önenç, A.; Kuran, M.; Ulutaş, Z. Meat production characteristics of Turkish native breeds: II. Meat quality, fatty acid, and cholesterol profile of lambs. Arch. Anim. Breed. 2019, 62, 41–48. [Google Scholar] [CrossRef] [PubMed]
- Sañudo, C.; Alfonso, M.; Sánchez, A.; Berge, F.; Dransfield, E.; Zygoyiannis, D.; Stamataris, C.; Thorkelsson, G.; Valdimarsdottir, T.; Piasentier, E.; et al. Meat texture of lambs from different European production systems. Aust. J. Agr. Res. 2003, 54, 551–560. [Google Scholar] [CrossRef]
- Devine, C.E.; Graafhuis, A.E.; Muir, P.D.; Chrystall, B.B. The effect of growth rate and ultimate pH on meat quality of lambs. Meat Sci. 1993, 35, 63–77. [Google Scholar] [CrossRef] [PubMed]
- Ekiz, B.; Yilmaz, A.; Ozcan, M.; Kaptan, C.; Hanoglu, H.; Erdogan, I.; Yalcintan, H. Carcass measurements and meat quality of Turkish Merino, Ramlic, Kivircik, Chios and Imroz lambs raised under an intensive production system. Meat Sci. 2009, 82, 64–70. [Google Scholar] [CrossRef]
- Ugurlu, M.; Ekiz, B.; Teke, B.; Salman, M.; Akdağ, F.; Kaya, I. Meat quality traits of male Herik lambs raised under an intensive fattening system. Turk. J. Vet. Anim. Sci. 2017, 41, 425–430. [Google Scholar] [CrossRef]
- Dwyer, C.M.; Stickland, N.C.; Fletcher, J.M. The influence of maternal nutrition on muscle fibre number development in the porcine fetus and subsequent postnatal growth. J. Anim. Sci. 1994, 72, 911–917. [Google Scholar] [CrossRef]
- Şirin, E.; Aksoy, Y.; Şen, U.; Ulutaş, Z.; Kuran, M. Effect of lamb birth weight on fibre number and type of semitendinosus muscle. Anadolu J. Agri. Sci. 2011, 26, 63–67. [Google Scholar]
Disclaimer/Publisher’s Note: The statements, opinions and data contained in all publications are solely those of the individual author(s) and contributor(s) and not of MDPI and/or the editor(s). MDPI and/or the editor(s) disclaim responsibility for any injury to people or property resulting from any ideas, methods, instructions or products referred to in the content. |
© 2024 by the authors. Licensee MDPI, Basel, Switzerland. This article is an open access article distributed under the terms and conditions of the Creative Commons Attribution (CC BY) license (https://creativecommons.org/licenses/by/4.0/).