1. Introduction
The methane (CH
4) production in ruminants not only decreases the efficiency of dietary energy utilization but also contributes to the greenhouse effect [
1]. CH
4 losses from ruminant animals, accounting for 8% to 14% of their total energy intake, diminish the efficacy of energy utilization from feed. A reduction of 2.5 g in CH
4 emissions per kilogram of standard milk leads to an increase of 300 mL of standard milk per kilogram of feed [
2]. Therefore, controlling CH
4 generation in the rumen is advantageous for enhancing the productivity of ruminant animals while mitigating adverse environmental effects. Approximately 85% of the CH
4 emitted by ruminant animals originates from rumen fermentation, primarily through the conversion by the methanogenic bacteria of CO
2, H
2, methanol, formic acid, and other compounds into CH
4 [
3]. Furthermore, there exists a close symbiotic and interspecific hydrogen transfer relationship between rumen protozoa and methanogenic bacteria such that alterations in the number and community structure of rumen protozoa can result in changes in the population and arrangement of rumen methanogenic bacteria, thereby influencing CH
4 production in the rumen [
4].
The rumen is a crucial organ for the digestion and absorption of nutrients in ruminants. Rumen microbes ferment the ingested feed to produce nutrients such as volatile fatty acids (VFAs) and microbial crude protein, providing the nutrients necessary for the host’s growth, reproduction, and milk production, thus supporting various physiological activities [
5,
6]. The rumen epithelium serves as the primary site for the absorption of essential nutrients, such as VFAs, and acts as a specific hub for the interaction between the host and microbial metabolism [
7]. VFAs contribute to more than 70% of ruminants’ digestive energy, with increased propionate levels linked to enhanced milk production [
8,
9].
Antibiotics have long been used for disease prevention, treatment, and promotion of animal growth [
10]. In the context of restrictions or bans on antibiotic use in some countries (such as the European Union), plant polyphenols have garnered widespread attention among researchers due to their unique biological functions and “green” qualities. Studies have shown that plant polyphenols possess biological functions that alter rumen fermentation and maintain health [
11], offering potential applications. Plant polyphenols have been shown to reduce CH
4 emissions [
12]. Studies have indicated variations in the modes of action of different plant extracts in the rumen [
13]. Recent extensive studies in cattle and sheep have shown that incorporating appropriate amounts of plant secondary metabolites in diets can improve feed efficiency and enhance animal productivity [
14]. However, research on the impact of plant secondary metabolites on rumen microbial communities remains sparse, and some mechanisms are still conjectural. The symbiotic relationship between the host and rumen microorganisms significantly influences CH
4 production and animal productivity [
15,
16,
17]. Investigating the mechanisms of animal energy acquisition and CH
4 emission from a microbial community perspective is currently a key research area. Thus, the objective of the present study was to investigate the effects of tea polyphenols on CH
4 production and rumen epithelium transport in cows through in vitro and animal experiments, employing 16S rDNA and proteomics techniques. The findings of this study offer valuable insights into the precise utilization of tea polyphenols in dairy cow production, contributing to the advancement of low-carbon, sustainable, and healthy practices within the dairy industry.
2. Materials and Methods
2.1. In Vitro Experimental Design and Experiment Materials
All animal experimental procedures were approved by the Animal Care and Use Committee of Henan Agricultural University (approval number: HENAU-2018-015). In vitro rumen fermentation experiment was designed as a single-factor trial for 5 treatments: control (CON, without polyphenols), tea polyphenols were added to the dry matter (DM) of the fermentation substrate at levels of 1%, 2%, 3%, and 4%, and each batch of fermentation included five blanks to correct for gas and CH4 production (the blank group only contained artificial rumen buffer, without substrate or polyphenols). Additionally, three independent incubation runs were performed. The in vitro culture lasted for 24 h, after which the volume of gas and CH4 production, as well as other rumen fermentation indicators, were measured.
For the in vitro experiments, peanut vine, sourced from the Henan Agricultural University Livestock Experiment Station, was selected as the experimental material. The peanut vine was air-dried (the chemical composition of peanut vine (DM basis) is CP 9.16%, NDF 49.03%, ADF 36.03%, crude fat 2.68%, crude ash 7.90%.), ground to pass through a 0.5 mm sieve, and stored in sample bags at room temperature for future use. The tea polyphenols used in this experiment were purchased from Xiya Reagents, with a grade of guaranteed reagent.
2.2. Artificial Saliva Composition
The rumen fluid utilized in this experiment was collected from three Holstein cows of similar age (3.5 to 4 years, body weight (560 ± 30 kg), non-lactation period, fitted with permanent ruminal cannulas at the Henan Agricultural University Livestock Experiment Station). Cows were housed in individual stalls, with free access to water. Diet was a total mixed ratio, fed twice daily. The detailed ingredient composition of the diet (dry matter (DM) basis) was 45% concentrate supplement, including gluten 10%, corn 34%, Soybean meal 15%, DDGS 15%, bran 15%, Cottonseed meal 5%, sesame meal 5%, premix 1% (Hefeng Feed Co., Ltd., Jiaozuo, China), 25% corn silage, 15% alfalfa hay, and 15% peanut vine. Two hours before the morning feeding on the day of this experiment, rumen fluid was sampled from various locations within the rumens of the three cannulated cows by syringe (150 mL). The collected rumen fluid was immediately transferred to a pre-warmed (39 °C) insulated lunch box filled with CO2 and quickly transported back to the laboratory. Prior to use, the rumen fluid was pooled and filtered through four layers of cheesecloth in an anaerobic chamber into a beaker, and the filtered fluid was maintained in a 39 °C water bath with continuous CO2 infusion to ensure an anaerobic environment.
The artificial saliva was prepared according to the method of Menke and Steingass [
18], comprising five components as detailed in
Supplementary Table S1 (S1). On the day of this experiment, artificial saliva was prepared according to the proportions shown in
Supplementary Table S2 (S2), placed in a constant temperature water bath at 39 °C, and continuously bubbled with CO
2 until the solution changed from light blue to colorless, at which point, it was used immediately.
According to the experimental design, one day before this experiment, accurately weighed 2 g of peanut vine powder was placed into labeled culture bottles and pre-warmed in a 39 °C incubator for 30–60 min before the start of this experiment on day two. The rumen fluid and artificial rumen buffer solution were then mixed in a 1:2 volume ratio, and 150 mL of this mixture was accurately dispensed into each culture bottle (CO2 was infused during this process to maintain an anaerobic environment). Immediately afterward, the stoppers and aluminum caps were secured tightly with a crimping tool and sealed with a film to ensure anaerobiosis. The bottles were then incubated in a 39 °C constant temperature incubator (Qingdao Haier Biomedical Co., Ltd., Qingdao, China) for 24 h for in vitro fermentation, during which they were shaken every two hours.
2.3. Measurement Indicators and Methods
2.3.1. Total Gas Production Measurement
Fermentation was terminated at the 24th hour of each batch. The gas pressure inside the culture bottles was measured using a precision manometer (Shaanxi Meikong Electronic Technology Co., Ltd., Xi’an, China), and the total gas production (GP) for each experimental group was calculated using the following formula [
19]:
where GP is the actual gas production in the culture bottle (mL), P is the actual pressure reading from the manometer (Kpa), V is the volume of the fermentation bottle (mL), and W is the mass of the fermentation substrate (g).
2.3.2. CH4 Production Measurement
CH4 content was collected using gas collection bags (Dalian Guangming Chemical Industry Gas Quality Monitoring Center Co., Ltd., Dalian, China) and analyzed using a gas chromatograph. The CH4 concentration was measured using a GC1120 gas chromatograph (Dongxi Analytical Instrument Co., Ltd., Beijing, China) equipped with a Flame Ionization Detector (FID). The analytical conditions were as follows: the column was a TP-porapak Q capillary column (15 m × 0.32 mm × 5 μm); the FID temperature was 200 °C; the injection port temperature was 150 °C; column temperature was 55 °C; the carrier gas was high-purity nitrogen with a flow rate of 10 mL/min; the standard sample concentration was 20.1 ppm with an injection volume of 0.3 mL. CH4 concentrations in the samples were calculated using external standardization based on the peak area of the standards.
2.3.3. Measurement of Indicators under Rumen Fermentation Status
Upon opening the bottle, the fermentation fluid was filtered through a nylon bag into a beaker, and the pH was immediately measured using a pH meter (Testo, Schwarzwald, Germany). Subsequently, the fermentation fluid was aliquoted into five 2 mL cryogenic vials and stored at −80 °C for VFA and microbial analysis. Ammonia nitrogen (NH
3-N) was measured following the method described by Weatherburn [
20].
2.3.4. Determination of VFAs in Rumen Fluid
VFAs in rumen fluid samples were analyzed using an ion chromatograph from Sykam, (Sykam, Munich, Germany). The procedure was as follows: First, rumen fluid samples were thawed at 4 °C and centrifuged at 4000 rpm for 10 min. In a 1.5 mL centrifuge tube, 1 mL of the supernatant was accurately mixed with 0.2 mL of metaphosphoric acid solution (25% concentration), vortexed thoroughly, and allowed to stand at 4 °C for over 30 min. After another centrifugation at 10,000 rpm for 10 min, 10 µL of the clear supernatant was diluted 100-fold in a new 1.5 mL centrifuge tube, filtered through a 0.22 µm pore size filter, and then analyzed. The ion chromatograph was operated under the following conditions: Dionex AS11-HC column (4 × 250 mm; Thermo Fisher Scientific, Waltham, MA, USA) at a column temperature of 30 °C and a flow rate of 1.6 mL/min, with an injection volume of 50 µL. A dual-concentration eluent system was used for chromatographic separation: a 0.5 mmol/L NaOH solution was maintained for 25 min, followed by a 50 mmol/L NaOH solution for 5 min, and finally, a 0.5 mmol/L NaOH solution for 10 min. The concentrations of acetate, propionate, and butyrate in the samples were quantified using a standard curve method.
2.3.5. Determination of Methanogen Diversity in Rumen
Total microbial DNA was extracted using the E.Z.N.A.
® soil DNA kit (Omega Bio-tek, Norcross, GA, USA). Methanogen diversity was assessed by PCR amplification using primers MLfF (5′-GGTGGTGTMGGATTCACACARTAYGCWACAGC-3′) and MLfR (5′-TTCATTGCRTAGTTWGGRTAGTT-3′) [
21]. The PCR conditions were as follows: initial denaturation at 95 °C for 3 min, followed by 27 cycles of 95 °C for 30 s, 55 °C for 30 s, and 72 °C for 30 s, with a final extension at 72 °C for 10 min and storage at 4 °C. The PCR reaction mixture included 4 μL of 5× TransStart FastPfu buffer, 2 μL of 2.5 mM dNTPs, 0.8 μL of each primer (5 μM), 0.4 μL of TransStart FastPfu DNA polymerase, 10 ng of template DNA, and water to a final volume of 20 μL. Each sample was replicated three times.
2.3.6. Illumina MiSeq Sequencing
Library preparation was performed using the NEXTFLEX® Rapid DNA-Seq Kit. Libraries that passed quality control were sequenced on the Illumina MiSeq PE300 platform.
2.3.7. Methods for Determining the Diversity of Rumen Protozoa
The procedure for assessing rumen protozoa diversity followed the same steps as in
Section 2.3.6. The primers used for protozoa diversity were RP841F (5′-GACTAGGGATTGGARTGG-3′) and Reg1320R (5′-AATTGCAAAGATCTATCCC-3′) [
7].
2.3.8. Data Processing
Raw sequencing sequences were quality-controlled using Trimmomatic software (
http://www.usadellab.org/cms/index.php?page=trimmomatic (accessed on 10 December 2020)). Assembly of paired-end reads based on their overlaps was conducted using FLASH software (V1.2.7,
http://ccb.jhu.edu/software/FLASH/ (accessed on 10 December 2020)) [
22]. OTU clustering and chimera removal were performed using the UPARSE software (version 7.1,
http://drive5.com/uparse/ (accessed on 10 December 2020)) [
23], with a similarity threshold of 97%. Species annotation for each sequence was carried out using the RDP classifier (
http://rdp.cme.msu.edu/ (accessed on 12 December 2020)), comparing against the nt database with a matching threshold set at 70%.
2.4. Animal Experiment Design
This study involved Holstein cows equipped with permanent ruminal cannulas. This experiment was divided into two groups: the control group and the tea polyphenol group, with three cannulated cows in each group. The control group was fed a basal diet, while the tea polyphenol group received a diet supplemented with 1% DM of tea polyphenols (dosage determined from in vitro culture experiments). Adaptation period of 14 days. The trial lasted for 28 days, with blood, ruminal fluid, and ruminal epithelial samples collected on day 29. Throughout the trial, daily feed intake was observed and recorded, with cows fed equal amounts of diet twice daily at 06:00 and 18:00, and water was available ad libitum.
2.5. Measurement Indicators and Methods for Animal Experiments
2.5.1. Determination of Bovine Blood Biochemical Indicators and Antioxidant Indicators
Blood samples were collected from the caudal vein of each cow before the morning feeding on day 29 of the trial. About 10 mL of blood was drawn from each cow and centrifuged at 3000 rpm for 10 min to obtain serum. Serum biochemical parameters, including alanine aminotransferase (ALT), aspartate aminotransferase (AST), glucose (GLU), triglycerides (TG), cholesterol (CHO), low-density lipoprotein cholesterol (LDL), high-density lipoprotein cholesterol (HDL), and blood urea nitrogen (BUN) were measured using a Chemray 240 automatic biochemistry analyzer (Rayto Life and Analytical Sciences, Shenzhen, China).
The antioxidant capacity of the blood, including total antioxidant capacity (T-AOC), glutathione peroxidase (GSH-Px), superoxide dismutase (SOD), and malondialdehyde (MDA), was assessed using assay kits from Nanjing Jiancheng Bioengineering Institute.
2.5.2. Proteomic Analysis for Bovine Rumen Epithelium
Two hours after the morning feeding on day 29, ruminal papillae were collected from each cow through the ruminal cannula, with 20 papillae collected per cow. Samples were immediately frozen in liquid nitrogen and stored at −80 °C in the laboratory for subsequent analysis.
Total protein was extracted using urea lysis buffer (8 M urea, 1% SDS) containing protease inhibitors that can inhibit various types of proteases and aminopeptidases. Samples were homogenized three times for 40 s each in a high-throughput tissue grinder, followed by lysis on ice for 30 min with intermittent vortexing every 5 min. After centrifugation at 12,000× g at 4 °C for 30 min, the supernatant was collected. Protein concentrations were determined using the bicinchoninic acid (BCA) Protein Assay Kit (Thermo Fisher Scientific, Waltham, MA, USA). For the assay, 4 μL of the sample was mixed with 16 μL of distilled water and 200 μL of BCA solution and added to a 96-well plate. The mixture was incubated at 37 °C for 30 min, and the absorbance was read at 562 nm.
Initially, 100 µg of protein was mixed with TEAB to achieve a final concentration of 100 mM. TCEP was added to a final concentration of 10 mM and incubated at 37 °C for 60 min. Subsequently, IAM was added to a final concentration of 40 mM, and the mixture was incubated in the dark at room temperature for 40 min. The proteins were precipitated by adding precooled acetone (ratio of acetone to sample volume = 6:1) and incubated at −20 °C for 4 h. After centrifugation at 10,000× g for 20 min, the pellet was dissolved in 100 µL of 100 mM TEAB and digested with trypsin using a 1:50 enzyme-to-protein mass ratio overnight at 37 °C.
The Tandem Mass Tag (TMT) reagent (No. A44522, Thermo Fisher, USA) was thawed at room temperature. Each sample was labeled with one tube of TMT reagent per 100 µg of peptide (labels included CON1-113, CON1-114, CON1-117, TP1-118N, TP2-119, and TP3-121) and incubated at room temperature for 2 h. Hydroxylamine was added, and the reaction continued at room temperature for 30 min. The labeled products were combined equally and concentrated using a vacuum concentrator. Finally, all samples were pooled and vacuum-dried.
For enhanced proteomic depth, samples were fractionated using high pH reverse-phase liquid chromatography. Peptide samples were resolubilized in UPLC loading buffer (2% acetonitrile, adjusted to pH 10 with ammonia) and separated using an ACQUITY UPLC BEH C18 column (1.7 µm, 2.1 mm × 150 mm, Waters, Milford, MA, USA). The separation was achieved with a gradient of elution consisting of 2% acetonitrile (Phase A) and 80% acetonitrile (Phase B), both at pH 10, over 48 min at a flow rate of 200 μL/min. The peptides were eluted using the following gradient: 0~1.9 min, 0~0% B; 1.9~2 min, 0~5% B; 2~17 min, 5~5% B; 17~18 min, 5~10% B; 18~35.5 min, 10~30% B; 35.5~38 min, 30~36% B; 38~39 min, 36~42% B; 39~40 min, 42~100%B; 40~44 min, 100% B; 44~45 min, 100~0% B; 45~48 min, 0% B. A detailed gradient schedule was followed to optimize peptide elution. In total, 28 fractions were collected, optimized by peak shape and time, combined into 14 fractions, and concentrated by vacuum centrifugation for further analysis.
The peptides were analyzed using a two-dimensional liquid chromatography–tandem mass spectrometry setup, combining Evosep One with an Orbitrap Exploris 480 mass spectrometer (Majorbio Bio-Pharm Technology Co., Ltd., Shanghai, China).
Separation was conducted on a C18 column (150 μm × 15 cm, Evosep, Denmark) using a linear gradient of solvent A (water with 0.1% formic acid) and solvent B (100% acetonitrile (ACN) with 0.1% formic acid) at a flow rate of 300 nL/min. The peptides were eluted using the following gradient: 0~2 min, 5~5% B; 2~30 min, 5~38% B; 30~40 min, 38~90% B; 40~44 min, 90~90% B.
The Orbitrap Exploris 480 operated in data-dependent acquisition mode (DDA), alternating between full scan MS and MS/MS acquisition. Full-scan MS spectra were captured in the range of m/z 350–1500 at a resolution of 60K. Selected precursor ions were fragmented using higher-energy collision dissociation (HCD) with MS/MS resolution set at 15K. Dynamic exclusion was applied for 30 s to enhance detection efficiency.
Proteomic data were processed using ProteomeDiscoverer (Version 2.4, Thermo Scientific, Waltham, MA, USA) against the Uniprot database. Settings included a Precursor Mass Tolerance of 20 ppm and Fragment Mass Tolerance of 0.02 Da. The identification process was stringent, with a false discovery rate (FDR) threshold of ≤0.01 and a requirement for at least one unique peptide per protein identification.
Protein annotation involved the use of Gene Ontology (GO) and Kyoto Encyclopedia of Genes and Genomes (KEGG) databases, and DEPs were subjected to further GO and KEGG enrichment analysis to elucidate biological functions and pathways involved.
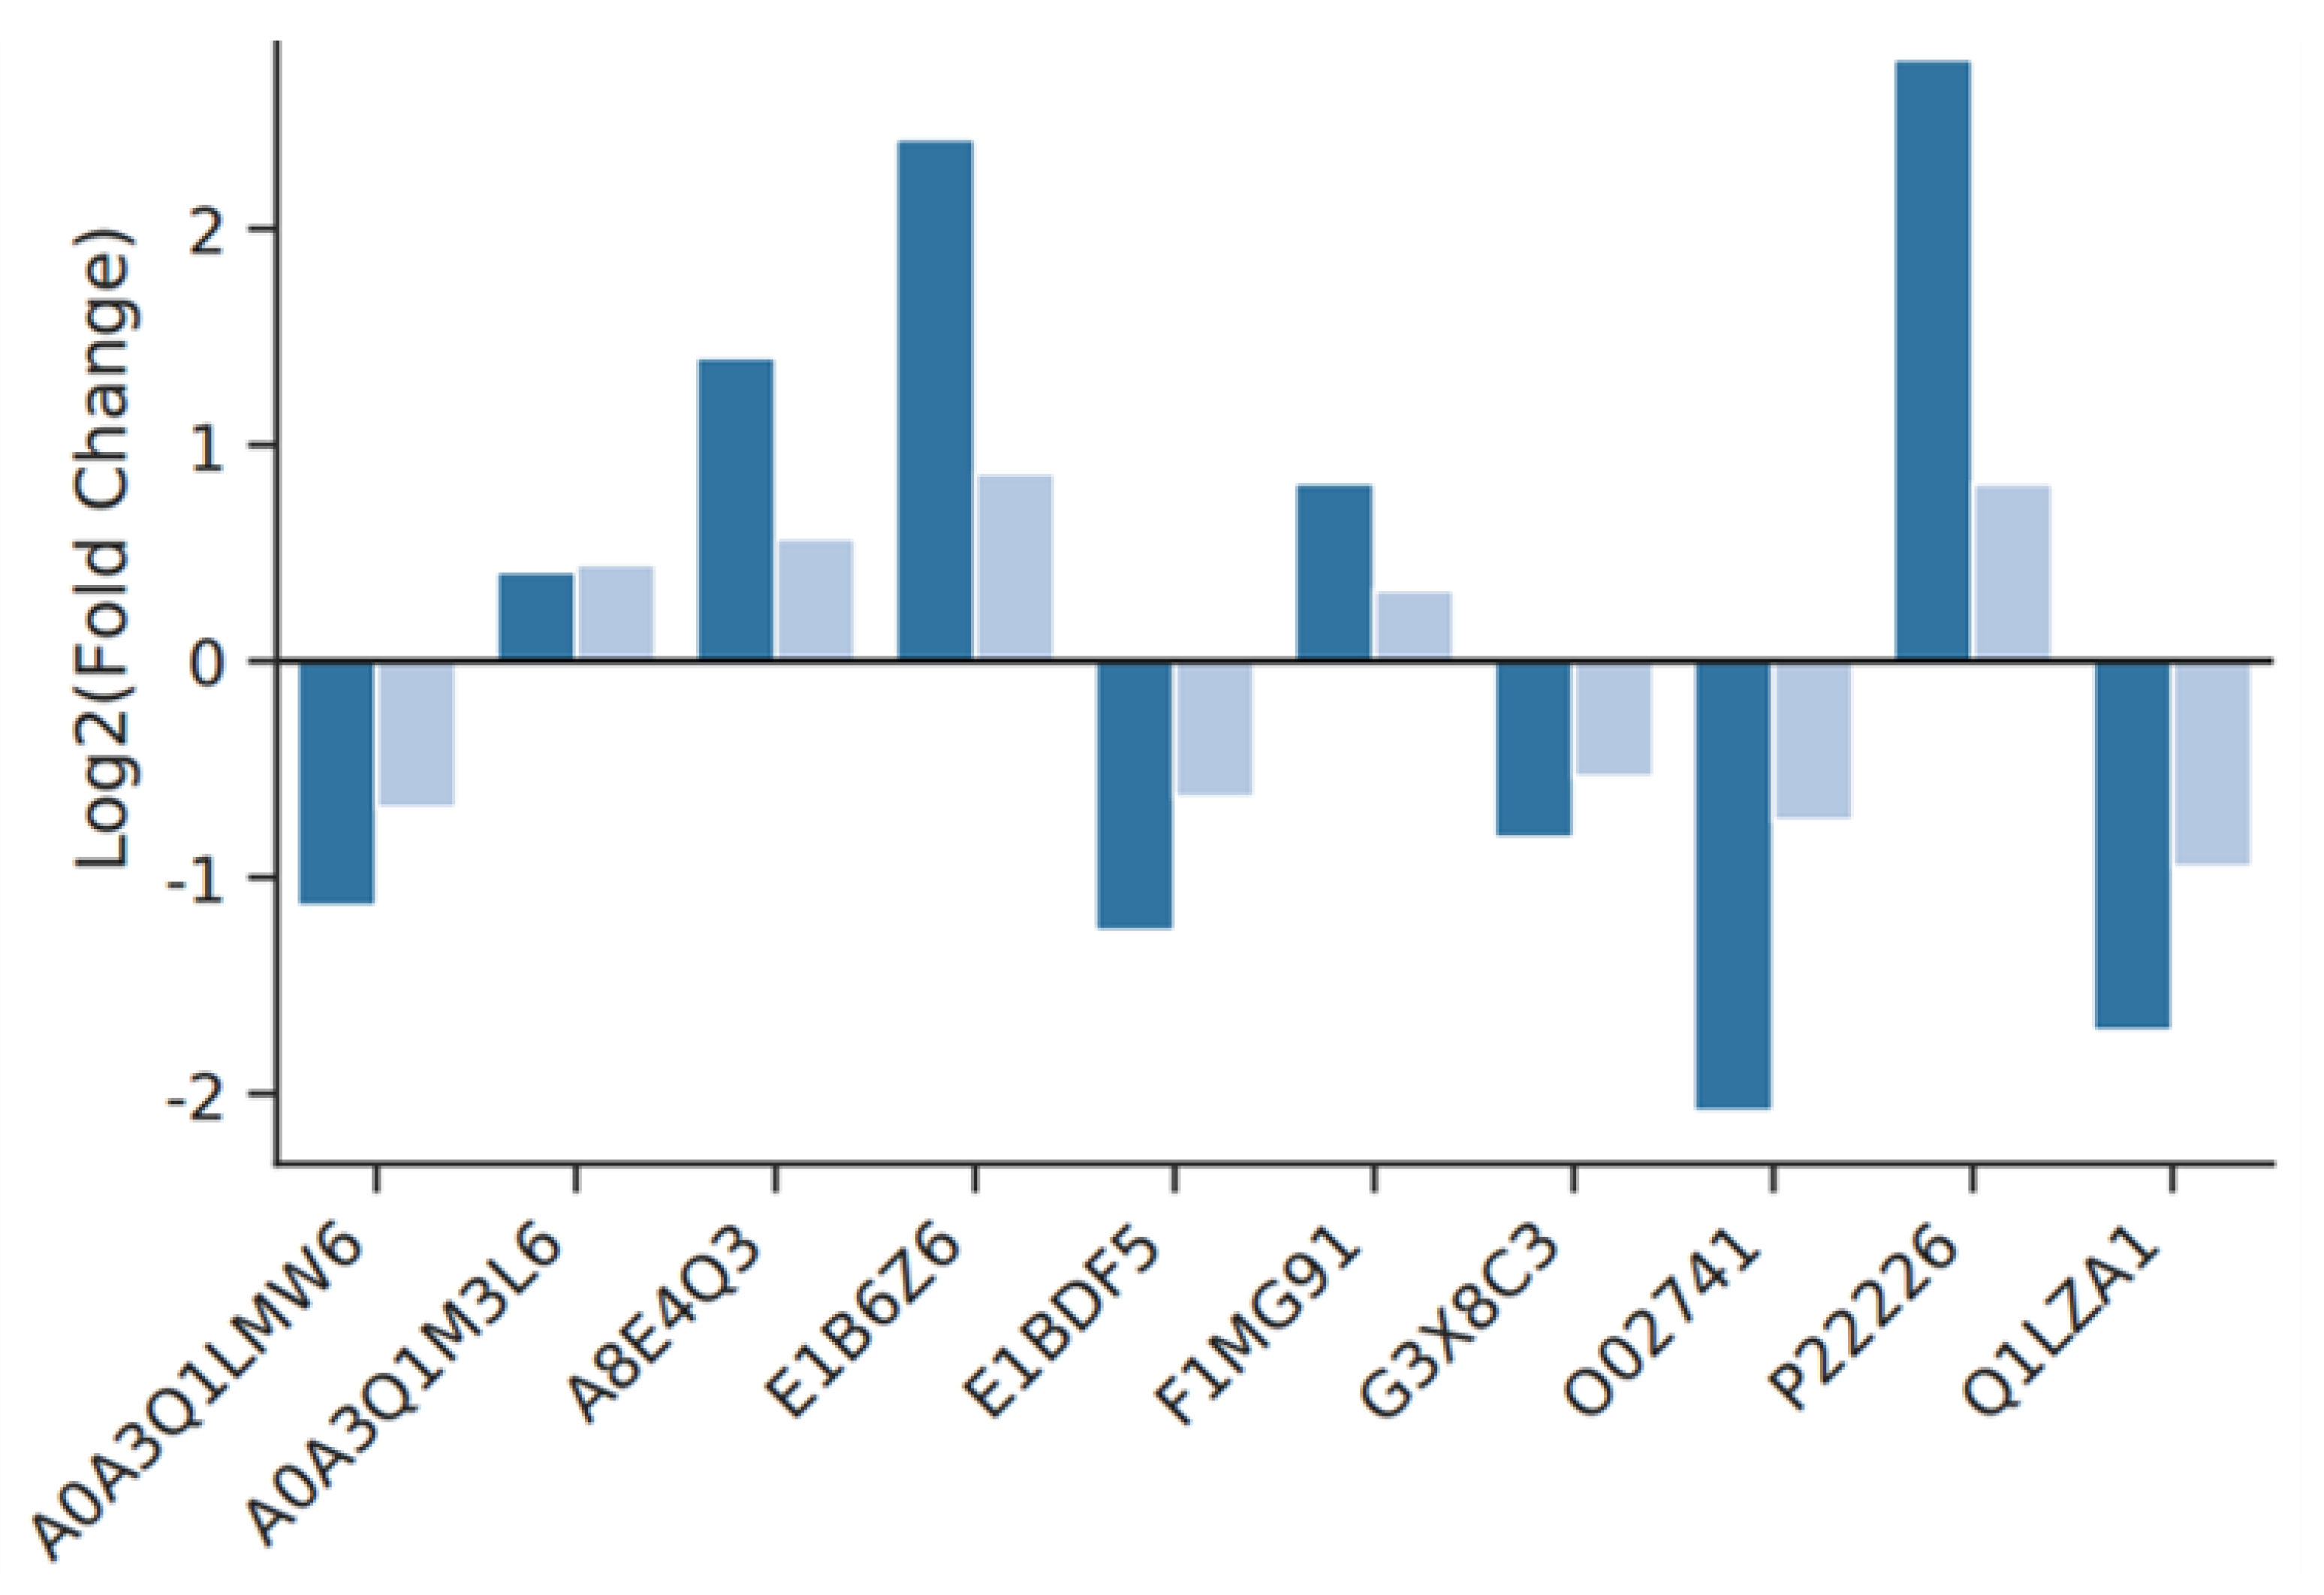
2.5.3. Verification of Differential Proteins by PRM Protein Relative Quantification
To validate the findings from TMT proteomics, 10 target proteins were selected for analysis using liquid chromatography–parallel reaction monitoring (LC-PRM) mass spectrometry. Initially, proteins from the samples were extracted, enzymatically digested into peptides, and desalted prior to quantification. Equal amounts of these digested peptides were then prepared in mass spectrometry loading buffer (2% acetonitrile with 0.1% formic acid) and analyzed using an EASY-nLC 1200 system coupled with a Q Exactive HF-X quadrupole orbitrap mass spectrometer (Thermo Fisher Scientific, Waltham, MA, USA) at Majorbio Bio-Pharm Technology Co., Ltd. (Shanghai, China). Peptides were separated on a C18-reversed phase column (75 µm × 25 cm, Thermo Fisher Scientific, Waltham, MA, USA) using an equilibrated solvent system of 2% ACN with 0.1% formic acid (solvent A) and 80% ACN with 0.1% formic acid (solvent B). The elution was performed with a gradient increasing from 5% to 100% solvent B over 120 min at a flow rate of 300 nL/min. The peptides were eluted using the following gradient: 0–64 min, 5–23% B; 64–80 min, 23–29%B; 80–90 min, 29–38% B; 90–92 min, 38–48% B; 92–93 min, 48–100% B; 93–120 min, maintain 100%B. The eluted peptides were detected using a Q-Exactive HF-X mass spectrometer in positive ion mode, employing PRM with HCD for fragmentation. The full scan range was set from m/z 350 to 1500 with a resolution of 60,000. PRM scans were subsequently acquired with a secondary resolution of 15,000 and a normalized collision energy of 28%. Dynamic exclusion was set to 18 s to prevent redundant sampling of abundant ions.
For PRM data analysis, Skyline software (3.5.0 version) was utilized to extract and manually validate peak data from the raw PRM output. For quantitative analysis, 3–4 of the most abundant ions from each peptide were selected, focusing on fragments from y3 to y(n − 1). The peak area data for each target peptide were extracted and compiled, and the sub-ion peak areas were integrated for comprehensive analysis. Furthermore, the quantitative peptide values from the target proteins were normalized based on labeled peptides and subjected to statistical analysis using Student’s t-test, with a significance threshold set at p < 0.05. Comparisons were made between the quantitative values obtained from label-free or TMT proteomics and the PRM validation results to confirm consistency and accuracy in protein quantification.
2.6. Statistical Analysis
Proteins statistical analysis of the data was performed on the Majorbio I-Sanger Cloud platform (cloud.majorbio.com), using thresholds of fold change (>1.2 or <0.83) and p-value < 0.05 for identifying differentially expressed proteins (DEPs).
The analyses were performed using the software (9.4 version, SAS Institute Inc., Cary, NC, USA). The fermentation parameters data were repeatedly measured using a mixed model with tea polyphenols treatment as fixed effects and run and the run×tea polyphenols treatment interaction as random effects. t-test was used to analyze other data. Results are presented as mean and standard error, with p < 0.05 considered statistically significant, and the level of significance considered for the tendencies was 0.05 < p < 0.10.
4. Discussion
This study, through in vitro and in vivo experiments and employing multi-omics approaches, explores the effects of tea polyphenols on CH
4 production and VFA transport in bovine rumen epithelial cells, aiming to clarify the intrinsic relationships between tea polyphenols, the rumen microbiome, and the host. Our in vitro studies indicated that tea polyphenols could decrease total GP and CH
4 output, significantly reducing the acetate/propionate ratio. The CH
4 production decreased from 2.27 mL in 0% to 1.68 mL in 1%, and the acetate/propionate ratio decreased from 3.95 in 0% to 3.52 in 1%. During rumen fermentation, acetate production is accompanied by hydrogen generation, and high hydrogen partial pressures may inhibit the degradation of feed [
24], whereas propionate production consumes hydrogen, indicating that propionate formation in the rumen can reduce the substrates available for CH
4 production [
25,
26]. Studies have shown that monensin can reduce CH
4 emissions by lowering the rumen acetate/propionate ratio [
27,
28]. CH
4 production correlates positively with the rumen acetate/propionate ratio, and the reduction in this ratio partly explains the decreased CH
4 production due to tea polyphenols.
Rumen methanogens play a critical role in CH
4 formation, converting CO
2, H
2, methanol, and formate into CH
4 [
29]. Methanogens produce CH
4 primarily through the catalysis of the mcr enzyme complex [
30], accounting for over 90% of total CH
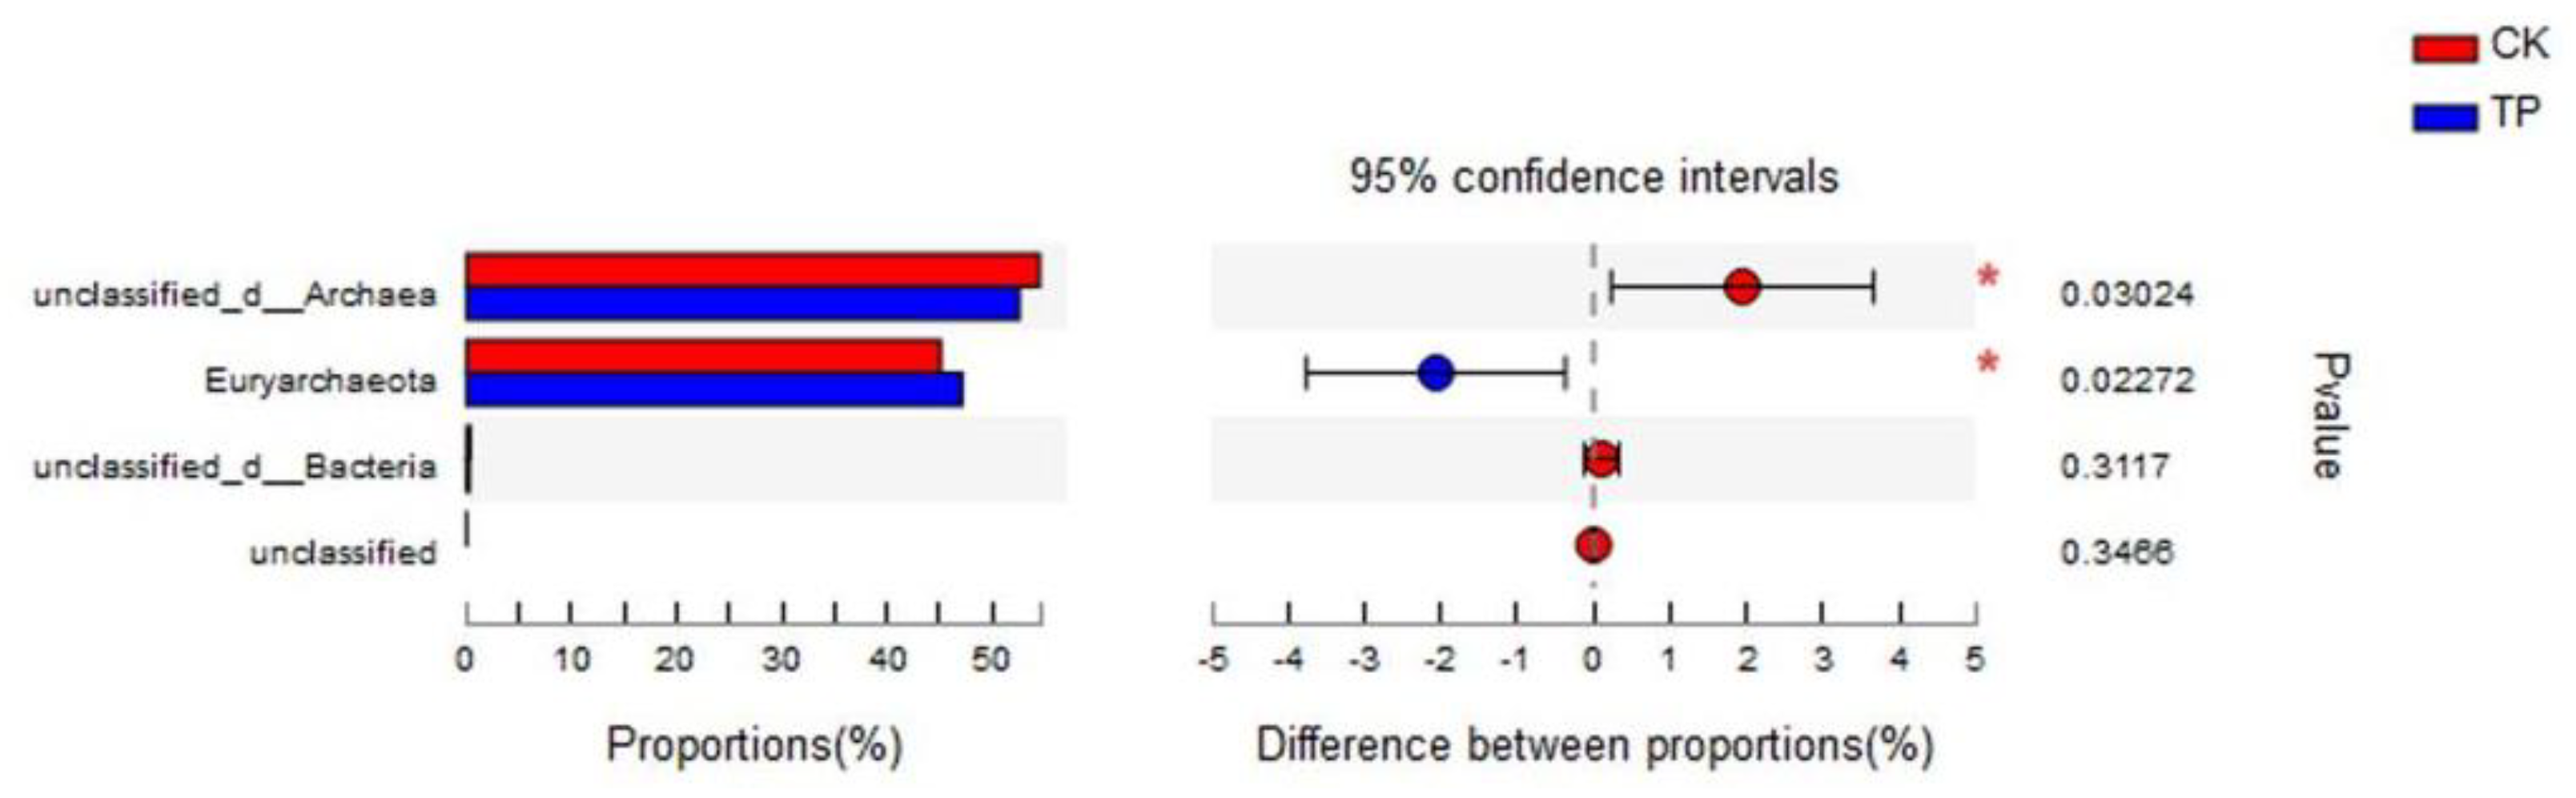
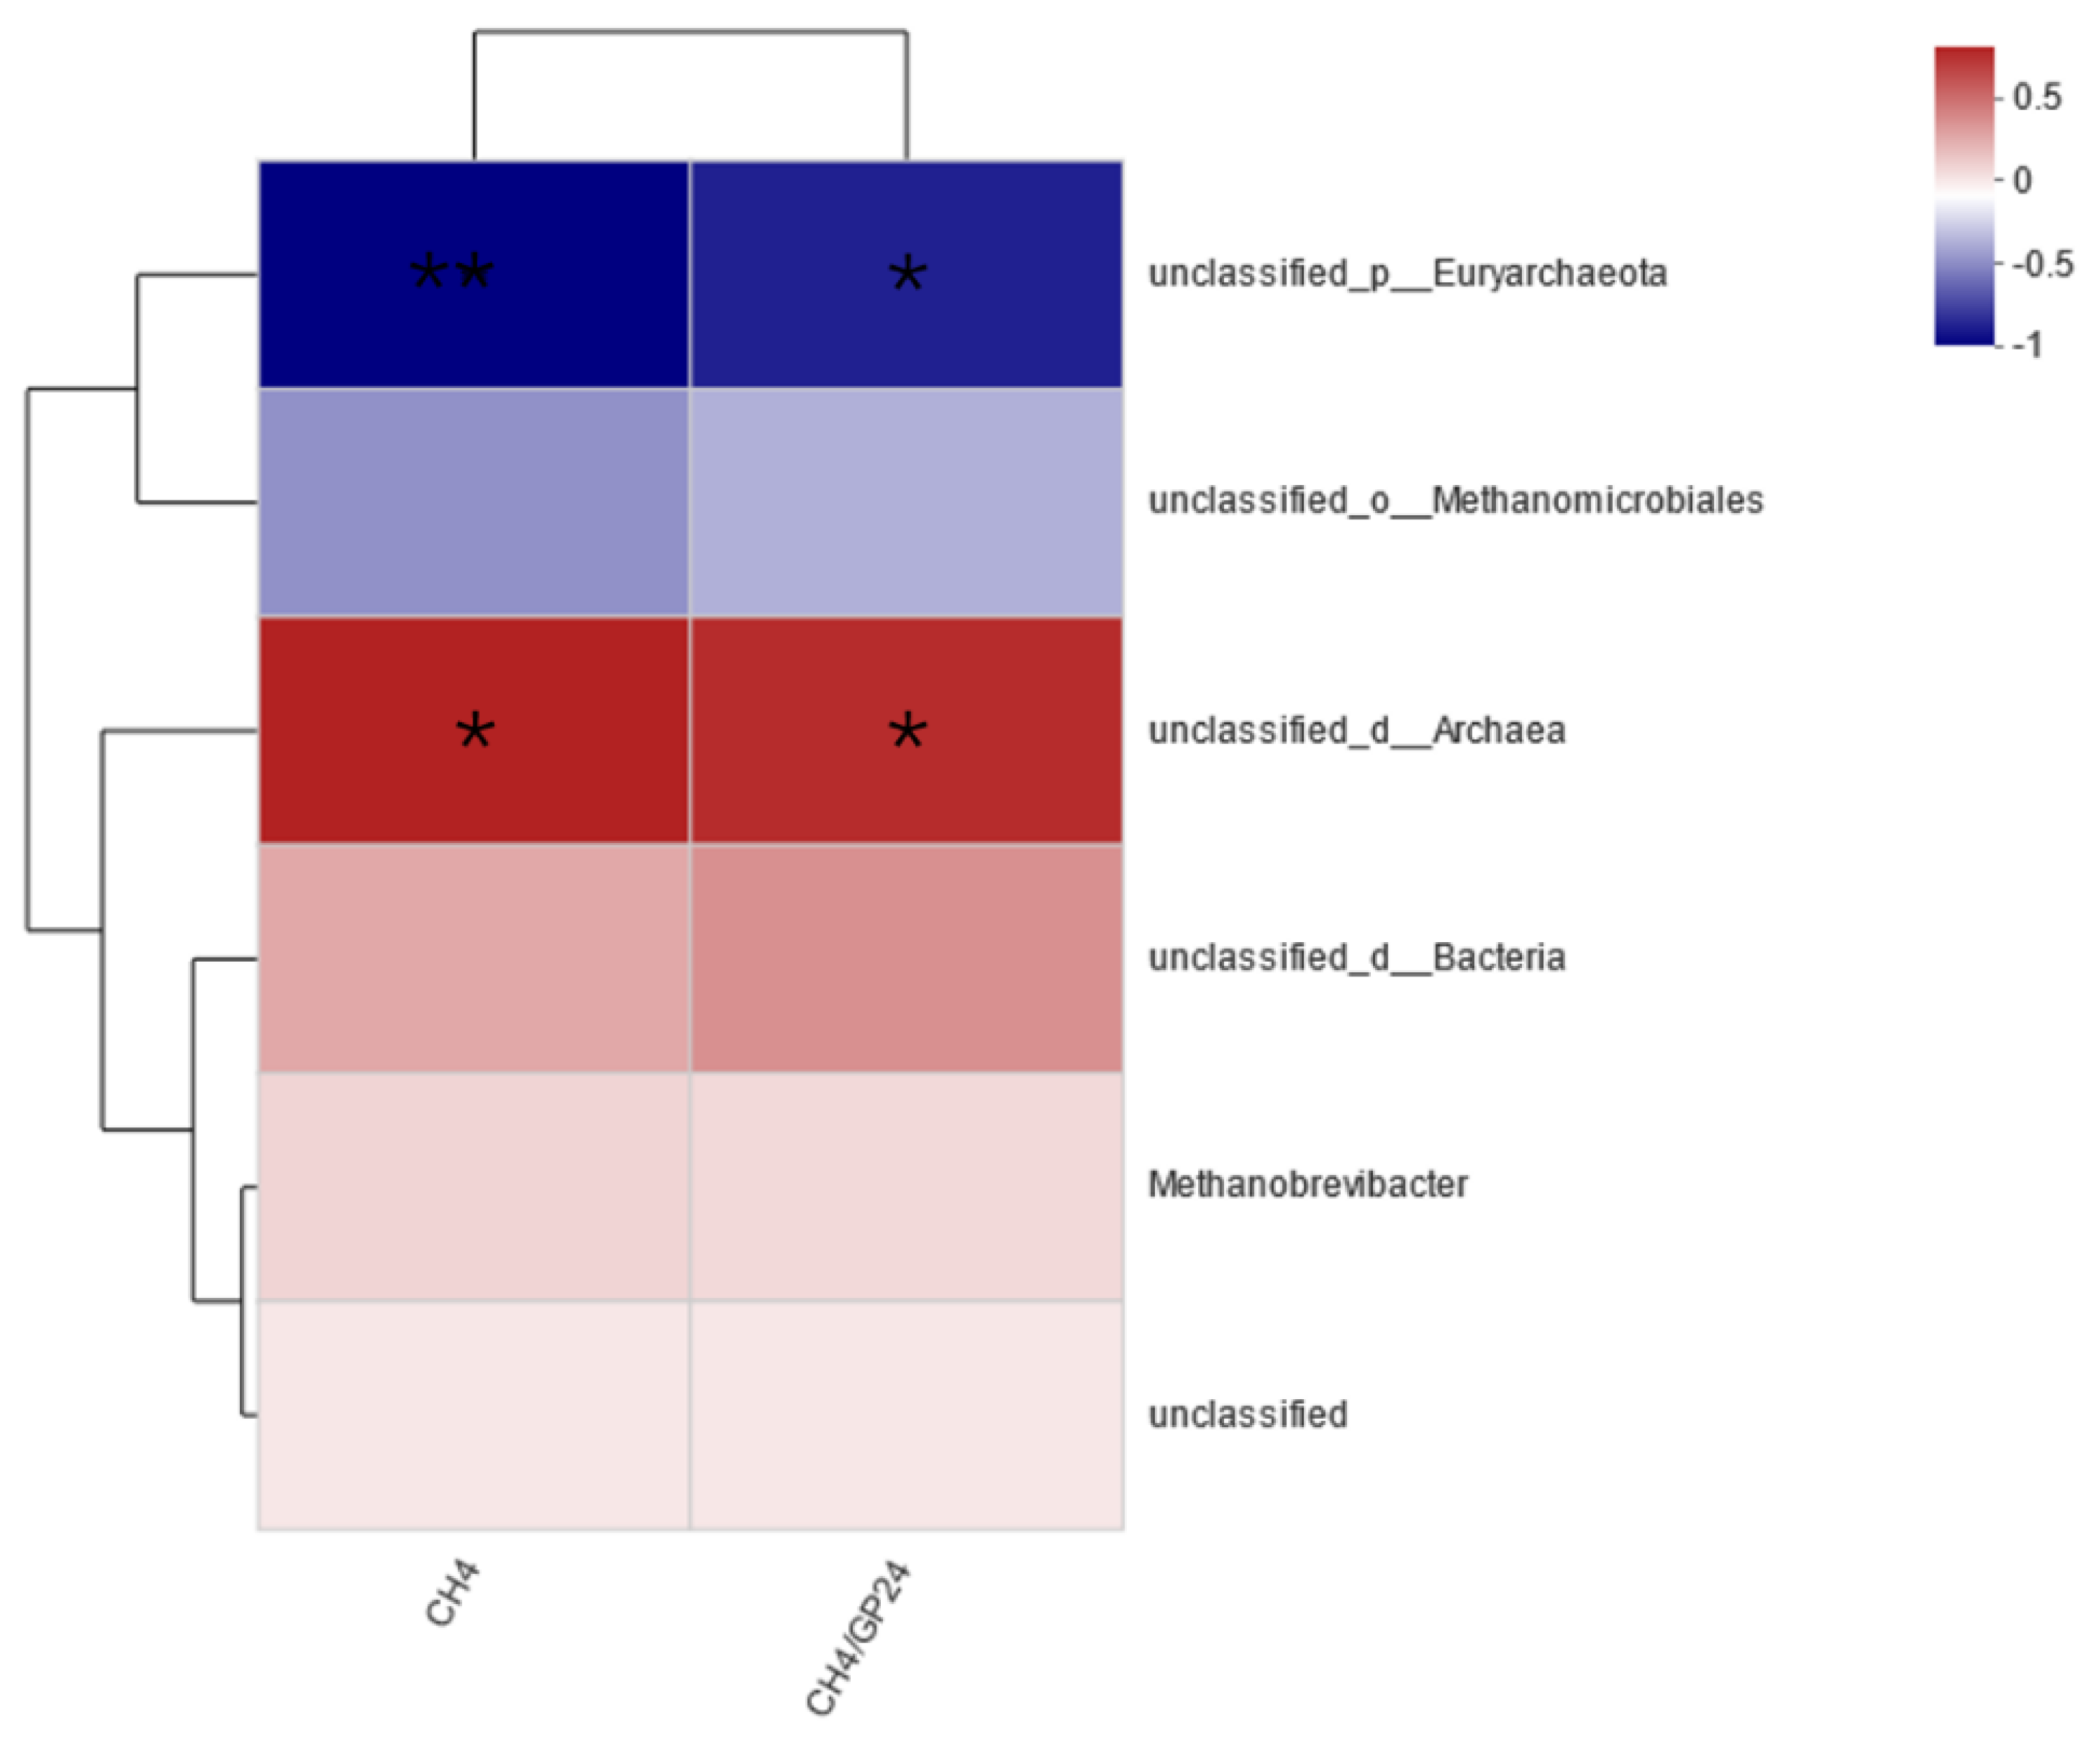
4 generation. Our findings revealed that tea polyphenols significantly reduced the relative abundance of
unclassified_d_Archaea at the phylum and genus levels. Spearman’s correlation analysis showed a significant positive correlation between
unclassified_d_Archaea and both CH
4 production and concentration, suggesting that tea polyphenols can affect the abundance of methanogens, thereby influencing CH
4 generation. Jayanegara et al. (2015) found that tannins in vitro could reduce the number of methanogens [
31] due to tannins binding with proteins or microbial cell enzymes to inhibit methanogen activity [
32,
33]. These studies confirm that polyphenolic compounds (both tannins and non-tannins) can affect the quantity and community structure of methanogens, thereby impacting CH
4 production.
A symbiotic relationship exists between rumen protozoa and methanogens, where methanogens can attach to the surface or inside of protozoa [
34,
35]. Consequently, the composition of rumen protozoa affects the production of CH
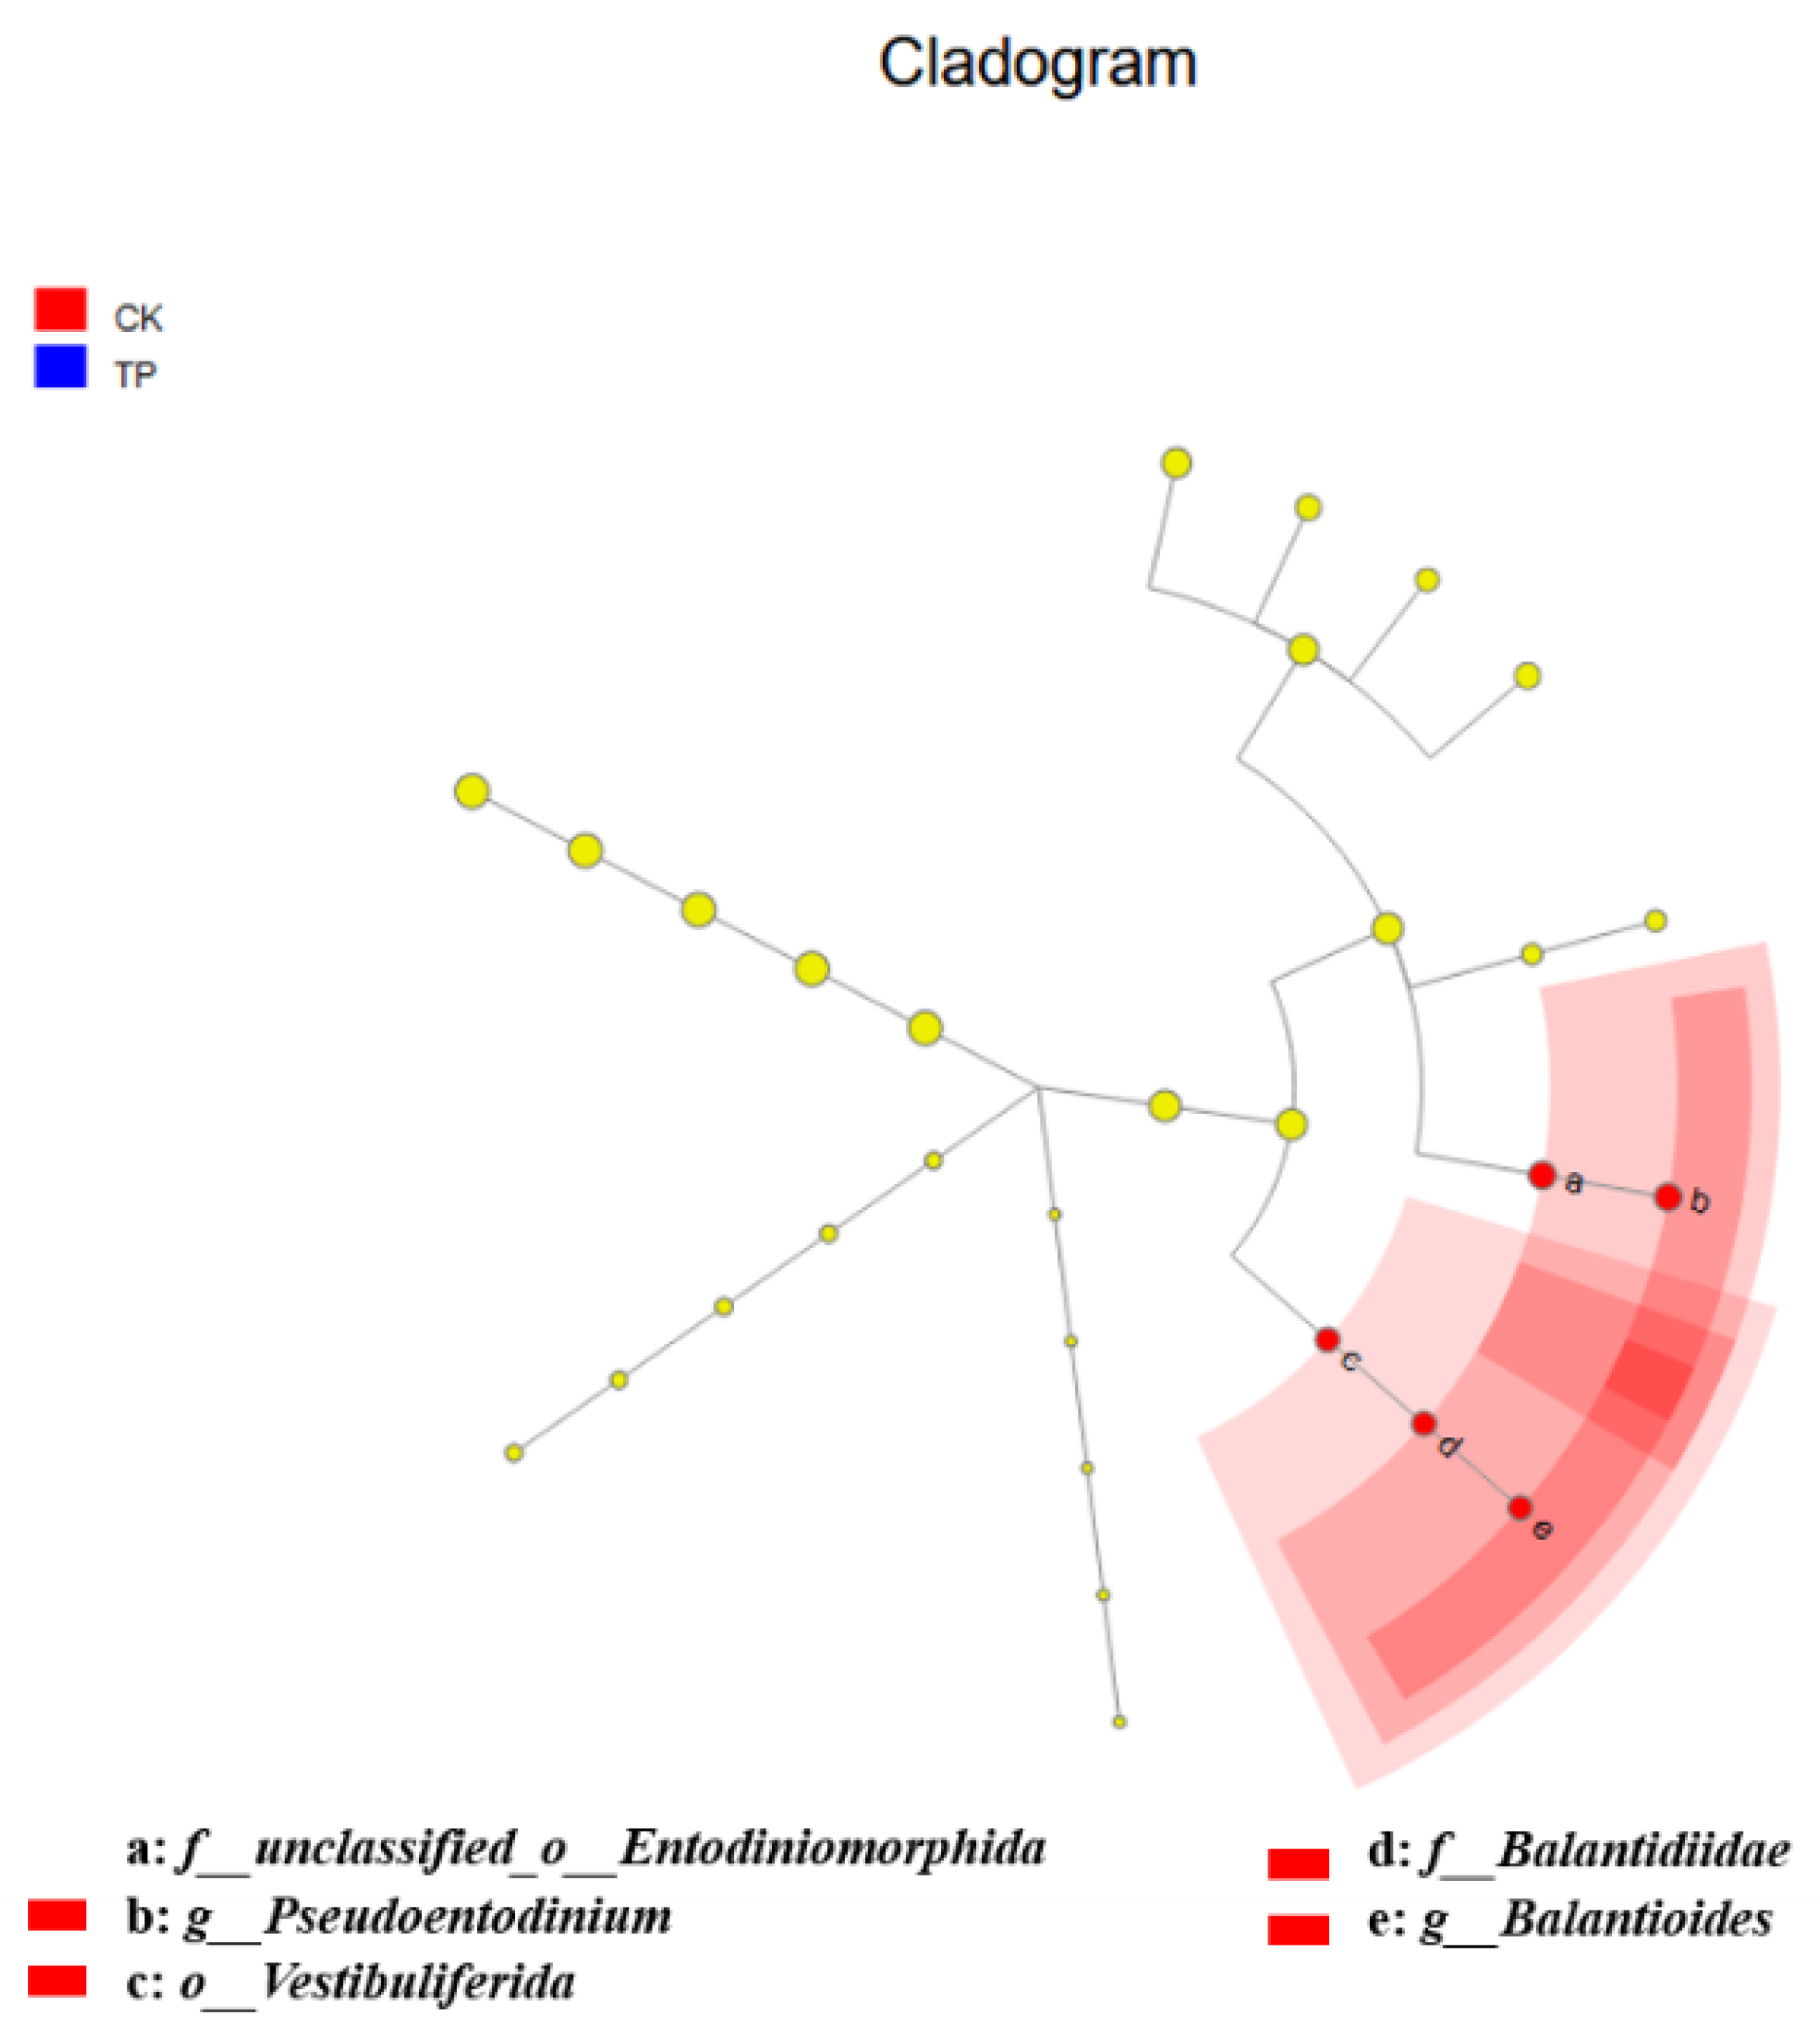
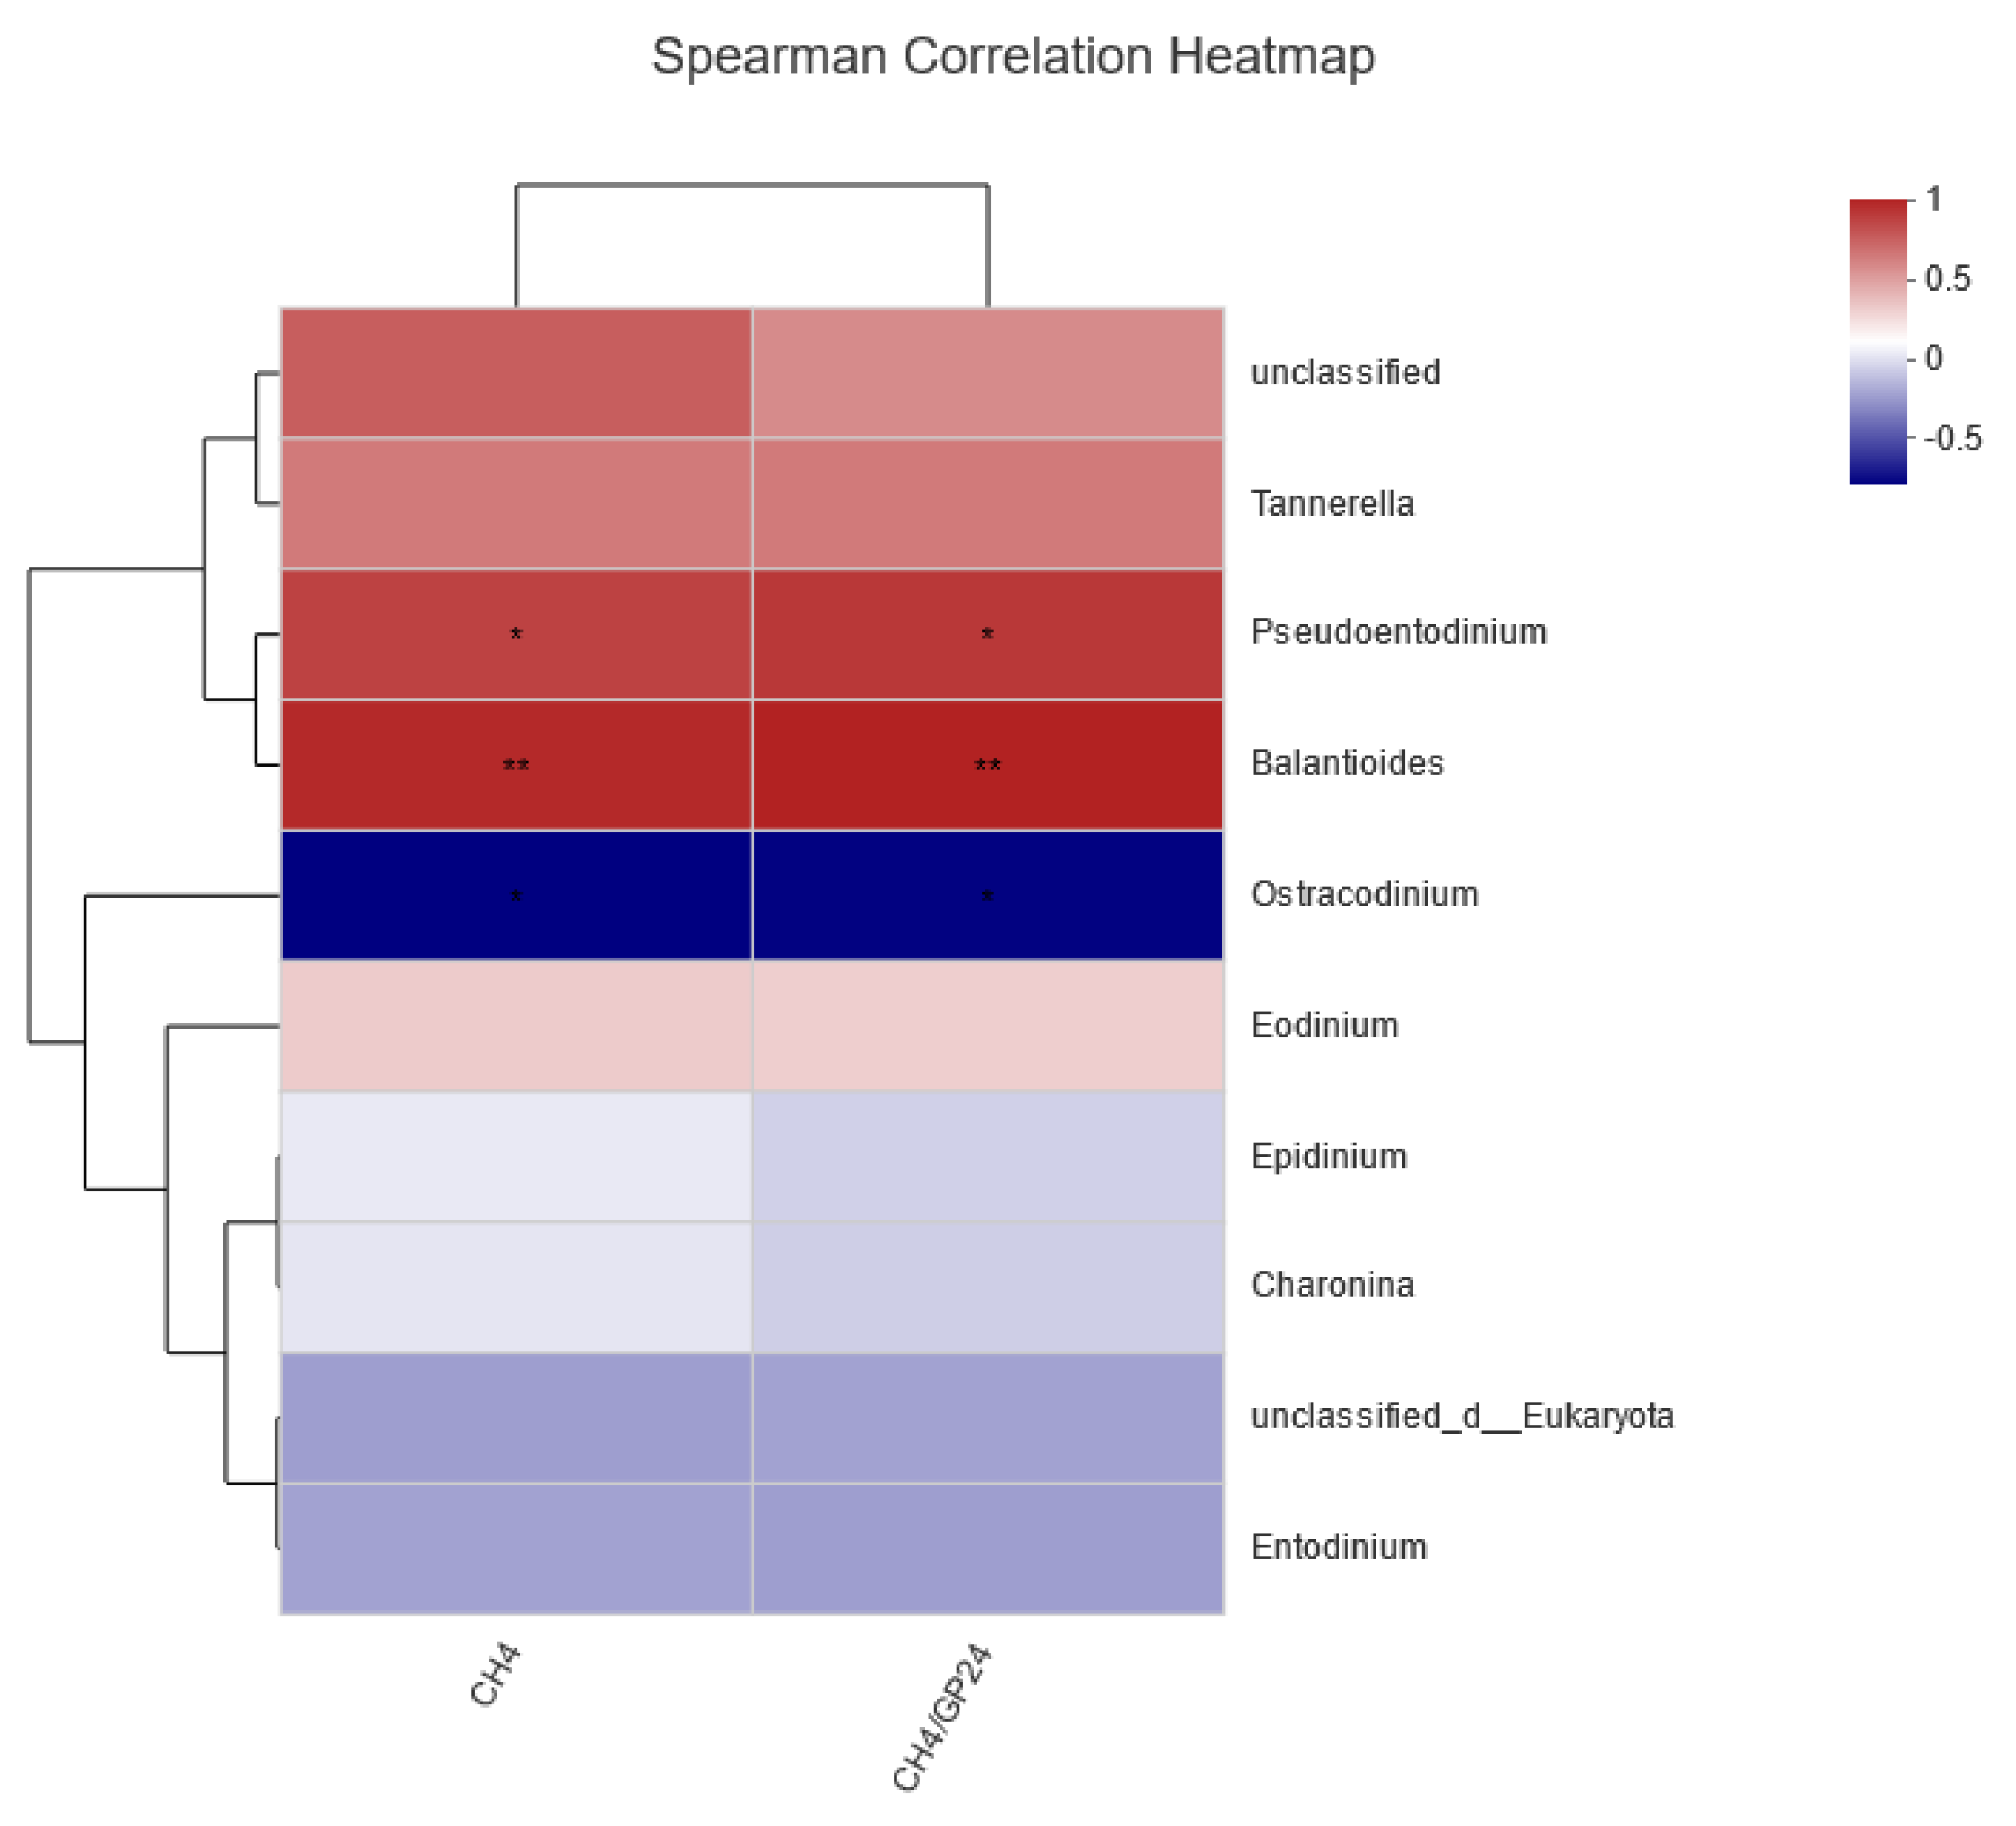
4 in ruminants. The LEfSe differential analysis in this study showed that tea polyphenols influenced the community structure of rumen protozoa, significantly enriching protozoa such as
f__unclassified_o__Entodiniomorphida,
f__Balantidiidae,
o__Vestibuliferida,
g__Pseudoentodinium, and
g__Balantioides in the control group. Spearman’s correlation analysis indicated a positive correlation between
Balantioides and both CH
4 production and concentration, suggesting that tea polyphenols reduce CH
4 production by inhibiting the activity of
Balantioides protozoa in the rumen. Poungchompu et al. (2009) examined the impact of concentrated tannins from mangosteen pericarp and soapnut fruit on the number of rumen protozoa, showing that these tannins significantly reduced the numbers of both methanogens and protozoa in rumen fluid [
36]. In summary, the findings suggest that tea polyphenols reduce CH
4 production by decreasing the numbers of both methanogens and protozoa, though a large proportion of methanogens and protozoa highly correlated with CH
4 production remain unidentified in this study. Further functional observations of these microbes are needed to elucidate the microbial mechanisms by which tea polyphenols affect CH
4 production in the rumen.
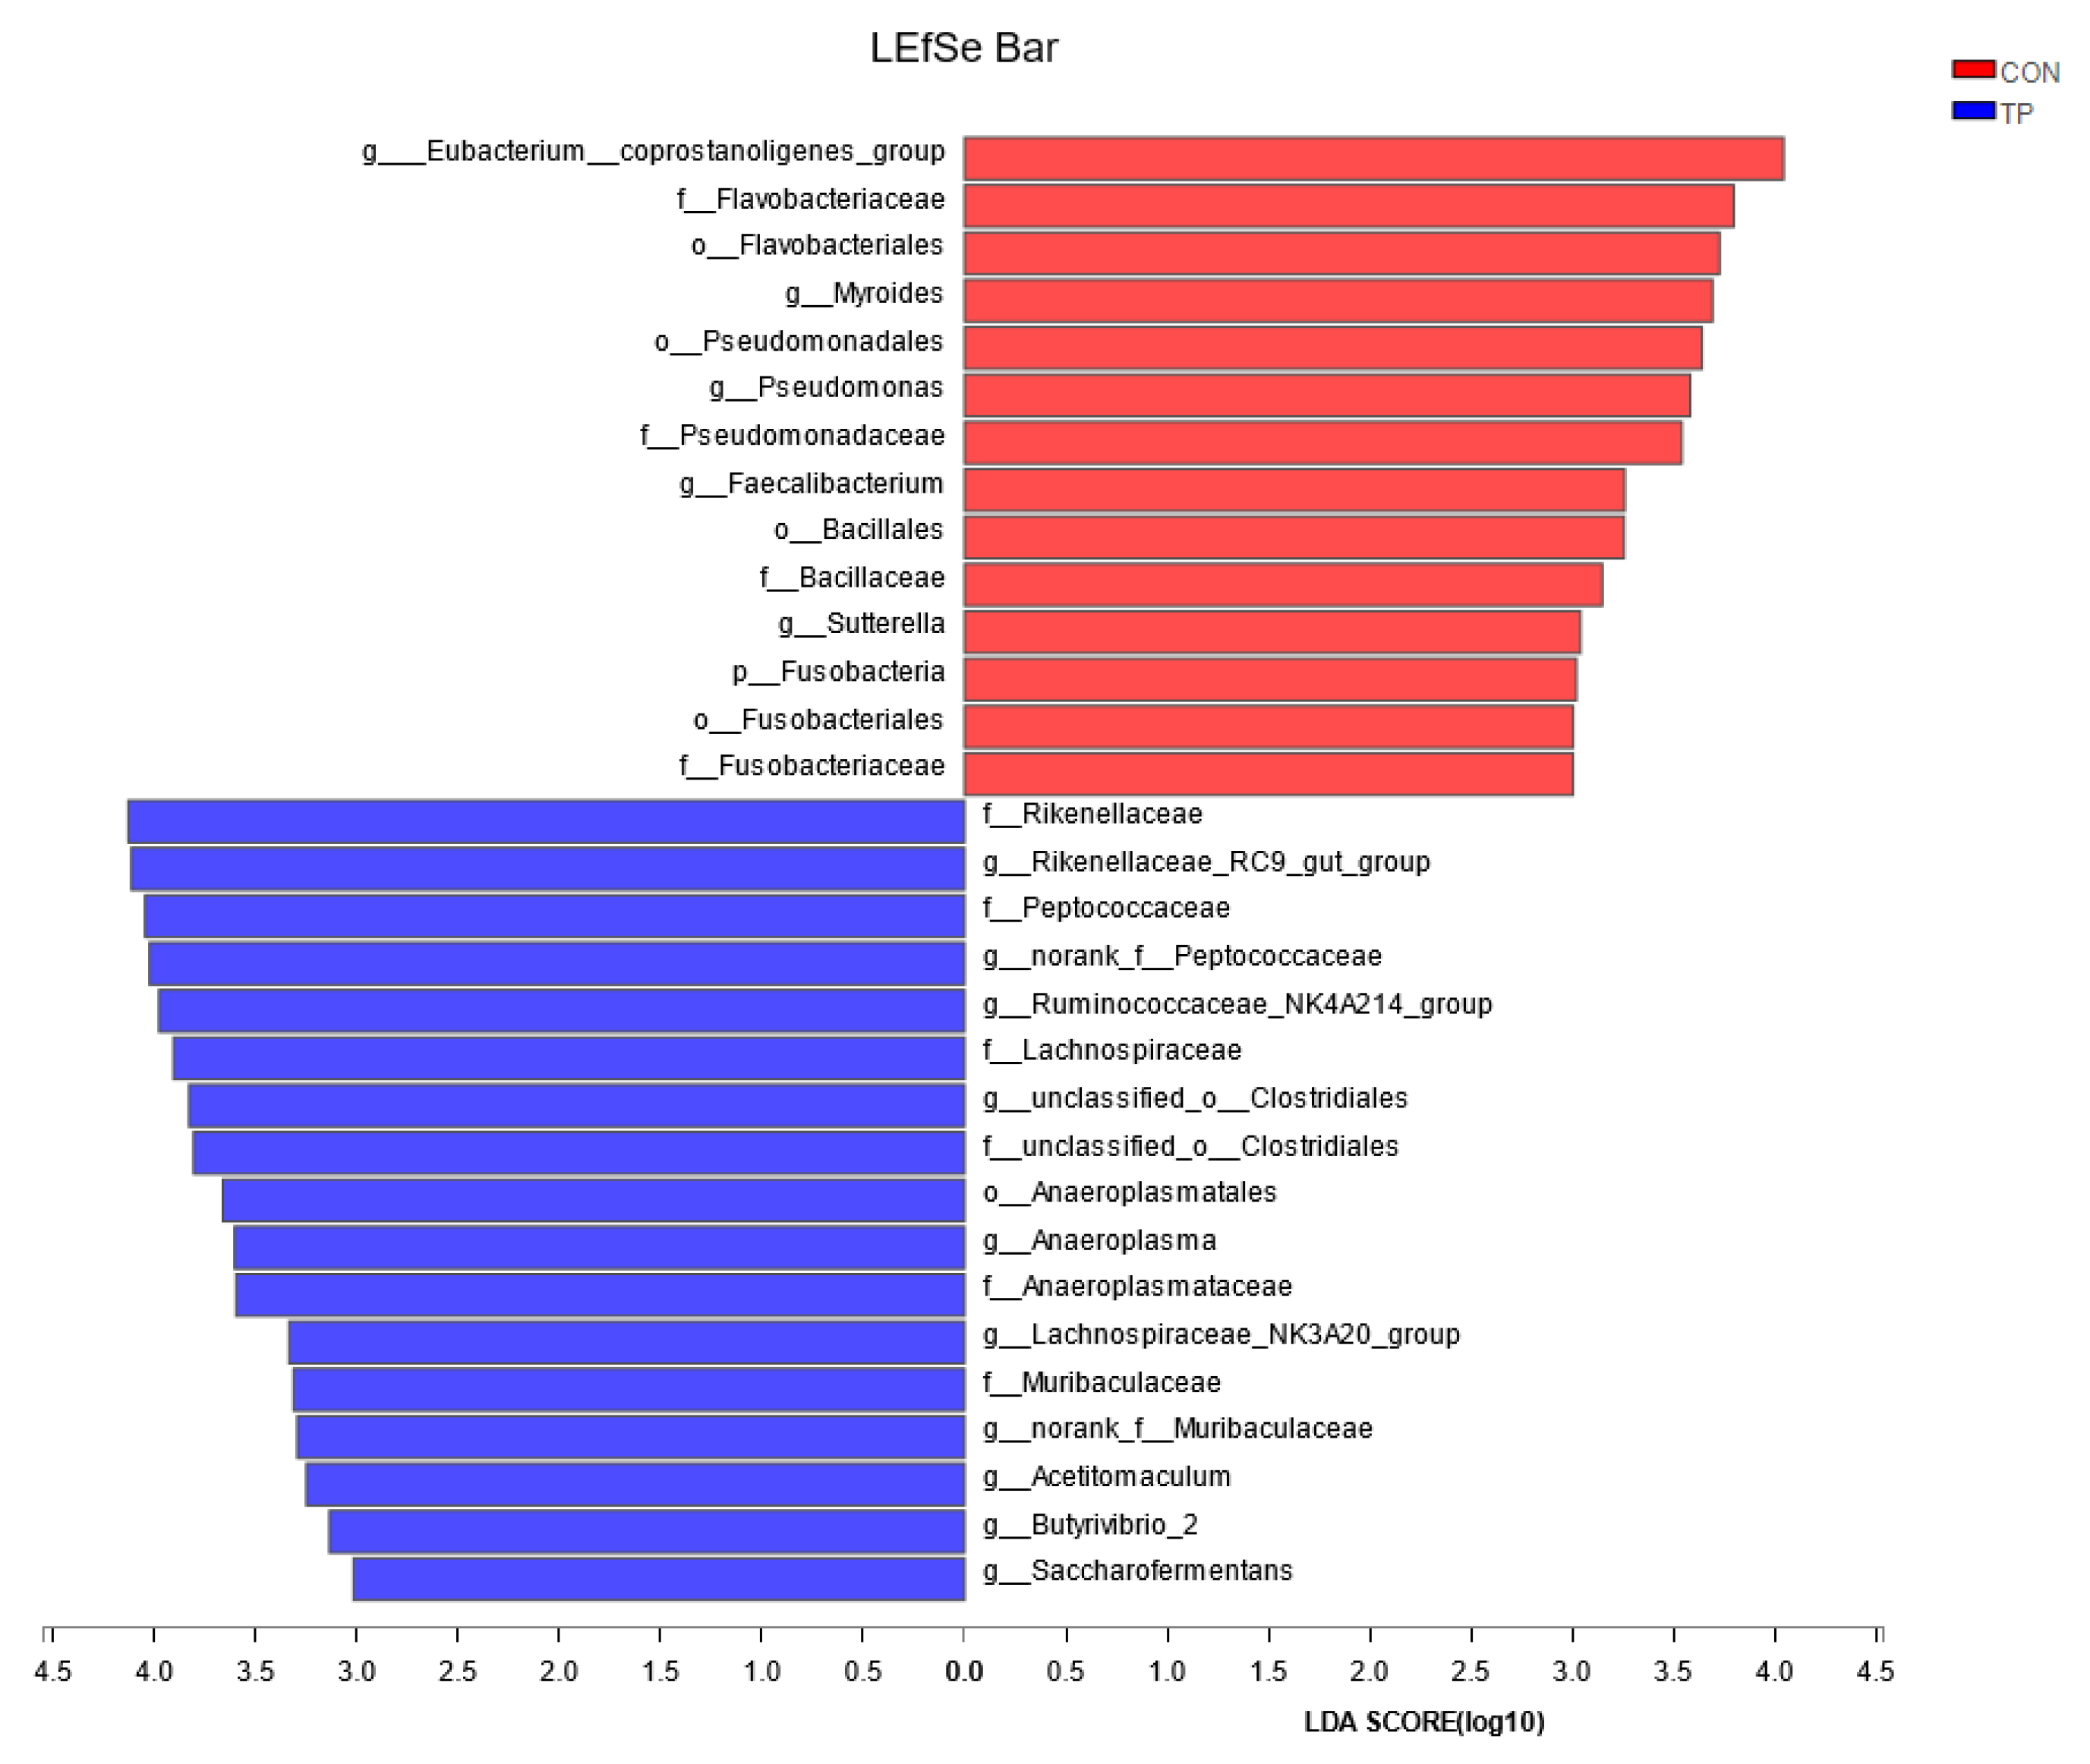
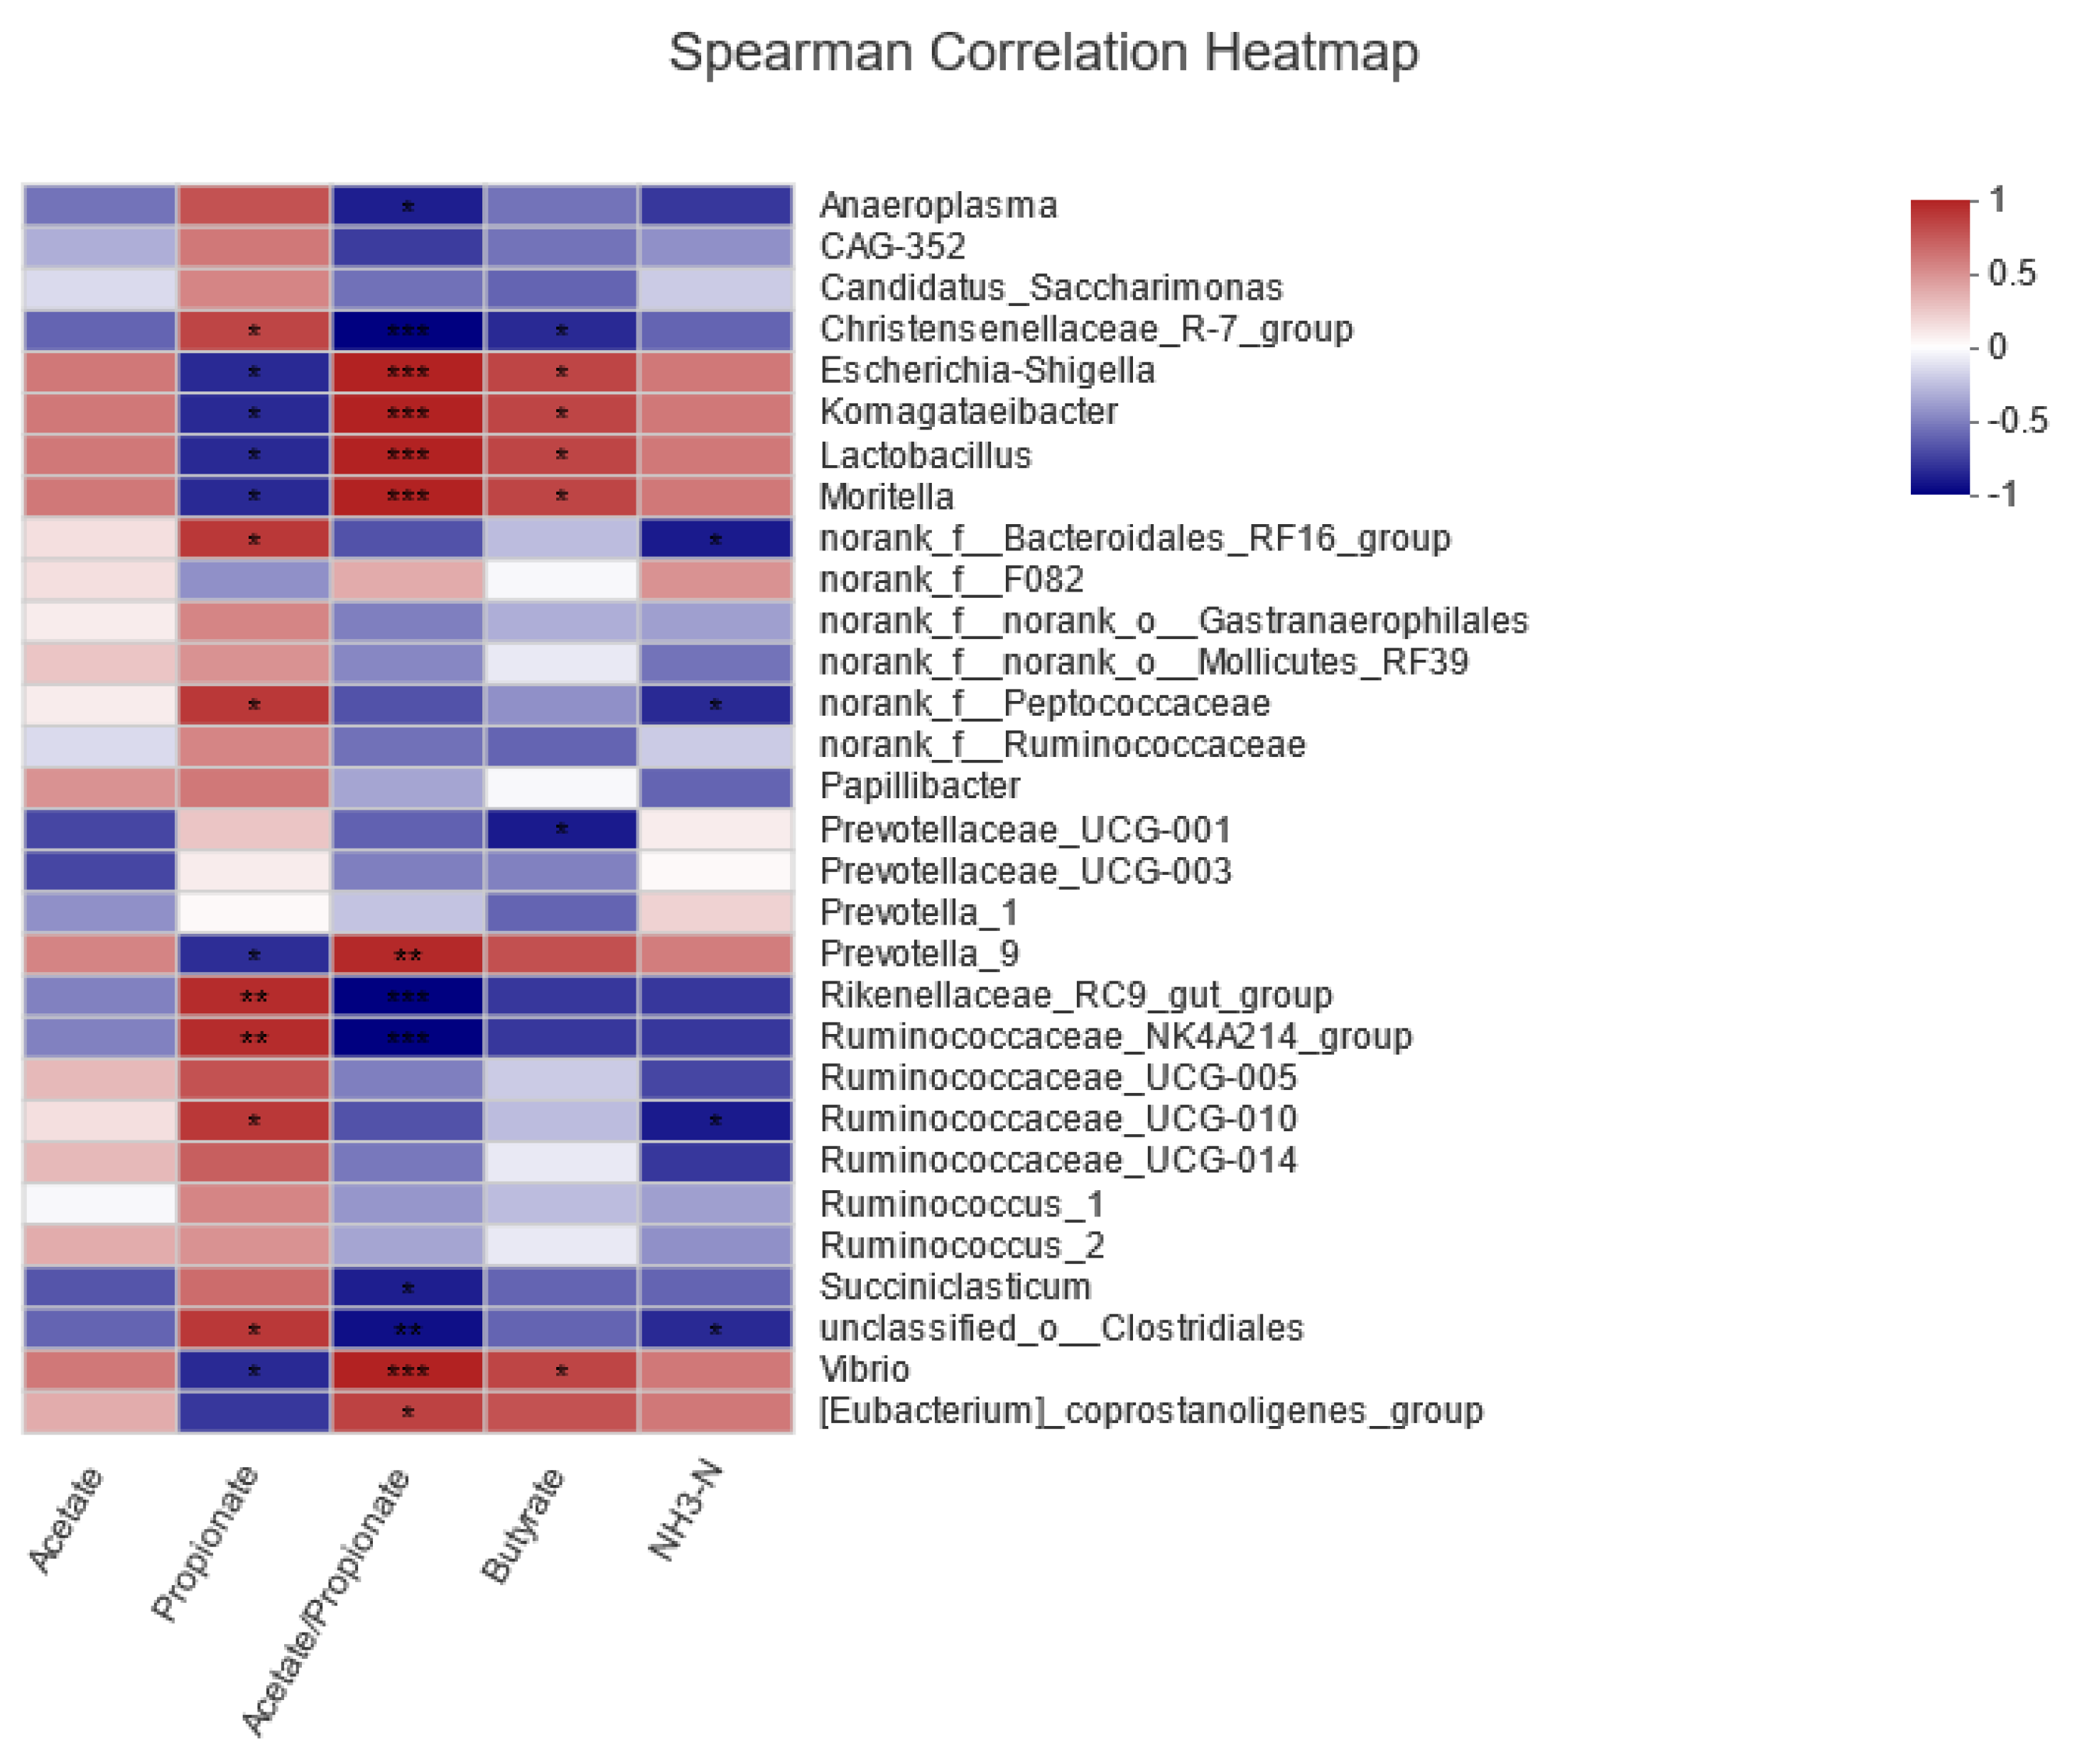
The in vivo experiments suggested a trend toward increased rumen liquid propionate concentration and a reduced acetate/propionate ratio. This is consistent with the results of the in vitro experiments. Further investigation using 16S high-throughput sequencing revealed significant enrichment of the
Ruminococcaceae_NK4A214_group in the tea polyphenol group. Typically, a higher proportion of concentrate in the diet favors propionate fermentation. Research comparing the effects of high-concentrate and high-forage diets on rumen microbiota found significant enrichment of the
Ruminococcaceae_NK4A214_group in high-concentrate diets, significantly associated with VFA production [
37]. Thus, tea polyphenols may alter the composition of VFAs in the rumen of dairy cows by modulating the relative abundance of rumen microbiota. The LEfSe differential analysis in this study revealed significant enrichment of microbes such as the
Rikenellaceae_RC9_gut_group,
Anaeroplasma,
Lachnospiraceae_AC2044_group, and
Butyrivibrio_2 in the tea polyphenol group compared to the control. Significant enrichment of the
Lachnospiraceae_AC2044_group in the tea polyphenol group suggested that consumption of tea polyphenols may promote fiber degradation in dairy cows, but the specific impact mechanism still needs further exploration. Furthermore, studies correlating microbes with feed efficiency have shown significant associations between
Anaeroplasma and
Butyrivibrio_2 with feed efficiency [
38], further suggesting that adding tea polyphenols to the diet may enhance the feed efficiency of the animals.
Rumen microbial fermentation of feed results in the production of VFAs, which constitute 70–80% of the absorbed energy for ruminants [
39]. The rumen epithelium serves as a unique interface for interactions between host and microbial metabolisms, with the absorption capabilities of VFAs in the rumen epithelium influencing the net utilization of nutrients in the organism. This study conducted a GO analysis on the differential proteins in the rumen epithelial cells of dairy cows fed with tea polyphenols, finding these proteins enriched in transporter activity molecular functions. Compared to the control group, proteins such as COIII, S100A8, FABP1, SLC2A8, and SLC29A1 were significantly upregulated, whereas HBB, RAB4A, RBP4, LOC107131172, HBA, and ZFYVE19 were downregulated in the tea polyphenol group. S100A8 can specifically form a complex with polyunsaturated fatty acid arachidonic acid (AA), known as S100A8-AA, which then acts as a transport protein to deliver arachidonic acid to target cells [
40]. The solute carrier family (SLC) represents one of the most important families of membrane transport proteins, involved in intercellular material transport, nutrient metabolism, and energy transfer [
41]. In this study, significant upregulation of SLC2A8 and SLC29A1 was observed in the rumen epithelium, indicating that dietary inclusion of tea polyphenols enhances the expression of nutrient transport proteins in rumen epithelial cells.
Fatty acid-binding proteins (FABPs), including FABP1, FABP2, and FABP6, function in the intestine. FABPs can bind to fatty acids and other hydrophobic ligands, transporting them to locations for fatty acid oxidation or triglyceride synthesis [
42]. Additionally, FABPs regulate biochemical processes, particularly lipid metabolism, by modulating fatty acid concentrations [
43]. Studies have shown that in mammals, FABP1 can transport fatty acids via aqueous diffusion [
44]. In this experiment, compared to the control group, FABP1 protein was significantly upregulated in the tea polyphenol group and positively correlated with the concentration of propionate in the rumen. This suggests that dietary tea polyphenols enhance the transport capacity of VFAs in rumen epithelial cells.
The absorption and transport of nutrients in animals require the mediation of blood, which contains various biochemical markers that are closely related to the physiological status of the body. Thus, changes in blood biochemical markers can indicate the transport and utilization of nutrients. Studies have found that phenolic compounds produced by the degradation of tannic acid are transported via the bloodstream to the liver, and excessive amounts beyond the liver’s detoxification capacity can cause moderate symptoms in animals [
45]. The results of this study indicated that the addition of tea polyphenols to the diet did not significantly affect the levels of ALT and AST in the blood of dairy cows, suggesting that adding 1% tea polyphenols to the diet has no adverse effects on the liver. Additionally, this study found that dietary tea polyphenols significantly increased the levels of T-AOC and GSH-PX in dairy cow blood, consistent with previous research during the peripartum period, which showed that dietary tea polyphenols can enhance the levels of T-AOC and GSH-PX in dairy cow blood and improve their antioxidant capacity [
46]. This is because tea polyphenols are reductants that can reduce free radicals to more stable compounds, thereby clearing harmful free radicals in the body and enhancing the body’s antioxidant capacity to avoid oxidative damage [
12,
47]. In summary, supplementing dairy cow diets with tea polyphenols can help improve the utilization efficiency of feed energy and the health status of the cows, contributing to the efficient, green, and healthy development of the dairy industry.


