3.1. MethylRAD-Seq Data and Identification of A. japonicus DNA Methylation Sites
We performed MethylRAD-Seq of genomic DNA extracted from the body wall tissue of
A. japonicus at 4 months, 1 year, 2 years, and 3 years old. We used a total of 12 tissue samples (3 samples from each of the age groups) and obtained a total of 280,422,936 reads; a total of 130,276,536 (46.4%) of them were high-quality reads. The three samples of 3-year-old
A. japonicus yielded 75,848,311 reads; a total of 36,771,351 (48.48%) of them were high-quality reads, with an average of 25,282,770. The three samples of 2-year-old
A. japonicus yielded 62,579,986 reads; a total of 32,326,130 (51.66%) of them were high-quality reads, with an average of 20,859,995 The three samples of 1-year-old
A. japonicus yielded 65,336,130 reads; a total of 30,392,328 (46.52%) of them were high-quality reads, with an average of 21,778,710. The three samples of 4-month-old
A. japonicus yielded 76,656,509 reads; a total of 30,786,727 (40.16%) of them were high-quality reads, with an average of 25,552,170. See
Table 6 and
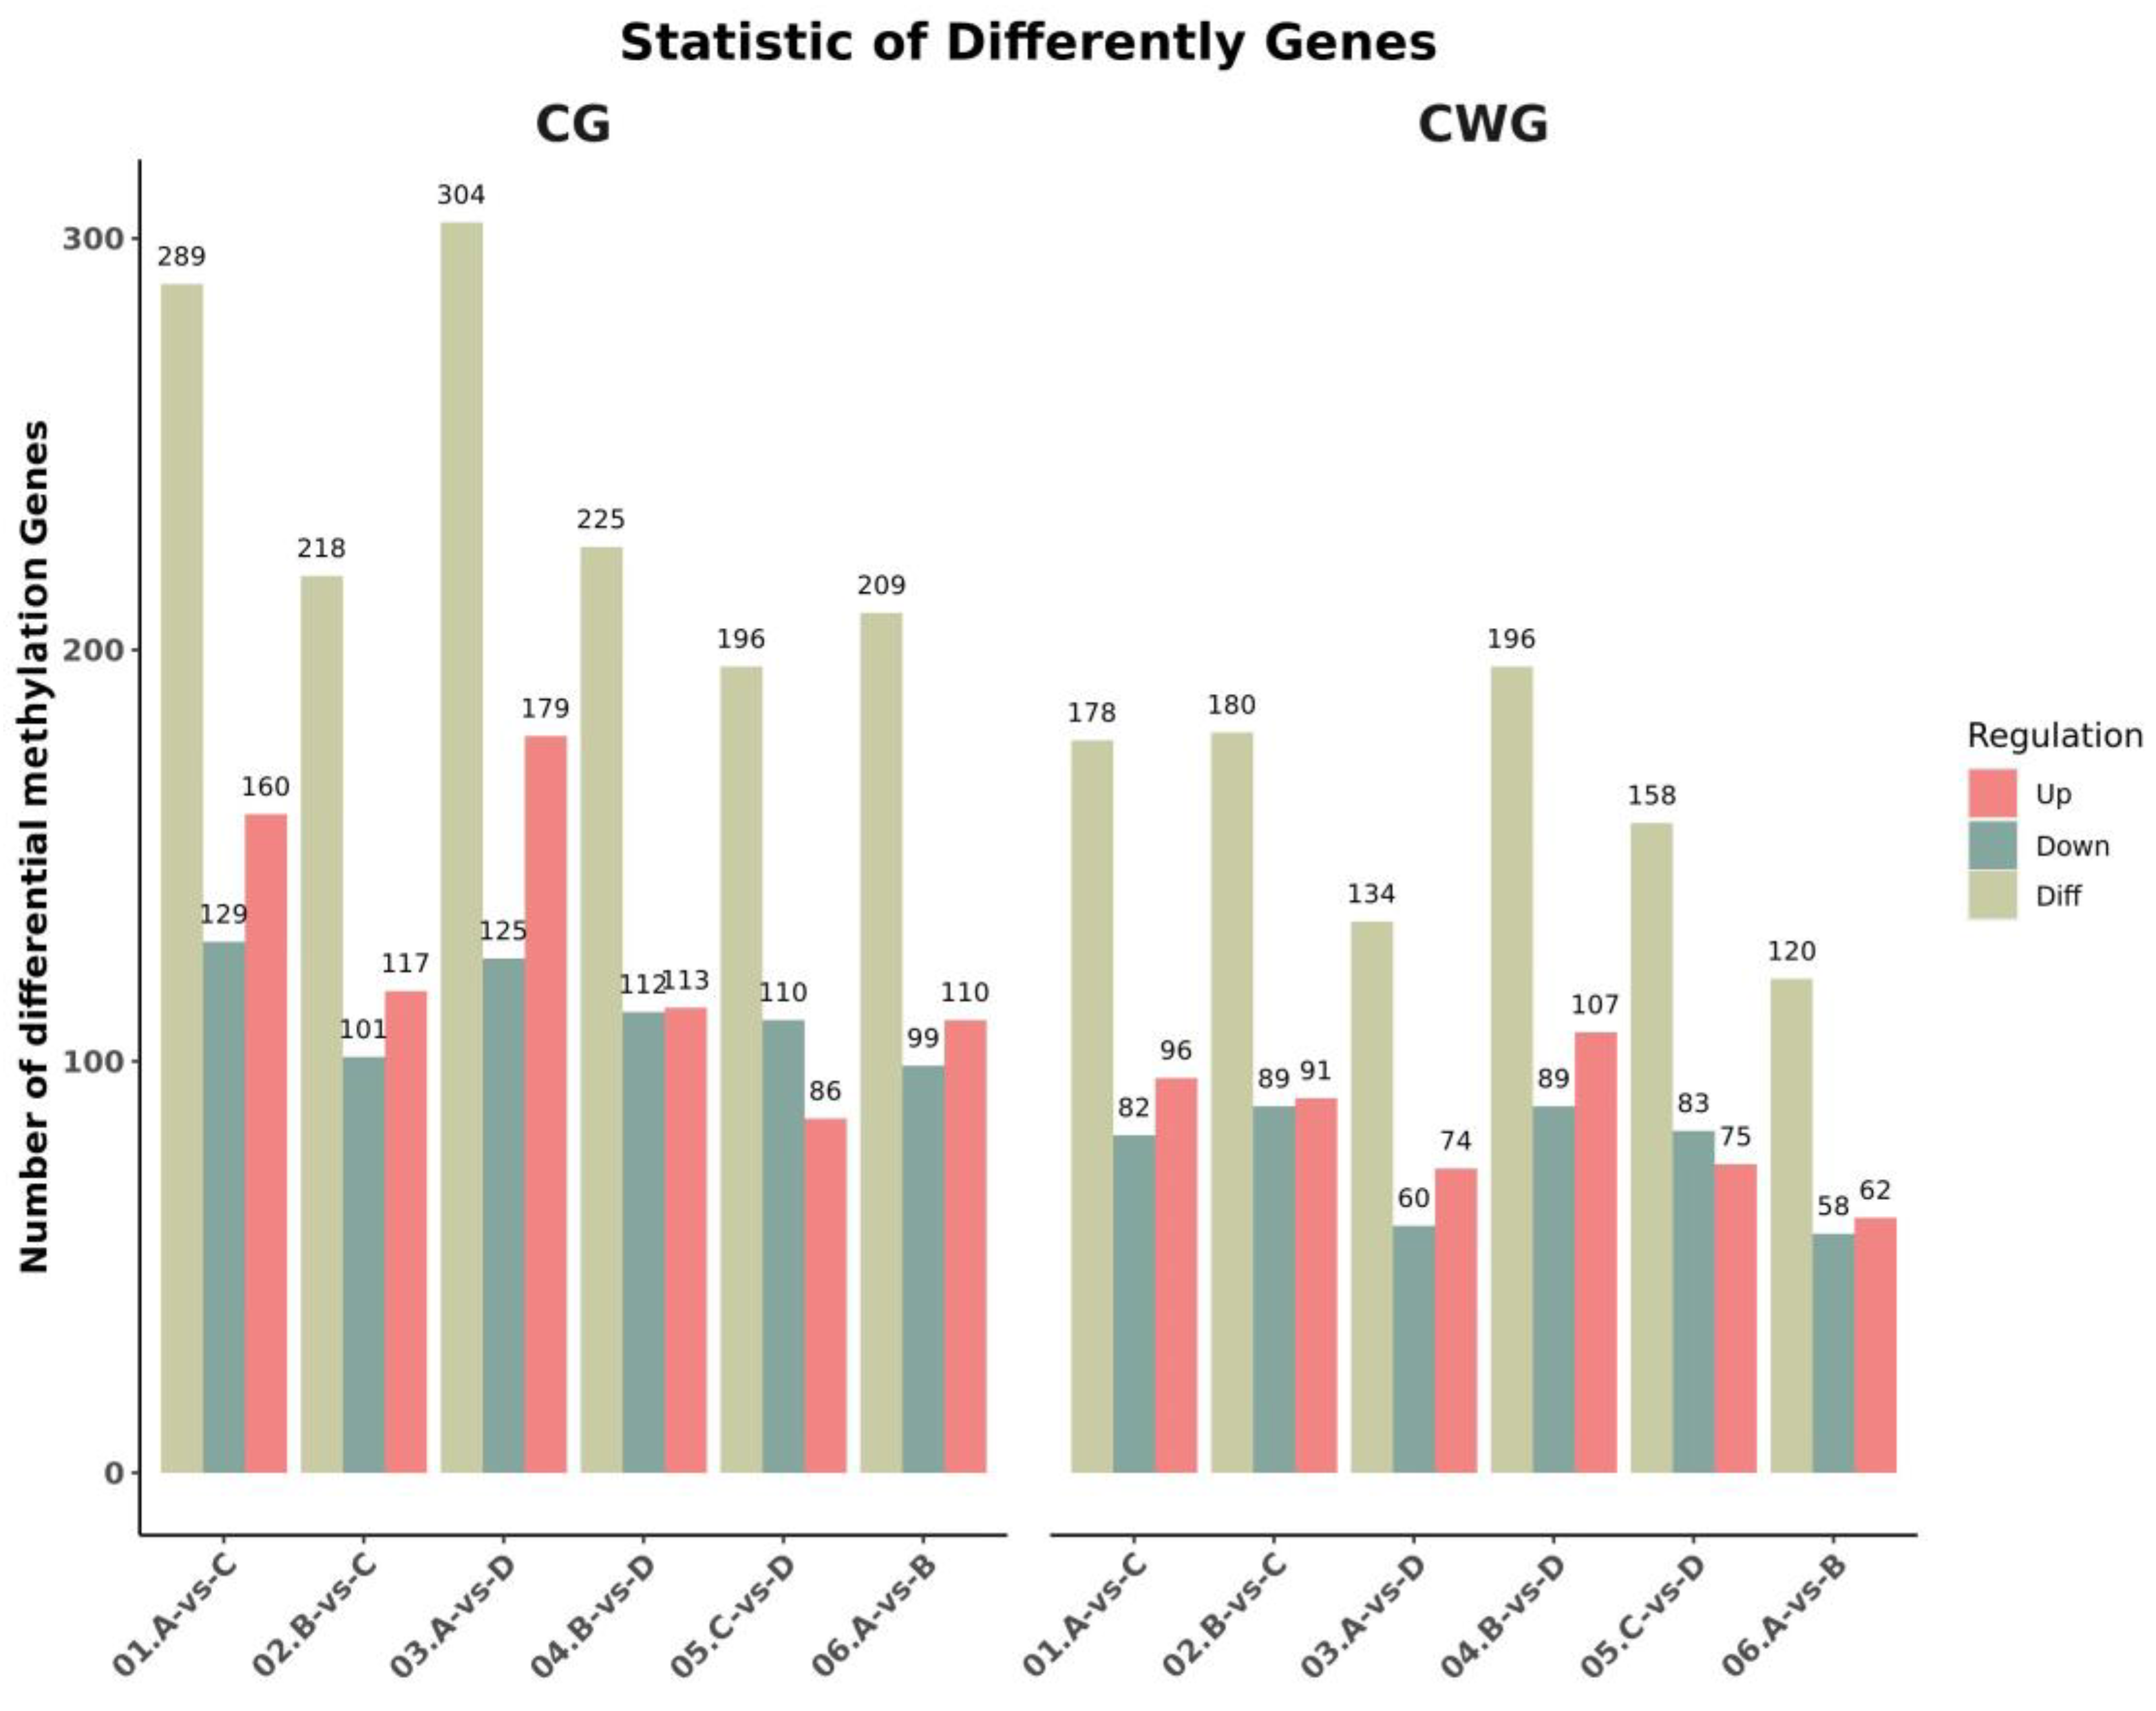
Table 7 for details. Identification and analysis of methylation sites of the enzyme-produced DNA fragments from the 12 tissue samples showed that the proportion of CCGG-type methylation sites was substantially higher than that of CCWGG-type methylation sites. The average numbers of CCGG methylation sites for the 3-, 2-, and 1-year- and 4-month-old.
A. japonicus were 70,357, 80,376, 79,065, and 82,131, respectively. The average numbers of CCWGG methylation sites for the 3-, 2-, and 1-year- and 4-month-old
A. japonicus were 7755, 11,379, 11,524, and 11,833, respectively (
Table 8).
3.3. GO Enrichment Analysis of Differentially Methylated Genes
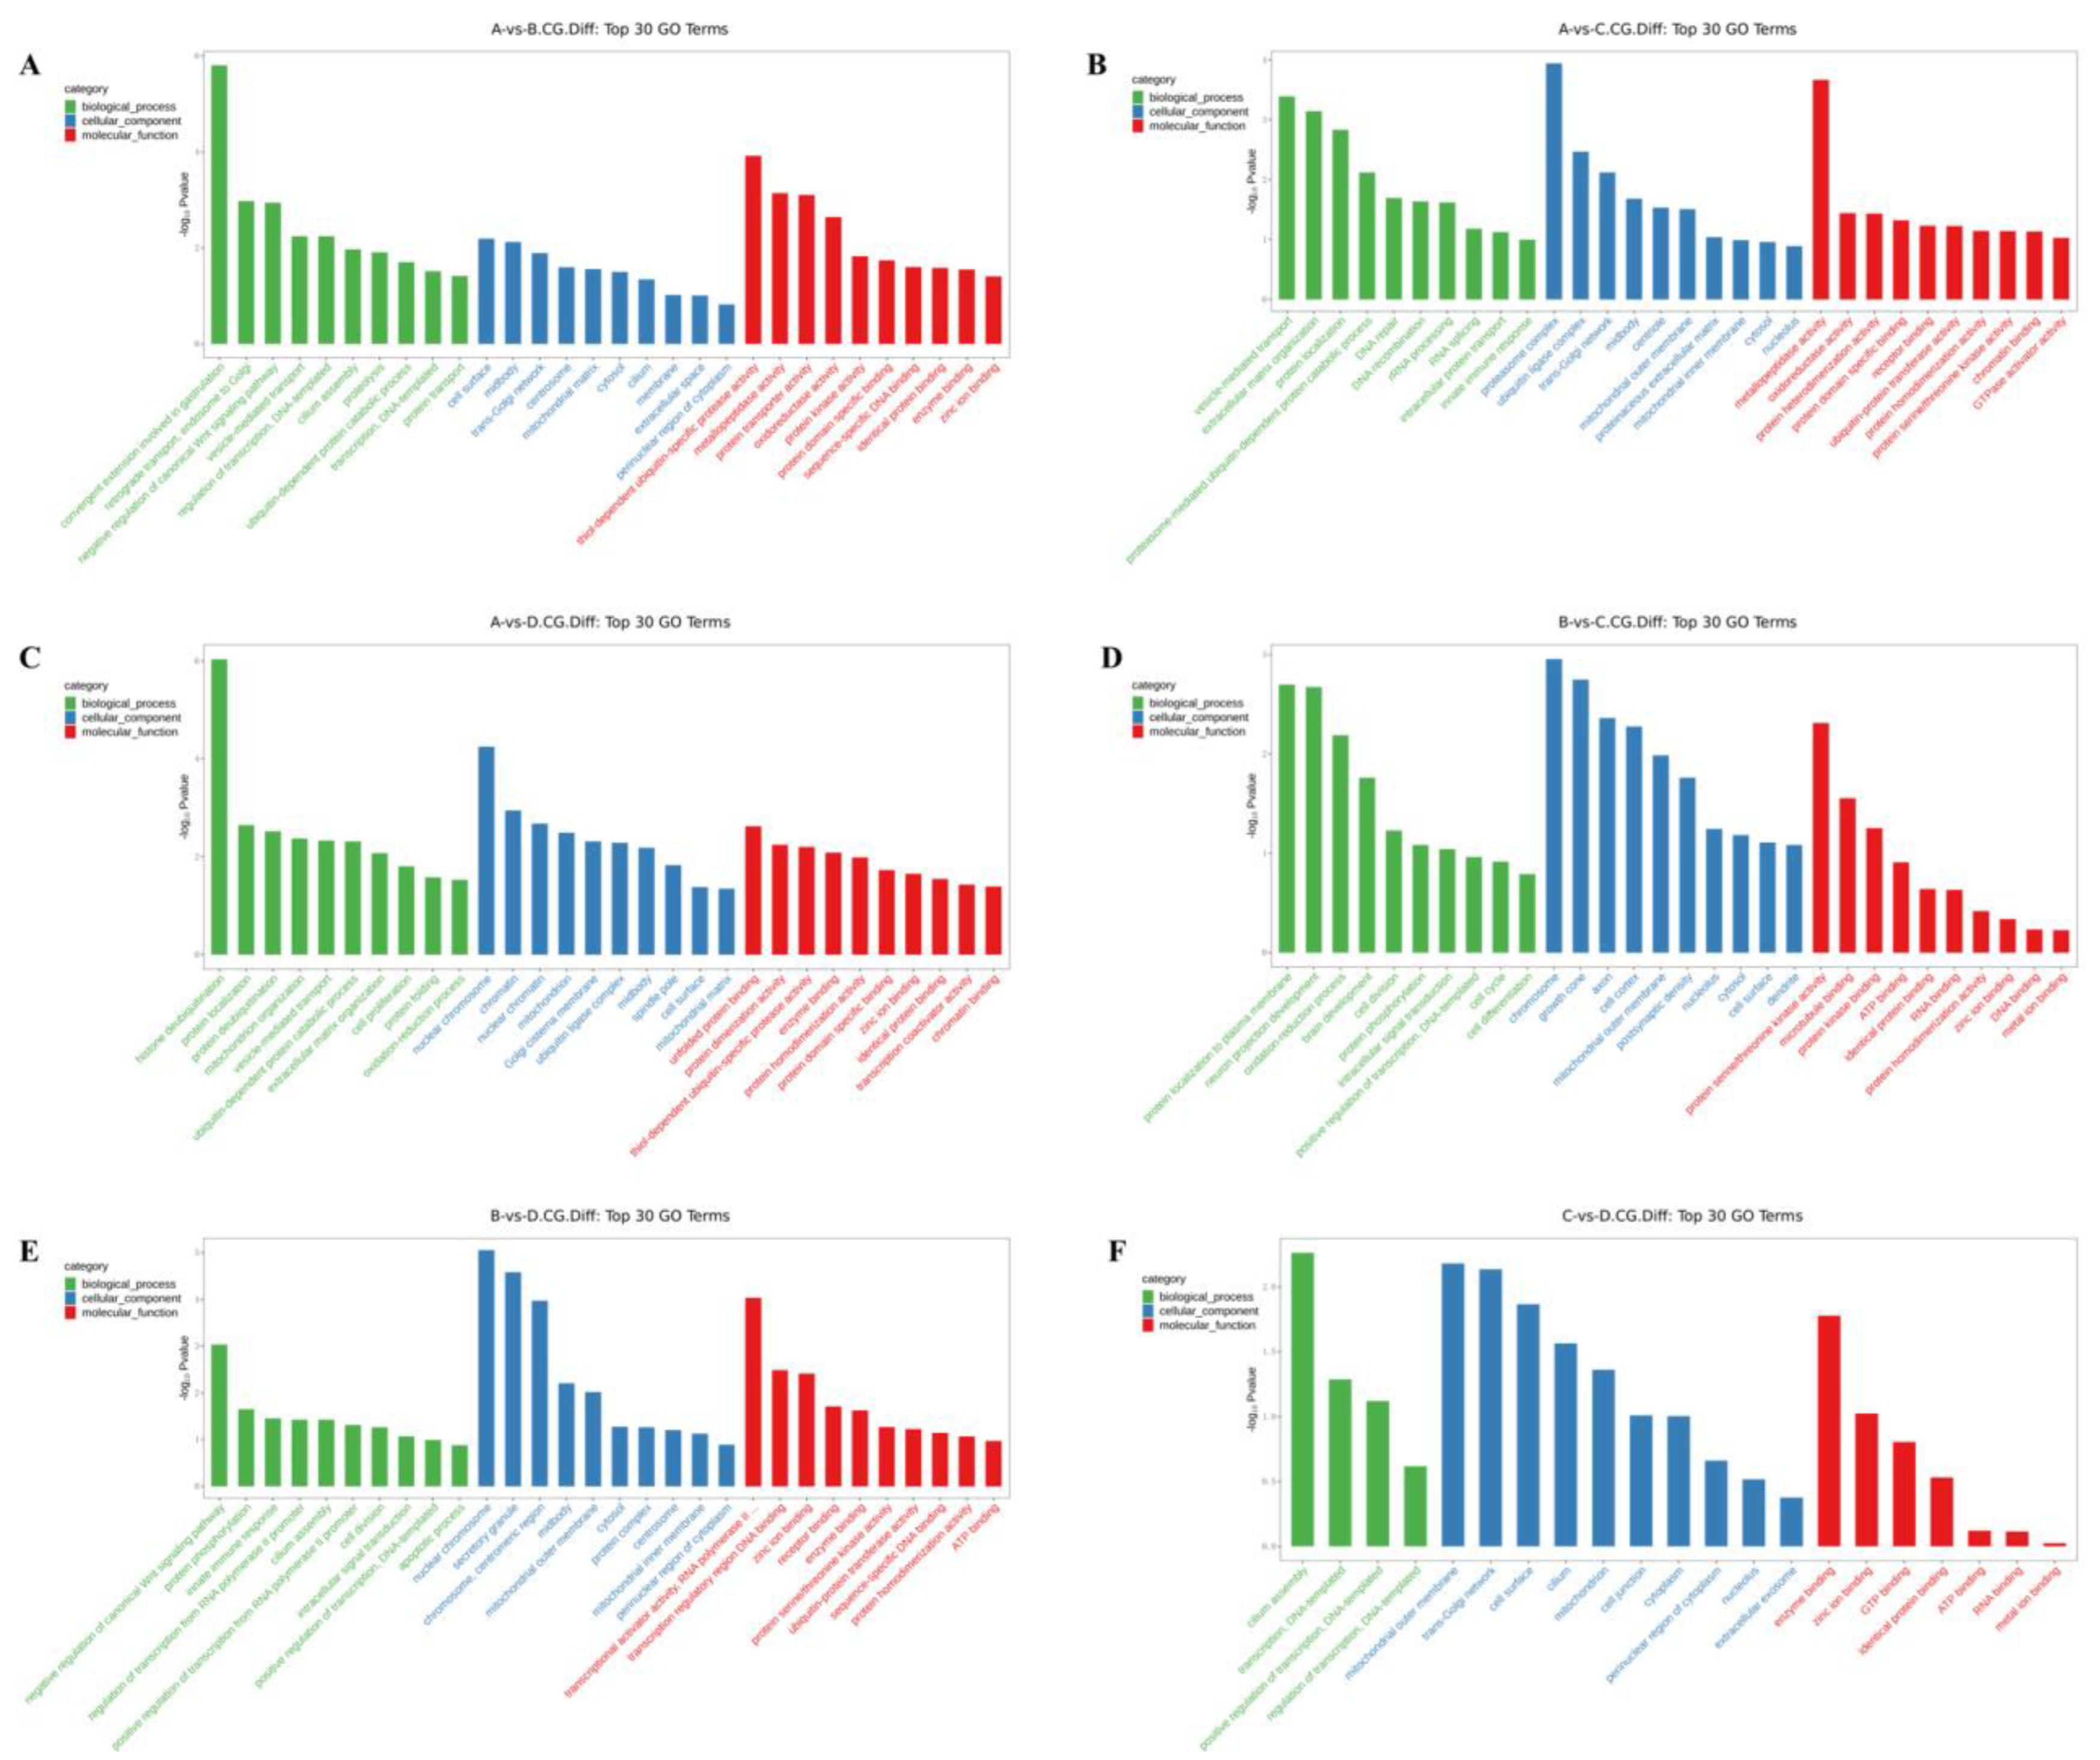
The differentially methylated genes identified in each of the comparisons were annotated with GO terms under three main categories, namely biological process (BP), cellular component (CC), and molecular function (MF). The top ten enriched terms under each of the categories are displayed as bar charts (
Figure 2 and
Figure 3).
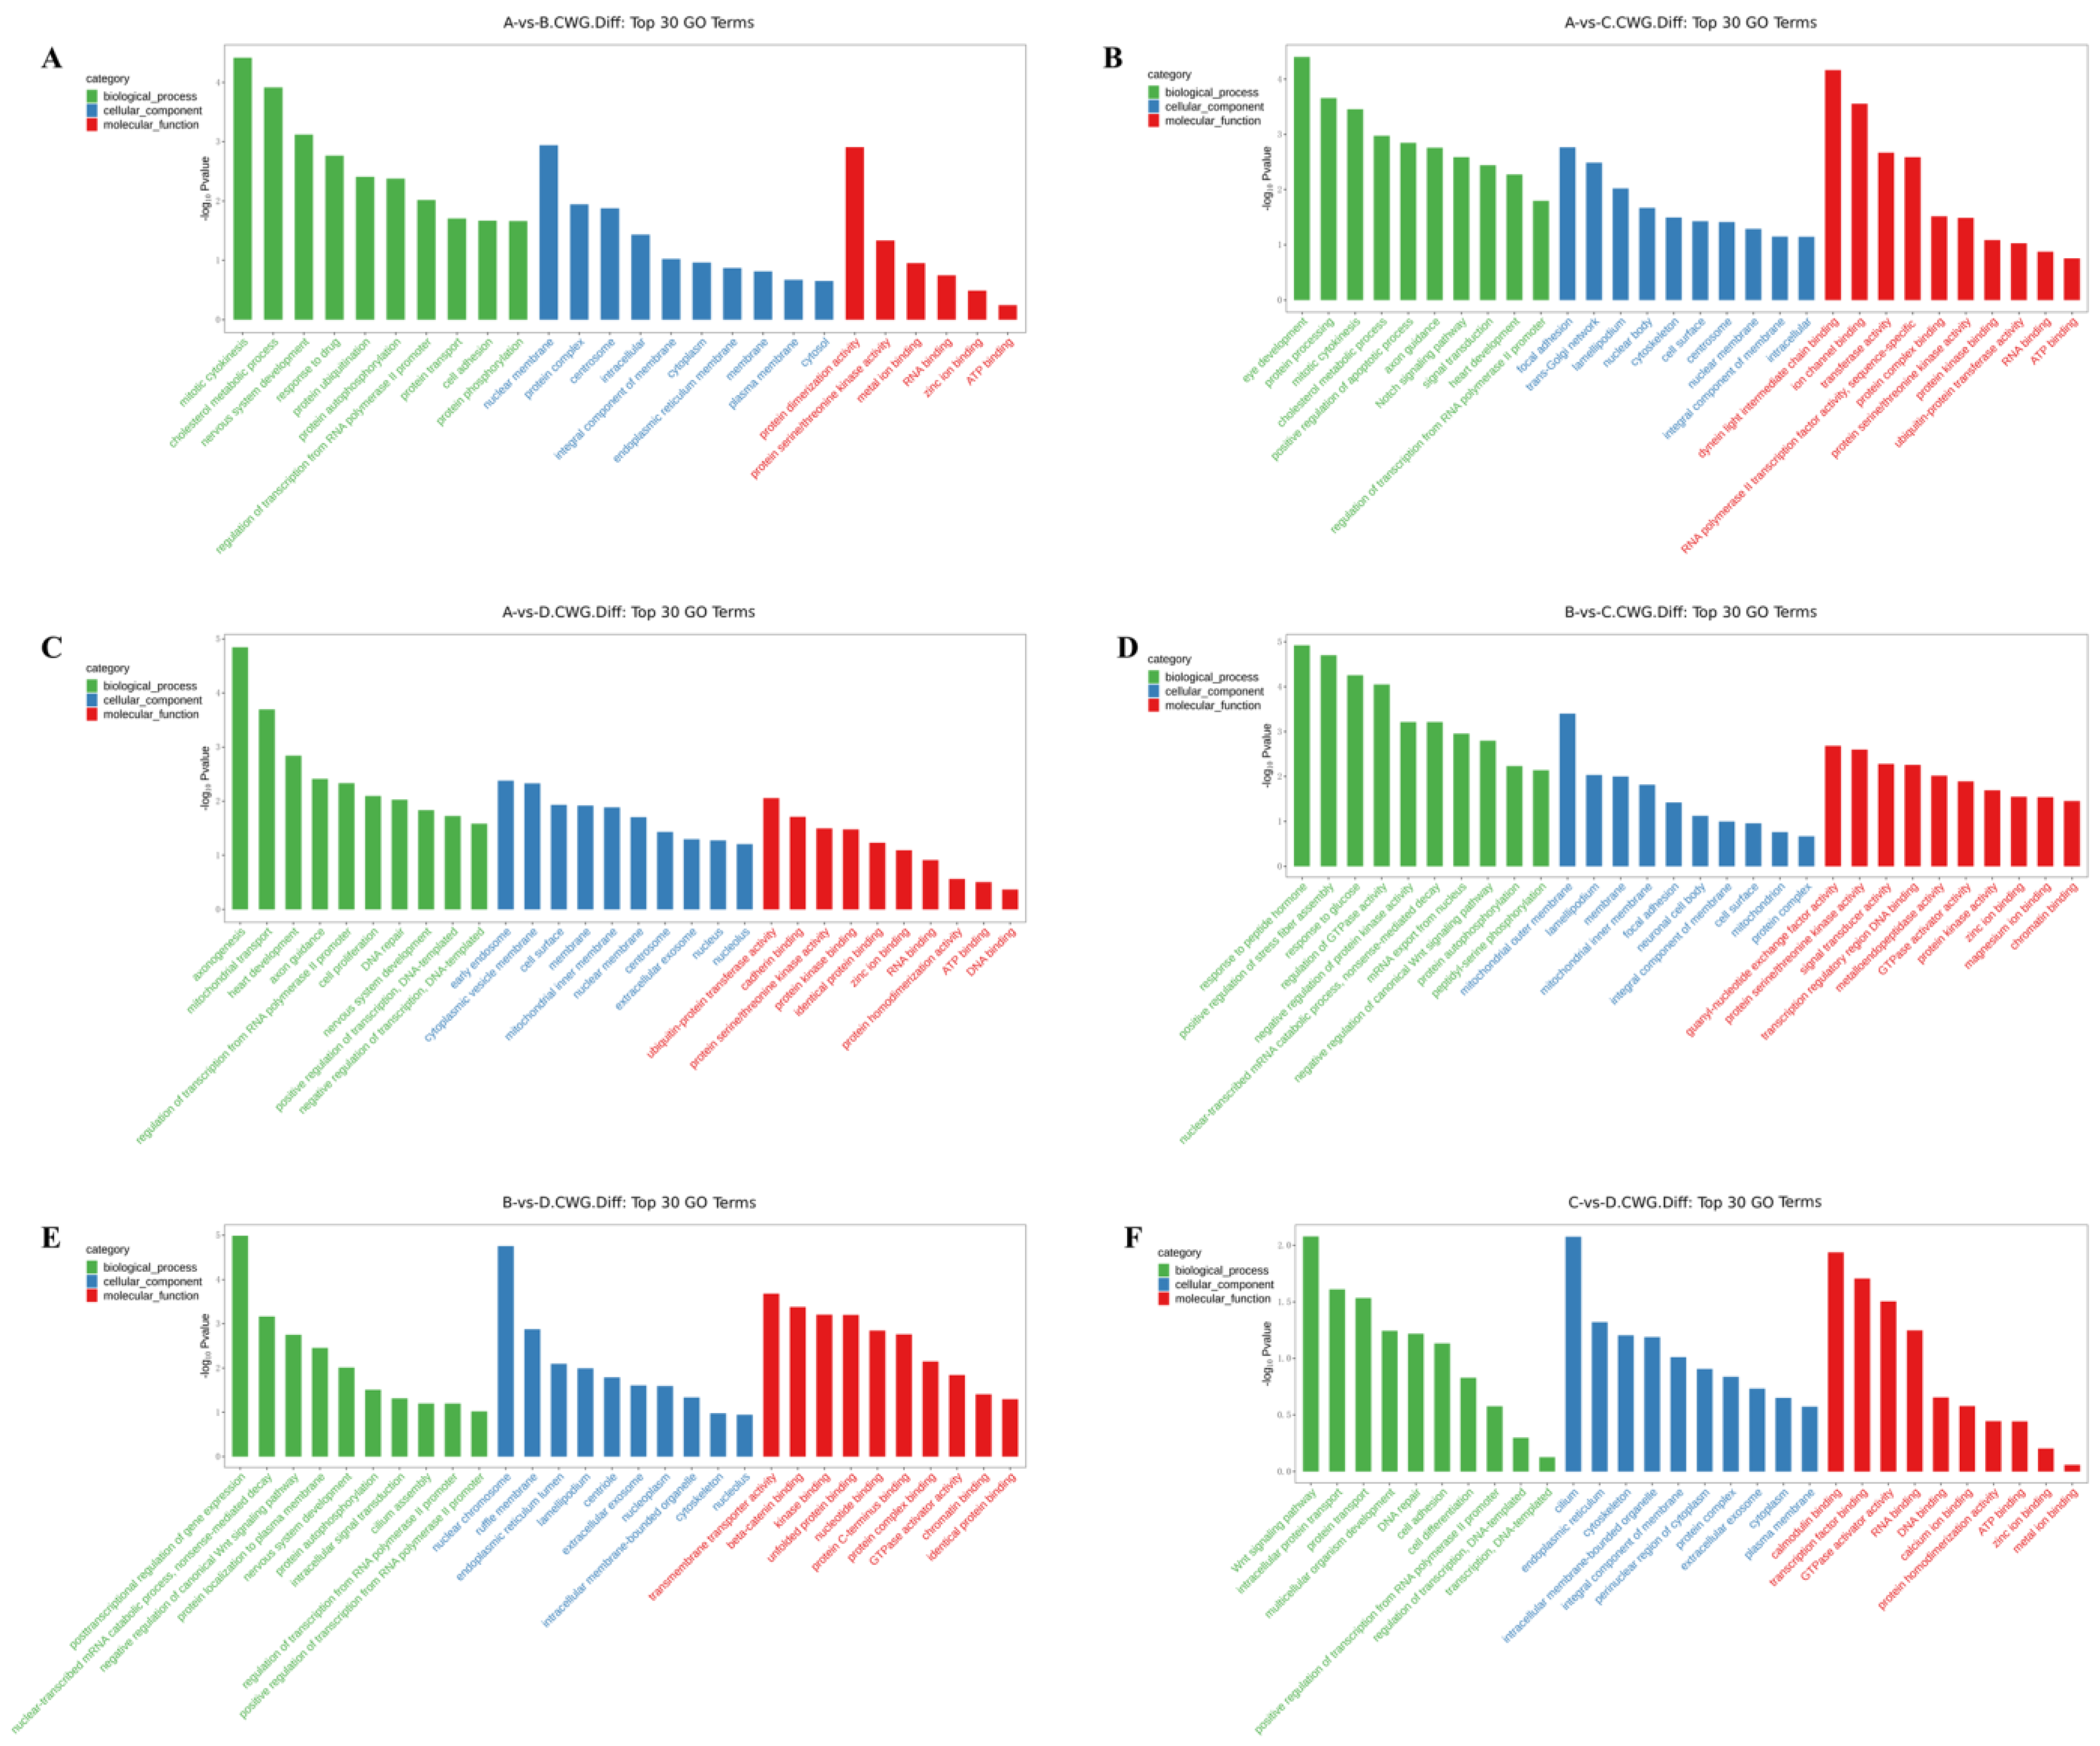
In the 3-year vs. 2-year comparison, the differentially methylated genes at CCGG sites were significantly enriched in the BP terms convergence extension and retrograde transport of gastrulation, endosome to Golgi, and negative regulation of typical Wnt signaling pathways; the CC terms cell surface, midsole, and trans-Golgi network; and the MF terms thiol-dependent ubiquitin-specific protease activity, metalloproteinase activity, and protein transporter activity. The differentially methylated genes at CCWGG sites were significantly enriched in the BP terms mitotic cell division, cholesterol metabolism, and nervous system development; the CC terms nuclear membranes, protein complexes, and centrosomes; and the MF terms protein dimerization activity, protein serine/threonine kinase activity, and metal ion binding. The results are shown in
Figure 2A and
Figure 3A.
In the 3-year vs. 1-year comparison, the differentially methylated genes at CCGG sites were significantly enriched in the BP terms vesicle-mediated transport, extracellular matrix organization, and protein localization; the CC terms proteasome complex, ubiquitin ligase complex, and trans-Golgi network; and the MF terms metalloproteinase activity, oxidoreductase activity, and protein heterodimerization activity. The differentially methylated genes at CCWGG sites were significantly enriched in the BP terms eye development, protein processing, and mitotic cell division; the CC terms adhesion, trans-Golgi network, and plate-like pods; and the MF terms dynein light intermediate chain binding, ion channel binding, and transferase activity. The results are shown in
Figure 2B and
Figure 3B.
In the 3-year vs. 4-month comparison, the differentially methylated genes at CCGG sites were significantly enriched in the BP terms histone deubiquitination, protein localization, and protein deubiquitination; the CC terms nuclear chromosomes, chromatin, and nuclear chromatin; and the MF terms unfolded protein binding, protein dimerization activity, and thiol-dependent ubiquitin-specific protease activity. The differentially methylated genes at CCWGG sites were significantly enriched in the BP terms axonogenesis, mitochondrial transport, and cardiac development; the CC terms early endosomes, cytoplasmic vesicle membranes, and cell surfaces; and the MF terms ubiquitin-protein transferase activity, cadherin binding, and protein serine/threonine kinase activity. The results are shown in
Figure 2C and
Figure 3C.
In the 2-year vs. 1-year comparison, the differentially methylated genes at CCGG sites were significantly enriched in the BP terms protein localization to plasma membrane, nerve cell projection development, and redox process; the CC terms chromosomes, growth cones, and axons; and the MF terms protein serine/threonine kinase activity, microtubule binding, and protein kinase binding. The differentially methylated genes at CCWGG sites were significantly enriched in the BP terms response to peptide hormones, forward regulation of stress fiber assembly, and response to glucose; the CC terms outer mitochondrial membrane, plate-shaped pods, and membranes; and the MF terms ornithine-nucleotide exchange factor activity, protein serine/threonine kinase activity, and signal sensor activity. The results are shown in
Figure 2D and
Figure 3D.
In the 2-year vs. 4-month comparison, the differentially methylated genes at CCGG sites were significantly enriched in the BP terms negative regulation of typical Wnt signaling pathways, protein phosphorylation, and innate immune response; the CC terms nuclear chromosomes, secretory granules, chromosomes, and centromere regions; and the MF terms transcriptional activation activity, RNA polymerase II, transcriptional regulatory region sequence-specific DNA binding, transcription regulatory region DNA junction, and zinc ion binding. The differentially methylated genes at CCWGG sites were significantly enriched in the BP terms post-transcriptional regulation of gene expression, nuclear transcription mRNA catabolism, senseless-mediated decay, and negative regulation of the typical Wnt signaling pathway; the CC terms nuclear chromosomes, ruffle membranes, and endoplasmic reticulum cavity; and the MF terms transmembrane transporter activity, β-catenin binding, and kinase binding. The results are shown in
Figure 2E and
Figure 3E.
In the 1-year vs. 4-month comparison, the differentially methylated genes at CCGG sites were significantly enriched in the BP terms cilia components, transcription, DNA templating, forward regulation of transcription, and DNA templating; the CC terms mitochondrial outer membrane, trans-Golgi network, and cell surface; and the MF terms enzyme binding, zinc ion binding, and GTP binding. The differentially methylated genes at CCWGG sites were significantly enriched in the BP terms ciliary components, transcription, DNA templating, forward regulation of transcription, and DNA templating; the CC terms cilia, endoplasmic reticulum, and cytoskeleton; and the MF terms calmodulin binding, transcription factor binding, and GTPase activator activity.
These results show that differentially methylated genes were involved in various essential biological processes, including negative regulation of the typical Wnt signaling pathway, protein localization, and mitotic cell division, as well as with various cellular components, including the trans-Golgi network, centrosome, nuclear chromosome, mitochondrial outer membrane, cell surface, and plate viburnum. The differentially methylated genes were also involved in multiple molecular functions, including thiol-dependent ubiquitin-specific protease activity, metalloprotease activity, protein dimerization activity, protein serine/threonine kinase activity, and zinc ion binding. The results are shown in
Figure 2F and
Figure 3F.
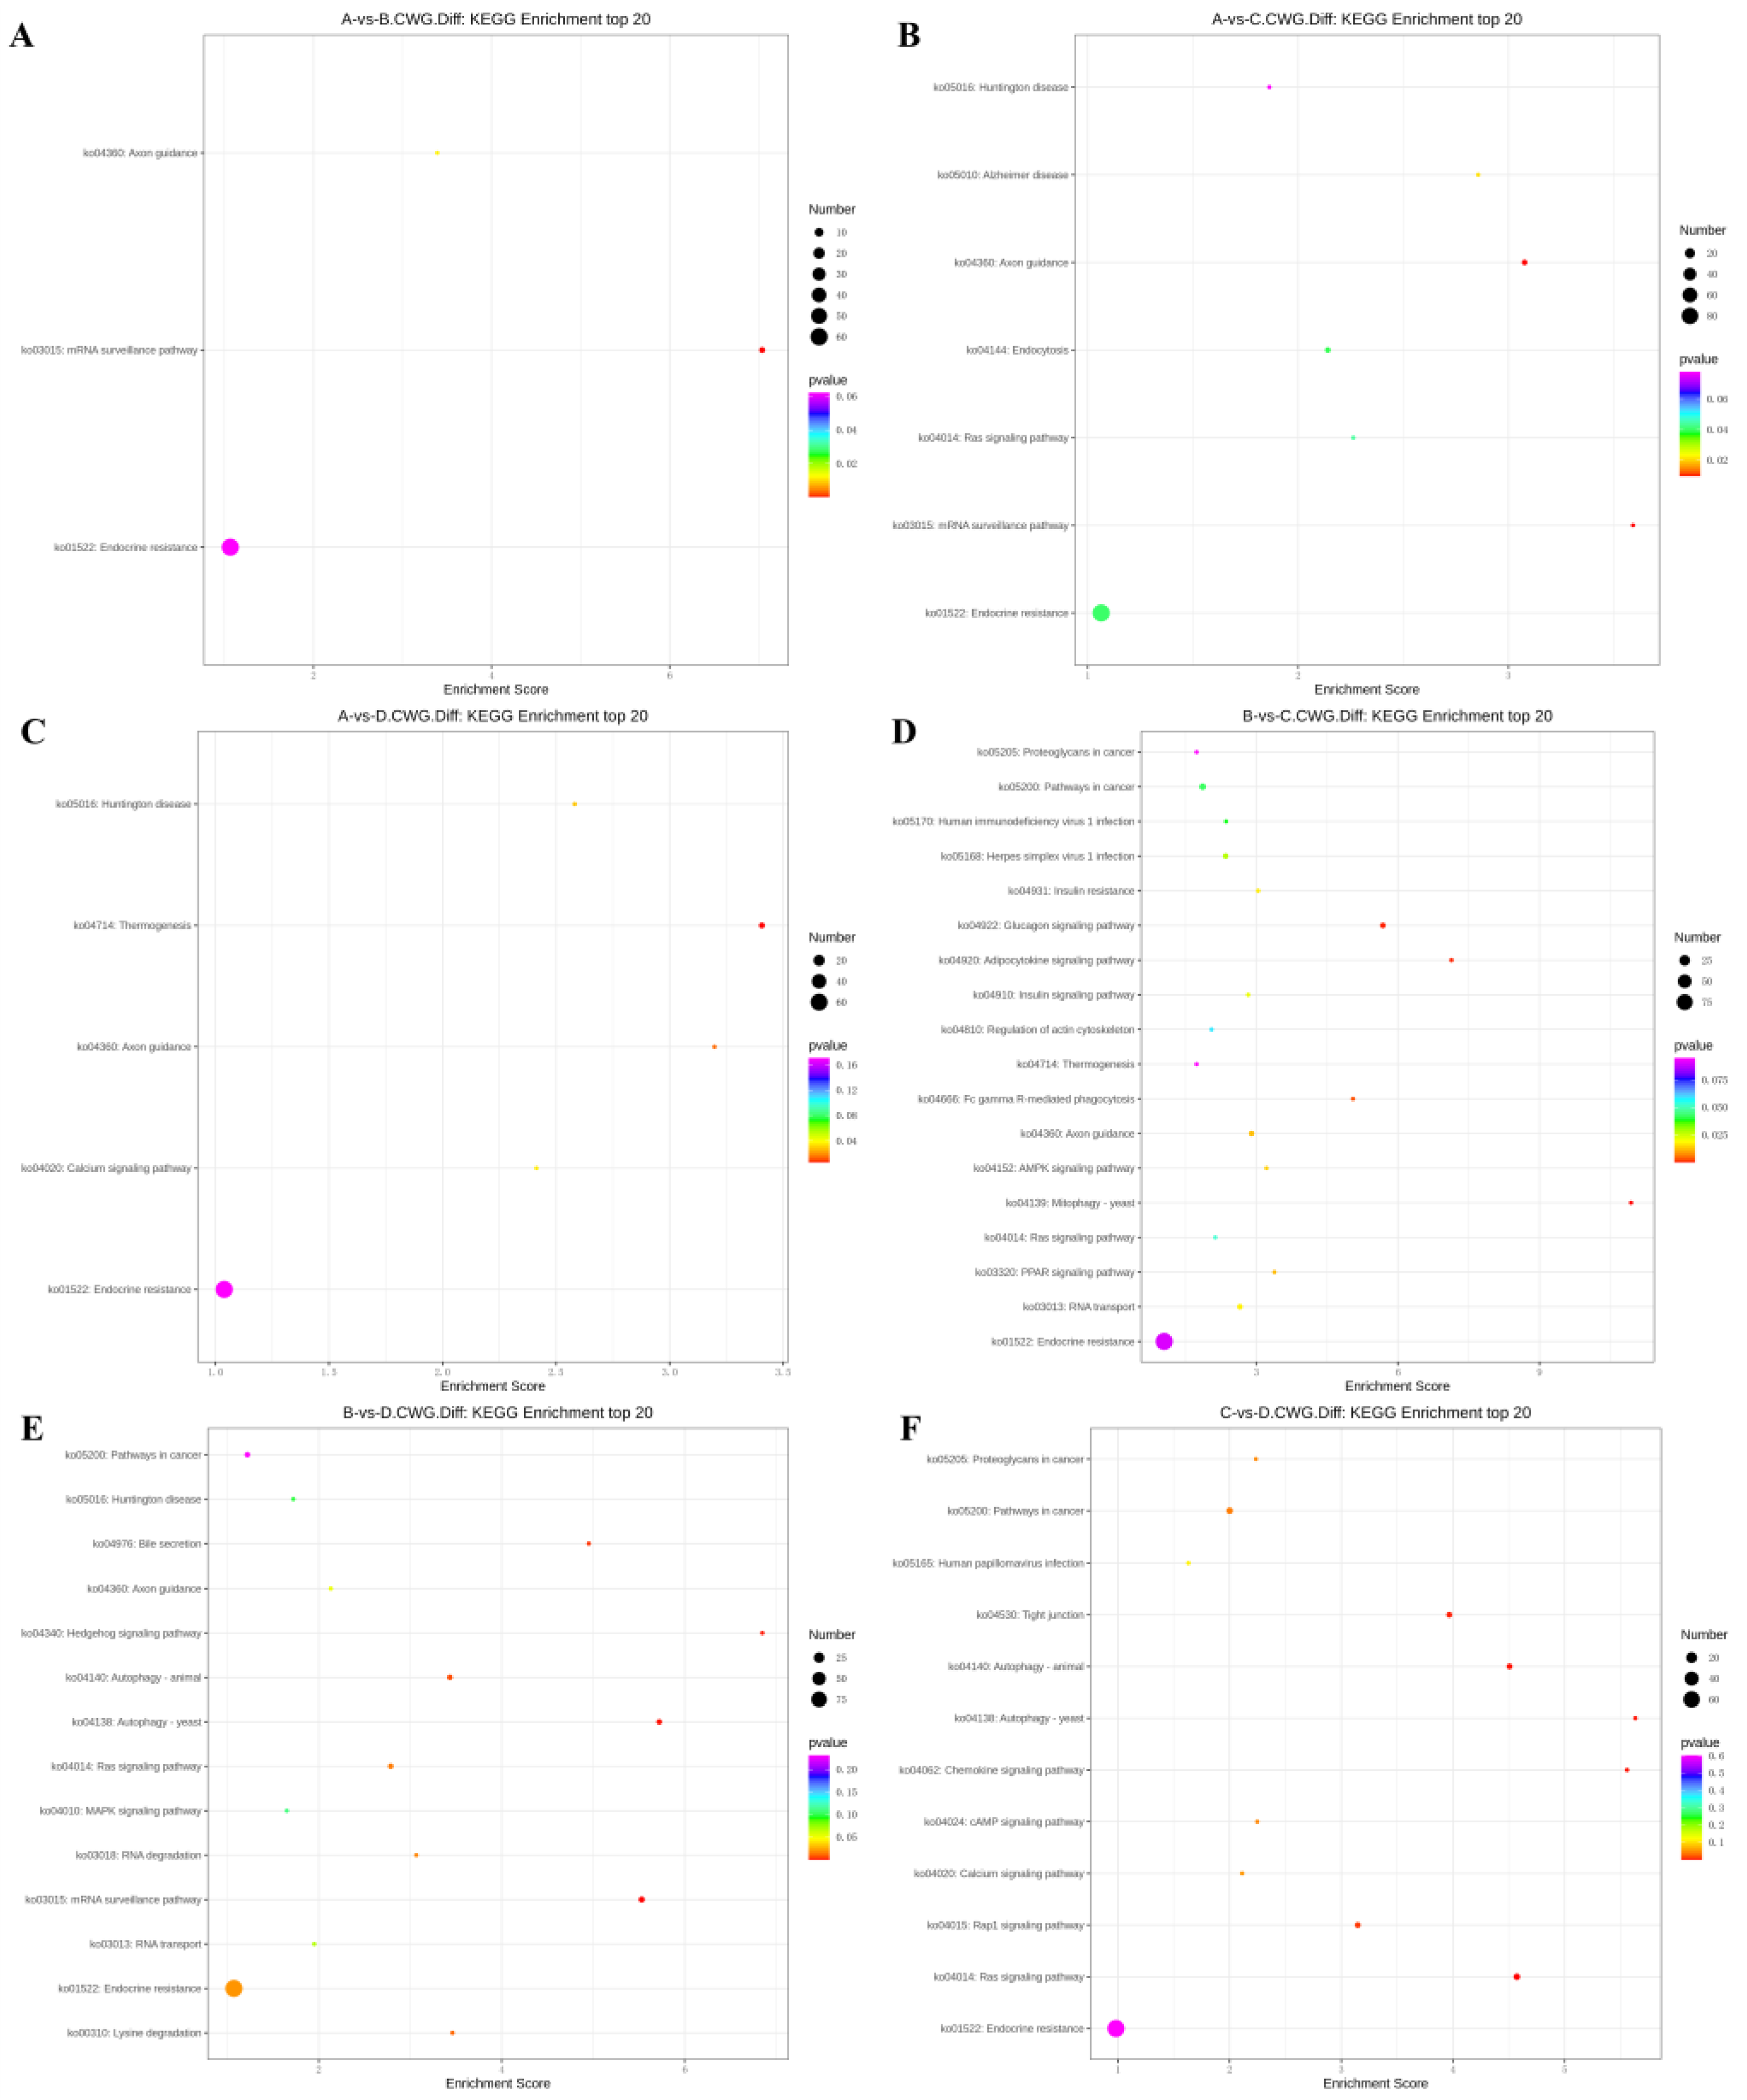
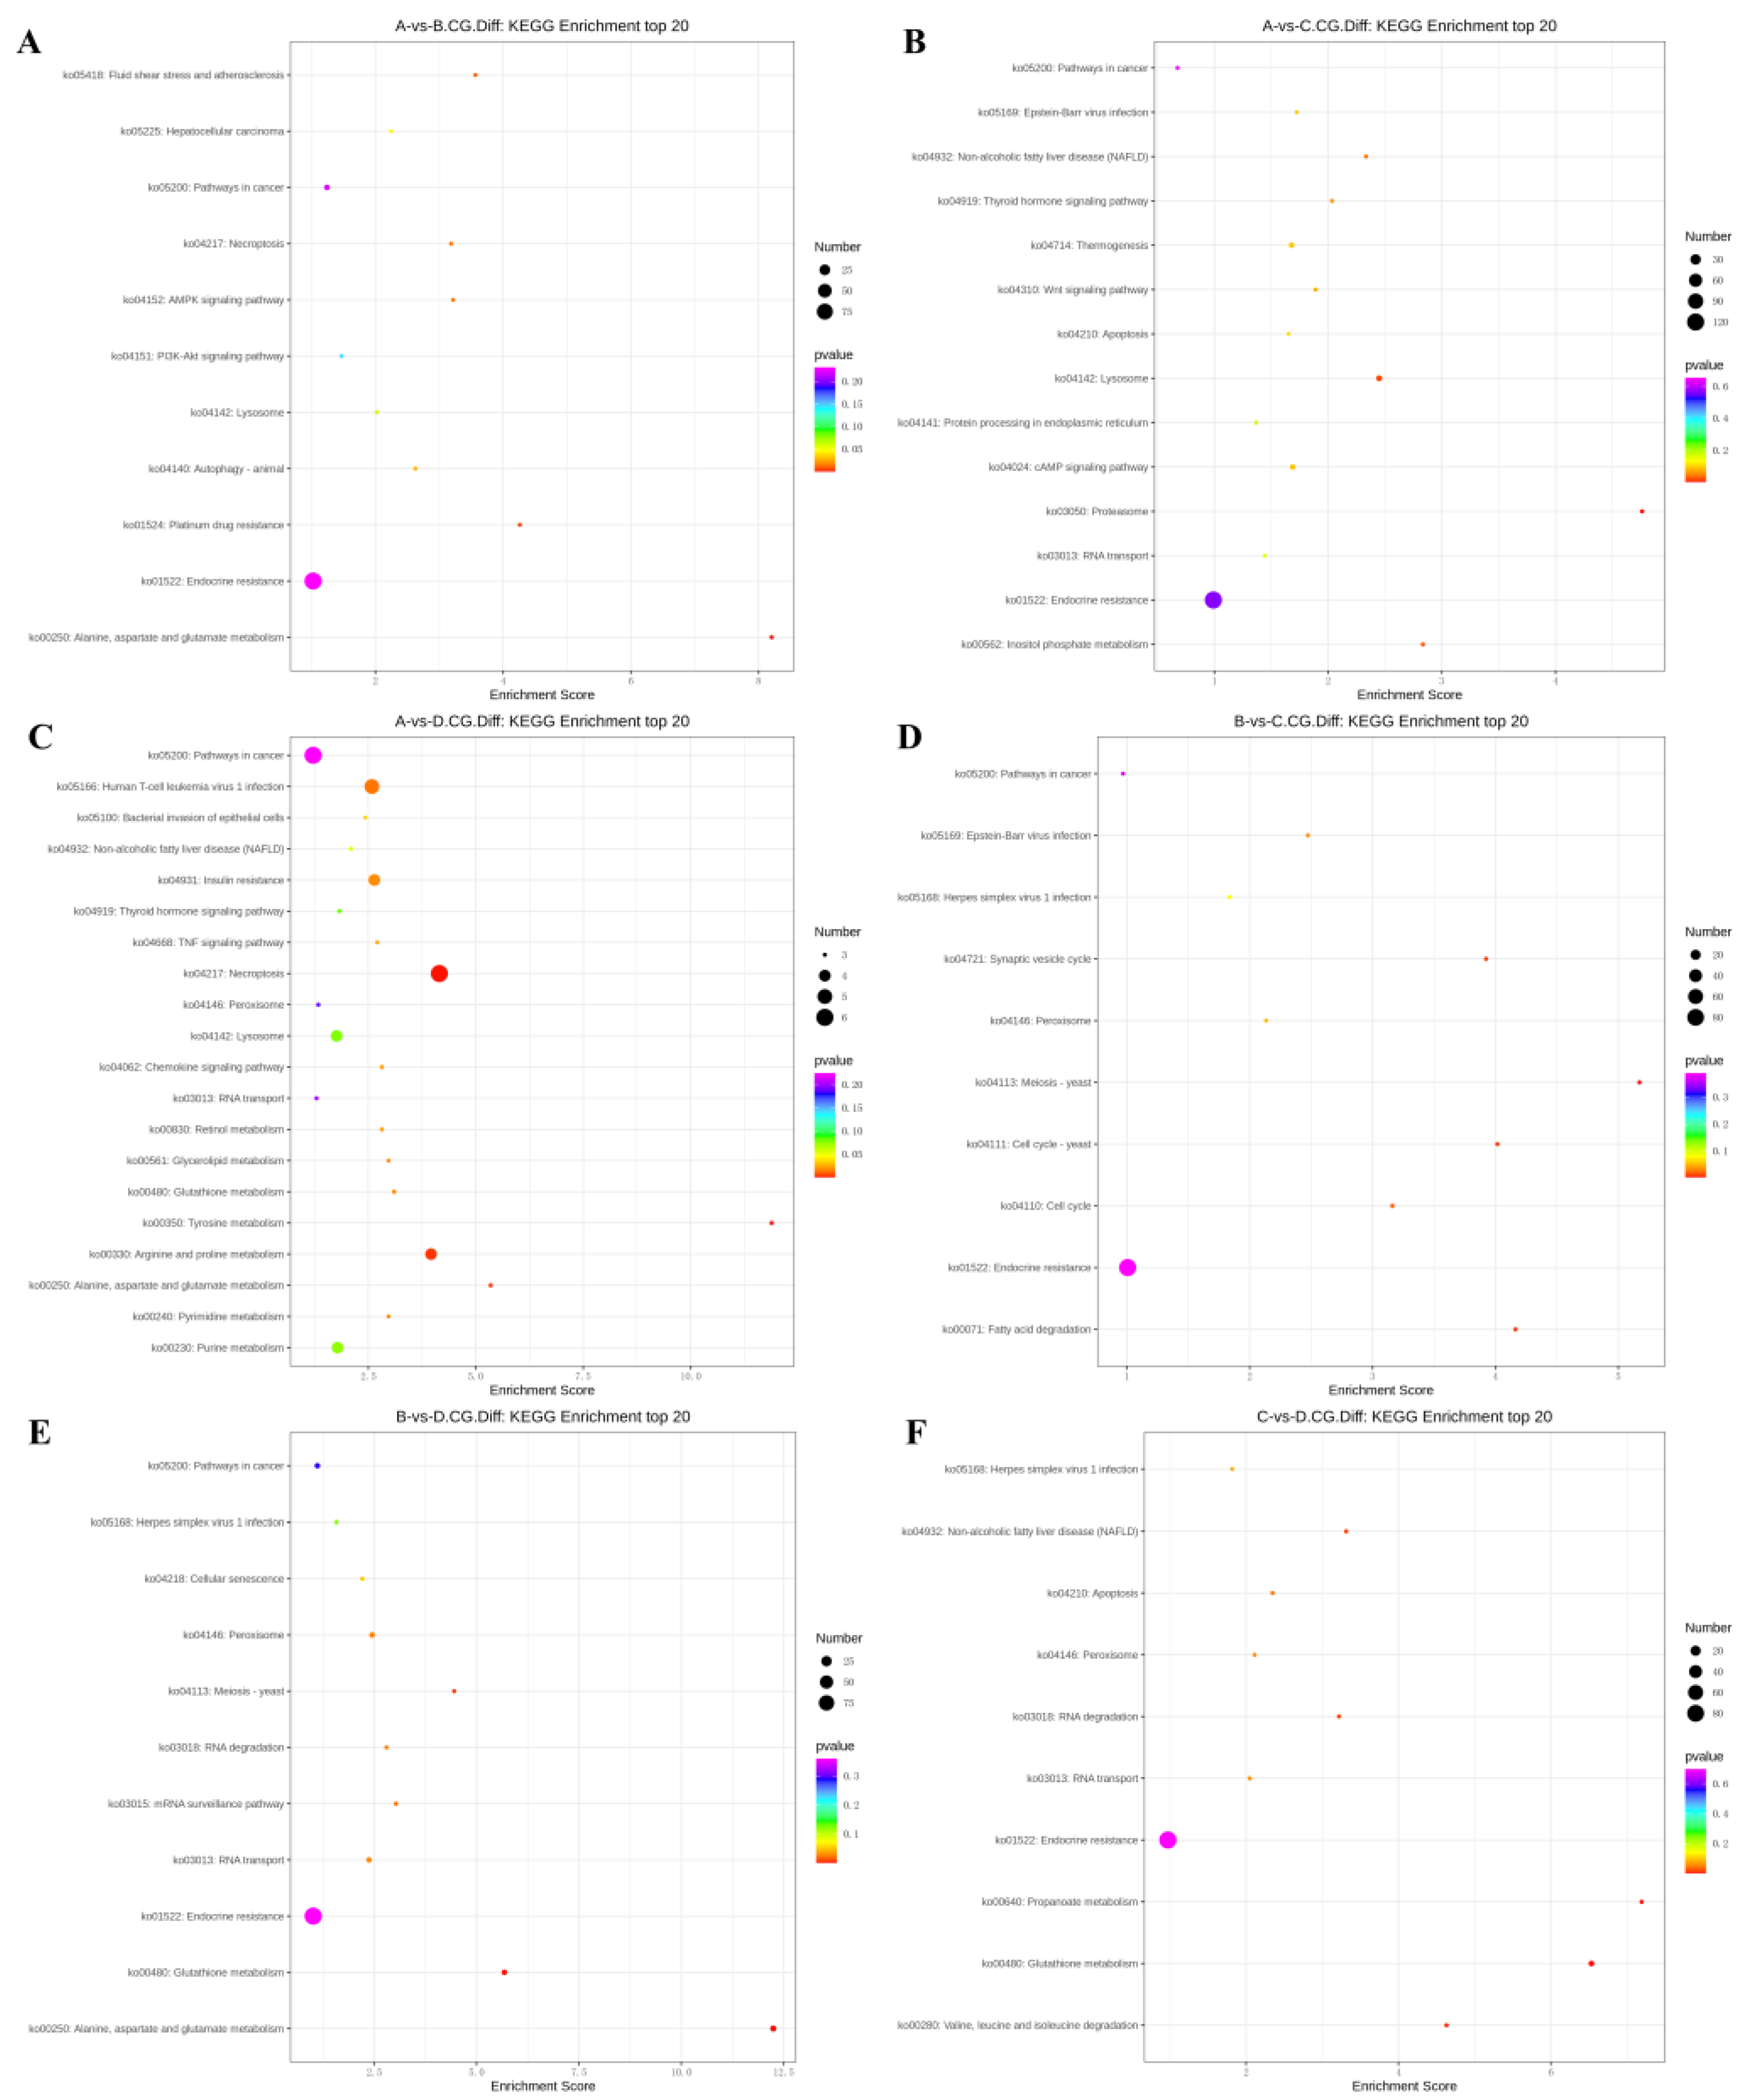
3.4. KEGG Enrichment Analysis of Differentially Methylated Genes
The differentially methylated genes identified in each of the comparisons were annotated with KEGG pathways.
In the 3-year vs. 2-year comparison, the differentially methylated genes at CCGG sites were significantly enriched in alanine, aspartate, and glutamic acid metabolism, platinum resistance, fluid shear stress, and atherosclerosis; up-regulated genes were significantly enriched in alanine, aspartate, and glutamic acid metabolism and endocrine resistance pathways, whereas down-regulated genes were significantly enriched in the AMPK signaling pathway, liver cancer, and endocrine resistance. In the alanine, aspartate, and glutamic acid metabolic pathway, aspartate aminotransferase and δ-1-pyrroline-5-carboxylate dehydrogenase were up-regulated. The differentially methylated genes at CCWGG sites were significantly enriched in mRNA monitoring, axon guidance, and endocrine resistance; up-regulated genes were significantly enriched in the mRNA monitoring pathway and endocrine resistance, whereas down-regulated genes were significantly enriched in endocrine resistance pathways (
Figure 3). In the mRNA monitoring pathway,
FIP1,
SYMPK, and
smg1 were up-regulated, and
smg6 was down-regulated. In the axon guidance pathway, the Ras GTPase activating protein gene
rasgap and
limk were down-regulated, and slit guidance ligand
slit1 was up-regulated. The results are shown in
Figure 4A and
Figure 5A.
In the 3-year vs. 1-year comparison, the differentially methylated genes at CCGG sites were significantly enriched in proteasome, lysosome, and inositol phosphate metabolism; up-regulated genes were significantly enriched in lysosome, thermogenesis, and endocrine resistance, whereas down-regulated genes were significantly enriched in inositol phosphate metabolism and endocrine resistance. In the lysosomal pathway, histone,
SGSH, and
GNPT were up-regulated, and
MPR and
AP.4 were down-regulated. In the inositol phosphate metabolism pathway, phosphatidylinositol 4,5-diphosphate 3-kinase catalyzes the down-regulation of subunit β isoform and inositol-3-phosphate synthase 1-A. The differentially methylated genes at CCWGG sites were significantly enriched in axon guidance, mRNA monitoring, and Alzheimer’s disease; up-regulated genes were significantly enriched in mRNA monitoring pathways and endocrine resistance, whereas down-regulated genes were significantly enriched in Alzheimer’s disease, endocytosis, and endocrine resistance. In the mRNA monitoring pathway,
FIP1,
SYMPK, and
smg1 were up-regulated. In the axon guidance pathway,
rasgap and integrin-linked kinase
ILK were down-regulated, and
slit1 and
slit2 were up-regulated. In the Alzheimer’s disease pathway,
ncstn,
aphl-1, and
cxv were down-regulated. In the endocrine resistance pathway,
ILK was down-regulated. The results are shown in
Figure 4B and
Figure 5B.
In the 3-year vs. 4-month comparison, the differentially methylated genes at CCGG sites were significantly enriched in tyrosine metabolism, necrotizing apoptosis, and alanine, aspartic acid, and glutamic acid metabolism; up-regulated genes were significantly enriched in necrotizing apoptosis, alanine, aspartic acid, and glutamic acid metabolism, and human T-cell leukemia virus 1 infection, whereas down-regulated genes were significantly enriched in glutathione metabolism, non-alcoholic fatty liver disease, and purine metabolism. In the alanine, aspartic acid, and glutamic acid metabolism pathway, the genes encoding aspartate aminotransferase, succinate semialdehyde dehydrogenase, and amide phosphate ribosyltransferase were up-regulated. In the necrotizing apoptosis pathway,
ANT,
PYGL, heat shock protein
Hsp90,
DRP1, and
ESCRT-III were up-regulated, and the histone
H2AX was down-regulated. In the glutathione metabolic pathway, the aminopeptidase N (
pepn) and the isocitrate dehydrogenase genes were down-regulated. The differentially methylated genes at CCWGG sites were significantly enriched in thermogenesis, axon guidance, and Huntington’s disease. The most enriched pathway was the secretory resistance pathway with a total of 62 differentially methylated genes; among them, up-regulated genes were significantly enriched in endocrine resistance pathways, and down-regulated genes were significantly enriched in endocrine resistance pathways. In the endocrine resistance pathway, the protein kinase gene
Pka was down-regulated. In the axonal guidance pathway,
RGS3 and
ROBO1 were down-regulated and
slit1 was up-regulated. The results are shown in
Figure 4C and
Figure 5C.
In the 2-year vs. 1-year comparison, the differentially methylated genes at CCGG sites were significantly enriched in meiosis—yeast, fatty acid degradation, and cell cycle—yeast; up-regulated genes were significantly enriched in Epstein–Barr virus infection, peroxisome, and endocrine resistance, whereas down-regulated genes were significantly enriched in meiosis—yeast, cell cycle, and endocrine resistance. In the meiosis—yeast pathway,
GLC7,
IN1, and cell division control
CDC6 were down-regulated. The differentially methylated genes at CCWGG sites were significantly enriched in mitochondrial autophagy—yeast, the glucagon signaling pathway, and the adipocytokine signaling pathway. The most enriched pathway was the endocrine resistance pathway with a total of 92 differentially methylated genes; among them, up-regulated genes were significantly enriched in the glucagon signaling pathway, axon guidance, and cancer pathways, whereas down-regulated genes were significantly enriched in endocrine resistance and cancer pathways. In the axon guidance pathway,
limk and
ptch1 were up-regulated. In the endocrine resistance pathway, the mechanistic target of rapamycin kinase gene
mtor and
ILK was down-regulated. In the glucagon signaling pathway,
sik2,
cpt1, and
phk were up-regulated, and
gys was down-regulated. The results are shown in
Figure 4D and
Figure 5D.
In the 2-year vs. 4-month comparison, the differentially methylated genes at CCGG sites were significantly enriched in alanine, aspartate, and glutamic acid metabolism, glutathione metabolism, and meiosis—yeast; up-regulated genes were significantly enriched in alanine, and endocrine resistance, whereas down-regulated genes were significantly enriched in glutathione metabolism, meiosis—yeast, and ribonucleic acid transport. In alanine, aspartate, and glutamic acid metabolic pathways, the genes encoding aspartame synthase and hypothetical protein BSL78_23121 were down-regulated, and the genes encoding isoaspartic acid peptidase/L-asparaginase-like, succinate semialdehyde dehydrogenase, and 4-aminobutyrate aminotransferase were up-regulated.
Pepn and the isocitrate dehydrogenase gene were down-regulated in the glutathione metabolic pathway.
GLC7,
IN1, and
CDC6 were down-regulated in the meiosis—yeast pathway. The differentially methylated genes at CCWGG sites were significantly enriched in mRNA monitoring pathways, autophagy—yeast, and hedgehog signaling pathways. The most enriched pathway was the endocrine resistance pathway with a total of 96 differentially methylated genes; among them, up-regulated genes were significantly enriched in RNA degradation, axon guidance, and Ras signaling pathways, whereas down-regulated genes were significantly enriched in autophagy—yeast, autophagy—animal, and mRNA monitoring pathways. In the mRNA monitoring pathway,
CPSF6/7 and
SYMPK were down-regulated, and
smg1 and
smg6 were up-regulated. In the axonal guidance pathway, Ras GTPase activating protein
rasgap,
limk, and
ptch1 were up-regulated. In the autophagy—yeast pathway,
Pka, and the autophagy-related genes
atg2 and
atg3 were down-regulated, and
e1f2α was up-regulated. In the Ras signaling pathway,
rasgap,
rlip76, and
ra1bp1 were up-regulated. In the autophagy—animal pathway,
atg2,
Pka,
atg3, and
e1f2α were down-regulated. The results are shown in
Figure 4E and
Figure 5E.
In the 1-year vs. 4-month comparison, the differentially methylated genes at CCGG sites were significantly enriched in glutathione metabolism, propionic acid metabolism, and valine, leucine, and isoleucine degradation; up-regulated genes were significantly enriched in propionic acid metabolism and endocrine resistance, whereas down-regulated genes were significantly enriched in glutathione metabolism, apoptosis, and herpes simplex virus 1 infection. In the glutathione metabolism pathway,
pepn and the gene encoding 6-phosphogluconate dehydrogenase were down-regulated. In the propionic acid metabolic pathway, the genes encoding malonyl-CoA decarboxylase, 4-aminobutyrate aminotransferase, and acetyl-CoA synthetase were up-regulated. The differentially methylated genes at CCWGG sites were significantly enriched in the Ras signaling pathway, autophagy—animal, and autophagy—yeast. The most enriched pathway was the endocrine resistance pathway with a total of 67 differentially methylated genes; among them, up-regulated genes were significantly enriched in cancer pathways and endocrine resistance, whereas down-regulated genes were significantly enriched in autophagy—yeast, the chemokine signaling pathway, and the autophagy—animal pathway. In the cancer pathway,
aml1,
aml1-eto,
aml-evi1,
dapk, and
ecm were up-regulated, and
ra1 was down-regulated. In the autophagy—yeast pathway,
atg2 was down-regulated, and
e1f2α was up-regulated. In the Ras signaling pathway,
tiam1 and
ra1 were down-regulated, and
rasgap and
plcε were up-regulated. In the autophagy—animal pathway,
atg2 and
e1f2α were down-regulated, and
dapk was up-regulated. In the chemokine signaling pathway,
Pka was down-regulated. The results are shown in
Figure 4F and
Figure 5F.


