Article

Effect of Fasting and Refeeding on Juvenile Leopard Mandarin Fish Siniperca scherzeri

1
Chungcheongbuk-do Inland Fisheries Research Institute, Chungju 27432, Korea
2
Marine Bio-Resources Research Unit, Korea Institute of Ocean Science & Technology, Busan 49111, Korea
3
Program in Biomedical Science and Engineering, Inha University, 100 Inha-ro, Michuhol-gu, Incheon 22212, Korea
4
Department of Ocean Sciences, Inha University, 100 Inha-ro, Michuhol-gu, Incheon 22212, Korea
*
Author to whom correspondence should be addressed.
These authors contributed equally to this work.
Animals 2022, 12(7), 889; https://doi.org/10.3390/ani12070889
Submission received: 7 March 2022 / Revised: 28 March 2022 / Accepted: 29 March 2022 / Published: 31 March 2022

Abstract

:

Simple Summary

The development of live prey feed domestication techniques for the carnivorous leopard mandarin fish (Siniperca scherzeri) requires establishing nutritionally complete diets and research into optimal feeding regimes. Accordingly, the purpose of this experiment was to investigate the effects of varied feeding regimes for S. schezeri on compensatory growth. Individuals were divided into a daily feeding control group (C), a 5-day fasting group (F5), a 10-day fasting group (F10), and a 14-day fasting group (F14). The results demonstrated that after four weeks of treatment, all experimental groups experienced full compensatory growth and reached the control group weight. Therefore, this information will be valuable for effective management when fasting is necessary in S. schezeri aquaculture.

Abstract

To verify the effect of fasting on juvenile leopard mandarin fish (Siniperca scherzeri mean weight, 14.7 g), compensatory growth, body composition, and blood content of juveniles were investigated for six weeks following two-week feeding treatments: fed continuously (control), and fasted for 5 (F5), 10 (F10) and 14 days (F14). Full compensatory growth was evident after four weeks of food resupply in all fasting groups. Specific growth rate, feeding rate, and feed efficiency in all fasting groups were significantly higher than those of the control after the first 2 weeks of food resupply. At the end of fasting, the lipid content, ratio of lipid to lean body mass, hepatosomatic and viscerosomatic indices in all fasting groups, or total cholesterol content in F14 significantly decreased compared to the control. These results indicated that juvenile leopard mandarin fish subjected to 5–14 days of food deprivation could achieve full compensatory growth after feeding resumption for 4 weeks and that the morphological and biochemical indices, as well as body and blood composition, remained comparable to the control group after the completion of the study under our experimental conditions.

1. Introduction

Fish farmers employ fasting or limited feeding strategies in short- and long-term durations to reduce mortality or stress during water quality degradation, disease outbreaks, sorting, transferring, or harvesting or to simply improve feeding efficiency and reduce costs [1,2,3,4,5,6]. In contrast to fish fed continuously, those subjected to restricted feeding or fasting can experience greater growth once satiation feeding is resumed [3,5,7,8]. Such tendencies to return to original weights or growth trajectories are referred to as compensatory or catch-up growth [2,6,7,8,9,10,11].
Depending on the target species, compensatory growth efficiency can vary with type, duration, and intensity of fasting performed prior to food resupply [5,11,12]. Furthermore, compensatory growth can increase feeding efficiency and growth rates while lowering feed and labor costs, ultimately translating environmental improvements and economic gains for farmers. Additionally, numerous studies have aimed to standardize rearing patterns through the application of limited food supply methods for reducing stress due to various unpredictable yet frequent events (e.g., environmental degradation, high/low water temperatures, disease, handling, etc.), thereby developing appropriate feeding regimes for realistic aquaculture settings [5,6,13,14,15,16,17].
The leopard mandarin fish, Siniperca scherzeri Steidachner, 1832, is an important freshwater fish species with a high commercial value around East Asia, including China, Korea, and Vietnam [18,19,20]. It is harvested from fish farms in commercial sizes ranging from relatively small 100 g to over 300 g, depending on consumer preferences in Korea. Its high potential as a farmed freshwater fish derives from its excellent taste, high market price, rapid growth, and high resistance to disease [21,22]. It has been established that fish growth and feeding efficiency depend on food quantity and quality [23,24], which, in turn, are dependent on the rearing environment, food composition, form, and feeding method [25,26]. A number of practical feeds have recently been developed in connection with nutritional studies of the S. scherzeri for commercial aquaculture [9,20,27,28,29,30]. Addition research has also been conducted on feeding regimes, such as frequency [31], feeding ratio for satiation level [32], and feed rate for fish weight [26]; however, to date, no research has been conducted on compensatory growth.
Accordingly, the purpose of the present study was to determine the effects of varying durations of post-fasting satiation feeding on the feed utilization, body composition, and blood composition of juvenile S. scherzeri, as well as the strength of compensatory growth. The ultimate goal was to develop an effective and economically optimal feeding supply strategy in S. scherzeri farms.

2. Materials and Methods

2.1. Fish and Rearing Condition

The experiment was conducted using juvenile S. scherzeri raised at the Inland Fisheries Research Institute in Chungcheongbuk-do, Chungju, South Korea. Fish were reared in an indoor recirculation system consisting of a submerged nitrifying filter (3000 L capacity), foam separator (100 L), and 20 fiberglass circular tanks (300 L) and were acclimated for 2 weeks prior to initiating the experiment. During the acclimation period, fish were fed the same experimental dry pellets (55.4% crude protein, 14.1% crude lipid), which were used in the previous study [26], to apparent satiation twice daily (09:00 and 17:00). The fiberglass circular tanks were aerated to provide sufficient dissolved oxygen, whereas water temperature, ammonia, nitrous acid, and pH were monitored daily. Experimental temperatures ranged from 26.4 to 27.5 °C, dissolved oxygen concentrations were ≥7.6 mg L−1, ammonia concentration was ≤0.35 mg L−1, nitrous acid concentration was ≤0.18 mg L−1, and pH ranged from 6.7 to 7.3 comparable with previous studies [26,31,32].

2.2. Experimental Design and Management

Following acclimatization, 300 juveniles (initial mean body weight: 14.7 g) were randomly assigned to one of four different feeding groups. Each feeding group consisted of 5 tanks (i.e., replicates), and 15 juveniles were stocked per tank. Control group (C) was fed to apparent satiation twice daily (09:00 and 17:00) during the experimental periods, whereas the three remaining groups fasted for: 5 days (F5) from days 10–14 after initiation of the experiment; 10 days (F10) from days 5–14; 14 days (F14) from days 1–14 before satiation refeeding in week 3. The three fasting groups were fed to satiation same as control. Daily feeding was performed by dropping pellet (the same as during the acclimation period) into each tank every few minutes until the fish ceased to eat due to satiation. Care was taken to ensure that all pellets provided were consumed by the fish. The container of the pellets was weighed before the first feeding and after the last feeding daily. Uneaten pellets were collected from each tank by siphon and were dried in the oven to a constant weight. The actual daily consumed feed amount was determined as the difference in weight between the feed supplied into the tank and the uneaten feed removed by siphon. The experiment lasted 8 weeks.
Prior to the experiment, all the fish in each group were fasted for 24 h for gut evacuation, followed by anesthesia with a 2-phenoxyethanol solution (150 mg L−1; Sigma, St. Louis, MO, USA) to minimize the stress before body weight and body length measurement. Before measurement, all excess water on the fish skins was removed by blotting with a paper towel and then measured to the nearest 0.01 g and 0.1 cm.
To evaluate the effect of fasting and refeeding, all fish in each group were bulk-weighed at the end of weeks 2, 4, and 6 and at the end of the experiment (i.e., week 8), individual body weight and body length were measured using the same method above. Fish were not fed on the day of measurement.

2.3. Analysis of Blood and Body Content

The blood composition, hepatosomatic index (HSI), viscerasomatic index (VSI), protein, lipid, ash, and moisture content of the four feeding groups, as well as the lipid:lean body mass ratio (lipid/LBM) were measured at the ends of weeks 2 and 8. At the end of week 2, 2 tanks in each feeding group were randomly selected, and 7 fish per tank were randomly subjected to blood composition, HSI, and VSI analyses, while the remaining 8 fish per tank were subjected to whole-body analysis. At the end of week 8, the fish in the remaining three tanks of each feeding group were sampled for analysis of blood and body compositions using the same method as at end of week 2. Fish were anesthetized in 150 mg/L of 2-phenoxyethanol solution for 1 min after the measurement of body weight or body length. Then, they were stored at −40 °C for the analysis of body composition.
Before sacrificing the fish, blood samples of the fish were collected from the tail artery using a heparinized syringe following anesthesia with 2-phenoxyethanol solution (150 mg L−1). The blood collected was centrifuged at 8870× g for five minutes to extract serum, after which hemoglobin (Hb), glucose (GLU), total cholesterol (TCHO), glutamic oxaloacetic transaminase (GOT), glutamic pyruvic transaminase (GPT), and high-density lipoprotein cholesterol (HDLC) in the extracted serum were measured with a DRI-CHEM NX500i (Fujifilm Co., Tokyo, Japan). Immediately after blood sampling, the sacrificed fish were also dissected, and the weights of the liver and viscera were measured to determine HIS and VSI.
Prior to whole-body analysis, fish samples were freeze-dried and homogenized. Proximate analysis was conducted according to the AOAC methods [33]. The crude protein content was determined with the Kjeldahl method using the Auto Kjeldahl System (Buchi, Flawil, Switzerland). After 24 h of desiccation in a dry oven at 105 °C, the moisture content was measured. Crude fat was measured using the ether-extraction method, and crude ash content was determined following 4 h of combustion at 600 °C.

2.4. Growth Parameters and Statistical Analysis
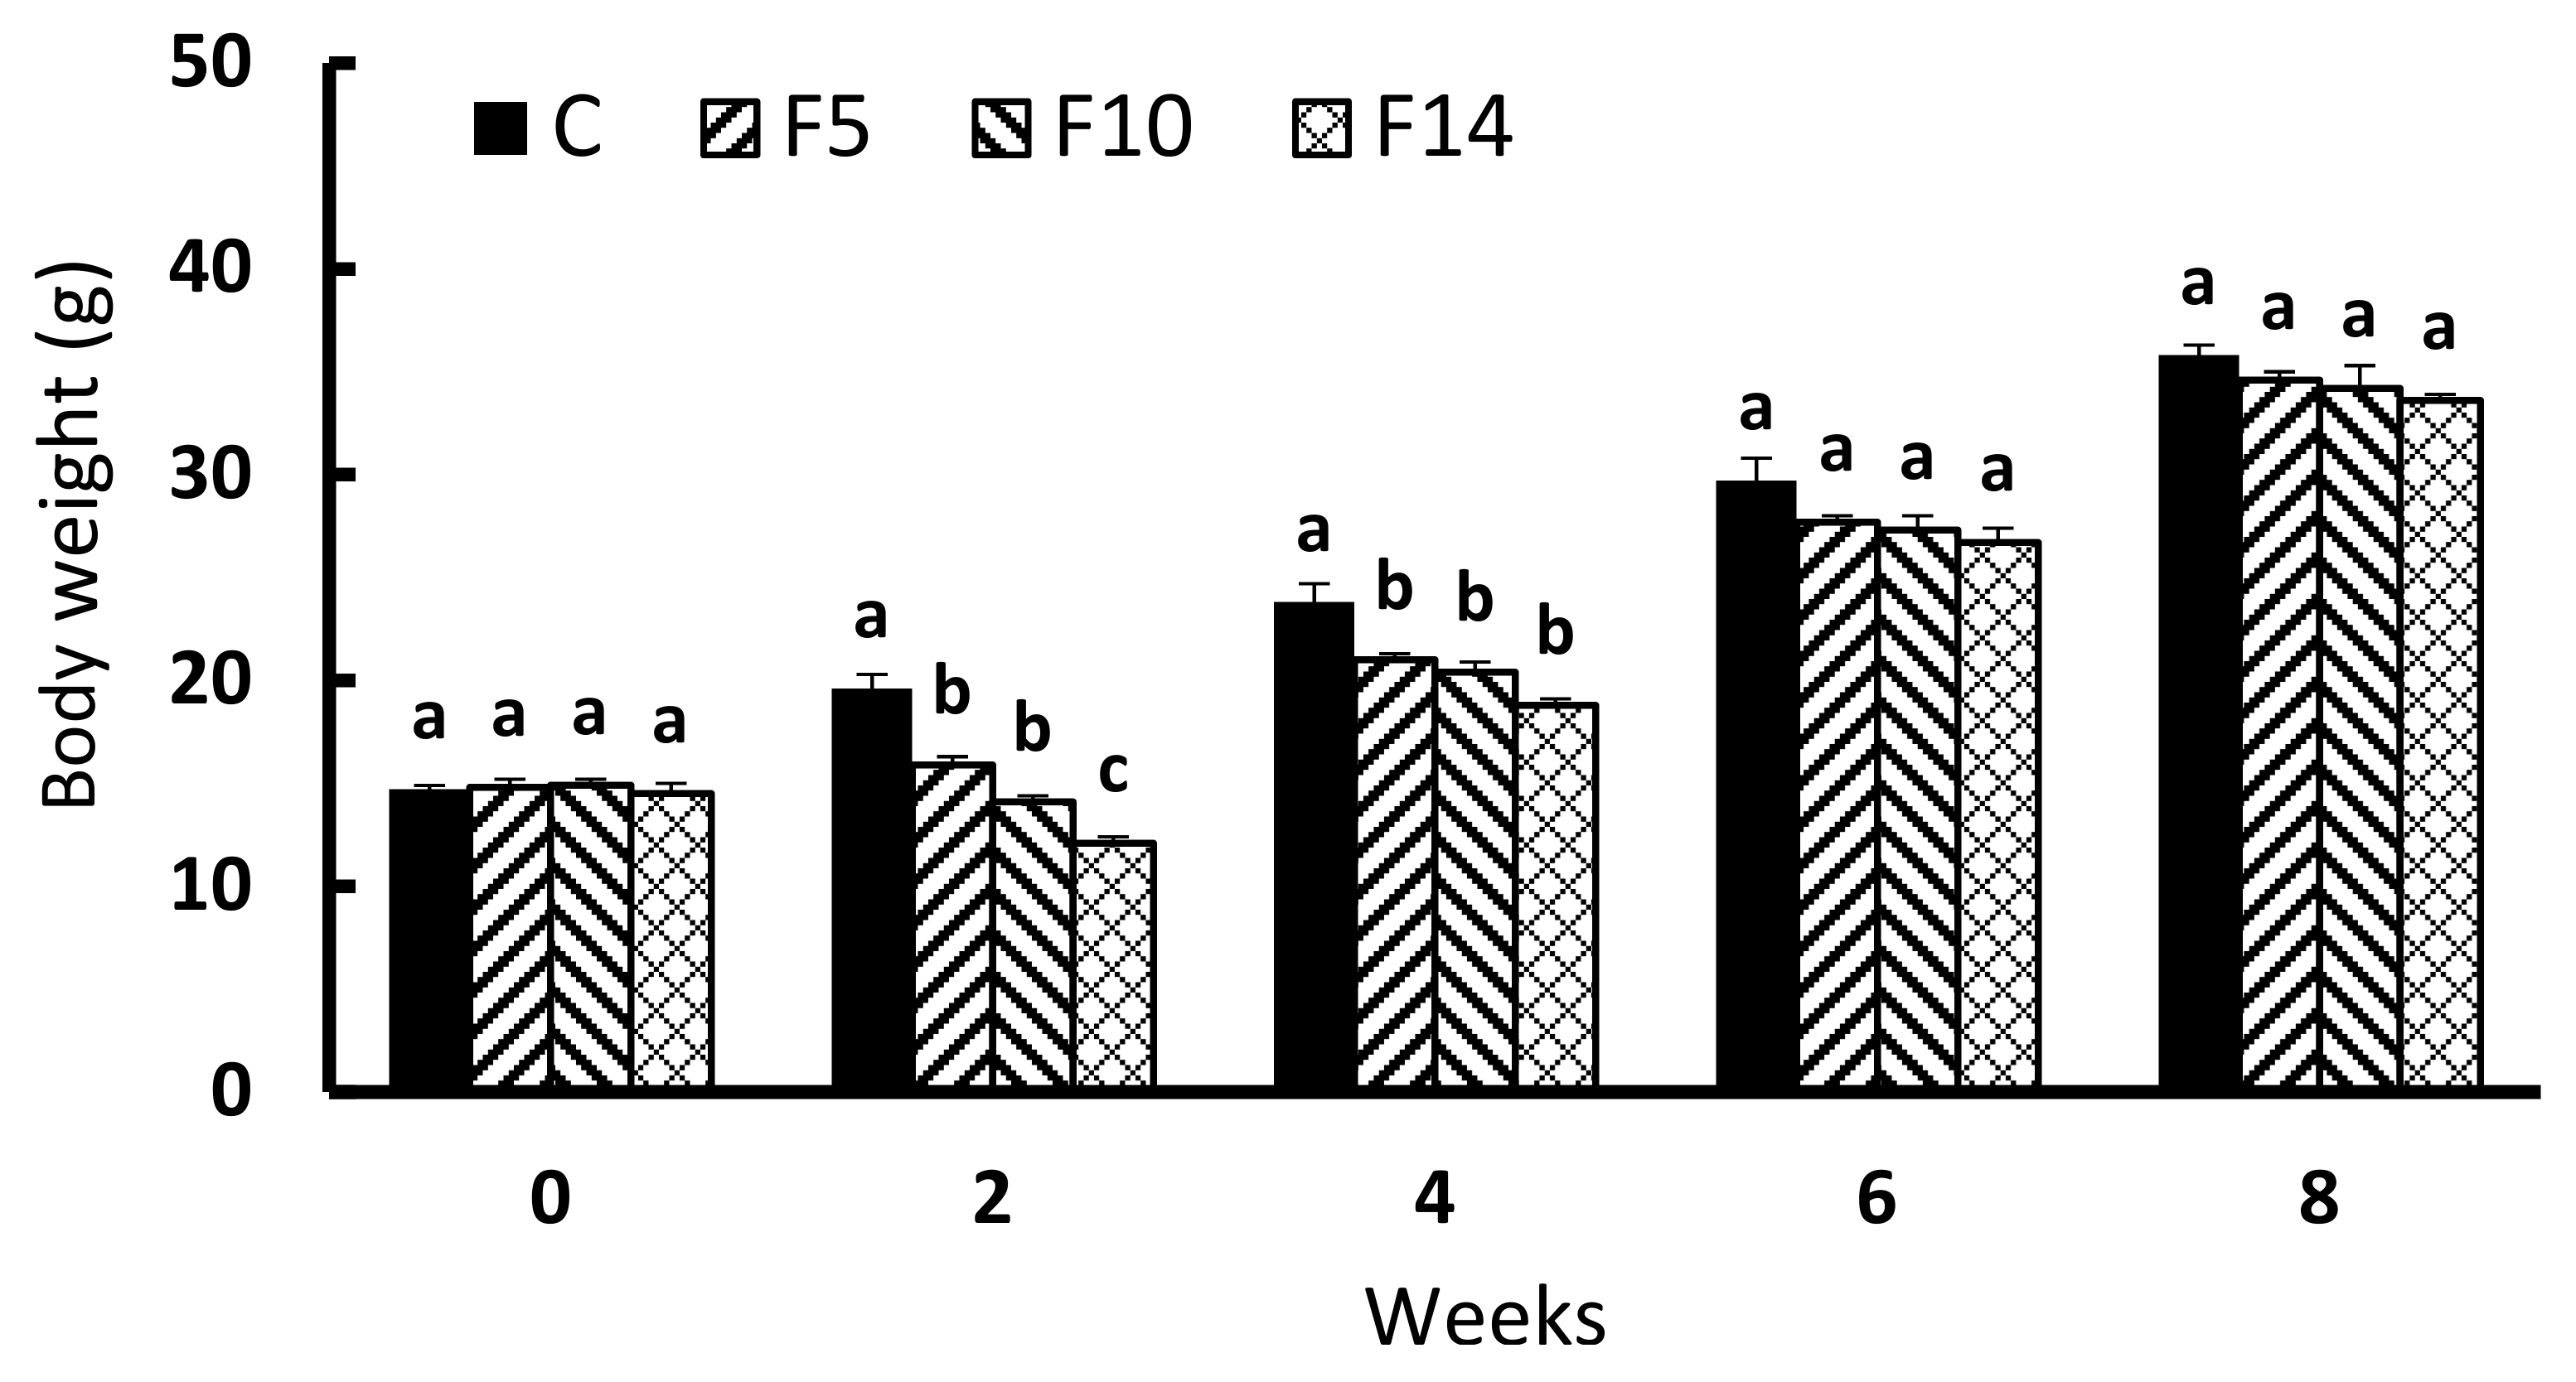
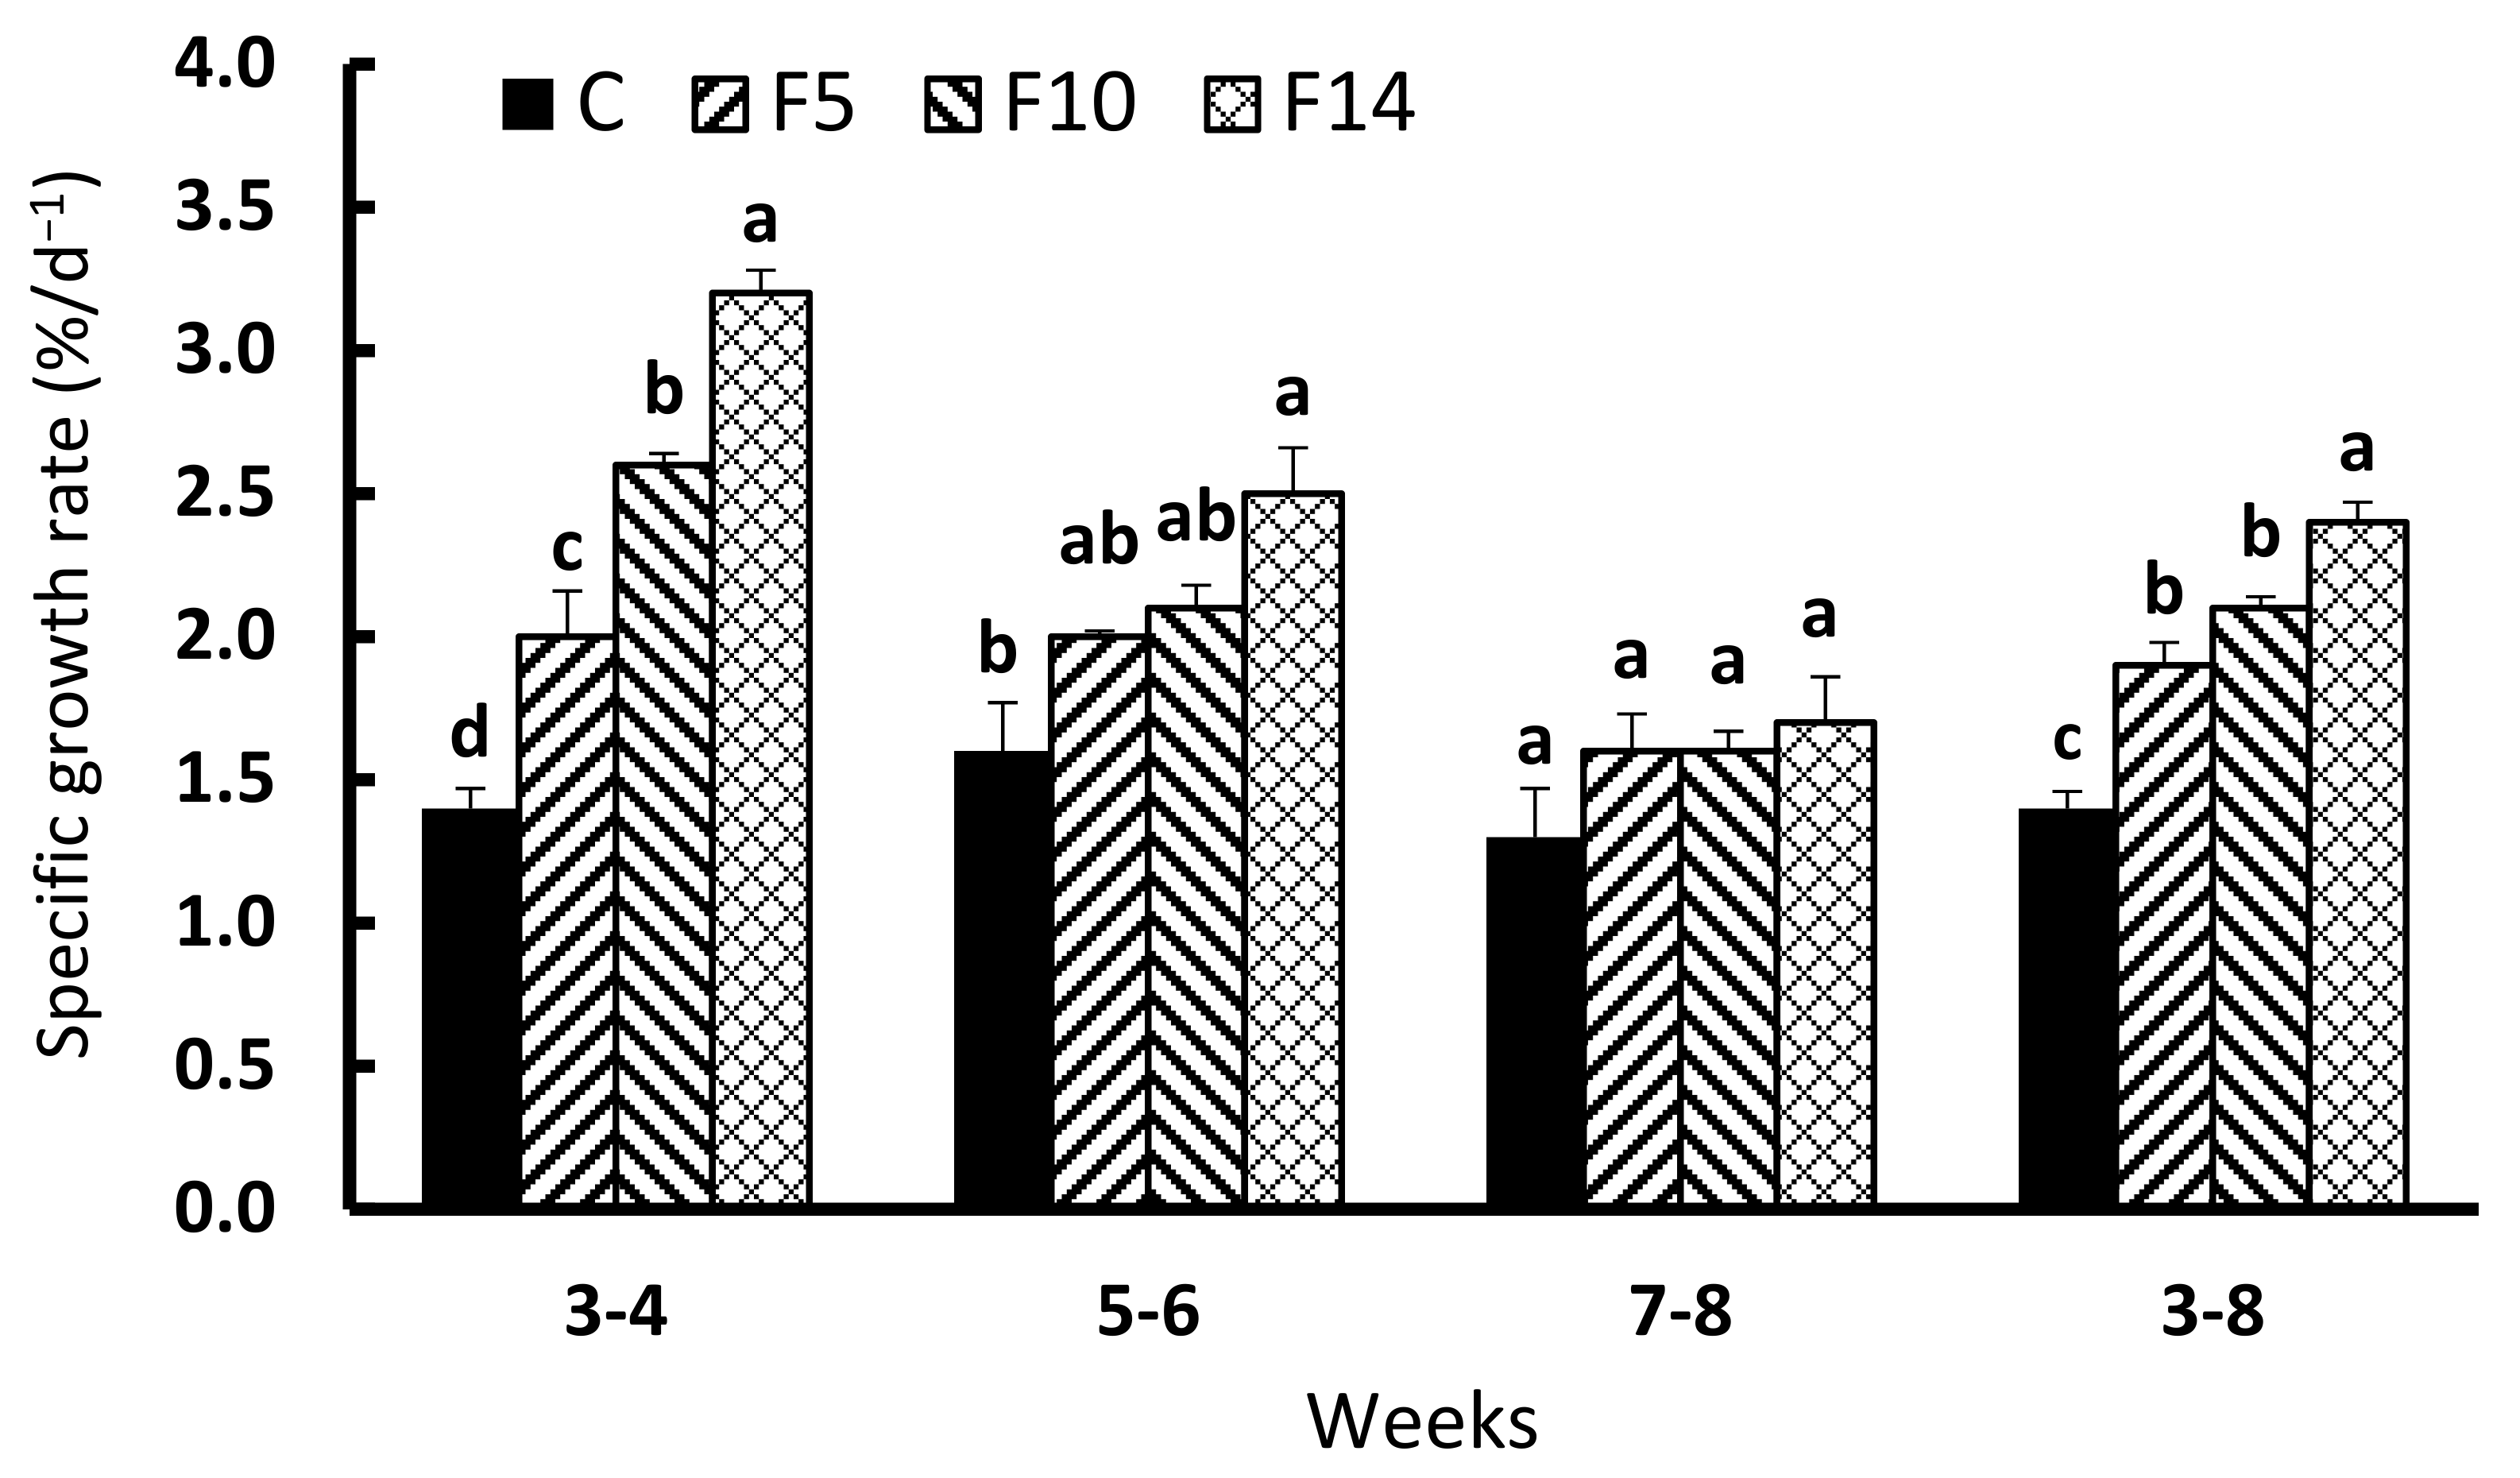
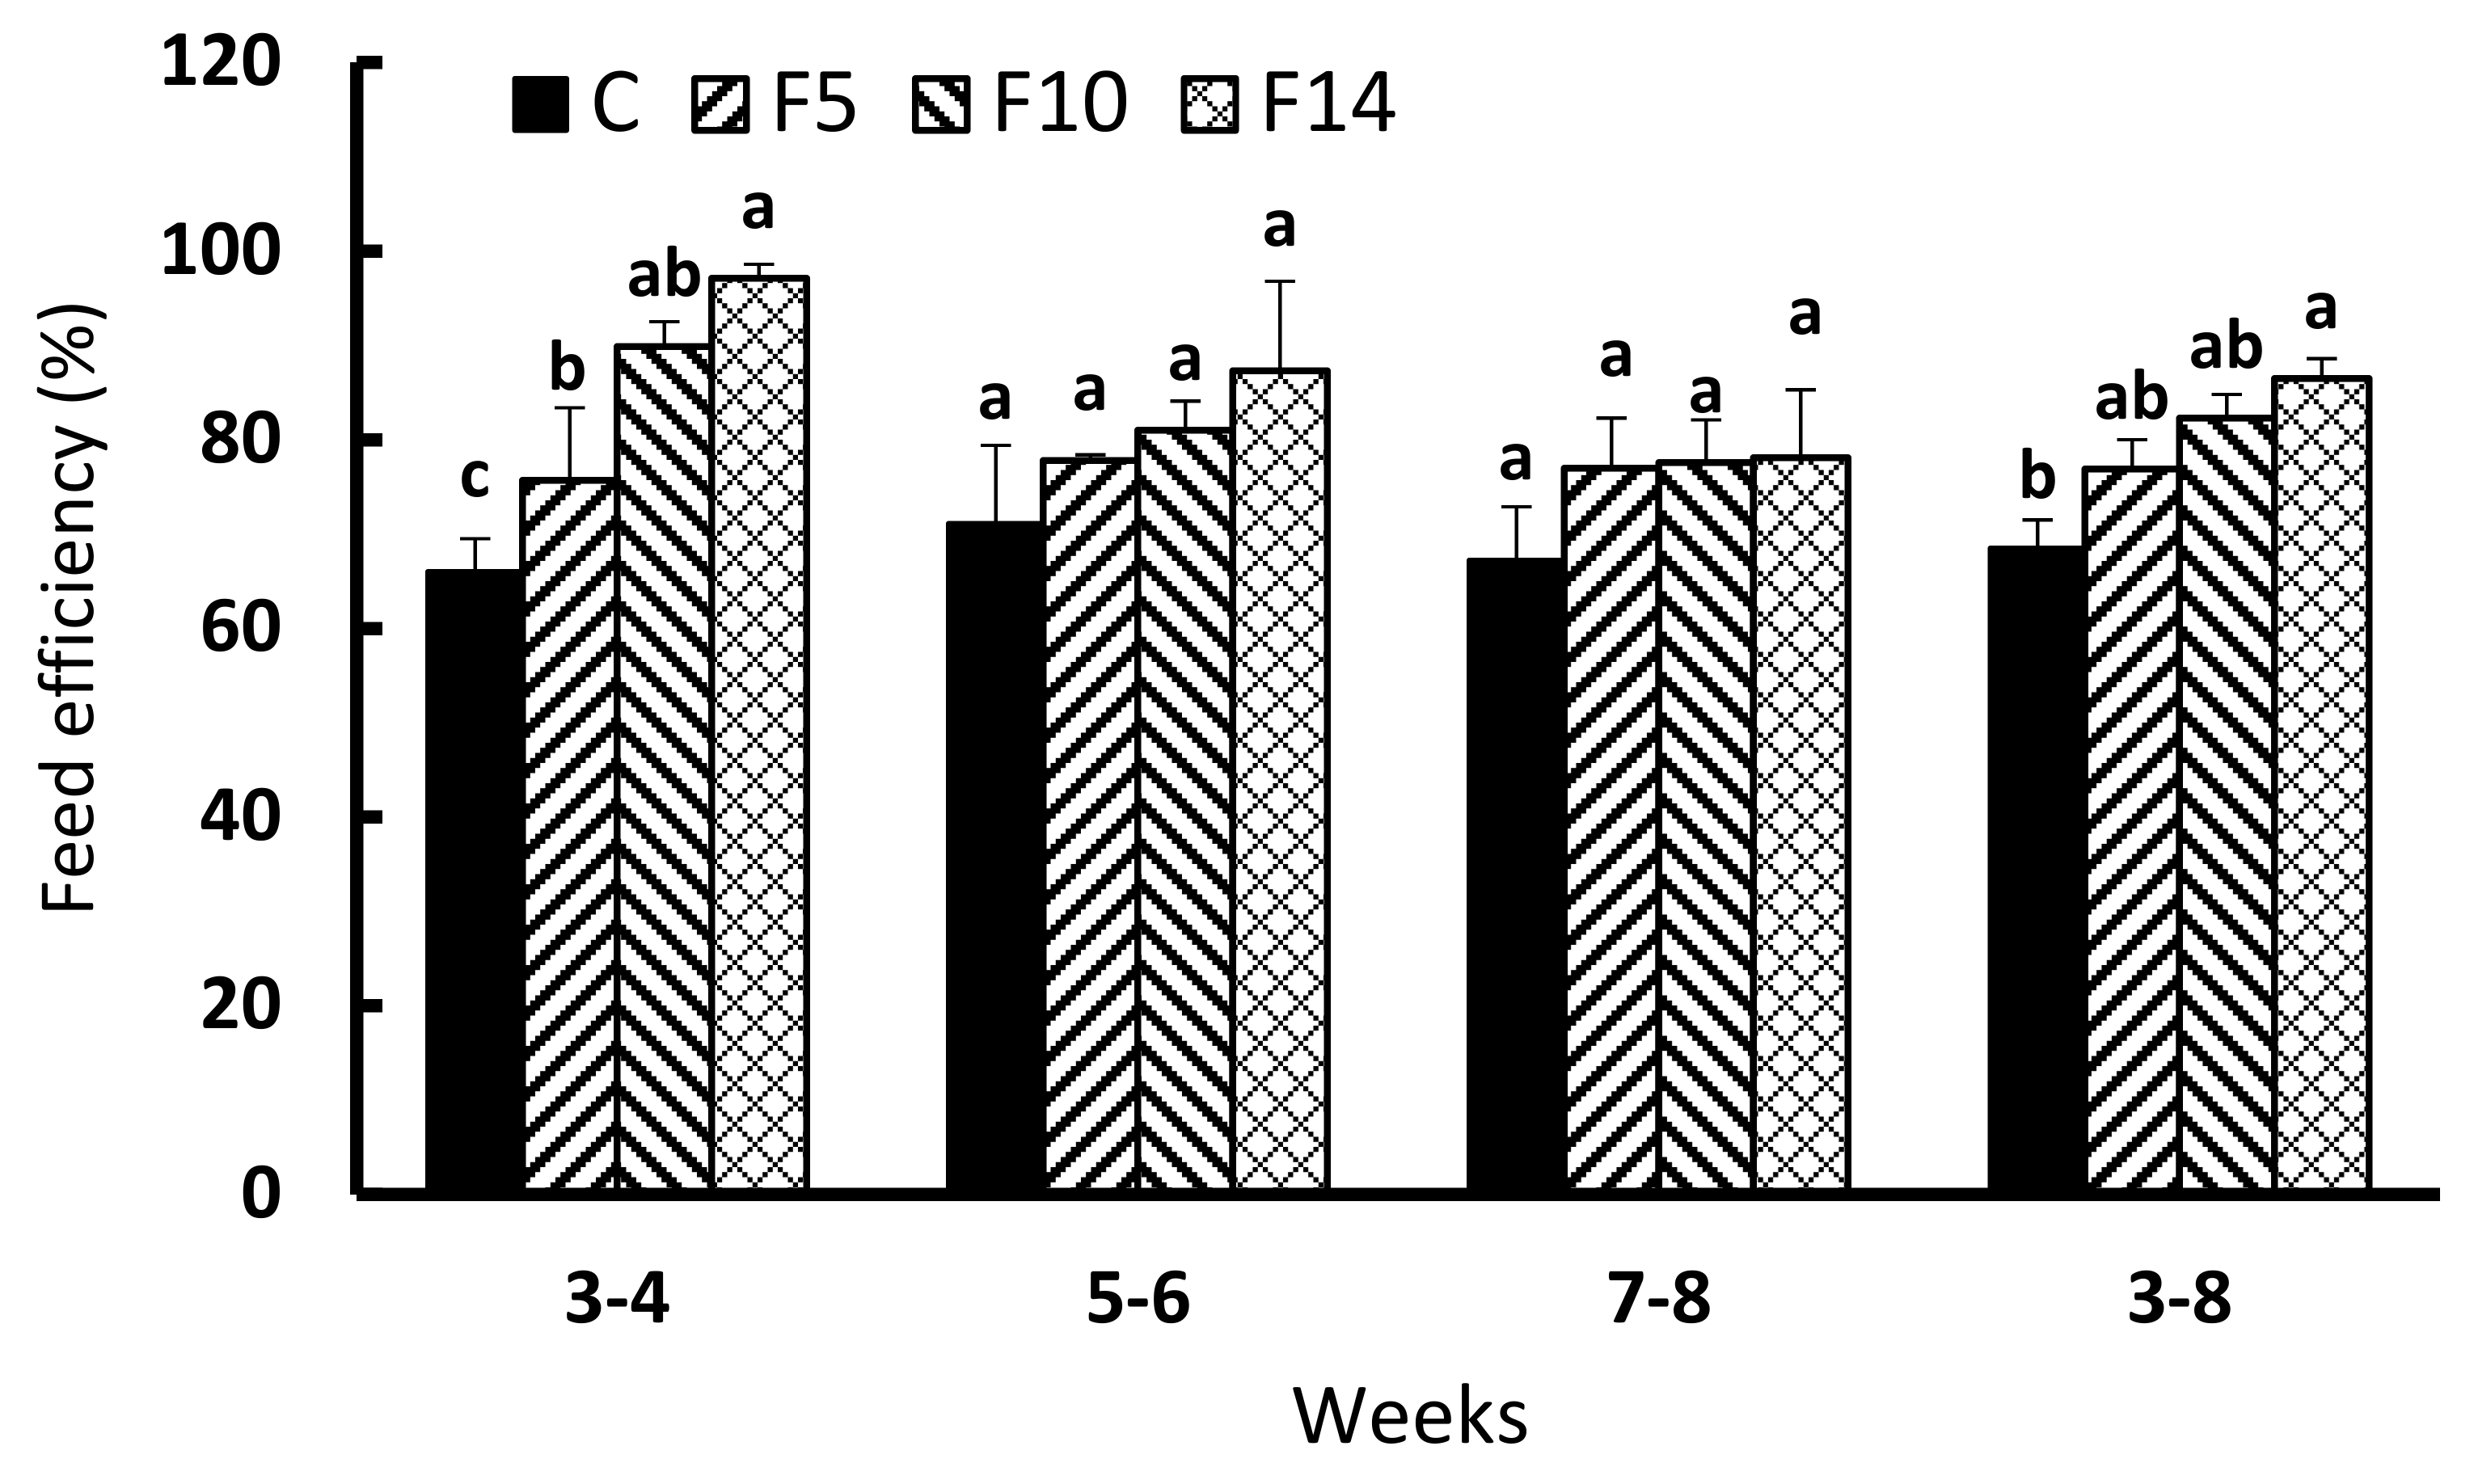
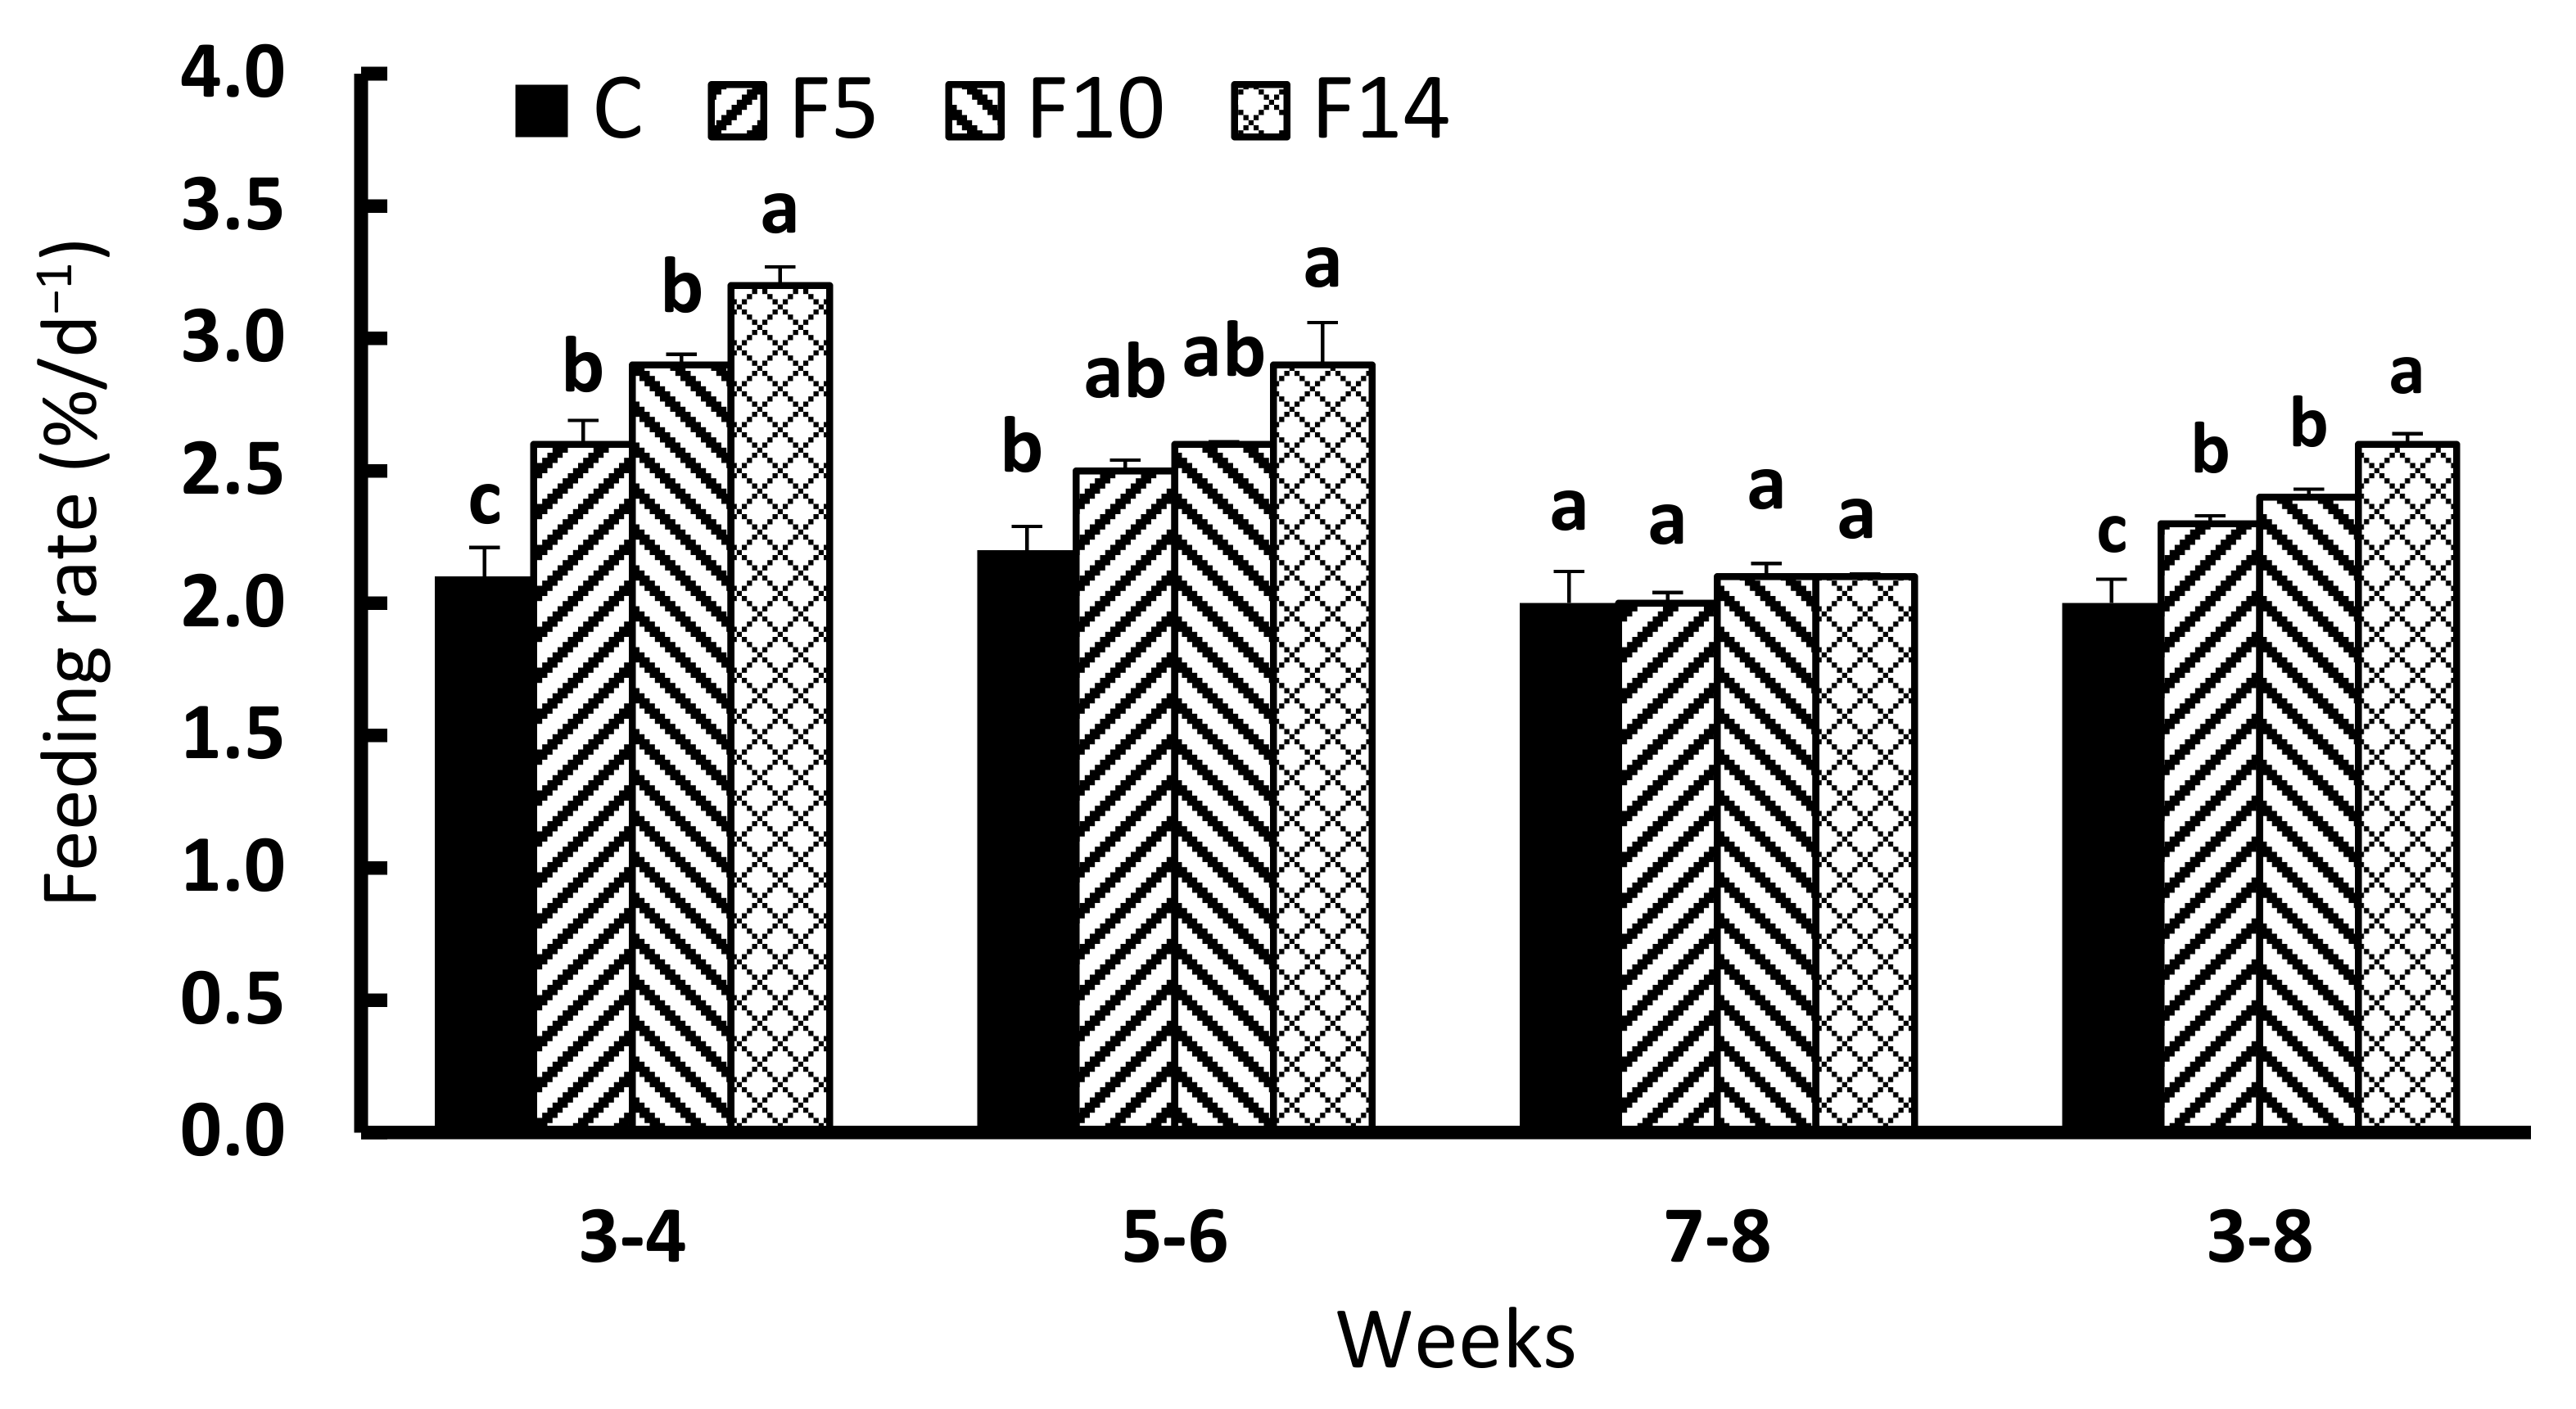
The following growth parameters were calculated: specific growth rate (SGR, % d−1) = 100 × (lnWf − lnWi)/t, feeding rate (FR, % body weight d−1 = 100 × C/[(Wf + Wi)/2]/t, and feed efficiency (FE, %) = 100 = (Wf − Wi)/C where Wf and Wi are final and initial weights (g), t is the feeding duration (day) and C is total feed consumption (g) during t days.
All statistical analyses were performed in SPSS v.20 statistical software (SPSS Michigan Avenue, Chicago, IL, USA). Each replicate was considered an experimental unit, and therefore, the mean value obtained from a replicate within each feeding group was used as a data unit [3,5,8,34]. At the beginning and week 2, all feeding groups had 5 replicates (n = 5), while 3 replicates (n = 3) were used after week 2. One-way analysis of variance (ANOVA) was separately used to compare initial body weight, blood, and body contents among the four feeding groups, and when significant differences were identified, Tukey’s multiple range test (p < 0.05) was used to verify the significance between the means. Levene’s test was used to verify the homogeneity of variance prior to ANOVA, and percent data were arcsine-transformed. Repeated measures analysis of covariance (ANCOVA) with one factor was used to determine the effects of four feeding groups on body weight from week 2 to week 8 and on SGR, FR and FE from week 3 to week 8. In the ANCOVA of body weight, initial body weight was used as a covariate to remove any biases resulting from the allometric relationship between body weight and growth [3,5,8,34]. In the ANCOVA of SGR, FR, and FE, body weights at the beginning of weeks 3, 5, and 7 were used as covariates to assess growth potential, as it returns to the original growth trajectory [3,5,8,34].

3. Results

During the experimental period, no mortality was observed in any of the experimental groups. Figure 1 shows the body weight change of S. scherzeri throughout the experiment. At the onset of the experiment, no significant difference in body weight was detected among all experimental groups (p > 0.05), although the body weights of F5, F10, and F14 immediately following the experimental fasting periods were all significantly lower than those of the control group (F = 53.919, df = 3, p < 0.0001). Similarly, fish weights were significantly lower among F5, F10, and F14 following the first two weeks of feed resupply (week 4) compared with the control group (F = 14.358, df = 3, p < 0.001). Four weeks (week 6) and six weeks (week 8) after feed resupply, the weight of the fish did not differ significantly from that of the control group (week 6, F = 2.828, df = 3, p = 0.107; week 8, F = 1.75, df = 3, p = 0.234).
SGRs (F = 64.479, df = 3, p < 0.001) of all the fasting groups during the first two weeks of feed resupply (weeks 3–4) were significantly greater than the control (Figure 2). During the second two weeks of feed resupply (weeks 5–6), F14 showed a significantly higher SGR than the control group (F = 9.655, df = 3, p < 0.01), whereas no such difference was observed for F5 and F10. SGRs during the final two weeks (weeks 7–8) were not significantly different between the experimental groups (F = 1.148.3, df = 3, p = 0.3871); however, the overall SGR over the six weeks of feed resupply (weeks 3–8) was significantly higher in the fasting groups (F = 44.21, df = 3, p < 0.001), with F14 exhibiting the highest SGR.
During the first two weeks of feed resupply (weeks 3–4), FRs in all fasting groups were significantly higher than in the control group (F = 33.865, df = 3, p < 0.001; Figure 3). During the second two weeks of feed resupply (weeks 5–6), F14 showed significantly higher FR than the control group, while F5 and F10 did not differ from the control group (F = 7.707, df = 3, p = 0.01). The FR during the final two weeks of resupply (weeks 7 to 8) was not significantly different between the experimental groups (F = 1.034, df = 3, p = 0.428). The overall FR during the six weeks following the fasting period (weeks 3–8) showed the highest FR in F14, followed by F10, F5, and the control group (F = 20.103, df = 3, p < 0.001).
The FEs in all fasting groups during the first two weeks of feed resupply (weeks 3–4) were significantly higher than the control group (F = 9.731, df = 3, p < 0.005; Figure 4). FEs of F5, F10, and F14 during the second two weeks (weeks 5–6) and third two weeks (weeks 7–8) of feed resupply were not significantly different from the control (F = 1.075, df = 3, p = 0.413; and, F = 0.812, df = 3, p = 0.522, respectively). The overall FE during the six weeks of feed resupply (weeks 3–8) was only significantly higher for F14 compared to the control group (F = 8.139, df = 3, p = 0.008).
The condition factor (CF), coefficient of variation for body length (CVBL), and body weight (CVBD) of the four experimental feeding groups at the beginning and end of the experiment are shown in Table 1. The fasting period did not affect the CFf (F = 0.06, df = 3, p = 0.98), CVBLf (F = 0.143, df = 3, p = 0.931) and CVBWf (F = 0.086, df = 3, p = 0.966).
The body compositions, HSI, and VSI of S. scherzeri after fasting (end of week 2) and at the end of the experiment (end of week 8) are shown in Table 2. Lipid (F = 37.407, df = 3, p = 0.002), HSI (F = 7.612, df = 3, p = 0.04), of F10 and F14 after fasting (week 2), as well as lipid/LBM (F = 36.028, df = 3, p = 0.002) and VSI (F = 14.549, df = 3, p = 0.013) of all fasting groups, were significantly lower than the control; however, moisture content (F = 12.493, df = 3, p = 0.017) in F14 was significantly higher than the control. No differences were detected between protein (F = 2.351, df = 3, p = 0.214) and ash (F = 0.282, df = 3, p = 0.837) among experimental groups in week 2. Similarly, no significant differences were observed in moisture content (F = 8.918, df = 3, p = 0.06), protein (F = 0.10, df = 3, p = 0.96), lipid (F = 0.265, df = 3, p = 0.849), ash (F = 3.417, df = 3, p = 0.073), lipid/LBM (F = 0.117, df = 3, p = 0.948), and VSI (F = 0.463, df = 3, p = 0.716) compared to the control group at the end of experimentation; however, HSI values in F5, F10, and F14 were significantly higher than the control group (F = 0.059, df = 3, p = 0.016).
The Hb, GLU, TCHO, GOT, GPT, and HDLC concentrations in the blood of juvenile S. scherzeri after fasting and at the end of experimentation are shown in Table 3. The concentrations of TCHO (F = 7.727, df = 3, p = 0.01) in F14 were significantly lower than that in the control group after fasting (end of week 2), whereas concentrations of GLU in F14 were significantly higher than the control (F = 7.393, df = 3, p = 0.001). The concentrations of Hb (F = 0.379, df = 3, p = 0.771), TCHO (F = 0.239, df = 3, p = 0.868), GOT (F = 2.132, df = 3, p = 0.149), GPT (F = 2.851, df = 3, p = 0.082), GLU (F = 0.028, df = 3, p = 0.993), and HDLC (F = 0.463, df = 3, p = 0.988) in the blood of juvenile S. scherzeri at the end of experimentation were not significantly different from the control group.

4. Discussion

In modern aquaculture, producers are seeking to reduce production costs in a manner without adversely affecting productivity or the environment [4]. As feed represents the largest share of aquaculture production costs [35], commercial aquaculture farms aim to develop appropriate feed supply management and saving methods [36]. Compensation growth can be used as a feed supply strategy, whereby satiation feeding after feed deprivation can lead to faster growth and greater feed efficiency, translating into improved economic efficiency by reducing feed and labor costs [37,38,39]. Depending on the strength of fish body weight recovery following fasting, the degree of compensatory growth is classified as over, complete (i.e., full), partial, and non-compensatory [5]. Notably, the degree of compensatory growth is sensitive to both the degree and duration of fasting prior to satiation feeding [5,34,40]. Here, all juvenile S. scherzeri subjected to five- (F5), 10- (F10), and 14-day (F14) fasting showed full compensatory growth that caught up with the weight of the control group four weeks after feed resupply. Similarly, full compensatory growth after ≤2 weeks of fasting was reported to be observed in rock bream (Oplegnathus fasciatus) [5], Chinese longsnout catfish (Leiocassis longirostris) [39], gibel carp (Carassius auratus gibelio) [41], and gilthead seabream (Sparus auratus) [42]. In addition, full compensatory growth was reported in black rockfish (Sebastes schlegeli) after five days of fasting [8], barramundi (Lates calcarifer) [43] and hybrid tilapia (Oreochromis mossambicus × O. niloticus) [44] after one week of fasting, and red seabream (Pagrus major) after 1–3 weeks of fasting [3]. The relative ratio of the body weight of fish subjected to fasting as compared to those fish in the control group has been previously discussed as a critical indicator of full compensatory growth [3,8,41,43]. Tian and Qin [43] determined that after fasting, full compensatory growth occurred for ≥60% of fish body weight in the control group, and the same phenomenon was reported to be observed in gibel carp [41], hybrid tilapia [44], black rockfish [8], Chinese longsnout catfish [40], gilthead seabream [42], rainbow trout (Oncorhynchus mykiss) [45], and rock bream [5]. During the present experiment, F5, F10, and F14 all showed full compensatory growth after fasting for 5 to 14 days for individuals with body weights of ≥~60% (61.7–81.1%) than the control group.
The SGR and FR values after fasting increased during the early feed resupply stages (weeks 3–4) with an increasing duration of food deprivation, whereas similar values to the control group were observed during the latter food resupply (weeks 7–8), comparable to results previously reported for rainbow trout [45] and rock beam [5]. Generally, these phenomena occur during the initial resupply of feed immediately following the period of deprivation due to a hyperphagic response [5,8,44], inducing compensatory growth that decreases with time [5,42] as well as a decrease in the digestibility of excess feed intake [26,32,46,47]. Therefore, during the initial resupply of food in the present study, the FE of the fasting group was very high; however, with time, the FE decreased or was not significantly different from the control group. Similarly, improved FE during feed resupply was documented for European minnow (Phoxinus phoxinus) [48], gibel carp [49], Chinese longsnout catfish [40], Atlantic halibut (Hippoglossus hippoglossus) [50], blackhead seabream (Acanthopagrus schlegelii) [14], and rock bream [5]. Throughout the present study, hyperphagia and improved FE tended to decrease with time, both of which were attributed to the two factors acting as major determinants of compensatory growth of S. scherzeri, as this tendency was seen in all fasting groups, and similar results have been observed in other previous studies as well [3,5,34]. It has been reported, however, that compensatory growth occurs primarily due to the increase in FR and not from improvements in FE during feed resupply after fasting [8,41,45,51,52,53], suggesting that the major factors driving compensatory growth differ.
In the experiment here, the CF, CVBW, and CVBL of juvenile S. scherzeri were not affected by compensatory growth. Similarly, Silva et al. [17] reported no differences in CF, final weight, and total length between the control group and the replicates of fasting groups. Fasting groups in this study experienced a rise in moisture content after feed deprivation, and similar to previous studies, lipid content and HSI decreased [42,43,54,55]. Using a lipostatic model, one can predict the timing of compensatory growth based on the principle that such growth occurs when the lipid/LBM decreases and ends when the lipid/LBM returns to control group levels [56]. In most animals, the lipid stores indicate the easily activated energy reserves, and the lean body mass (LBM) includes the structural tissues, so the lipid/LBM may be considered an indicator of nutritional state [56]. The lipostatic model hypothesized that restricted feeding induces changes in adiposity through compensatory feeding as a result of negative feedback due to changes in energy balance [56]. Therefore, fat loss after restricted feeding reduces the negative feedback on feed intake and elevated feed intake until normal fat levels and lipid/LBM are maintained. In other words, the lipostatic model represents that the size of body lipid reserves affects the feed intake (i.e., hyperphagic response) of fish via the negative feedback signal to the central nervous system, thereby regulating the feed intake behavior, body weight, and body composition during compensatory growth. Therefore, if the body lipid reserves of fish are repleted very slowly, the compensatory growth through the hyperphagic response can be sustained because the imbalance of the lipid/LBM is maintained for a long time [56]. It is very important to extend the period of imbalance of the lipid/LBM by controlling the repletion of body lipid storage during refeeding after restricted feeding or fasting, and further study is needed in the future. This model has been applied to Atlantic salmon (Salmo salar) [57] and Nile tilapia (Oreochromis niloticus) [58]. The present experiment found that the lipid/LBM of the F5, F10, and F14 groups were significantly lower than that of the control group following fasting (end of week 2), and no differences in SGR and lipid/LBM were observed between the fasting and control groups at the end of the experiment (end of week 8), thus indicating the efficacy of the lipostatic model. Despite this alignment here, numerous previous studies’ results were inconsistent with the lipostatic model [3,5,8,40,41,42,45,59], suggesting that such results may vary by species. Based on the results of the experiment here, the HSI after fasting significantly decreased compared to the control group as the duration of fasting increased. Silva et al. [17] reared pacamã (Lophiosilurus alexandri) for a total of 45 days with a 6:1 and 5:2 feed to fasting regime, and their results showed that the HSI was the lowest in the 5:2 group, which is similar the results found in the present study. As an indicator of fish nutritional status [60], the HSI is a ratio of liver to body weight and can be used to quantify the energy stored in the liver as glycogen [61]. Metabolic and regulatory processes associated with nutrients and lipogenesis originate in the liver of fish [62]. As demonstrated in the present study, the lower HSI values with longer fasting periods indicated the need for greater hepatic energy storage, and Morshedi et al. [15] reported that fasting decreased the amount of hepatic energy available, directly affecting liver weight. At the end of the experiment, the higher HSI in the fasting groups compared to the control was due to an excess accumulation of energy during the recovery process associated with feed resupply. Fish can reduce their energy requirements by reducing the mass of gastrointestinal tissues during a fasting period [63], which is consistent with the findings of the VSI reduction observed after fasting in the present study. According to Jobling [64], fasting increases the digestive tract capacity of fish, allowing them to consume more due to the hyperphagia that may occur throughout the recovery period. This would partially explain the increase in VSI of the fasting group seen at the end of the present experiment and correlate with the hyperphagic behavior observed here as well.
A hematological and biochemical assessment of fish has been used to determine their physiological status [15], and it was revealed that these factors could be affected by biotic and abiotic factors, such as age, sex, water temperature, seasonal patterns, and food intake [65]. At the end of the present study, it was found that fasting and resupplying had no notable effects on the hematological characteristics of juvenile S. scherzeri, and similar results were found with the Siberian sturgeon (Acipenser baerii) [15], Nile tilapia [66], olive flounder (Paralichthys olivaceus) [67], European eel (Anguilla anguilla) [68], red porgy (Pagrus pagrus) [69], and beluga (Huso huso) [70]. During the present study, it was observed that fasting influenced GLU and TCHO levels in the plasma of juvenile S. scherzeri; however, no such increase in plasma GLU was observed in sea bass (Dicentraachus labrax) [71] or pirapitinga (Piaractus brachypomus) [72]. Cholesterol is a structural lipid utilized or synthesized in response to feed deprivation; however, it is also maintained during feed deprivation without increasing, decreasing, or changing depending on the species and fasting duration [72]. For the present study, the cholesterol concentrations decreased after fasting (week 2), similar to the results observed for rainbow trout [73], brown trout (Salmo trutta) [74] and sturgeon (Acipenser naccarii) [75]. Additionally, a decrease in feed intake of S. scherzeri due to either a decrease in feeding frequency or feeding ratio was also associated with a decrease in plasma TCHO concentrations [26,31,32]. In contrast, no change in TCHO concentrations was documented for pirapitinga [72], tamaqui (Colossoma macropomum) [6], and pacamã [17], whereas an increase was observed with pacu (Piaractus mesopotamicus) [76] and climbing perch (Anabas testudineus) [77], similarly suggesting variable results according to species and fasting regime. Therefore, further complementary research is necessary for the future.

5. Conclusions

The present experiment determined that all juvenile S. scherzeri (initial mean weight, 14.7 g) subjected to 5–14 days of food deprivation experienced full compensatory growth after four weeks of food resupply under our experimental conditions. Responding well to the feeding strategy of fasting and resupplying, S. scherzeri maintained similar body compositions, blood, morphological, and biochemical characteristics compared to the continuously fed control group within 6 weeks after resupply commenced. This information may be helpful to fish farmers who encounter adverse conditions during rearing or require practical feeding strategies to increase feed efficiency while reducing costs.

Author Contributions

Conceptualization, Y.-O.K. and S.-Y.O.; methodology, Y.-O.K. and S.-Y.O.; software, Y.-O.K. and S.-Y.O.; validation, S.-Y.O. and T.K.; formal analysis, S.-Y.O. and T.K.; resources, Y.-O.K.; data curation, Y.-O.K. and S.-Y.O.; writing—original draft preparation, Y.-O.K., S.-Y.O. and T.K.; writing—review and editing, S.-Y.O. and T.K.; visualization, S.-Y.O. and T.K.; supervision, S.-Y.O. and T.K.; project administration, T.K.; funding acquisition, T.K. All authors have read and agreed to the published version of the manuscript.

Funding

This research was funded by the Ministry of Oceans and Fisheries, Korea (grant number 20210642, “Development of 3-D Ocean Current Observation Technology for Efficient Response to Maritime Distress”.

Institutional Review Board Statement

This research was approved by the Inha University Institutional Animal Use and Care Committee (INHA 210811-785).

Informed Consent Statement

Not applicable.

Data Availability Statement

The datasets generated and/or analyzed during the current study are available from the corresponding author on reasonable request.

Conflicts of Interest

The authors declare no conflict of interest. The funders had no role in the design of the study; in the collection, analyses, or interpretation of data; in the writing of the manuscript; or in the decision to publish the results.

References

  1. Wilber, D.H.; Clarke, D.G. Biological Effects of Suspended Sediments: A Review of Suspended Sediment Impacts on Fish and Shellfish with Relation to Dredging Activities in Estuaries. N. Am. J. Fish. Manag. 2001, 21, 855–875. [Google Scholar] [CrossRef]
  2. Cho, S.H.; Lee, S.-M.; Park, B.H. Effect of feeding ratio on growth and body composition of juvenile olive flounder Paralichthys olivaceus fed extruded pellets during the summer season. Aquaculture 2006, 251, 78–84. [Google Scholar] [CrossRef]
  3. Oh, S.Y.; Noh, C.H.; Cho, S.Y. Effect of restricted feeding regimes on compensatory growth and body consumption of red sea bream, Pagrus major. J. World Aquac. Soc. 2007, 38, 443–449. [Google Scholar] [CrossRef]
  4. Urbinati, E.C.; Sarmiento, S.J.; Takahashi, L.S. Short-term cycles of feed deprivation and refeeding promote full compensatory growth in the Amazon fish matrinxa, Brycon amazonicus. Aquaculture 2014, 235, 273–283. [Google Scholar] [CrossRef]
  5. Oh, S.-Y.; Park, J. Effect of feed deprivation on compensatory growth in juvenile rock bream Oplegnathus fasciatus. Fish. Sci. 2019, 85, 813–819. [Google Scholar] [CrossRef]
  6. Assis, Y.P.A.S.; Porto, L.D.A.; Melo, N.; Palheta, G.D.A.; Luz, R.K.; Favero, G.C. Feed restriction as a feeding management strategy in Colossoma macropomum juveniles under recirculating aquaculture system (RAS). Aquaculture 2020, 529, 735689. [Google Scholar] [CrossRef]
  7. Ali, M.; Nicieza, A.; Wootton, R.J. Compensatory growth in fishes: A response to growth depression. Fish Fish. 2003, 4, 147–190. [Google Scholar] [CrossRef]
  8. Oh, S.Y.; Noh, C.H.; Kang, R.S. Compensatory growth and body consumption of juvenile black rockfish, Sebastes schlegeli following feed deprivation. Fish Sci. 2008, 74, 846–852. [Google Scholar] [CrossRef]
  9. Hayward, R.S.; Noltie, D.B.; Wang, N. Use of Compensatory Growth to Double Hybrid Sunfish Growth Rates. Trans. Am. Fish. Soc. 1997, 126, 316–322. [Google Scholar] [CrossRef]
  10. Jobling, M.; Meløy, O.; Dos Santos, J.; Christiansen, B. The compensatory growth response of the Atlantic cod: Effects of nutritional history. Aquac. Int. 1994, 2, 75–90. [Google Scholar] [CrossRef]
  11. de Macêdo, S.; de Almeida, O.C.; Lucena, J.E.C.; de Madeiro Torres, M.B.A.; de Alemeida Bicudo, J. Combined effects of dietary starch: Protein ratios and short cycles of fasting/refeeding on Nile tilapia growth and liver health. Aquac. Res. 2020, 52, 1139–1149. [Google Scholar] [CrossRef]
  12. Mattila, J.; Koskela, J.; Pirhonen, J. The effect of the length of repeated feed deprivation between single meals on compensatory growth of pikeperch Sander lucioperca. Aquaculture 2009, 296, 65–70. [Google Scholar] [CrossRef]
  13. Bolivar, R.B.; Jimenez, E.B.T.; Brown, C.L. Alternate-Day Feeding Strategy for Nile Tilapia Grow Out in the Philippines: Marginal Cost-Revenue Analyses. N. Am. J. Aquac. 2006, 68, 192–197. [Google Scholar] [CrossRef]
  14. Oh, S.-Y.; Kim, M.-S.; Kwon, J.Y.; Maran, B.A.V. Effects of feed restriction to enhance the profitable farming of blackhead seabream Acanthopagrus schlegelii schlegelii in sea cages. Ocean Sci. J. 2013, 48, 263–268. [Google Scholar] [CrossRef]
  15. Morshedi, V.; Kochanian, P.; Bahmani, M.; Yazdani, M.; Pourali, H.; Ashouri, G.; Pasha-Zanoosi, H. Cyclical short-term starvation and refeeding provokes compensatory growth in sub-yearling Siberian sturgeon, Acipenser baerii Brandt, 1869. Anim. Feed Sci. Technol. 2017, 232, 207–214. [Google Scholar] [CrossRef]
  16. Roa, F.G.B.; Silva, S.S.; Hoshiba, M.A.; Silva, L.K.S.; de Barros, A.F.; de Abreu, J.S. Production performance of tambaqui juveniles subjected to short feed-deprivation and refeeding cycles. Bol. Inst. Pesca 2019, 45, 1–9. [Google Scholar] [CrossRef]
  17. de Souza e Silva, W.; Hisano, H.; Mattioli, C.C.; Torres, I.F.A.; de Oliveira Paes-Leme, F.; Luz, R.K. Effects of cyclical short-term fasting and refeeding on juvenile Lophiosilurus alexandri, a carnivorous Neotropical catfish. Aquaculture 2019, 505, 12–17. [Google Scholar] [CrossRef]
  18. Zhou, C.W.; Yang, Q.; Cai, D.L. On the classification and distribution of the Sinipercinae fishes (Family Serranidae). Zool. Res. 1988, 9, 113–126. [Google Scholar]
  19. Zhang, L.; Wang, Y.J.; Hu, M.H.; Fan, Q.X.; Cheung, S.G.; Shin, P.K.S.; Li, H.; Cao, L. Effect of the timing of initial feeding on growth and survival of spotted mandarin fish Siniperca scherzeri larvae. J. Fish Biol. 2009, 75, 1158–1172. [Google Scholar] [CrossRef] [Green Version]
  20. Sankian, Z.; Khosravi, S.; Kim, Y.-O.; Lee, S.-M. Dietary protein requirement for juvenile mandarin fish, Siniperca scherzeri. J. World Aquac. Soc. 2018, 50, 34–41. [Google Scholar] [CrossRef] [Green Version]
  21. Liang, X.F.; Liu, J.K.; Huang, B.Y. The role of sense organs in the feeding behavior of Chinese perch. J. Fish Biol. 1998, 52, 1058–1067. [Google Scholar] [CrossRef]
  22. Su, S.Q.; Zhang, H.Q.; He, Z.Y.; Zhang, Z.X. A comparative study of the nutrients and amino acid composition of the muscle of Siniperca chuatsi and Siniperca scherzeri. J. SW Agricult. Univ. 2005, 27, 898–901. [Google Scholar]
  23. Bureau, D.P.; Hua, K.; Cho, C.Y. Effect of feeding level on growth and nutrient deposition in rainbow trout (Oncorhynchus mykiss Walbaum) growing from 150 to 600 g. Aquac. Res. 2006, 37, 1090–1098. [Google Scholar] [CrossRef]
  24. Yuan, Y.-C.; Yang, H.-J.; Gong, S.-Y.; Luo, Z.; Yuan, H.-W.; Chen, X.-K. Effects of feeding levels on growth performance, feed utilization, body composition and apparent digestibility coefficients of nutrients for juvenile Chinese sucker, Myxocyprinus asiaticus. Aquac. Res. 2009, 41, 1030–1042. [Google Scholar] [CrossRef]
  25. Lee, S.-M.; Cho, S.H.; Kim, D.-J. Effects of feeding frequency and dietary energy level on growth and body composition of juvenile flounder, Paralichthys olivaceus (Temminck & Schlegel). Aquac. Res. 2000, 31, 917–921. [Google Scholar] [CrossRef]
  26. Kim, Y.O.; Oh, S.Y.; Kim, T.W. Effects of the feeding rate on growth performance, body composition, and hematological properties of juvenile mandarin Siniperca scherzeri in recirculating aquaculture system. Sustainability 2021, 13, 8257. [Google Scholar] [CrossRef]
  27. Sankian, Z.; Khosravi, S.; Kim, Y.O.; Lee, S.M. Effect of dietary protein and lipid level on growth, feed utilization and muscle composition in golden mandarin fish, Siniperca scherzeri. Fish Aquat. Sci. 2017, 20, 7. [Google Scholar] [CrossRef]
  28. Sankian, Z.; Khosravi, S.; Kim, Y.O.; Lee, S.M. Effects of dietary inclusion of yellow mealworm (Tenebrio molitor) meal on growth performance, feed utilization, body composition, plasma biochemical indices, selected immune parameters and antioxidant enzyme activities of mandarin fish Siniperca scherzeri juveniles. Aquaculture 2018, 496, 79–87. [Google Scholar]
  29. Sankian, Z.; Khosravi, S.; Kim, Y.-O.; Lee, S.-M. Total replacement of dietary fish oil with alternative lipid sources in a practical diet for mandarin fish, Siniperca scherzeri, juveniles. Fish. Aquat. Sci. 2019, 22, 8. [Google Scholar] [CrossRef]
  30. Mo, A.J.; Sun, J.X.; Wang, Y.H.; Yang, K.; Yang, H.S.; Yuan, Y.C. Apparent digestibility of protein, energy and amino acids in nine protein sources at two content levels for mandarin fish, Siniperca chuatsi. Aquaculture 2018, 499, 42–50. [Google Scholar] [CrossRef]
  31. Kim, Y.O.; Oh, S.Y.; Lee, S.M. Influence of different feeding frequency on the growth and body composition of juvenile man-darin fish Siniperca scherzeri reared in a recirculating aquaculture system (RAS). Korean Soc. Fish Aquatic. Sci. 2020, 53, 538–543. [Google Scholar]
  32. Kim, Y.O.; Oh, S.Y.; Lee, W.S. Feeding ratio affects growth, body composition, and blood chemistry of mandarin (Siniperca scherzeri) in recirculating aquaculture system. Fish Aquat. Sci. 2021, 24, 219–227. [Google Scholar] [CrossRef]
  33. AOAC. Official Methods of Analysis, 16th ed.; Association of Official Analytical Chemists: Arlington, VA, USA, 1995. [Google Scholar]
  34. Oh, S.-Y.; Kang, R.-S.; Myoung, J.-G.; Kim, C.-K.; Park, J.; Daniels, H.V. Effect of Ration Size Restriction on Compensatory Growth and Proximate Composition of Dark-banded Rockfish, Sebastes inermis. J. World Aquac. Soc. 2010, 41, 923–930. [Google Scholar] [CrossRef]
  35. Yokoyama, H.; Takashi, T.; Ishihi, Y.; Abo, K. Effects of restricted feeding on growth of red sea bream and sedimentation of aquaculture wastes. Aquaculture 2009, 286, 80–88. [Google Scholar] [CrossRef]
  36. Yilmaz, H.A.; Eroldogan, O.T. Combined effects of cycled starvation and feeding frequency on growth and oxygen consump-tion of gilthead sea bream, Sparus aurata. J. World Aquac. Soc. 2011, 42, 522–529. [Google Scholar] [CrossRef]
  37. Reigh, R.C.; Williams, M.B.; Jacob, B.J. Influence of repetitive periods of fasting and satiation feeding on growth and production characteristics of channel catfish, Ictalurus punctatus. Aquaculture 2006, 254, 506–516. [Google Scholar] [CrossRef]
  38. Mohseni, M.; Pourkazemi, M.; Hosseni, M.R.; Hassani, M.H.S.; Bai, S.C. Effects of the dietary protein levels and the protein to energy ratio in sub-yearling Persian sturgeon, Acipenser persicus (Borodin). Aquac. Res. 2011, 44, 378–387. [Google Scholar] [CrossRef]
  39. Jafari, N.; Falahatkar, B.; Sajjadi, M.M. Growth performance and plasma metabolites in juvenile Siberian sturgeon Acipenser baerii (Brandt, 1869) subjected to various feeding strategies at different sizes. Fish Physiol. Biochem. 2018, 44, 1363–1374. [Google Scholar] [CrossRef]
  40. Zhu, X.; Xie, S.; Lei, W.; Cui, Y.; Yang, Y.; Wootton, R. Compensatory growth in the Chinese longsnout catfish, Leiocassis longirostris following feed deprivation: Temporal patterns in growth, nutrient deposition, feed intake and body composition. Aquaculture 2005, 248, 307–314. [Google Scholar] [CrossRef]
  41. Xie, S.; Zhu, X.; Cui, Y.; Wootton, R.J.; Lei, W.; Yang, Y. Compensatory growth in gibel carp following feed deprivation: Temporal patterns in growth, nutrient deposition, feed intake and body composition. J. Fish Biol. 2001, 58, 999–1009. [Google Scholar] [CrossRef]
  42. Peres, H.; Satos, S.; Oliva-Teles, A. Lake of compensatory growth response in gilthead seabream, Sparus aurata juvenile following starvation and subsequent refeeding. Aquaculture 2011, 318, 384–388. [Google Scholar] [CrossRef]
  43. Tian, X.; Qin, J.G. A single phase of food deprivation provoked compensatory growth in barramundi, Lates calcarifer. Aquaculture 2003, 224, 169–179. [Google Scholar] [CrossRef]
  44. Wang, Y.; Cui, Y.; Yang, Y.; Cai, F. Compensatory growth in hybrid tilapia, Oreochromis mossambicus × O. niloticus, reared in seawater. Aquaculture 2000, 189, 101–108. [Google Scholar] [CrossRef]
  45. Sevgili, H.; Hossu, B.; Emre, Y.; Kanyilmaz, M. Effect of various lengths of single-phase starvation on compensatory growth in rainbow trout under summer conditions (Oncorhynchus mykiss). Turk. J. Fish Aquat. Sci. 2013, 13, 465–477. [Google Scholar] [CrossRef]
  46. Henken, A.; Kleingeld, D.; Tijssen, P. The effect of feeding level on apparent digestibility of dietary dry matter, crude protein and gross energy in the African catfish Clarias gariepinus (Burchell, 1822). Aquaculture 1985, 51, 1–11. [Google Scholar] [CrossRef]
  47. Baloi, M.; Sterzelecki, F.; Sugai, J.; Passini, G.; Carvalho, C.; Cerqueira, V. Growth performance, body composition and metabolic response to feeding rates in juvenile Brazilian sardine Sardinella brasiliensis. Aquac. Nutr. 2017, 23, 1458–1466. [Google Scholar] [CrossRef]
  48. Russel, N.R.; Wotton, R.J. Appetite and growth compensation in the European minnow, Phoxinus (Cyprinidae), following short periods of food restriction. Environ. Biol. Fish 1992, 34, 277–285. [Google Scholar] [CrossRef]
  49. Qian, X.; Cui, Y.; Xiong, B.; Yang, Y. Compensatory growth, feed utilization and activity in gibel carp, following feed deprivation. J. Fish Biol. 2000, 56, 228–232. [Google Scholar] [CrossRef]
  50. Foss, A.; Imsland, A.K.; Vikingstad, E.; Stefansson, S.O.; Norberg, B.; Pedersen, S.; Sandvik, T.; Roth, B. Compensatory growth in Atlantic halibut: Effect of starvation and subsequent feeding on growth, maturation, feed utilization and flesh quality. Aquaculture 2009, 290, 304–310. [Google Scholar] [CrossRef]
  51. Wang, Y.; Cui, Y.; Yang, Y.; Cai, F. Partial compensatory growth in hybrid tilapia Oreochromis mossambicus × O. niloticus following food deprivation. J. Appl. Ichthyol. 2005, 21, 389–393. [Google Scholar] [CrossRef]
  52. Blanquet, I.; Oliva-Teles, A. Effect of feed restriction on the growth performance of turbot (Scophthalmus maximus L.) juvenile under commercial rearing conditions. Aquac. Res. 2010, 41, 1255–1260. [Google Scholar]
  53. Känkänen, M.; Pirhonen, J. The effect of intermittent feeding on feed intake and compensatory growth of whitefish Coregonus lavaretus L. Aquaculture 2009, 288, 92–97. [Google Scholar] [CrossRef]
  54. Power, D.M.; Melo, J.; Santos, C.R.A. The effect of food deprivation and refeeding on the liver, thyroid hormones and trans-thyretin in sea bream. J. Fish Biol. 2000, 56, 374–387. [Google Scholar] [CrossRef]
  55. Peres, H.; Oliva-Teles, A. Protein and Energy Metabolism of European Seabass (Dicentrarchus labrax) Juveniles and Estimation of Maintenance Requirements. Fish Physiol. Biochem. 2005, 31, 23–31. [Google Scholar] [CrossRef]
  56. Jobling, M.; Johansen, S.J.S. The lipostat, hyperphagia and catch-up growth. Aquac. Res. 1999, 30, 473–478. [Google Scholar] [CrossRef]
  57. Johansen, S.J.S.; Ekli, M.; Stangnes, B.; Jobling, M. Weight gain and lipid deposition in Atlantic salmon, Salmo salar, during compensatory growth: Evidence for lipostatic regulation? Aquac. Res. 2001, 32, 963–974. [Google Scholar] [CrossRef]
  58. Gao, X.; Hong, L.; Liu, Z.; Guo, Z.; Wang, Y.; Lei, J. Body composition and compensatory growth in Nile tilapia Oreochromis niloticus under different feeding intervals. Chin. J. Oceanol. Limnol. 2015, 33, 945–956. [Google Scholar] [CrossRef]
  59. Tian, X.L.; Qin, R.G. Effects of previous ration restriction on compensatory growth in barramundi Lates calcarifer. Aquaculture 2004, 235, 273–283. [Google Scholar] [CrossRef]
  60. Agostinho, A.A.; Barbieri, G.; Verani, J.R.; Hahn, N.S. Variação do fator de condição e do índice hepatossomático e suas relações com o ciclo reprodutivo em Rhinelepis aspera (Agassis, 1829) (Osteichthyes, Loricariidae) no rio Paranapanema, Porecatu, PR. Cienc. Cult. 1990, 42, 711–714. [Google Scholar]
  61. Cyrino, J.E.P.; Portz, L.; Martino, R.C. Protein and energy retention by juvenile largemouth bass Micropterus salmoides. Sci. Agric. 2000, 57, 609–616. [Google Scholar] [CrossRef] [Green Version]
  62. Torstensen, B.E.; Tocher, D.R. The effects of fish oil replacement on lipid metabolism of fish. In Fish Oil Replacement and Alternative Lipid Sources in Aquaculture Feeds; Turchini, G.M., Ng, W.K., Tocher, D.R., Eds.; Taylor & Francis: Abingdon, UK, 2011; pp. 405–437. [Google Scholar]
  63. McCue, M.D. Starvation physiology: Reviewing the different strategies animals use to survive a common challenge. Comp. Biochem. Physiol. Part A Mol. Integr. Physiol. 2010, 156, 1–18. [Google Scholar] [CrossRef] [PubMed]
  64. Jobling, M. Some observations on the effects of feeding frequency on the food intake and growth of plaice, Pleuronectes platessa L. J. Fish Biol. 1982, 20, 431–444. [Google Scholar] [CrossRef]
  65. Rehulka, J.; MinaRik, B.; Rehulkova, E. Red blood cell indices of rainbow trout Oncorhynchus mykiss (Walbaum) in aquaculture. Aquac. Res. 2004, 35, 529–546. [Google Scholar] [CrossRef]
  66. Abdel-Tawwab, M.; Khattab, Y.A.E.; Ahmad, M.H.; Shalaby, A.M.E. Compensatory growth, feed utilization, whole-body composition, and hematological changes in starved juvenile Nile tilapia (Oreochromis niloticus L.). J. Appl. Aquac. 2006, 18, 17–36. [Google Scholar] [CrossRef]
  67. Cho, Y.J.; Cho, S.H. Compensatory growth of olive flounder, Paralichthys olivaceus, fed extruded pellet with different feeding regimes. J. World Aquac. Soc. 2009, 40, 505–512. [Google Scholar] [CrossRef]
  68. Caruso, G.; Maricchiolo, G.; Micale, V.; Genovese, L.; Caruso, R.; Denaro, M.G. Physiological responses to starvation in the European eel (Anguilla anguilla): Effects on hematological, biochemical, non-specific immune parameters and skin structures. Fish Physiol. Biochem. 2010, 36, 71–83. [Google Scholar] [CrossRef]
  69. Caruso, G.; Denaro, M.G.; Caruso, R.; Genovese, L.; Mancari, F.; Maricchiolo, G. Short fasting and refeeding in red porgy (Pagrus pagrus, Linnaeus 1758): Response of some haematological, biochemical and non specific immune parameters. Mar. Environ. Res. 2012, 81, 18–25. [Google Scholar] [CrossRef]
  70. Falahatkar, B. The metabolic effects of feeding and fasting in beluga Huso huso. Mar. Environ. Res. 2012, 82, 69–75. [Google Scholar] [CrossRef]
  71. Chatzifotis, S.; Papadaki, M.; Despoti, S.; Roufidou, C.; Antonopoulou, E. Effect of starvation and re-feeding on reproductive indices, body weight, plasma metabolites and oxidative enzyme of sea bass (Dicentrachus labrax). Aquaculture 2011, 316, 53–59. [Google Scholar] [CrossRef]
  72. Favero, G.C.; Costa dos Santos, F.A.; Soares da Costa, G.J.; Cortezzi Pedras, P.P.; Lima Ferreira, A.; De Souza e Silva, W.; Soares Ferreira, N.; Neves, L.D.C.; Kennedy , R.L. Effects of short feed restriction cycles in Piaractus brachypomus juveniles. Aquaculture 2021, 536, 736465. [Google Scholar] [CrossRef]
  73. Heming, T.A.; Paleczny, E.J. Compositional changes in skin mucus and blood serum during starvation of trout. Aquaculture 1987, 66, 265–273. [Google Scholar] [CrossRef]
  74. Regost, C.; Arzel, J.; Cardinal, M.; Laroche, M.; Kaushik, S. Fat deposition and flesh quality in seawater reared, triploid brown trout (Salmo trutta) as affected by dietary fat levels and starvation. Aquaculture 2001, 193, 325–345. [Google Scholar] [CrossRef] [Green Version]
  75. Furné, M.; Morales, A.E.; Trenzado, C.E.; García-Gallego, M.; Hidalgo, M.C.; Domezain, A.; Rus, A.S. The metabolic effects of prolonged starvation and refeeding in sturgeon and rainbow trout. J. Comp. Physiol. B 2011, 182, 63–76. [Google Scholar] [CrossRef] [PubMed]
  76. Favero, G.C.; Gimbo, R.; Montoya, L.N.F.; Zanuzzo, F.S.; Urbinati, E.C. Fasting and refeeding lead to more efficient growth in lean pacu (Piaractus mesopotamicus). Aquac. Res. 2018, 49, 359–366. [Google Scholar] [CrossRef]
  77. Godavarthy, P.; Kumari, Y.S.; Bikshapathy, E. Starvation induced cholesterogenesis in hepatic and extra hepatic tissues of climbing Perch, Anabas testudineus (Bloch). Saudi J. Biol. Sci. 2012, 19, 489–494. [Google Scholar] [CrossRef] [PubMed] [Green Version]
Figure 1. Changes in body weight of juvenile leopard mandarin fish (Siniperca scherzeri) subjected to four feeding regimens across an 8-week trial: Control (C), fish fed continuously; F5, fish fasted for 5 days (days 10–14); F10, fish fasted for 10 days (days 5–14); and, F14, fish fasted for 14 days (days 1–14), prior to all fasted fish being fed to satiation. Values (mean ± standard error, n = 5 in weeks 0 and 2, n = 3 in weeks 4, 6 and 8) in the same column with dissimilar letters are significantly different (p < 0.05).
Animals 12 00889 g001
Figure 2. Changes in specific growth rate of juvenile leopard mandarin fish (Siniperca scherzeri) subjected to four feeding regimens across an 8-week trial: Control (C), fish fed continuously; F5, fish fasted for 5 days (days 10–14); F10, fish fasted for 10 days (days 5–14); and, F14, fish fasted for 14 days (days 1–14), prior to all fasted fish being fed to satiation. Values (mean ± standard error, n = 3) in the same column with dissimilar letters are significantly different (p < 0.05).
Animals 12 00889 g002
Figure 3. Changes in feeding rate of juvenile leopard mandarin fish (Siniperca scherzeri) subjected to four feeding regimens across an 8-week trial: Control (C), fish fed continuously; F5, fish fasted for 5 days (days 10–14); F10, fish fasted for 10 days (days 5–14); and, F14, fish fasted for 14 days (days 1–14), prior to all fasted fish being fed to satiation. Values (mean ± standard error, n = 3) in the same column with dissimilar letters are significantly different (p < 0.05).
Animals 12 00889 g003
Figure 4. Changes in feed efficiency of juvenile leopard mandarin fish (Siniperca scherzeri) subjected to four feeding regimens across an 8-week trial: Control (C), fish fed continuously; F5, fish fasted for 5 days (days 10–14); F10, fish fasted for 10 days (days 5–14); and, F14, fish fasted for 14 days (days 1–14), prior to all fasted fish being fed to satiation. Values (mean ± standard error, n = 3) in the same column with dissimilar letters are significantly different (p < 0.05).
Animals 12 00889 g004
Table 1. Condition factor (CF), coefficient of variation for body length (CVBL), and body weight (CVBW) of juvenile leopard mandarin fish (Siniperca scherzeri) subjected to four different feeding regimens for 8 weeks *.
TreatmentCFi
(%) 1
CFf
(%) 2
CVBLi
(%) 3
CVBLf
(%) 4
CVBWi
(%) 5
CVBWf
(%) 6
C1.07 ± 0.071.07 ± 0.0313.6 ± 0.209.0 ± 0.418.7 ± 0.8627.7 ± 1.13
F51.05 ± 0.011.09 ± 0.0313.4 ± 0.198.1 ± 1.113.7 ± 1.2427.2 ± 1.02
F101.06 ± 0.021.07 ± 0.0313.7 ± 0.167.8 ± 0.915.3 ± 1.8127.2 ± 0.81
F141.07 ± 0.011.10 ± 0.0313.6 ± 0.585.6 ± 0.716.0 ± 0.7627.5 ± 0.52
* Values (mean ± standard error, n = 5 in CFi, CVBLi and CVBWi, n = 3 in CFf, CVBLf and CVBWf) are not significantly different for any treatment (p > 0.05). 1 CFi (%) = (fish initial weight/(fish initial length)3) × 100. 2 CFf (%) = (fish final weight of fish/(fish final length)3) × 100. 3 CVBLi (%) = (standard deviation of initial fish length/mean initial fish length) × 100. 4 CVBLf (%) = (standard deviation of final fish length/mean final fish length) × 100. 5 CVBWi (%) = (standard deviation of initial fish weight/mean initial fish weight) × 100. 6 CVBWf (%) = (standard deviation of final fish weight/mean final fish weight of fish) × 100.
Table 2. Whole-body proximate composition (%, wet weight basis), hepatosomatic index (HSI), and viscerasomatic index (VSI) of juvenile leopard mandarin fish (Siniperca scherzeri) at the end of week 2 and week 8 in four different feeding groups *.
PeriodsVariablesTreatment
CF5F10F14
Week 2
(n = 2)
Moisture (%)70.6 ± 0.9 b73.5 ± 0.6 ab74.8 ± 0.2 ab77.3 ± 1.2 a
Crude protein (%)19.9 ± 0.818.3 ± 0.320.0 ± 0.219.9 ± 0.9
Crude lipid (%)4.7 ± 0.05 a3.7 ± 0.05 b3.5 ± 0.05 b2.9 ± 0.15 c
Ash (%)6.1 ± 0.16.0 ± 0.16.1 ± 0.16.1 ± 0.1
HSI (%) 12.5 ± 0.08 a1.7 ± 0.37 ab1.4 ± 0.14 b1.3 ± 0.06 b
VSI (%) 27.7 ± 0.40 a5.0 ± 0.22 b3.9 ± 0.55 c3.5 ± 0.14 c
Lipid/LBM 30.18 ± 0.01 a0.15 ± 0.01 b0.13 ± 0.01 bc0.10 ± 0.01 c
Week 8
(n = 3)
Moisture (%)69.5 ± 0.471.8 ± 0.472.2 ± 0.472.0 ± 0.2
Crude protein (%)19.5 ± 0.719.5 ± 0.319.8 ± 0.219.7 ± 0.5
Crude lipid (%)3.7 ± 0.23.6 ± 0.43.4 ± 0.33.6 ± 0.3
Ash (%)6.5 ± 0.26.0 ± 0.35.6 ± 0.25.9 ± 0.1
HSI (%) 11.3 ± 0.06 b1.6 ± 0.08 a1.7 ± 0.09 a1.7 ± 0.02 a
VSI (%) 24.6 ± 0.064.5 ± 0.284.6 ± 0.194.8 ± 0.21
Lipid/LBM 30.14 ± 0.010.14 ± 0.020.13 ± 0.010.14 ± 0.01
* Values (mean ± standard error) with different superscripts in the same row are significantly different (p < 0.05). 1 HSI (%) = (liver weight/fish weight) × 100. 2 VSI (%) = (liver weight/fish weight) × 100. 3 Lipid/LBM, ratio of lipids to sum of protein and ash.
Table 3. Plasma chemical composition of juvenile leopard mandarin fish (Siniperca scherzeri) at the end of week 2 and week 8 week in four different feeding groups *.
Periods CF5F10F14
Week 2
(n = 2)
Hb (g dL−1) 17.8 ± 0.288.0 ± 0.367.7 ± 0.177.8 ± 0.15
GLU (mg dL−1) 2150.3 ± 12.7 b141.0 ± 14.2 b177.3 ± 14.3 ab232.9 ± 17.2 a
TCHO (mg dL−1) 3170.4 ± 3.55 a169.7 ± 4.07 a159.9 ± 3.25 ab150.0 ± 2.82 b
GOT (U L−1) 4395.1 ± 23.7387.1 ± 14.2375.5 ± 18.2333.3 ± 10.6
GPT (U L−1) 5129.2 ± 5.2143.9 ± 6.6150.1 ± 7.0139.6 ± 6.0
HDLC (U L−1) 6108.2 ± 1.60109.1 ± 0.77107.9 ± 1.51108.1 ± 0.94
Week 8
(n = 3)
Hb (g dL−1) 17.3 ± 0.97.5 ± 0.66.6 ± 0.66.7 ± 0.5
GLU (mg dL−1) 2138.0 ± 10.1141.0 ± 8.5139.7 ± 6.36138.3 ± 7.33
TCHO (mg dL−1) 3143.3 ± 8.5143.8 ± 3.3137.0 ± 1.7143.0 ± 8.3
GOT (U L−1) 4226.8 ± 14.0249.0 ± 15.1274.5 ± 11.6223.3 ± 9.5
GPT (U L−1) 571.0 ± 8.664.6 ± 5.453.5 ± 2.544.3 ± 2.7
HDLC (U L−1) 698.5 ± 5.199.8 ± 2.798.0 ± 0.998.3 ± 4.5
* Values (mean ± standard error) with different superscripts in the same row are significantly different (p < 0.05). 1 Hb = hemoglobin. 2 GLU = glucose. 3 TCHO = total cholesterol. 4 GOT = glutamic oxaloacetic transaminase. 5 GPT = glutamic pyruvic transaminase. 6 HDLC = high density lipoprotein cholesterol.
Publisher’s Note: MDPI stays neutral with regard to jurisdictional claims in published maps and institutional affiliations.

