
Effect of Different Finishing Strategies and Steer Temperament on Animal Welfare and Instrumental Meat Tenderness

 , ,
, ,
Abstract
Simple Summary
Abstract
1. Introduction
2. Materials and Methods
2.1. Field Determinations
2.1.1. Productivity
2.1.2. Temperament
2.1.3. Physiology
2.1.4. Behavior
2.1.5. Health Status
2.2. Postmortem Determinations
2.3. Statystical Analysis
2.3.1. Productivity
2.3.2. Temperament
2.3.3. Physiology
2.3.4. Behavior
2.3.5. Carcass and Meat Quality
3. Results and Discussion
3.1. Field Determinations
3.1.1. Productivity
3.1.2. Temperament
3.1.3. Physiology
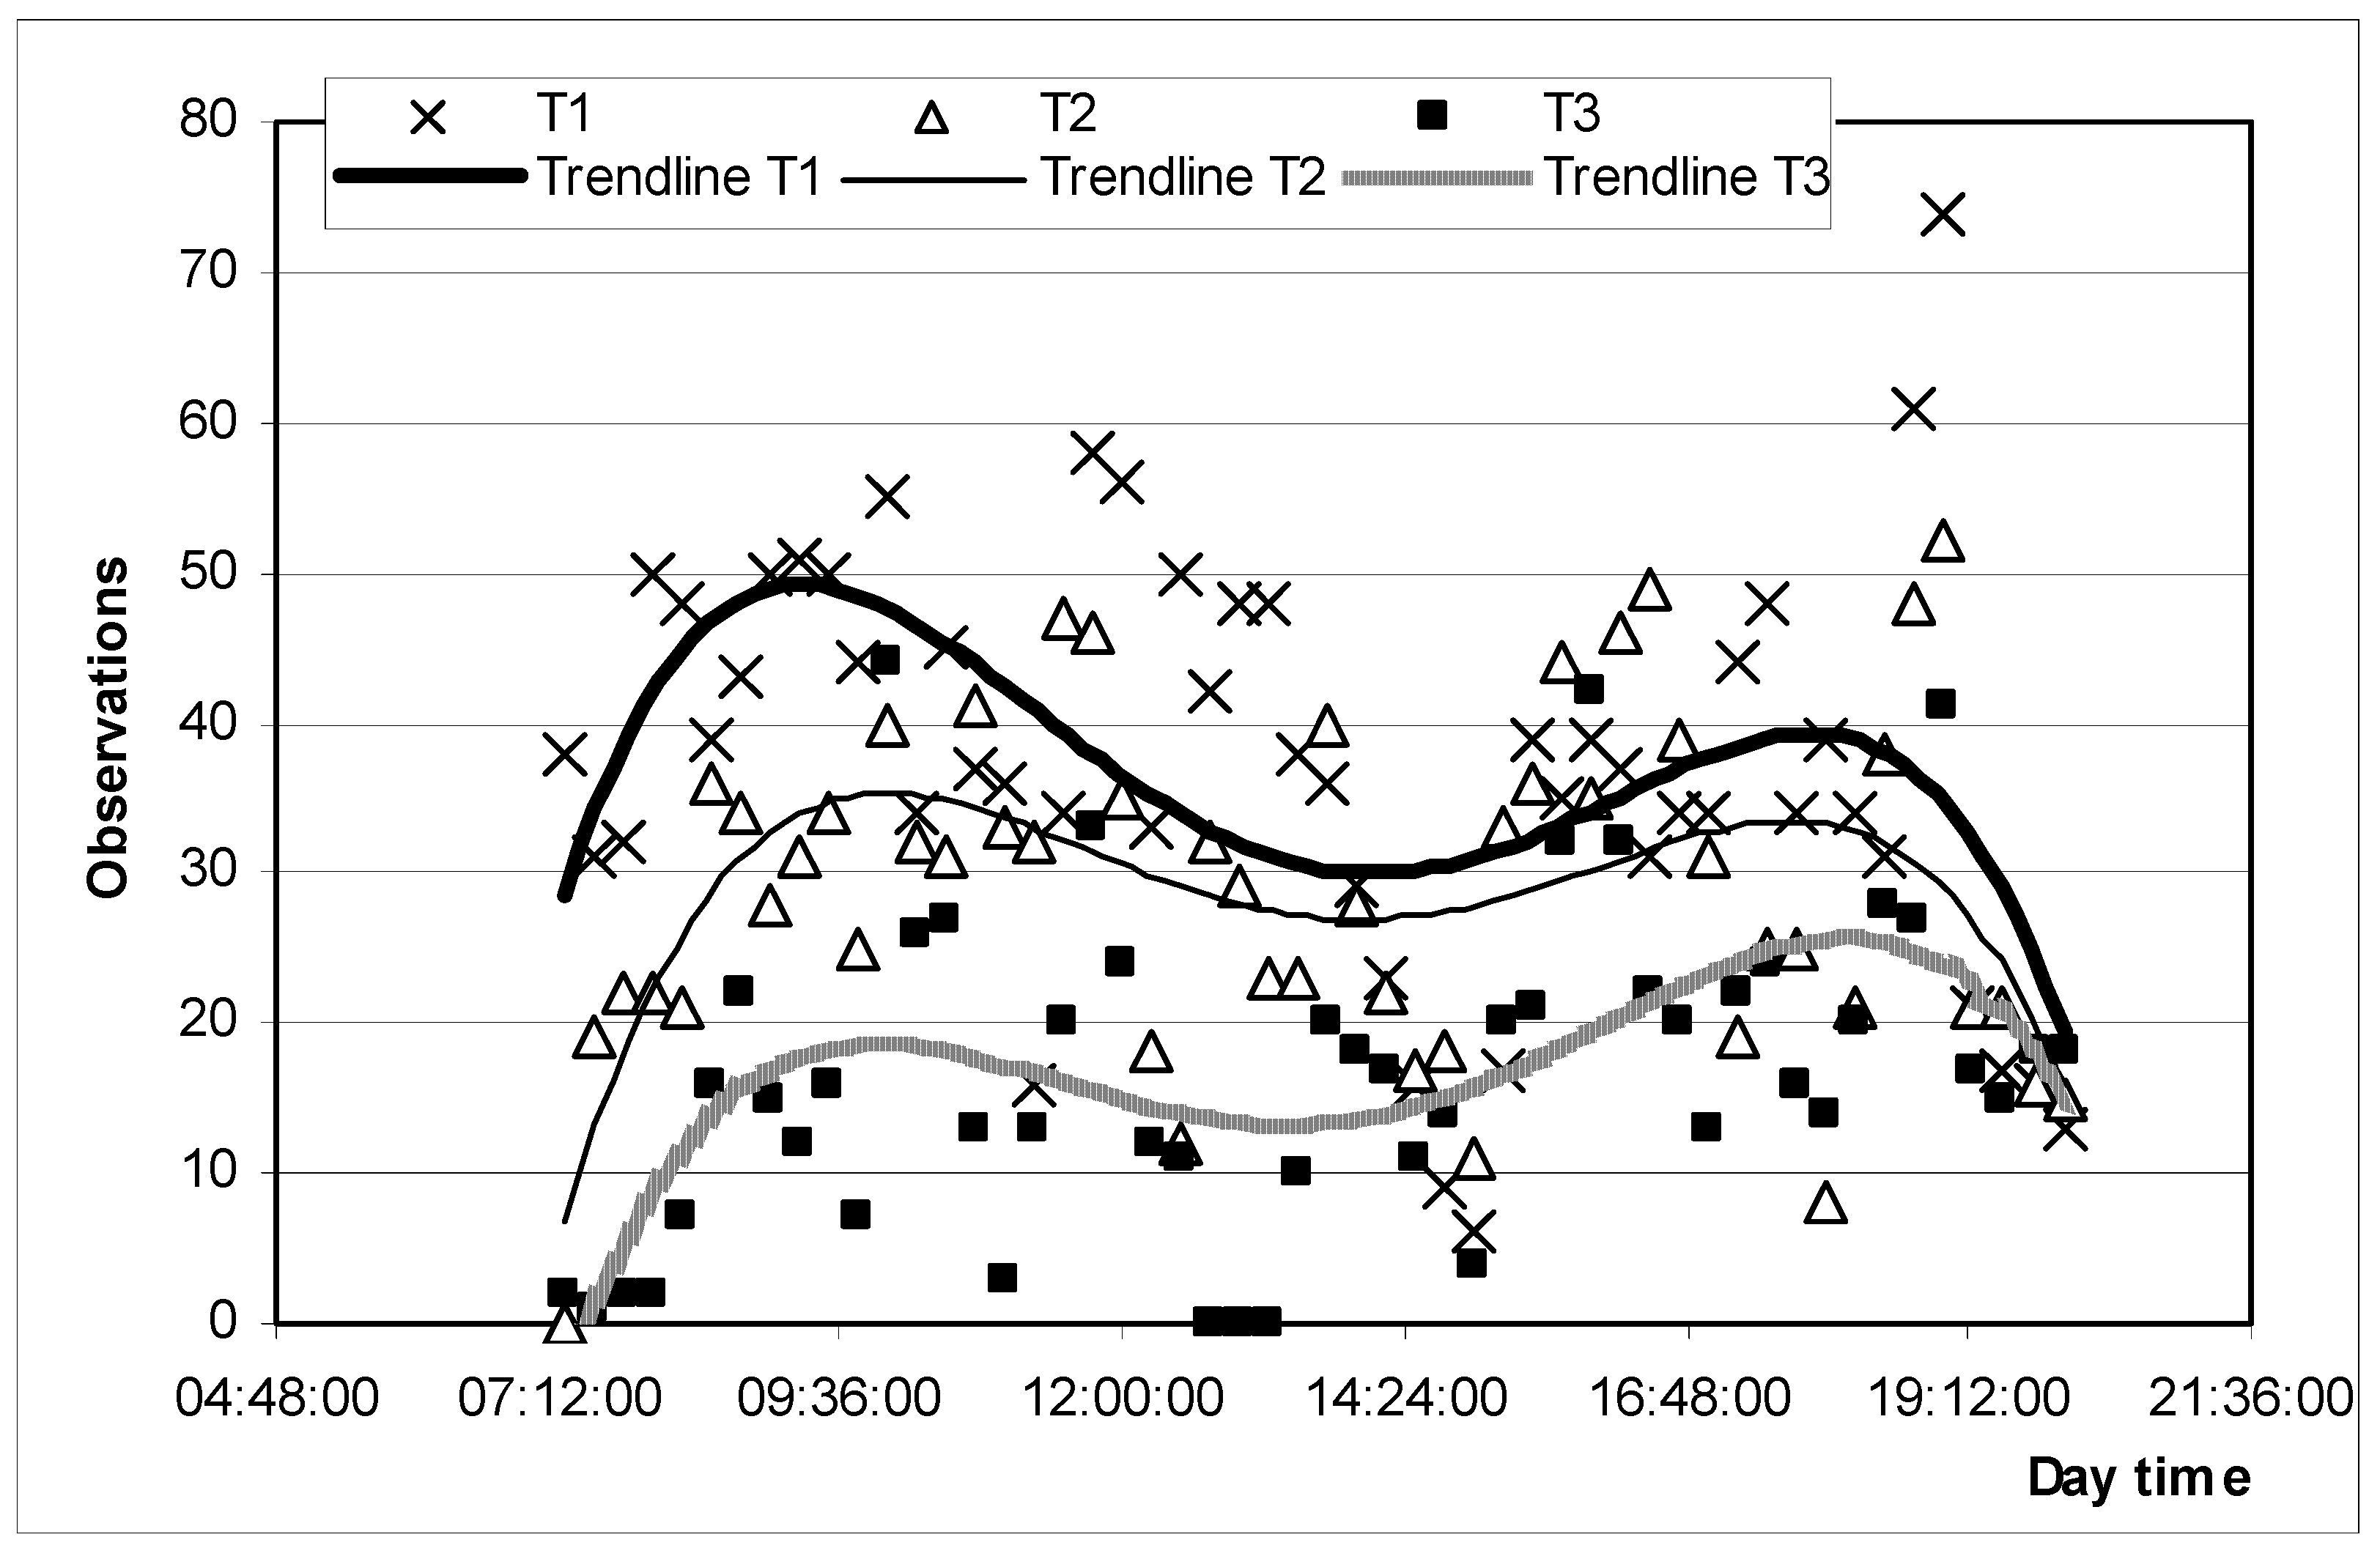
3.1.4. Behavior
3.1.5. Health Status
3.2. Postmortem Determinations
4. Conclusions
Author Contributions
Funding
Institutional Review Board Statement
Acknowledgments
Conflicts of Interest
References
- Dunston-Clarke, E.; Willis, R.S.; Fleming, P.A.; Barnes, A.L.; Miller, D.W.; Collins, T. Developing an Animal Welfare As-sessment Protocol for Livestock Transported by Sea. Animals 2020, 10, 705. [Google Scholar] [CrossRef] [PubMed]
- Kaurivi, Y.B.; Laven, R.; Hickson, R.; Parkinson, T.; Stafford, K.J. Developing an Animal Welfare Assessment Protocol for Cows in Extensive Beef Cow–Calf Systems in New Zealand. Part 1: Assessing the Feasibility of Identified Animal Welfare Assessment Measures. Animals 2020, 10, 1597. [Google Scholar] [CrossRef]
- D’Alessandro, A.G.; Maiorano, G.; Kowaliszyn, B.; Loiudice, P.; Martemucci, G. How the nutritional value and consumer acceptability of suckling lambs meat is affected by the maternal feeding system. Small Rumin. Res. 2012, 106, 83–91. [Google Scholar] [CrossRef]
- Stampa, E.; Schipmann-Schwarze, C.; Hamm, U. Consumer perceptions, preferences, and behavior regarding pasture-raised livestock products: A review. Food Qual. Prefer. 2020, 82, 103872. [Google Scholar] [CrossRef]
- Montossi, F.; Font-i-Furnols, M.; del Campo, M.; San Julián, R.; Brito, G.; Sañudo, C. Sustainable sheep production and con-sumer preference trends: Compatibilities, contradictions, and unresolved dilemmas. Meat Sci. 2013, 95, 772–789. [Google Scholar] [CrossRef]
- Fernandes, J.N.; Hemsworth, P.H.; Coleman, G.J.; Tilbrook, A.J. Costs and Benefits of Improving Farm Animal Welfare. Agric. 2021, 11, 104. [Google Scholar] [CrossRef]
- Rojas, H.; Stuardo, L.; Benavides, D. Políticas y prácticas de bienestar animal em los países de América, Estudio preliminar. Rev. Sci. Et Tech. -Off. Int. Des Epizoot. 2005, 24, 549–565. [Google Scholar] [CrossRef]
- Del Campo, M.; Brito, G.; Montossi, F.; De Lima, J.S.; Julián, R.S. Animal welfare and meat quality: The perspective of Uruguay, a “small” exporter country. Meat Sci. 2014, 98, 470–476. [Google Scholar] [CrossRef]
- Burrow, H.M.; Seifert, G.W.; Corbet, N.J. A new technique for measuring temperament in cattle. Proc. Aust. Soc. Anim. Prod. 1988, 17, 154–157. [Google Scholar]
- Fordyce, G.; Goddard, M.E.; Seifert, G.W. The measurement of temperament in cattle and the effect of experience and geno-type. Proc. Aust. Soc. Anim. Prod. 1982, 14, 329–332. [Google Scholar]
- Grandin, T.; Deesing, M.J. Genetics and behaviour during handling, restraint, and herding. In Genetics and the Behavior of Domestic Animals; Grandin, T., Ed.; Academic Press: San Diego, CA, USA, 1998; p. 113. [Google Scholar]
- Hemsworth, P.; Barnett, J.; Tilbrook, A.; Hansen, C. The effects of handling by humans at calving and during milking on the behaviour and milk cortisol concentrations of primiparous dairy cows. Appl. Anim. Behav. Sci. 1989, 22, 313–326. [Google Scholar] [CrossRef]
- Le Neindre, P.; Trillat, G.; Sapa, J.; Ménissier, F.; Bonnet, J.N.; Chupin, J.M. Individual differences in docility in Limousin Cattlej. Anim. Sci. 1995, 73, 2249–2253. [Google Scholar] [CrossRef]
- Hearnshaw, H.; Morris, C. Genetic and environmental effects on a temperament score in beef cattle. Aust. J. Agric. Res. 1984, 35, 723–733. [Google Scholar] [CrossRef]
- Costa, Franciely De Oliveira. Evaluation of Maternal Protective Behavior of Nellore and Hereford Cows and the Potential Effects on Average Daily Gain in Calves. Ph.D. Thesis, Universidade Estadual Paulista, Faculdade de Ciências Agrárias e Veterinárias, Programa de Pós-Graduação em Zootecnia, Jaboticabal, SP, Brasil, 2017. Available online: http://hdl.handle.net/11449/151946 (accessed on 17 March 2021).
- Saaty, T.L. Analytic Hierarchy Pocess; McGrawHill: New York, NY, USA, 1980. [Google Scholar]
- Hiss, S.; Knura-Deszczka, S.; Regula, G.; Hennies, M.; Gymnich, S.; Petersen, B.; Sauerwein, H. Development of an enzyme immuno assay for the determination of porcine haptoglobin in various body fluids: Testing the significance of meat juice measurements for quality monitoring programs. Veter- Immunol. Immunopathol. 2003, 96, 73–82. [Google Scholar] [CrossRef]
- Morrow, C.J.; Kolver, E.S.; Verkerk, G.A.; Matthews, L.R. Faecal Glucocorticoid Metabolites as a Measure of Adrenal Activity in Dairy Cattle. Gen. Comp. Endocrinol. 2002, 126, 229–241. [Google Scholar] [CrossRef]
- Martin, P.; Bateson, P. Measuring Behaviour; Cambridge University Press: Cambridge, UK, 1993. [Google Scholar]
- SAS Institute Inc. SAS® 9.4; SAS Institute: Cary, NC, USA, 2014. [Google Scholar]
- SPSS Inc. SPSS for Windows, Version 16; SPSS Inc.: Chicago, IL, USA, 2007. [Google Scholar]
- French, P.; O’Riordan, E.; Monahan, F.; Caffrey, P.; Vidal, M.; Mooney, M.; Troy, D.; Moloney, A. Meat quality of steers finished on autumn grass, grass silage or concentrate-based diets. Meat Sci. 2000, 56, 173–180. [Google Scholar] [CrossRef]
- French, P.; O’Riordan, E.; Monahan, F.; Caffrey, P.; Mooney, M.; Troy, D.; Moloney, A. The eating quality of meat of steers fed grass and/or concentrates. Meat Sci. 2001, 57, 379–386. [Google Scholar] [CrossRef]
- del Campo, M.; Brito, G.; De Lima, J.S.; Martins, D.V.; Sanudo, C.; Julián, R.S.; Hernandez, P.; Montossi, F. Effects of feeding strategies including different proportion of pasture and concentrate, on carcass and meat quality traits in Uruguayan steers. Meat Sci. 2008, 80, 753–760. [Google Scholar] [CrossRef] [PubMed]
- Hodgson, J. The relationship between the digestibility of a sward and the herbage consumption of grazing calves. J. Agric. Sci. 1968, 70, 47–51. [Google Scholar] [CrossRef]
- Tilbrook, A.J.; Ralph, C.R. Hormones, stress and the welfare of animals. Anim. Prod. Sci. 2018, 58, 408. [Google Scholar] [CrossRef]
- Veissier, I.; Sarignac, C.; Capdeville, J. Methods to asses the welfare of domestic animals. Prod. Anim. 1999, 12, 113–121. [Google Scholar]
- Grandin, T.; Deesing, M.J.; Struthers, J.J.; Swinker, A.M. Cattle with Hair Whorl Patterns Above the Eyes Are More Behav-iorally Agitated During Restraint. Appl. Anim. Behav. Sci. 1995, 46, 117–123. [Google Scholar] [CrossRef]
- Randle, H. Facial hair whorl position and temperament in cattle. Appl. Anim. Behav. Sci. 1998, 56, 139–147. [Google Scholar] [CrossRef]
- Voisinet, B.D.; Grandin, T.; Tatum, J.D.; O’Connor, S.F.; Struthers, J.J. Feedlot cattle with calm temperaments have higher average daily gains than cattle with excitable temperaments. J. Anim. Sci. 1997, 75, 892–896. [Google Scholar] [CrossRef] [PubMed]
- Burrow, H.M. Measurements of temperament and their relationships with performance traits of beef cattle. Anim. Breed. Abstr. 1997, 65, 477–495. [Google Scholar]
- Vetters, M.D.; Engle, T.E.; Ahola, J.K.; Grandin, T. Comparison of flight speed and exit score as measurements of tempera-ment in beef cattle. J. Anim. Sci. 2013, 91, 374–381. [Google Scholar] [CrossRef]
- Cafe, L.M.; Robinson, D.L.; Ferguson, D.M.; McIntyre, B.L.; Geesink, G.H.; Greenwood, P.L. Cattle temperament: Persistence of assessments and associations with productivity, efficiency, carcass and meat quality traits. J. Anim. Sci. 2011, 89, 1452–1465. [Google Scholar] [CrossRef]
- Silveira, I.D.B.; Fischer, V.; Farinatti, L.H.E.; Restle, J.; Filho, D.C.A.; De Menezes, L.F.G. Relationship between temperament with performance and meat quality of feedlot steers with predominantly Charolais or Nellore breed. Rev. Bras. De Zootec. 2012, 41, 1468–1476. [Google Scholar] [CrossRef]
- Francisco, C.L.; Castilhos, A.M.; Silva, D.C.; Silva, F.M.; Meirelles, P.R.; Cooke, R.F.; Jorge, A.M. Temperament of Nelore growing-steers receiving supplementation in grazing system: Performance, ultrasound measures, feeding behavior, and serum parameters. Livest. Sci. 2020, 241, 104203. [Google Scholar] [CrossRef]
- Francisco, C.L.; Resende, F.D.; Benatti, J.M.B.; Castilhos, A.M.; Cooke, R.F.; Jorge, A.M. Impacts of temperament on Nellore cattle: Physiological responses, feedlot performance, and carcass characteristics. Anim. Sci. 2015, 93, 5419–5429. [Google Scholar] [CrossRef]
- Rushen, J.; De Passille, A.M. The importance of good stockmanship and its benefits to animals. In Im-proving Animal Welfare: A Practical Approach, 2nd ed.; Grandin, T., Ed.; CABI Publishing: Cambridge, UK, 2020; pp. 125–2015. [Google Scholar]
- Hemsworth, P.H.; Coleman, G.J. The Stockperson and the Productivity and Welfare of Intensively Farmed Animals, 2nd ed.; Human Livestock Interactions: Cambridge, UK; CABI Publishing: Cambridge, UK, 2010. [Google Scholar]
- Barnett, J.; Hemsworth, P.; Hand, A. Effects of chronic stress on some blood parameters in the pig. Appl. Anim. Ethol. 1983, 9, 273–277. [Google Scholar] [CrossRef]
- Hemsworth, P.; Price, E.; Borgwardt, R. Behavioural responses of domestic pigs and cattle to humans and novel stimuli. Appl. Anim. Behav. Sci. 1996, 50, 43–56. [Google Scholar] [CrossRef]
- Mays, A.R.; Looper, M.L.; Williamson, B.C.; Coffey, K.P.; Coblentz, W.K.; Aiken, G.E.; Rosenkrans, C.F., Jr. Forage and breed effects on behavior and temperament of pregnant beef heifers. J. Anim. Sci. Biotechnol. 2013, 4, 20–24. [Google Scholar] [CrossRef] [PubMed]
- Ceballos, M.C.; Gois, K.C.R.; Sant’Anna, A.C.; Paranhos da Costa, M.J.R. Frequent handling of grazing beef cattle main-tained under the rotational stocking method improves temperament over time. Anim. Prod. Sci. 2018, 58, 307–313. [Google Scholar] [CrossRef]
- Grandin, T. Handling facilities and restraint in extensively raised range cattle. In Livestock Handling and Transport, 4th ed.; Grandin, T., Ed.; CABI Publishing: Cambridge, UK, 2014; p. 94. [Google Scholar]
- Uetake, K.; Morita, S.; Hoshiba, S.; Tanaka, T. Flight distance of dairy cows and its relationship to daily routine manage-ment procedures and productivity. Anim. Sci. J. 2002, 73, 279–285. [Google Scholar] [CrossRef]
- Eckersall, P.D. Recent advances and future prospects for the use of acuthe phase proteins as markers of disease in animals. Rev. De Médicine Vétérinaire 2000, 151, 577–584. [Google Scholar]
- Iliev, P.; Georgieva, T. Acute phase biomarkers of diseases in small ruminants: An overview. Bulg. J. Veter- Med. 2019, 22, 1–12. [Google Scholar] [CrossRef]
- Arthington, J.D.; Spears, J.W.; Millar, D.C. The effect of early weaning on feed lot performances and measures of stress in beef calves. J. Anim. Sci. 2005, 83, 933–939. [Google Scholar] [CrossRef]
- Johnson, R.W. Inhibition of growth by pro-inflammatory cytokines: An integrated view. J. Anim. Sci. 1997, 75, 1244–1255. [Google Scholar] [CrossRef]
- Murata, H.; Shimada, N.; Yoshioka, M. Current research on acute phase proteins in veterinary diagnosis: An overview. Veter- J. 2004, 168, 28–40. [Google Scholar] [CrossRef]
- Blecha, F. Immune system response to stress. In The Biology of Animal Stress: Basic Principles and Implications for Ani-Mal Welfare; CABI Publishing: New York, NY, USA, 2000. [Google Scholar]
- Broom, D.M. The effects of production efficiency on animal welfare. In EAAP Publication 67 “Biological Basis of Sustaina-ble Animal Production; Wageningen Press: Wageningen, The Netherlands, 1995; pp. 201–210. [Google Scholar]
- Scherpenhuizen, J.; Narayan, E.; Quinn, J.; Narayan, E. Timed environmental exposure indicates sample stability for reliable noninvasive measurement of fecal cortisol metabolite concentrations in sheep. Domest. Anim. Endocrinol. 2020, 72, 106423. [Google Scholar] [CrossRef] [PubMed]
- Harper, J.M.; Austad, S.N. Faecal glucocorticoids: A non-invasive method of measuring adrenal activity in wild and captive rodents. Physiol. Biochem. Zool. 2000, 73, 12–22. [Google Scholar] [CrossRef]
- Möstl, E.; Maggs, J.; Schrötter, G.; Besenfelder, U.; Palme, R. Measurement of Cortisol Metabolites in Faeces of Ruminants. Veter- Res. Commun. 2002, 26, 127–139. [Google Scholar] [CrossRef] [PubMed]
- GRAS. Climate, Remote sensing, and Information Systems Research & Development Unit (GRAS) of the National Agricul-Tural Research Institute (INIA), Uruguay. Available online: http://www.inia.org.uy/gras/computo/gras_planilla_variables_visualizar_diarias.php?id=62465&inicio=5620&filtro=2 (accessed on 1 March 2021).
- Salvin, H.E.; Lees, A.M.; Cafe, L.M.; Colditz, I.G.; Lee, C. Welfare of beef cattle in Australian feedlots: A review of the risks and measures. Anim. Prod. Sci. 2020, 60, 1569. [Google Scholar] [CrossRef]
- Belasco, E.J.; Cheng, Y.; Schroeder, T.C. The impact of extreme weather on cattle feeding profits. J. Agric. Resour. Econ. 2015, 40, 285–305. [Google Scholar]
- Mader, T.L.; Griffin, D. Management of Cattle Exposed to Adverse Environmental Conditions. Veter- Clin. N. Am. Food Anim. Pr. 2015, 31, 247–258. [Google Scholar] [CrossRef]
- Selye, H. The Stress of Life; McGraw-Hill: New York, NY, USA, 1956. [Google Scholar]
- Fisher, A.D.; Crowe, M.A.; Prendiville, D.J.; Enright, W.J. Indoor space allowance: Effects on growth, behaviour, adrenal and immune responses of finishing beef heifers. Anim. Sci. 1997, 64, 53–62. [Google Scholar] [CrossRef]
- Moberg, G.P. Biological response to stress: Implications for animal welfare. In The Biology of Animal Stress: Basic Principles and Implications for Animal Welfare; CABI Publishing: London, UK, 2009; pp. 1–21. [Google Scholar] [CrossRef]
- Romero, L. Physiological stress in ecology: Lessons from biomedical research. Trends Ecol. Evol. 2004, 19, 249–255. [Google Scholar] [CrossRef]
- Mormède, P.; Andanson, S.; Aupérin, B.; Beerda, B.; Guémené, D.; Malmkvist, J.; Manteca, X.; Manteuffel, G.; Prunet, P.; van Reenen, C.G.; et al. Review: Exploration of the hypothalamic–pituitary–adrenal function as a tool to eval-uate animal welfare. Physiol. Behav. 2007, 92, 317–339. [Google Scholar] [CrossRef]
- Anderson, S.M.; Saviolakis, G.A.; Bauman, R.A.; Chu, K.Y.; Ghosh, S.; Kant, G. Effects of chronic stress on food acquisition, plasma hormones, and the estrous cycle of female rats. Physiol. Behav. 1996, 60, 325–329. [Google Scholar] [CrossRef]
- Grandin, T.; Shivley, C. How Farm Animals React and Perceive Stressful Situations Such As Handling, Restraint, and Transport. Animals 2015, 5, 1233–1251. [Google Scholar] [CrossRef] [PubMed]
- Deiss, V.; Temple, D.; Ligout, S.; Racine, C.; Bouix, J.; Terlouw, C.; Boissy, A. Can emotional reactivity predict stress responses at slaughter in sheep? Appl. Anim. Behav. Sci. 2009, 119, 193–202. [Google Scholar] [CrossRef]
- Losada-Espinosa, N.; Villarroel, M.; María, G.A.; La Lama, G.C.M.-D. Pre-slaughter cattle welfare indicators for use in commercial abattoirs with voluntary monitoring systems: A systematic review. Meat Sci. 2018, 138, 34–48. [Google Scholar] [CrossRef]
- Bourguet, C.; Deiss, V.; Boissy, A.; Terlouw, E.C. Young Blond d’Aquitaine, Angus and Limousin bulls differ in emotional reactivity: Relationships with animal traits, stress reactions at slaughter and post-mortem muscle metabolism. Appl. Anim. Behav. Sci. 2015, 164, 41–55. [Google Scholar] [CrossRef]
- Galli, J.R.; Cangiano, C.A.; Fernández, H.H. Comportamiento ingestivo y consumo de bovinos en pastoreo. Rev. Argen-Tina Prod. Anim. 1996, 16, 119–142. [Google Scholar]
- Pazdiora, R.D.; Brondani, I.L.; Silveira, M.F.; Arboitte, M.Z.; Cattelam, J.; Paula, P.C. Efeitos da frequência de forneci-mento do volumoso e concentrado no comportamentoingestivo de vacas e novilhas em confinamento. Rev. Bras. De Zootec. 2011, 40, 2244. [Google Scholar] [CrossRef]
- Saini, A. Effect on feeding behaviour under different housing and feeding systems in Murrah heifers. Review. IAHRW. Ternational J. Soc. Sci. 2020, 8, 205–211. [Google Scholar]
- Rollin, B.E. Farm Animal Welfare: Social, Bioethical, and Research Issues/Bernard, 1st ed.; Rollin, E., Ed.; Ames, Iowa State University Press: Iowa City, IA, USA; Blackwell Publishing: Iowa City, IA, USA, 2003. [Google Scholar]
- Fraser, D. Assesing animal well being: Common sense, uncommon science. Food animal well being. In Conference ProCeedings and Deliberations; Purdue University: West Lafayette, IN, USA, 1993. [Google Scholar]
- Wagnon, K.A. Behaviour of beef cows on a California range. California Agric. Ext. Ser. Bull. 1963, 799, 18. [Google Scholar]
- Poppi, D.; Hughes, T.; L’Hullier, P. Intake of pasture by grazing ruminants. In Livestock Feeding on Pasture; (Occasional Publication 10) ed.; A.M. Nicol. New Zealand Society of Animal Production: Hamilton, New Zealand, 1987; pp. 55–63. [Google Scholar]
- Hodgson, J. Grazing Management, Science Into Practice; Whittemore, C., Simpson, K., Eds.; Longman Scientific & Technical: Harlow/Essex, UK, 1990; p. 203. [Google Scholar]
- Adams, D.C.; Reynolds, W.L. Winter grazing patterns of three- and six-year-old crossbred cows in the Northern Great Plains. J. Anim. Sci. 1983, 57, 134. [Google Scholar]
- Dwyer, D.D. Activities and grazing preferences of cows with calves in the Northern Osage County, Oklahoma. Oklahoma Agr. Exp. Sta. Bull. 1961, B-588, 61. [Google Scholar]
- Young, R.J.; Carruthers, J.; Lawrence, A.B. The effect of a foraging device (“The Edinburgh Foodball”) on the behaviour of pigs. Appl. Anim. Behav. Sci. 1994, 39, 237–247. [Google Scholar] [CrossRef]
- De Passillé, A.; Christopherson, R.; Rushen, J. Nonnutritive sucking by the calf and postprandial secretion of insulin, CCK, and gastrin. Physiol. Behav. 1993, 54, 1069–1073. [Google Scholar] [CrossRef]
- Adams, D.C. Effect of Time of Supplementation on Performance, Forage Intake and Grazing Behavior of Yearling Beef Steers Grazing Russian Wild Ryegrass in the Fall. J. Anim. Sci. 1985, 61, 1037–1042. [Google Scholar] [CrossRef]
- Schutz, M.M.; Pajor, E.A. Genetic Control of Dairy Cattle Behaviour. J. Dairy Sci. 2001, 84, E31–E38. [Google Scholar] [CrossRef]
- Rovira, J. Textbook of Manejo Nutritivo de los Rodeos de Cría en Pastoreo; Hemisferio Sur: Montevideo, Uruguay, 1996; pp. 3–58. [Google Scholar]
- Kilgour, R. The open-field test as an assessment of the temperament of dairy cows. Anim. Behav. 1975, 23, 615–624. [Google Scholar] [CrossRef]
- Petherick, J.C.; Rushen, J. Behavioural restriction. In Animal Welfare; Appleby, M.A., Hughes, B.O., Eds.; CABI Publishing: Wallingford, UK, 1997; pp. 89–105. [Google Scholar]
- Boissy, A.; Lee, C. How assessing relationships between emotions and cognition can improve farm animal welfare. Rev. Sci. Tech. 2014, 33, 103–110. [Google Scholar] [CrossRef] [PubMed]
- Fureix, C.; Meagher, R.K. What can inactivity (in its various forms) reveal about affective states in non-human animals? A review. Appl. Anim. Behav. Sci. 2015, 171, 8–24. [Google Scholar] [CrossRef]
- Gottardo, F.; Ricci, R.; Preciso, S.; Ravarotto, L.; Cozzi, G. Effect of the manger space on welfare and meat quality of beef cat-tle. Livest. Prod. Sci. 2004, 89, 277–285. [Google Scholar] [CrossRef]
- Manteca, X.; Velarde, A. Animal Welfare Indicators. In Proceedings of the Internations Congress on Animal Welfare: New Horizons for the 21st Century, Current Experience and Future Objectives, Montevideo, Uruguay, 24 April 2007. [Google Scholar]
- Brown-Brandl, T.; Eigenberg, R.; Nienaber, J. Heat stress risk factors of feedlot heifers. Livest. Sci. 2006, 105, 57–68. [Google Scholar] [CrossRef]
- Immonen, K.; Schaefer, D.M.; Puolanne, E.; Kau, R.G.; Nordheim, E.V. The relative effect of dietary energy density on re-pleted and resting muscle glycogen concentrations. Meat Sci. 2000, 54, 155–162. [Google Scholar] [CrossRef]
- Muir, P.D.; Deaker, J.M.; Bown, M.D. Effects of forage- and grain-based feeding systems on beef quality: A review. N. Z. J. Agric. Res. 1998, 41, 623–635. [Google Scholar] [CrossRef]
- Realini, C.; Duckett, S.; Brito, G.; Rizza, M.D.; De Mattos, D. Effect of pasture vs. concentrate feeding with or without antioxidants on carcass characteristics, fatty acid composition, and quality of Uruguayan beef. Meat Sci. 2004, 66, 567–577. [Google Scholar] [CrossRef]
- Olson, C.A.; Carstens, G.E.; Herring, A.D.; Hale, D.S.; Kayser, W.C.; Miller, R.K. Effects of temperament at feedlot arrival and breed type on growth efficiency, feeding behavior, and carcass value in finishing heifers. J. Anim. Sci. 2019, 97, 1828–1839. [Google Scholar] [CrossRef] [PubMed]
- Fordyce, G.; Dodt, R.M.; Wythes, J.R. Cattle temperaments in extensive beef herds in northern Queensland. Aust. J. Exp. Agric. 1988, 28, 683. [Google Scholar] [CrossRef]
- Voisinet, B.D.; Grandin, T.; O’Connor, S.F.; Tatum, J.D.; Deesing, M.J. Bos Indicus-Cross Feedlot Cattle with Excitable Tem-peraments have Tougher Meat and a Higher Incidence of Borderline Dark Cutters. Meat Sci. 1997, 46, 367–377. [Google Scholar] [CrossRef]
- Lensink, B.J.; Fernandez, X.; Boivin, X.; Pradel, P.; Le Neindre, P.; Veissier, I. The impact of gentle contact on ease of han-dling, welfare and growth of calves and on quality of veal meat. J. Anim. Sci. 2000, 78, 1219–1226. [Google Scholar] [CrossRef]
- Warriss, P. The handling of cattle pre-slaughter and its effects on carcass and meat quality. Appl. Anim. Behav. Sci. 1990, 28, 171–186. [Google Scholar] [CrossRef]
- Gregory, N.G.; Grandin, T. Animal Welfare and Meat Science; CAB International: Wallingford, UK, 1998. [Google Scholar]
- Olson, T. Valor agregado en la cadena cárnica en los E.U.A., y sus implicancias en el mejoramiento genético en bovinos de carne. In Proceedings of the Conference Instituto Plan Agropecuario, Montevideo, Uruguay, 10 March 2002. [Google Scholar]
- Koohmaraie, M.; Shackelford, S.; Muggli-Cockett, N.; Stone, R. Effect of the &adrenergic agoinst L644,969 on muscle growth, endogenous proteinase activities, and post-mortem proteolysis in wether lambs. J. Anim. Sci. 1991, 69, 4823. [Google Scholar]
- King, D.A.; Schuehle Pfeiffer, C.E.; Randel, R.D.; Welsh, T.H., Jr.; Oliphint, R.A.; Baird, B.E.; Curley, K.O., Jr.; Vann, R.C.; Hale, D.S.; Savell, J.W. Influence of animal temperament and stress responsiveness on the carcass quality and beef tenderness of feedlot cattle. Meat Sci. 2006, 74, 546–556. [Google Scholar] [CrossRef] [PubMed]


| Treatment | ||||
|---|---|---|---|---|
| T1 | T2 | T3 | T4 | |
| Average daily gain (kg/an) | 0.52 d ± 0.05 | 0.94 c ± 0.05 | 1.12 b ± 0.05 | 1.56 a ± 0.05 |
| Ribeye area gain (cm2/day) | 0.05 b ± 0.01 | 0.08 b ± 0.01 | 0.08 b ± 0.01 | 0.17 a ± 0.01 |
| Fat thickness gain (mm/day) | 0.03 c ± 0.00 | 0.04 b ± 0.00 | 0.06 a ± 0.00 | 0.07 a ± 0.00 |
| Time Budget—Difference among Treatments (p < 0.05) | |
|---|---|
| Grazing | T1 > T2 > T3 |
| Ruminating | (T1 = T2 = T3) > T4 |
| Supplementing | (T2 = T3) < T4 |
| Lying or standing | T1 < T2 < T3 < T4 |
| Treatment | ||||
|---|---|---|---|---|
| 1 | 2 | 3 | 4 | |
| pH 24 h | 5.70 a ± 0.03 | 5.54 b ± 0.03 | 5.73 a ± 0.03 | 5.47 b ± 0.03 |
| WBSF 7 days | 3.17 c ± 0.25 | 4.17 ab ± 0.25 | 3.57 bc ± 0.24 | 4.51 a ± 0.30 |
| WBSF 20 days | 2.87 b ± 0.16 | 3.78 a ± 0.16 | 3.26 b ± 0.16 | 3.98 a ± 0.19 |
| WBSF < 3 (100% CS) | 3 > WBSF < 4 (99% CS) | WBSF > 4 (86% CS) | |
|---|---|---|---|
| 7 aging days | 45 a | 36 ab | 26 b |
| 20 aging days | 40 a | 35 ab | 22 b |
Publisher’s Note: MDPI stays neutral with regard to jurisdictional claims in published maps and institutional affiliations. |
© 2021 by the authors. Licensee MDPI, Basel, Switzerland. This article is an open access article distributed under the terms and conditions of the Creative Commons Attribution (CC BY) license (http://creativecommons.org/licenses/by/4.0/).
Share and Cite
del Campo, M.; Manteca, X.; Soares de Lima, J.M.; Brito, G.; Hernández, P.; Sañudo, C.; Montossi, F. Effect of Different Finishing Strategies and Steer Temperament on Animal Welfare and Instrumental Meat Tenderness. Animals 2021, 11, 859. https://doi.org/10.3390/ani11030859
del Campo M, Manteca X, Soares de Lima JM, Brito G, Hernández P, Sañudo C, Montossi F. Effect of Different Finishing Strategies and Steer Temperament on Animal Welfare and Instrumental Meat Tenderness. Animals. 2021; 11(3):859. https://doi.org/10.3390/ani11030859
Chicago/Turabian Styledel Campo, Marcia, Xavier Manteca, Juan Manuel Soares de Lima, Gustavo Brito, Pilar Hernández, Carlos Sañudo, and Fabio Montossi. 2021. "Effect of Different Finishing Strategies and Steer Temperament on Animal Welfare and Instrumental Meat Tenderness" Animals 11, no. 3: 859. https://doi.org/10.3390/ani11030859
APA Styledel Campo, M., Manteca, X., Soares de Lima, J. M., Brito, G., Hernández, P., Sañudo, C., & Montossi, F. (2021). Effect of Different Finishing Strategies and Steer Temperament on Animal Welfare and Instrumental Meat Tenderness. Animals, 11(3), 859. https://doi.org/10.3390/ani11030859