Article

Effect of Actin Alpha Cardiac Muscle 1 on the Proliferation and Differentiation of Bovine Myoblasts and Preadipocytes

1
College of Animal Science and Technology, Northwest A&F University, Yangling, Xianyang 712100, China
2
National Beef Cattle Improvement Centre, Yangling, Xianyang 712100, China
*
Author to whom correspondence should be addressed.
Animals 2021, 11(12), 3468; https://doi.org/10.3390/ani11123468
Submission received: 10 November 2021 / Revised: 2 December 2021 / Accepted: 2 December 2021 / Published: 6 December 2021
(This article belongs to the Section Animal Genetics and Genomics)

Abstract

:

Simple Summary

Marbling is an important factor affecting the quality of beef. The co-culture (myoblast-preadipocytes) system was successfully established in our lab in the early stage to simulate the internal environment of marbling. Within this environment, ACTC1 gene was a differentially expressed gene screened from the co-culture system. The gene was not expressed in monocultured adipocytes but was expressed in co-cultured adipocytes. Therefore, we hypothesize that the ACTC1 gene plays a role in the development of bovine myoblasts and preadipocytes. In this study, we explored the effect of ACTC1 gene on the proliferation and differentiation of bovine myoblasts and preadipocytes, aiming to discover the potential biological function of ACTC1 gene in muscle development and fat deposition. The results showed that ACTC1 could regulate the development of bovine myoblasts and preadipocytes, and ACTC1 could be used as an important target for improving beef quality in the future.

Abstract

Actin Alpha Cardiac Muscle 1 (ACTC1) gene is a differentially expressed gene screened through the co-culture system of myoblasts-preadipocytes. In order to study the role of this gene in the process of proliferation and differentiation of bovine myoblasts and preadipocytes, the methods of the knockdown, overexpression, and ectopic expression of ACTC1 were used in this study. After ACTC1 knockdown in bovine myoblasts and inducing differentiation, the sizes and numbers of myotube formation were significantly reduced compared to the control group, and myogenic marker genes—MYOD1, MYOG, MYH3, MRF4, MYF5, CKM and MEF2A—were significantly decreased (p < 0.05, p < 0.01) at both the mRNA and protein levels of myoblasts at different differentiation stages (D0, D2, D4, D6 and D8). Conversely, ACTC1 overexpression induced the inverse result. After ectopic expression of ACTC1 in bovine preadipocytes and induced differentiation, the number and size of lipid droplets were significantly higher than those of the control group, and the expression of adipogenic marker genes—FABP4, SCD1, PPARγ and FASN—were significantly increased (p < 0.05, p < 0.01) at the mRNA and protein levels of preadipocytes at different differentiation stages. Flow cytometry results showed that both the knockdown and overexpression of ACTC1 inhibited the normal cell cycle of myoblasts; however, ectopic expression of ACTC1 in adipocytes induced no significant cell cycle changes. This study is the first to explore the role of ACTC1 in bovine myogenesis and lipogenesis and demonstrates that ACTC1 promotes the differentiation of bovine myoblasts and preadipocytes, affecting the proliferation of myoblasts.

1. Introduction

Compared with other meats, beef is richer in protein, vitamins, and a variety of essential amino acids, so it is favored by the majority of consumers. Beef quality is determined by several factors, chief among them being muscle growth and development as well as intramuscular fat content [1,2]. At the cellular level, an increase in intramuscular fat content is characterized by increased proliferation in adipocytes and an increase in the number and size of lipid droplets (differentiation). As one of the most widely consumed meats in the world, improving the output and quality of beef has long been important to the food industry. Given that the growth and development of muscle and fat are directly related to the yield and quality of beef, understanding the regulatory mechanisms in muscle and adipose tissue growth and development at the molecular level may elucidate new strategies to impact beef quality and lay a foundation for the molecular breeding of beef cattle.
Actin Alpha Cardiac Muscle 1 (ACTC1) is the main actin in embryonic hearts and plays an important role in heart development [3,4,5]. Moreover, it is the most abundant transverse α-actin subtype in mature hearts and the main protein of myocardial myofilaments, making it responsible for the contractile function of the heart through the troponin system [6]. Cardiac actin gene mutations are thought to affect sarcomere contraction and lead to familial hypertrophic and idiopathic dilated cardiomyopathy, cardiac compensatory hypertrophy, and heart failure [7,8,9,10,11,12,13,14]. Furthermore, ACTC1 is also the most important striated α-actin in fetal skeletal muscle [15,16]. Studies have shown that while ACTC1 plays a critical role in the formation of early human skeletal muscle, ACTC1 protein expression is downregulated to a negligible level in fetal skeletal muscle after birth, although it may be expressed in regenerated muscle fibers [17,18]. In mouse models, transgene overexpression of ACTC1 can alleviate muscle dysplasia diseases caused by a skeletal muscle α-actin (ACTA1) deficiency (ACTA1 disease) [19]. Further study has found that the expression of ACTC1 is related to myogenic regulatory factors. When it is co-expressed with MRF4, the N-terminal of MRF4 can inhibit the expression of ACTC1 [20]. ACTC1 has also been used as a marker of glioma invasion and prognosis [21]. One study even reported that ACTC1 could be used as a biomarker for the diagnosis of liver metastasis and provide a new strategy for the development of anti-metastasis drugs in colon cancer patients [22].
At present, most studies on ACTC1 have evaluated its effects on cardiac development and related diseases in model animals, such as humans and mice. There have been few studies on this gene in cattle. Of those that have been performed, some have shown that ACTC1 gene copy number variation was related to beef production and quality [23]. Using bovine longissimus dorsi RNA-Seq technology, one study found that ACTC1 is related to bovine muscle weight gain and feed intake [24]. In addition, a recent paper on ACTC1 found that it may be related to the regulation of mammary gland development in Italian buffalos [25]. However, the effects of ACTC1 on the proliferation and differentiation of bovine myoblasts and adipocytes remains uninvestigated.
Our lab has previously identified ACTC1 as a differentially expressed gene via transcriptome sequencing technology when studying the mutual regulation of bovine myocytes and adipocytes (undergoing publication), and the role of ACTC1 in the muscle-fat dialogue was preliminarily explored. In that study, ACTC1 was not detected in preadipocytes cultured separately, but the presence of myoblasts in the co-culture (myoblasts-preadipocytes) system induced the expression of ACTC1 in adipocytes. Herein, we utilize gene knockdown, overexpression, and ectopic expression to elucidate the proliferation and differentiation effects of ACTC1 on separately cultured bovine myoblasts and preadipocytes.

2. Materials and Methods

2.1. Sample Source

All animal procedures conformed with the Regulations for the Administration of Affairs Concerning Experimental Animals (Ministry of Science and Technology, Beijing, China, 2004) and were approved by the Institutional Animal Care and Use Committee (College of Animal Science and Technology, Northwest A&F University, Yanling, Xianyang, China, No. 2013-23, 20 April 2013).
In this study, the 4-day-old Qinchuan beef cattle was used to isolate preadipocytes and myoblasts, and the cattle was born and raised at the breeding farm of the National Beef Cattle Improvement Center (Yangling, Xianyang, China).

2.2. Isolation, Culture, and Differentiation of Primary Bovine Myoblasts and Preadipocytes

Myoblasts were isolated according to Wang et al. [26] and digested by type Ⅱ collagenase (Gibco) and neutral protease (Sigma, Kawasaki, Japan). Collagenase II and neutral protease were used to digest Qinchuan cattle hind leg muscle tissue and then centrifuged to collect the supernatant (150 rpm/min, 5 min). The process was repeated until the muscle tissue was completely digested. All supernatants were centrifuged to obtain primary myoblasts (1000 rpm/min, 10 min). The isolated myoblasts were cultured in a complete growth medium of Dulbecco’s Modified Eagle Medium/F-12 (DMEM/F-12, Gibco, Grand Island, NY, USA) containing 20% fetal bovine serum (FBS, Gibco) and 1% penicillin/streptomycin (Hyclone, Logan, UT, USA).
The isolation and culture protocols for preadipocytes were performed using type I collagenase (Gibco) digestion method according to Meissburgeretal [27], with modifications established previously in our laboratory [28]. Collagenase I was used to digest Qinchuan cattle perirenal fat. After centrifugation, the primary preadipocytes were present in the pellet. Isolated preadipocytes were cultured in the complete growth medium of DMEM/F-12 containing 10% FBS and 1% penicillin/streptomycin.
Once the cells (myoblasts or preadipocytes) were 70% confluent, they were then cultured in growth medium supplemented with adenovirus. After 12 h, the media was replaced with growth medium. Forty-eight hours later was recorded as the 0th day (D0), and the media was replaced with the respective differentiation media. The differentiation medium for myoblasts contained DMEM/F-12, with 2% horse serum (HS, Gibco) and 1% penicillin/streptomycin. The differentiation medium for preadipocytes was prepared composed of complete medium containing isobutylmethylxanthine (IBMX, 0.5 mM, Sigma, Kawasaki, Japan), insulin (1 mg/mL, Sigma, Kawasaki, Japan), and dexamethasone (1 mM, Sigma, Saint Louis, MO, USA). The differentiation media were changed every two days, and cell changes (myoblasts-myotubes; preadipocytes-lipid droplets) on the 2nd, 4th, 6th, 8th, and 10th days (D2, D4, D6, D8, D10) were recorded successively. The size and number of lipid droplets and myotubes were observed under an Olympus IX71 microscope (OLYMPUS, Dalian, China). Each experiment was performed in triplicate.

2.3. Interference and Overexpression of Adenovirus Packaging

In this experiment, based on the sequence (Gene ID: 533219) of ACTC1 gene published on NCBI, primers (Table 1) were designed and synthesized to amplify the coding DNA sequence (CDS) of ACTC1 (see the next paragraph for PCR system). These were then sent to OBIO Technology (Shanghai) Corp., Ltd. for adenovirus packaging. The titers of ACTC1 knockdown adenovirus (AD-shRNA-ACTC1, pDKD-CMV-eGFP-U6-shRNA (ACTC1)) and control adenovirus (AD-shRNA-NC, pDKD-CMV-eGFP-U6-shRNA) were 6.32 × 10¹⁰ PFU/mL and 3.16 × 10¹¹ PFU/mL, respectively. The titers of ACTC1 overexpression (ectopic expression) adenovirus (AD-ACTC1, pAdeno-MCMV-ACTC1-P2A-3Flag-EGFP) and control adenovirus (AD-NC, pAdeno-MCMV-3Flag-EGFP) were 1.34 × 10¹¹ PFU/mL and 4.74 × 10¹⁰ PFU/mL, respectively.
PCR system: DNA 100 ng/μL, upstream and downstream primers 2.5 μL, dNTP Mix (2.5 mmol/L, Takara, Mountain View, CA, USA) 4 μL, 10 × PCR Buffer 5 μL (Takara), Ex Taq 0.25 μL (Takara), diluted with double distilled water to 50 μL. The reaction protocol is as follows: 95 °C 3 min, 95 °C 20 min, 55 °C 30 s, 72 °C 2 min, 30 cycles, 72 °C 5 min.

2.4. Optimal Adenovirus MOI Determination

Myoblasts or preadipocytes were resuscitated in a 12-well plate. When cells were at 50~70% confluency, the different concentrations of adenovirus AD-shRNA-NC (MOI = 6, 19, 32, 44), AD-shRNA-ACTC1 (MOI = 38, 51, 63, 76), AD-NC (MOI = 16, 19, 22, 27) or AD-ACTC1 (MOI = 9, 19, 29, 39) were added to the complete growth medium, and the medium was changed. After 48 h, the optimal infection concentration was determined via cell growth and green fluorescent protein (GFP) expression. RNA and protein were extracted, and ACTC1 changes were measured by qRT-PCR and Western blot.

2.5. Immunofluorescence Staining

D4, D6, and D8 myocytes were stained with MYHC immunofluorescence to observe myotube changes. The cells were fixed with 4% tissue cell fixation solution (Solarbio) for 10 min; permeated with 0.2% TritonX-100 (Sigma, Kawasaki, Japan) for 20 min; incubated with phosphate-buffered saline (PBS, Hyclone) containing 10% donkey serum (Solarbio), 1% bovine serum albumin (Sangon Biotech, Shanghai, China), and 0.3 M glycine (Sigma, Kawasaki, Japan) for 1 h; incubated with MYHC antibody (mouse anti-MYHC, 1:200, Abcam, ab50967, Cambridge, NT, UK) at 4 °C overnight; then washed with PBS 3 times. Before imaging, the cells were incubated at 37 °C for 1 h with Goat Anti-Mouse IgG (H + L) (1:200, SA00013-3, Proteintech Group, Inc., Rosemont, IL, USA), the cell nucleus was stained with 4′,6-diamidino-2-phenylindole (DAPI, Gibco, Grand Island, NY, USA) for 15 min, and it was washed 3 times with PBS before being imaged on an Olympus IX71 microscope (OLYMPUS 100×, Dalian, China).

2.6. Oil Red O Staining

D0, D2, D4, D6, D8, and D10 preadipocytes were stained with oil red O (Sigma, Kawasaki, Japan) to observe lipid droplet changes. The oil red O solution was prepared with isopropanol (BIOFOUNT, Beijing, China) and then diluted with distilled water and filtered. The cells were washed with PBS 3 times and fixed with 4% tissue cell fixation solution for 30 min, stained with oil red O for 30 min, and washed with PBS 3 additional times. The numbers and sizes of lipid droplets were then imaged on an Olympus IX71 microscope (OLYMPUS 400×, Dalian, China). Three images were randomly collected for each observation field to calculate the area of Oil Red O staining by the software Image J (National Institute of Mental Health, Bethesda, MD, USA).

2.7. Flow Cytometry

When cells were at 50~60% confluency, varying concentrations of knockdown and overexpression (ectopic expression) adenoviruses were infected in myocytes and adipocytes, respectively, with each treatment performed in triplicate. After 48 h, cells were at 80–90% confluency and were digested with Trypsin-EDTA (0.25%, Gibco). Then, One Step Cell Cycle Straining Kit (MultiSciences Biotech, Hangzhou, China) was added to permeate the cells, and the cells were stained with DAPI for 30 min. Finally, the DNA content under the differing treatments was detected via flow cytometer (λ = 488 nm).

2.8. Real-Time Quantitative PCR

The total RNA of the cells on the 0th, 2nd, 4th, 6th, and 8th day was extracted by TRIzol reagent (Takara, Mountain View, CA, USA), and then cDNA was obtained by Prime Script RT reagent kit (Takara, Mountain View, CA, USA). In this study, glyceraldehyde-3-phosphate dehydrogenase (GAPDH) was used as the internal reference, and primers were designed by gene sequence on NCBI to detect the expression changes of myogenic marker genes (MYOD1, MYOG, MYH3, MYF5, MYF6, MEF2A and CKM) and adipogenic marker genes (PPAR γ, FABP4, SCD1 and FASN) at the mRNA level. The primer sequence is shown in Table 2. Subsequently, the cDNA was used for qRT-PCR in triplicate wells by the SYBR Green Real-Time PCR Master Mix (Takara, Mountain View, CA, USA) in Bio-Rad Real-Time PCR System (Bio-Rad, Hercules, CA, USA). Then the result was calculated according to the formula 2−ΔΔCt. The thermal cycles used in the qRT-PCR were 40.

2.9. Western Blot

A protein extraction kit (Solarbio Company, Beijing, China) was used to extract the proteins on days 2, 4, 6 and 8 of adipocyte and myocyte differentiation, and the protein expression of the corresponding marker genes for fat differentiation and muscle differentiation were detected. The protein concentration was determined using the bicinchoninic acid (BCA) method (Takara). Protein sample buffer (Takara) was added into proteins at a proportion of 1:4 and denatured at 100 °C for 10 min. Polyacrylamide gels at 5% and 12% were prepared, and 20 μg of protein samples were loaded per well. Gels were electrophoresed at 80 V for 30 min, followed by 120 V until the samples ran to the bottom of the gel. The protein samples in the gel were transferred to a polyvinylidene fluoride membrane (PVDF, Merck Millipore, Taufkirchen, Germany), and then sealed with QuickBlock Western blocking solution (Beyotime Biotechnology, Shanghai, China) for 20 min. GAPDH (rabbit anti-GAPDH, 1:10,000 Abcam, Cambridge, UK, NP_001029206.1), ACTC1 (rabbit anti-ACTC1, 1:1000, Invitrogen, CA, USA NP_001029757.1), MYOD1 (mouse anti-MYOD1, 1:1000, Abcam, Cambridge, NT, UK, NP_001035568.2), MYOG (rabbit anti-MYOG, 1:1000, Abcam, Cambridge, NT, UK, NP_001104795.1), MYHC (mouse anti-MYHC, 1:200, Abcam, Cambridge, NT, UK), MRF4 (mouse anti-MYF6, 1:100, Santa Cruz Biotechnology, Santa Cruz, CA, USA, NP_861527.1), MEF2A (rabbit anti-MEF2A, 1:1000, Abcam, Cambridge, NT, UK, NP_001077107.1), FABP4 (rabbit anti-FABP4, 1:1000, Abcam, NT, UK, NP_776739.1), PPARγ (rabbit anti-PPARγ, 1:1000, Boster, Wuhan, China, NP_851367.1), FASN (rabbit anti-FASN, 1:2000, Abcam, Cambridge, NT, UK, NP_777087.1) antibodies were added and incubated overnight at 4 °C. Then, the corresponding HRP-conjugated Goat Anti-Rabbit IgG (1:5000, Sangon Biotech, Shanghai, China), or m-IgGκ BP-HRP (1:1000, sc-516102, Santa Cruz Biotechnology, Inc, Santa Cruz, CA, USA) were added and incubated at room temperature for 1 h. Finally, the prepared chemiluminescent HRP substrate (Millipore, Danvers, MA, USA) was added to the PVDF membrane containing protein bands, and the GelDoc gel XR + imaging system (Bio-Rad, Hercules, CA, USA) was used to Chemiluminescence (CL). Observe the changes in the expression of marker proteins (myoblasts: MYOD1, MYOG, MYHC, MRF4, MEF2A; preadipocytes: FABP4, PPARγ, FASN, SCD1) at different stages of cell differentiation according to the light and shade of the band.

2.10. Statistical Analysis

Graphpad Prism software was used to analyze quantitative results. Image Lab software was used to analyze protein results, and Modfit software was used to perform statistical analysis on the Flow Cytometry results and quantify results. Error bars represent s.e.m. * p < 0.05; ** p < 0.01.

3. Results

3.1. Screening of Adenovirus MOI

Figure 1a–c,e exhibits the infection of the ACTC1 knockdown and control adenoviruses of different MOI values into myoblasts and the subsequent interference efficiency at the mRNA and protein levels. The maximal interference efficiency (up to 95%) was achieved when the AD-shRNA-NC and AD-shRNA-ACTC1 MOI values were 44 and 51, respectively. Figure 1d,f,h,i shows the infection of the ACTC1 overexpression adenovirus into bovine preadipocytes at varying MOI levels. Maximally, at an AD-NC MOI value of 19 and an AD-ACTC1 MOI value of 9, mRNA and protein expression increased 10,000-fold compared to the control. Although ACTC1 can be highly expressed in myoblasts, its expression cannot be detected in adipocytes; accordingly, ACTC1 was interfered and overexpressed in myoblasts but ectopically expressed in adipocytes. Fluorescence results revealed that the optimal MOI value for overexpressing adenovirus in adipocytes was the same as in the myoblasts (Figure 1g).

3.2. Effect of ACTC1 on Differentiation of Bovine Myoblasts

After knockdown ACTC1 in bovine myoblasts, the sizes and numbers of myotubes in the AD-shRNA-ACTC1 group were significantly lower than those in the AD-shRNA-NC group via brightfield imaging (D4, D6, D8, D10; Figure 2) and immunofluorescence staining (D4, D6, D8; Figure 3), with no significant differences observed at D0 or D2 (Figure 2). The myotube fusion index showed the same results (Figure 3). Myogenic marker genes, including MYOD1, MYOG, MYH3, MRF4, MYF5 and MEF2A, changed significantly at the mRNA (D0, D2, D4, D6 and D8) and protein levels (D2, D4, D6 and D8) after knockdown ACTC1 (Figure 4 and Figure 5). At the mRNA level, the expression of MYOD1, MYOG, and MRF4 decreased significantly (p < 0.05 or p < 0.01), while the expression of MYH3 and CKM increased initially at D2 (MYH3: p < 0.01; CKM: p < 0.05), then decreased significantly in the later stages (p < 0.05 or p < 0.01). MYF5 increased significantly on D6 (p < 0.05 or p < 0.01) but decreased significantly in other periods (p < 0.01). The expression of MEF2A gene changed significantly depending on the day, with expression on D0 and D4 decreasing significantly (p < 0.01) and increasing significantly on D2 and D6 (p < 0.05). At protein levels, the corresponding differences can also be seen with the mRNA level (Figure 5).
After overexpression ACTC1 treatment, myotube formation was observed on D2, D4, D6, D8 and D10 (Figure 6a). While there was no significant difference between AD-NC and AD-ACTC1 phenotypes on D2, the sizes and numbers of myotubes formed in the AD-ACTC1 group were significantly higher than those in AD-NC group on D4, D6, D8 and D10. The myogenic marker gene MYH3 increased significantly (p < 0.05, Figure 6e) after treatment, while other marker genes showed no significant changes, although they showed an upward trend (Figure 6c,d,f,g). These results demonstrate that ACTC1 overexpression significantly promotes myotube formation, while ACTC1 knockdown significantly inhibits myotube formation.

3.3. Effect of ACTC1 on the Proliferation of Bovine Myoblasts

After ACTC1 knockdown, myoblast proliferation increased significantly in the G0/G1 phase (p < 0.05) and decreased in G2/M phase (p < 0.05) (Figure 7a,b). Cell proliferation marker gene mRNA detection found that P21 increased by 201% (p < 0.05; Figure 6e) and CCND2 significantly decreased (p < 0.05; Figure 7h), while P27, PCNA and CCNA2 did not significantly change (Figure 7d,f,g). After ACTC1 overexpression, the proliferation of myoblasts increased significantly in the G0/G1 phase (p < 0.05) but showed no significant changes in the S and G2/M phases (Figure 8a,b). Proliferation marker gene mRNA detection found that PCNA significantly decreased (p < 0.01), P21 significantly increased (p < 0.01), and CCND2 significantly increased (p < 0.05), while CCNA2 and P27 did not significantly change (Figure 8c–h). These results demonstrate that ACTC1 can alter the proliferation of bovine myoblasts.

3.4. Impact of ACTC1 on Bovine Preadipocyte Differentiation

Oil red O staining results showed that the numbers and sizes of lipid droplets in the AD-ACTC1 group were significantly greater than those in the AD-NC group on D0, D2, D4, D6, D8 and D10 after induced ectopic ACTC1 expression (Figure 9). Moreover, lipid quantification results showed that, except for D0, there are extremely significant differences (Figure 10). The expression of adipogenic marker genes (PPAR γ, FABP4, FASN and SCD1) were significantly changed at both the mRNA (D0, D2, D4, D6 and D8) after ectopic expression (Figure 10): PPARγ increased significantly on D2 (p < 0.01) and D6 (p < 0.05); FABP4 increased significantly during adipocyte differentiation (p < 0.01); FASN increased significantly on D4 (p < 0.05) and D6 (p < 0.01), but decreased significantly on D8 (p < 0.01); and SCD1 increased significantly in the late stage of adipocyte differentiation (p < 0.01 or p < 0.05; Figure 10e). The results exhibit that ectopic expression of ACTC1 can significantly promote the formation of lipid droplets. At protein levels (D2, D4, D6 and D8), the corresponding differences with the mRNA level can also be seen (Figure 11).

3.5. Effect of ACTC1 on Proliferation of Bovine Preadipocytes
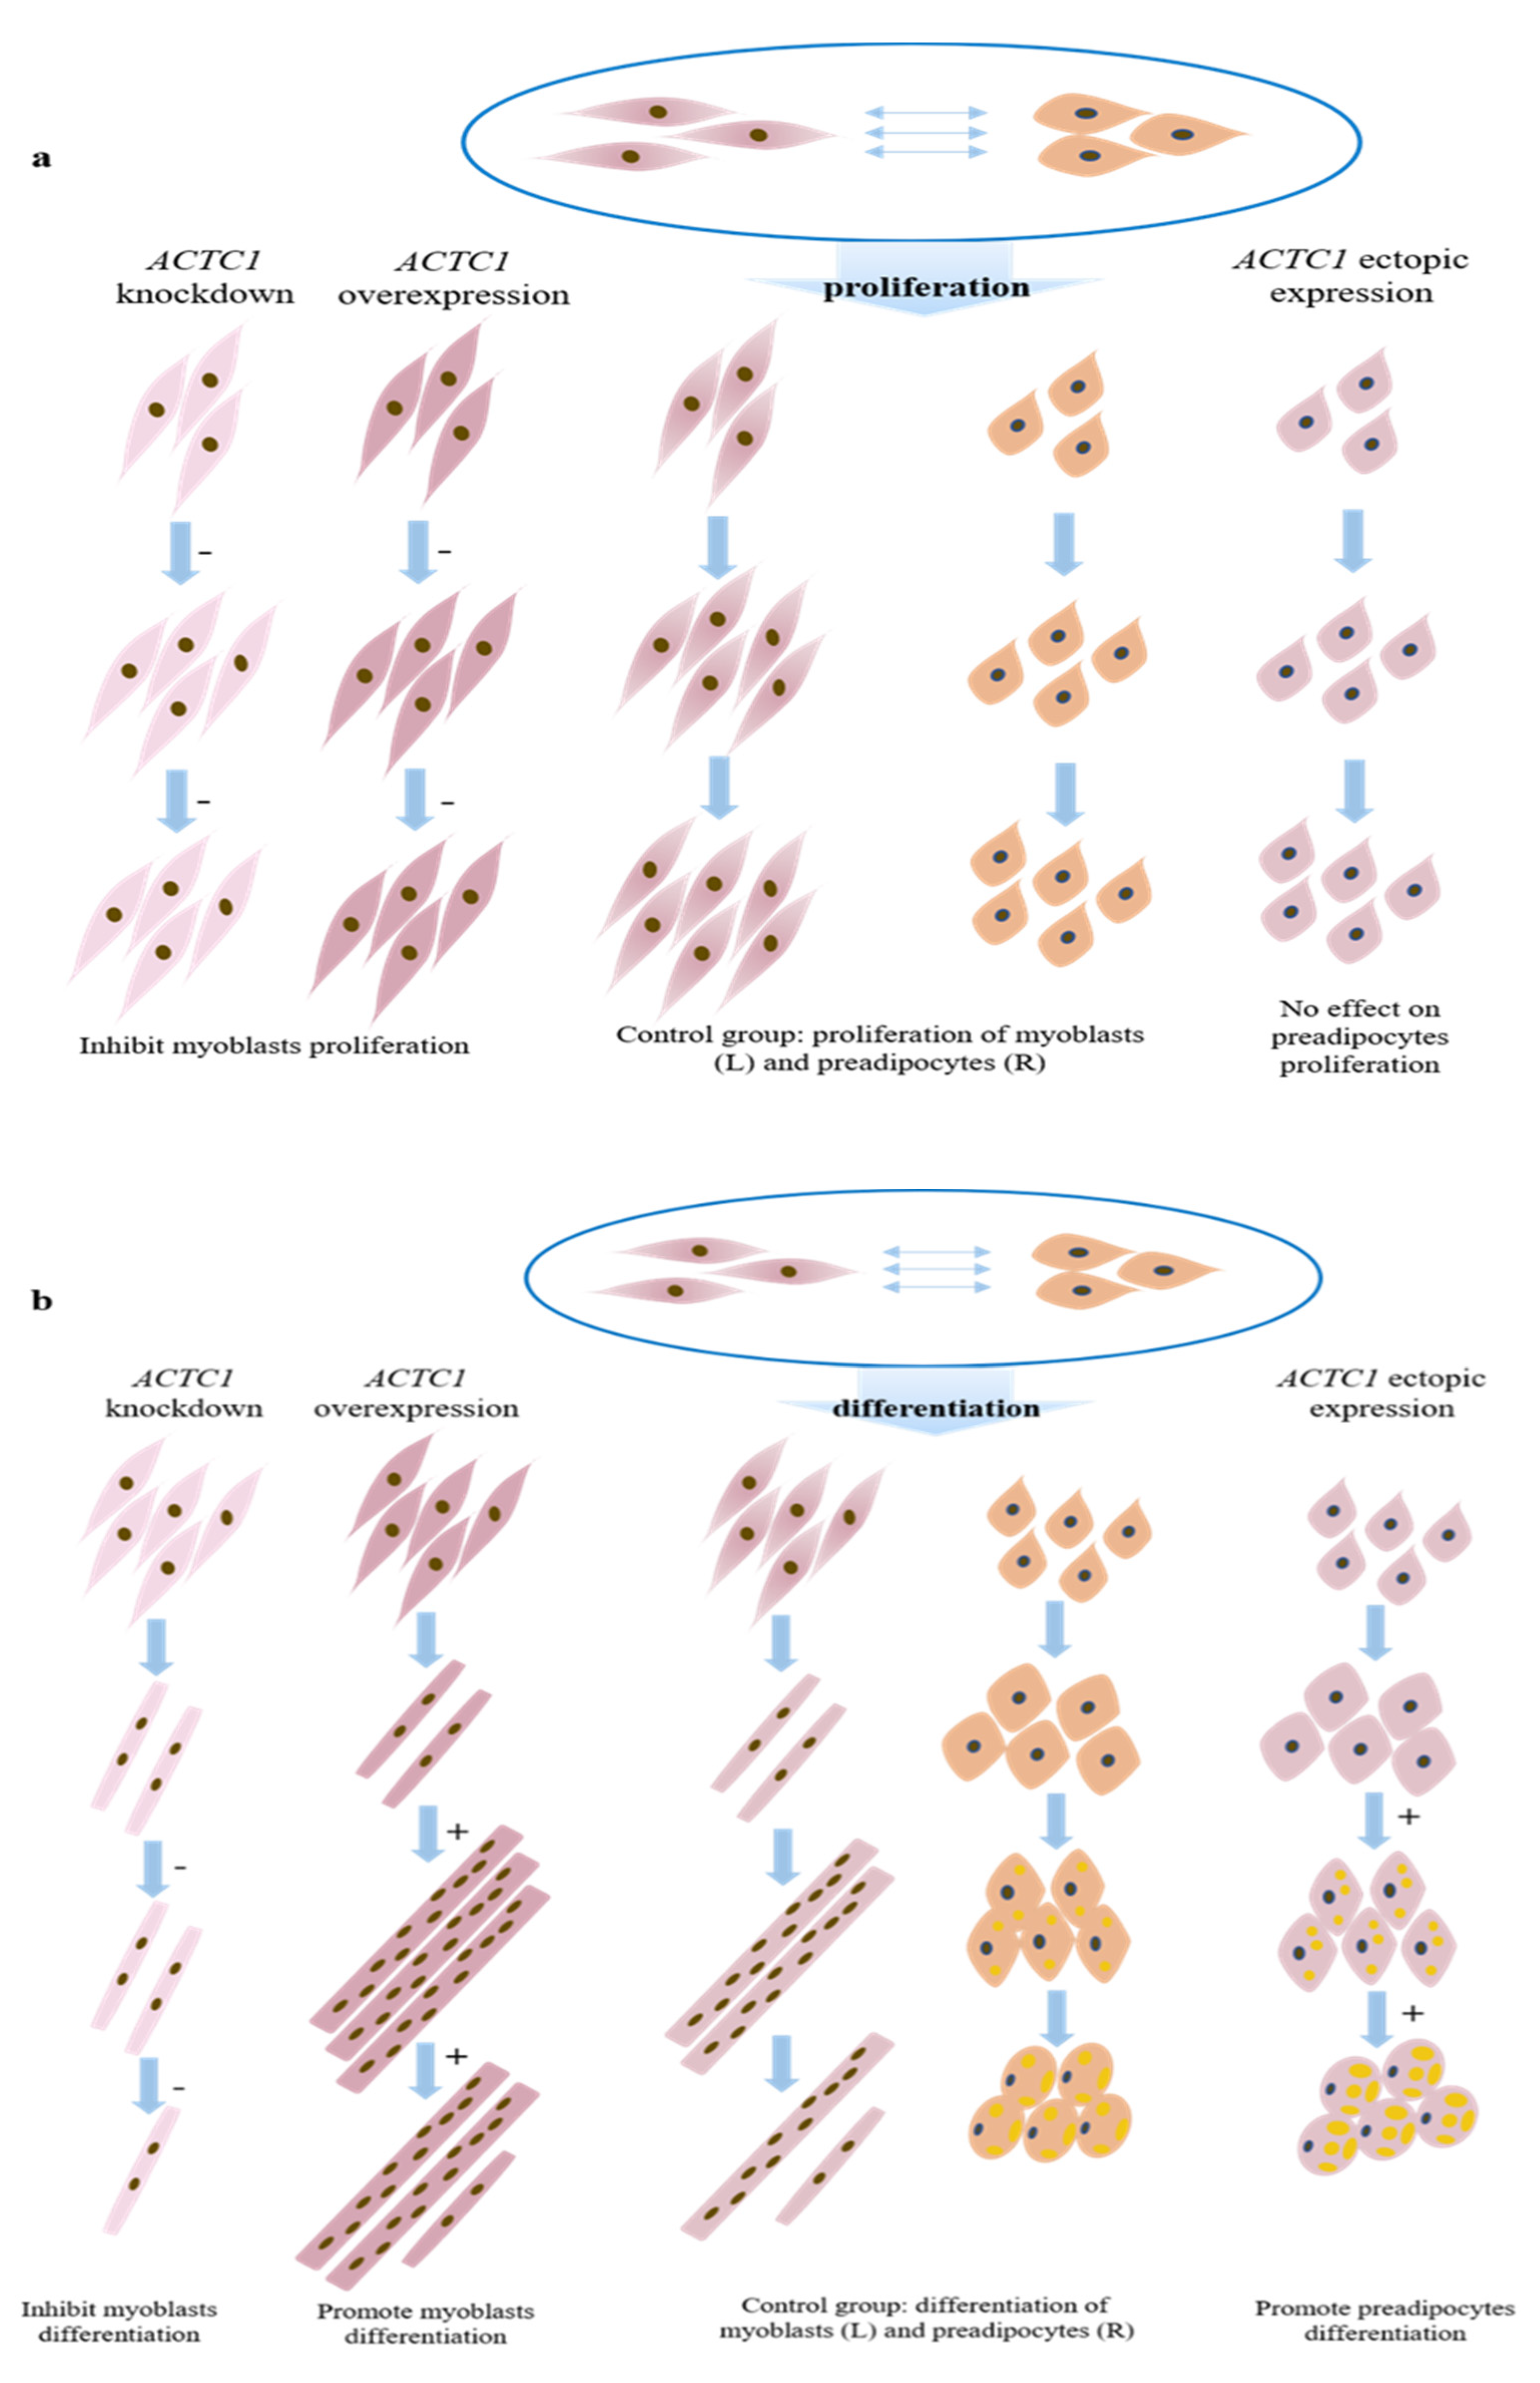
Ectopic expression of ACTC1 had no significant effect on the proliferation cycle of preadipocytes (Figure 12a,b) and induced no significant changes in the expression of proliferation the marker genes: PCNA, P21, P27, CCNA2 and CCND2 [29,30,31,32,33,34,35] (Figure 12d–h). These results show that ACTC1 gene had no effect on the proliferation of bovine preadipocytes.

3.6. Model Diagram

In this study, knockdown and overexpression of ACTC1 inhibited myoblast proliferation, and ectopic expression of ACTC1 had no significant effect on the proliferation of bovine preadipocytes (Figure 13a). However, ACTC1 is positively correlated with myoblast differentiation, especially having a significant promoting effect on myotube formation in the middle stage of differentiation and a significant maintenance effect on myotube in the later stage of differentiation; in addition, ectopic expression ACTC1 could significantly promote the formation of lipid droplets, which was positively correlated with preadipocyte differentiation (Figure 13b), and this was consistent with the results of myoblasts inducing the expression of ACTC1 in preadipocytes in the previous muscle-fat dialogue.

4. Discussion

The growth and development of skeletal muscle can be divided into three stages: embryonic, fetal, and mature [36]. Prenatal development is divided into two stages: embryonic and fetal skeletal muscle development. The development of skeletal muscle includes myogenesis, adipogenesis, and fibrogenesis. There are numerous factors that affect myogenesis. Genes such as PAX3, PAX7, MYF5 and MYOD primarily play roles in muscle satellite cell proliferation [37,38], while MYOD, MYOG, MRF4, MYHC and CKM genes mainly regulate muscle cell fusion [39]. Preadipocytes are the basic biological unit of adipose tissue, and their ability to proliferate and differentiate continues throughout an animal’s life [40]. Fat differentiation depends primarily on cascade regulation of a variety of signal transduction pathways and transcription factors. Studies have shown that factors such as PPARγ, SCD1, FABP4 and FASN can promote adipogenesis [41,42,43,44,45]. Since intramuscular fat content is a critical aspect of beef quality [1], and that at the cellular level, the proliferation and differentiation of myoblasts and preadipocytes directly determines the growth and development of muscle, these factors directly affect beef quality.
In a previous study, we screened the differential gene ACTC1 via transcriptome sequencing technology. Our prior study found that ACTC1 was highly expressed in myoblasts but was undetectable in adipocytes. In the present study, ACTC1 was interfered and overexpressed in myoblasts, and ectopically expressed in adipocytes, to further investigate this phenomenon. First, we evaluated the impact of different titers of adenovirus—as evaluated by MOI—and determined the optimal adenovirus quantities to be added, according to myoblasts and preadipocytes post-infection status and mRNA and protein levels. Fluorescence imaging revealed that the cellular states of preadipocytes and myoblasts treated with the overexpression adenovirus were highly analogous, with the optimal MOI value for the overexpression adenovirus remaining consistent between myoblasts and preadipocytes.
Our results demonstrate that ACTC1 knockdown in myoblasts significantly inhibits the formation of myotubes in the middle and late differentiation stages, and that ACTC1 overexpression can promote myogenesis, most notably for the maintenance of myotubes in the later stages of differentiation. Regardless, this study exhibits that ACTC1 can be positively correlated with myogenesis, which is consistent with existing reports [46]. Furthermore, when investigating the expression of myogenic factors, MEF2A was found to undergo significant changes. The MEF2A expression on D0 and D4 decreased significantly, but increased significantly on D2 and D6. Notably, MEF2A itself does not have myogenic activity, but it can directly bind to the promoters or enhancers of most muscle-specific genes and potentially assist through transcriptional cooperation [47,48].
In cell proliferation, the interaction between cyclin and cyclin-dependent kinase (CDK) strictly controls the cell cycle. The P21 family of proteins bind to cyclins, thus preventing CDK phosphorylation and consequently inhibiting the cell cycle [29,32]. In myoblasts, after ACTC1 knockdown, the G0/G1 phase increased significantly, the G2 phase decreased significantly, and there was no significant change in the S phase. Additionally, P21 expression increased significantly, while CCND2 decreased significantly. After ACTC1 overexpression, the G0/G1 phase also increased significantly, but there were no significant changes to either the G2/M phase or the S phase. In addition, PCNA expression significantly decreased, while P21 and CCND2 expression significantly increased. These results indicate that both the knockdown and the overexpression of ACTC1 inhibited myoblast proliferation. As indicated above, a potential explanation for this phenomenon is the high background expression of ACTC1 in muscle cells. Consequently, the overexpression of ACTC1 may lead to cell cycle regulation disorder, causing an excess to inhibit proliferation as well. Either way, the mechanism by which ACTC1 is involved in the regulation of myoblast proliferation cycle is complex and needs further study. Through this study, the effects of ACTC1 on the proliferation and differentiation of bovine myoblasts were clarified for the first time.
Ectopic expression of ACTC1 in preadipocytes demonstrated that ACTC1 could significantly promote the formation of lipid droplets and that the expression of lipid production-related factors increases significantly with ectopic expression. However, it was also found that the ectopic expression of ACTC1 had no significant effect on the cell cycle of preadipocytes. These findings indicate that although ACTC1 is not expressed in adipocytes cultured in vitro, but in the real environment of marbled beef in vivo, myocytes can induce its expression and promote adipogenesis. However, since this is the first study of this gene on bovine preadipocytes and it was the first time that ACTC1 was found to promote the differentiation of adipocytes, there are few papers that can be used as references to elucidate ACTC1’s specific regulatory mechanism, and it will have to be determined in future studies.

5. Conclusions

Herein, using the knockdown, overexpression, and ectopic expression of ACTC1, we found that ACTC1 was positively correlated to the differentiation of bovine myoblasts and preadipocytes. Although ACTC1 was found not to have a significant effect on the proliferation of preadipocytes, it could affect the proliferation of myoblasts, and its specific mechanisms require further investigation. In this study, the function of ACTC1 in bovine preadipocytes and myoblasts was elucidated to lay a molecular foundation for the exploration of intramuscular fat formation and ultimately, the improvement of beef quality.

Supplementary Materials

The following are available online at https://www.mdpi.com/article/10.3390/ani11123468/s1, Figure S1: Original western blot figures (a–g). Original western blot figures of Figure 5; (h) Original western blot figures of Figure 1; Figure S2. Original western blot figures of Figure 11.

Author Contributions

Conceptualization, A.L., X.S. and H.W.; methodology, A.L., X.S. and H.W.; validation, A.L., X.S. and Y.T.; formal analysis, A.L. and G.S.; investigation, A.L.; resources, A.L.; data curation, A.L.; writing—original draft preparation, A.L.; writing—review and editing, A.L., Y.T. and H.W.; visualization, A.L.; supervision, L.Z.; project administration, A.L., Y.T. and H.W.; funding acquisition, H.W. All authors have read and agreed to the published version of the manuscript.

Funding

This research was funded by the Fundamental Research Funds for the Central Universities (No. 2452020156) and Key R&D Program of Shaanxi Province [2019NY-098].

Institutional Review Board Statement

The study was conducted according to the guidelines of the Declaration of Helsinki and approved by the Institutional Animal Care and Use Committee of College of Animal Science and Technology from Northwest A&F University (No. 2013-23, 20 April 2013).

Data Availability Statement

The data presented in this study are available in article and Supplementary Materials here.

Acknowledgments

We are grateful for the help provided by the staff at our laboratory.

Conflicts of Interest

The authors declare that they have no conflict of interest.

References

  1. Poleti, M.D.; Regitano, L.; Souza, G.; Cesar, A.; Simas, R.C.; Silva-Vignato, B.; Oliveira, G.B.; Andrade, S.; Cameron, L.C.; Coutinho, L.L. Longissimus dorsi muscle label-Free quantitative proteomic reveals biological mechanisms associated with intramuscular fat deposition. J. Proteom. 2018, 179, 30–41. [Google Scholar] [CrossRef] [PubMed]
  2. Wood, J.D.; Enser, M.; Fisher, A.V.; Nute, G.R.; Richardson, R.I.; Sheard, P.R. Manipulating meat quality and composition. Proc. Nutr. Soc. 1999, 58, 363–370. [Google Scholar] [CrossRef]
  3. McNally, E.; Dellefave, L. Sarcomere mutations in cardiogenesis and ventricular noncompaction. Trends Cardiovasc. Med. 2009, 19, 17–21. [Google Scholar] [CrossRef] [PubMed]
  4. Matsson, H.; Eason, J.; Bookwalter, C.S.; Klar, J.; Gustavsson, P.; Sunnegårdh, J.; Enell, H.; Jonzon, A.; Vikkula, M.; Gutierrez, I.; et al. Alpha-Cardiac actin mutations produce atrial septal defects. Hum. Mol. Genet. 2008, 17, 256–265. [Google Scholar] [CrossRef]
  5. Suurmeijer, A.J.; Clément, S.; Francesconi, A.; Bocchi, L.; Angelini, A.; Van Veldhuisen, D.J.; Spagnoli, L.G.; Gabbiani, G.; Orlandi, A. Alpha-actin isoform distribution in normal and failing human heart: A morphological, morphometric, and biochemical study. J. Pathol. 2003, 199, 387–397. [Google Scholar] [CrossRef] [PubMed]
  6. Pourcel, L.; Buron, F.; Arib, G.; Le Fourn, V.; Regamey, A.; Bodenmann, I.; Girod, P.A.; Mermod, N. Influence of cytoskeleton organization on recombinant protein expression by CHO cells. Biotechnol. Bioeng. 2020, 117, 1117–1126. [Google Scholar] [CrossRef] [Green Version]
  7. Augière, C.; Mégy, S.; El Malti, R.; Boland, A.; El Zein, L.; Verrier, B.; Mégarbané, A.; Deleuze, J.F.; Bouvagnet, P. A Novel Alpha Cardiac Actin (ACTC1) Mutation Mapping to a Domain in Close Contact with Myosin Heavy Chain Leads to a Variety of Congenital Heart Defects, Arrhythmia and Possibly Midline Defects. PLoS ONE 2015, 10, e0127903. [Google Scholar] [CrossRef] [PubMed] [Green Version]
  8. Bonne, G.; Carrier, L.; Richard, P.; Hainque, B.; Schwartz, K. Familial hypertrophic cardiomyopathy: From mutations to functional defects. Circ. Res. 1998, 83, 580–593. [Google Scholar] [CrossRef]
  9. Fokstuen, S.; Lyle, R.; Munoz, A.; Gehrig, C.; Lerch, R.; Perrot, A.; Osterziel, K.J.; Geier, C.; Beghetti, M.; Mach, F.; et al. A DNA resequencing array for pathogenic mutation detection in hypertrophic cardiomyopathy. Hum. Mutat. 2008, 29, 879–885. [Google Scholar] [CrossRef] [PubMed]
  10. Mogensen, J.; Klausen, I.C.; Pedersen, A.K.; Egeblad, H.; Bross, P.; Kruse, T.A.; Gregersen, N.; Hansen, P.S.; Baandrup, U.; Borglum, A.D. Alpha-Cardiac actin is a novel disease gene in familial hypertrophic cardiomyopathy. J. Clin. Investig. 1999, 103, R39–R43. [Google Scholar] [CrossRef] [Green Version]
  11. Marian, A.J.; Roberts, R. Familial hypertrophic cardiomyopathy: A paradigm of the cardiac hypertrophic response to injury. Ann. Med. 1998, 30 (Suppl. 1), 24–32. [Google Scholar] [PubMed]
  12. Olson, T.M.; Michels, V.V.; Thibodeau, S.N.; Tai, Y.S.; Keating, M.T. Actin mutations in dilated cardiomyopathy, a heritable form of heart failure. Science 1998, 280, 750–752. [Google Scholar] [CrossRef] [PubMed] [Green Version]
  13. Rangrez, A.Y.; Kilian, L.; Stiebeling, K.; Dittmann, S.; Yadav, P.; Schulze-Bahr, E.; Frey, N.; Frank, D. Data on the role of cardiac α-actin (ACTC1) gene mutations on SRF-Signaling. Data Brief. 2020, 28, 105071. [Google Scholar] [CrossRef]
  14. Yang, Q.L.; Bian, Y.Y.; Wang, B.; Zuo, L.; Zhou, M.Y.; Shao, H.; Zhang, Y.M.; Liu, L.W. Novel phenotype-Genotype correlations of hypertrophic cardiomyopathy caused by mutation in α-Actin and myosin-Binding protein genes in three unrelated Chinese families. J. Cardiol. 2019, 73, 438–444. [Google Scholar] [CrossRef]
  15. Boutilier, J.K.; Taylor, R.L.; Ram, R.; McNamara, E.; Nguyen, Q.; Goullée, H.; Chandler, D.; Mehta, M.; Balmer, L.; Laing, N.G.; et al. Variable cardiac α-Actin (Actc1) expression in early adult skeletal muscle correlates with promoter methylation. Biochim. Biophys. Acta Gene Regul. Mech. 2017, 1860, 1025–1036. [Google Scholar] [CrossRef] [PubMed]
  16. Vandekerckhove, J.; Bugaisky, G.; Buckingham, M. Simultaneous expression of skeletal muscle and heart actin proteins in various striated muscle tissues and cells. A quantitative determination of the two actin isoforms. J. Biol. Chem. 1986, 261, 1838–1843. [Google Scholar] [CrossRef]
  17. Dennis, R.A.; Przybyla, B.; Gurley, C.; Kortebein, P.M.; Simpson, P.; Sullivan, D.H.; Peterson, C.A. Aging alters gene expression of growth and remodeling factors in human skeletal muscle both at rest and in response to acute resistance exercise. Physiol. Genom. 2008, 32, 393–400. [Google Scholar] [CrossRef]
  18. Moll, R.; Holzhausen, H.J.; Mennel, H.D.; Kuhn, C.; Baumann, R.; Taege, C.; Franke, W.W. The cardiac isoform of alpha-Actin in regenerating and atrophic skeletal muscle, myopathies and rhabdomyomatous tumors: An immunohistochemical study using monoclonal antibodies. Virchows Arch. 2006, 449, 175–191. [Google Scholar] [CrossRef]
  19. Ilkovski, B.; Clement, S.; Sewry, C.; North, K.N.; Cooper, S.T. Defining alpha-Skeletal and alpha-Cardiac actin expression in human heart and skeletal muscle explains the absence of cardiac involvement in ACTA1 nemaline myopathy. Neuromuscul. Disord. 2005, 15, 829–835. [Google Scholar] [CrossRef]
  20. Moss, J.B.; Olson, E.N.; Schwartz, R.J. The myogenic regulatory factor MRF4 represses the cardiac alpha-Actin promoter through a negative-Acting N-Terminal protein domain. J. Biol. Chem. 1996, 271, 31688–31694. [Google Scholar] [CrossRef] [Green Version]
  21. Ohtaki, S.; Wanibuchi, M.; Kataoka-Sasaki, Y.; Sasaki, M.; Oka, S.; Noshiro, S.; Akiyama, Y.; Mikami, T.; Mikuni, N.; Kocsis, J.D.; et al. ACTC1 as an invasion and prognosis marker in glioma. J. Neurosurg. 2017, 126, 467–475. [Google Scholar] [CrossRef] [Green Version]
  22. Kim, E.K.; Song, M.J.; Jung, Y.; Lee, W.S.; Jang, H.H. Proteomic Analysis of Primary Colon Cancer and Synchronous Solitary Liver Metastasis. Cancer Genom. Proteom. 2019, 16, 583–592. [Google Scholar] [CrossRef]
  23. Mei, C.; Junjvlieke, Z.; Raza, S.; Wang, H.; Cheng, G.; Zhao, C.; Zhu, W.; Zan, L. Copy number variation detection in Chinese indigenous cattle by whole genome sequencing. Genomics 2020, 112, 831–836. [Google Scholar] [CrossRef] [PubMed]
  24. Keel, B.N.; Zarek, C.M.; Keele, J.W.; Kuehn, L.A.; Snelling, W.M.; Oliver, W.T.; Freetly, H.C.; Lindholm-Perry, A.K. RNA-Seq Meta-Analysis identifies genes in skeletal muscle associated with gain and intake across a multi-Season study of crossbred beef steers. BMC Genom. 2018, 19, 430. [Google Scholar] [CrossRef] [PubMed]
  25. Li, J.; Liu, J.; Liu, S.; Campanile, G.; Salzano, A.; Gasparrini, B.; Plastow, G.; Zhang, C.; Wang, Z.; Liang, A.; et al. Genome-Wide association study for buffalo mammary gland morphology. J. Dairy Res. 2020, 87, 27–31. [Google Scholar] [CrossRef] [PubMed]
  26. Wang, Y.N.; Yang, W.C.; Li, P.W.; Wang, H.B.; Zhang, Y.Y.; Zan, L. Myocyte enhancer factor 2A promotes proliferation and its inhibition attenuates myogenic differentiation via myozenin 2 in bovine skeletal muscle myoblast. PLoS ONE 2018, 13, e0196255. [Google Scholar] [CrossRef]
  27. Meissburger, B.; Perdikari, A.; Moest, H.; Müller, S.; Geiger, M.; Wolfrum, C. Regulation of adipogenesis by paracrine factors from adipose stromal-Vascular fraction—A link to fat depot-Specific differences. Biochim. Biophys. Acta 2016, 1861, 1121–1131. [Google Scholar] [CrossRef] [PubMed] [Green Version]
  28. Li, P.; Wang, Y.; Zhang, L.; Ning, Y.; Zan, L. The Expression Pattern of PLIN2 in Differentiated Adipocytes from Qinchuan Cattle Analysis of Its Protein Structure and Interaction with CGI-58. Int. J. Mol. Sci. 2018, 19, 1336. [Google Scholar] [CrossRef] [Green Version]
  29. Chen, J.; Saha, P.; Kornbluth, S.; Dynlacht, B.D.; Dutta, A. Cyclin-Binding motifs are essential for the function of p21CIP1. Mol. Cell. Biol. 1996, 16, 4673–4682. [Google Scholar] [CrossRef] [Green Version]
  30. Deng, C.; Zhang, P.; Harper, J.W.; Elledge, S.J.; Leder, P. Mice lacking p21CIP1/WAF1 undergo normal development, but are defective in G1 checkpoint control. Cell 1995, 82, 675–684. [Google Scholar] [CrossRef] [Green Version]
  31. Harashima, H.; Dissmeyer, N.; Schnittger, A. Cell cycle control across the eukaryotic kingdom. Trends Cell. Biol. 2013, 23, 345–356. [Google Scholar] [CrossRef] [PubMed]
  32. Haines, D.S.; Landers, J.E.; Engle, L.J.; George, D.L. Physical and functional interaction between wild-Type p53 and mdm2 proteins. Mol. Cell. Biol. 1994, 14, 1171–1178. [Google Scholar] [CrossRef] [PubMed]
  33. Resnitzky, D.; Hengst, L.; Reed, S.I. Cyclin A-Associated kinase activity is rate limiting for entrance into S phase and is negatively regulated in G1 by p27Kip1. Mol. Cell. Biol. 1995, 15, 4347–4352. [Google Scholar] [CrossRef] [PubMed] [Green Version]
  34. Toyoshima, H.; Hunter, T. p27, a novel inhibitor of G1 cyclin-Cdk protein kinase activity, is related to p21. Cell 1994, 78, 67–74. [Google Scholar] [CrossRef]
  35. Xiong, Y. Why are there so many CDK inhibitors? Biochim. Biophys. Acta 1996, 1288, O1–O5. [Google Scholar] [CrossRef]
  36. Du, M.; Tong, J.; Zhao, J.; Underwood, K.R.; Zhu, M.; Ford, S.P.; Nathanielsz, P.W. Fetal programming of skeletal muscle development in ruminant animals. J. Anim. Sci. 2010, 88 (Suppl. 13), E51–E60. [Google Scholar] [CrossRef] [Green Version]
  37. Buckingham, M.; Rigby, P.W. Gene regulatory networks and transcriptional mechanisms that control myogenesis. Dev. Cell 2014, 28, 225–238. [Google Scholar] [CrossRef] [Green Version]
  38. Dumont, N.A.; Bentzinger, C.F.; Sincennes, M.C.; Rudnicki, M.A. Satellite Cells and Skeletal Muscle Regeneration. Compr. Physiol. 2015, 5, 1027–1059. [Google Scholar] [CrossRef]
  39. Zammit, P.S. Function of the myogenic regulatory factors Myf5, MyoD, Myogenin and MRF4 in skeletal muscle, satellite cells and regenerative myogenesis. Semin. Cell Dev. Biol. 2017, 72, 19–32. [Google Scholar] [CrossRef]
  40. Rodriguez, A.M.; Elabd, C.; Delteil, F.; Astier, J.; Vernochet, C.; Saint-Marc, P.; Guesnet, J.; Guezennec, A.; Amri, E.Z.; Dani, C.; et al. Adipocyte differentiation of multipotent cells established from human adipose tissue. Biochem. Biophys. Res. Commun. 2004, 315, 255–263. [Google Scholar] [CrossRef]
  41. Bai, Y.; McCoy, J.G.; Levin, E.J.; Sobrado, P.; Rajashankar, K.R.; Fox, B.G.; Zhou, M. X-Ray structure of a mammalian stearoyl-CoA desaturase. Nature 2015, 524, 252–256. [Google Scholar] [CrossRef] [PubMed] [Green Version]
  42. Boord, J.B.; Fazio, S.; Linton, M.F. Cytoplasmic fatty acid-Binding proteins: Emerging roles in metabolism and atherosclerosis. Curr. Opin. Lipidol. 2015, 13, 141–147. [Google Scholar] [CrossRef]
  43. Chawla, A.; Schwarz, E.J.; Dimaculangan, D.D.; Lazar, M.A. Peroxisome proliferator-Activated receptor (PPAR) gamma: Adipose-Predominant expression and induction early in adipocyte differentiation. Endocrinology 1994, 135, 798–800. [Google Scholar] [CrossRef] [PubMed]
  44. Furuhashi, M.; Hotamisligil, G.S. Fatty acid-Binding proteins: Role in metabolic diseases and potential as drug targets. Nat. Rev. Drug. Discov. 2008, 7, 489–503. [Google Scholar] [CrossRef] [Green Version]
  45. Lefterova, M.I.; Haakonsson, A.K.; Lazar, M.A.; Mandrup, S. PPARγ and the global map of adipogenesis and beyond. Trends Endocrinol. Metab. 2014, 25, 293–302. [Google Scholar] [CrossRef] [Green Version]
  46. Tsao, J.; Vernet, D.A.; Gelfand, R.; Kovanecz, I.; Nolazco, G.; Bruhn, K.W.; Gonzalez-Cadavid, N.F. Myostatin genetic inactivation inhibits myogenesis by muscle-Derived stem cells in vitro but not when implanted in the mdx mouse muscle. Stem. Cell Res. Ther. 2013, 4, 4. [Google Scholar] [CrossRef] [PubMed] [Green Version]
  47. Black, B.L.; Olson, E.N. Transcriptional control of muscle development by myocyte enhancer factor-2 (MEF2) proteins. Annu. Rev. Cell Dev. Biol. 1998, 14, 167–196. [Google Scholar] [CrossRef]
  48. Molkentin, J.D.; Black, B.L.; Martin, J.F.; Olson, E.N. Cooperative activation of muscle gene expression by MEF2 and myogenic bHLH proteins. Cell 1995, 83, 1125–1136. [Google Scholar] [CrossRef] [Green Version]
Figure 1. Screening of adenovirus MOI value. (ac,e) Observe the expression of ACTC1 at mRNA level and protein level and the expression of GFP after adding interfering adenovirus to myoblasts. (e) Use Image J software to measure the gray value of protein bands. (d,f,h,i) Observe the expression of GFP and detection of infection efficiency at mRNA level and protein level after adding expressed adenovirus to preadipocytes. (f) Use Image J software to measure the gray value of protein bands. (g) Observe the expression of GFP after adding overexpressed adenovirus to myoblasts. Each experiment was performed in triplicate. Error bars represent s.e.m. ** p < 0.01. Olympus IX71 microscope (40×). Original western blot figures in Figure S1h.
Animals 11 03468 g001
Figure 2. Myoblast differentiation after ACTC1 knockdown. The myotube formation in bright field was observed 0th, 2nd, 4th, 6th, 8th, and 10th day (D0, D2, D4, D6, D8 and D10) after ACTC1 knockdown (Olympus IX71 microscope 40×). Each experiment was performed in triplicate.
Animals 11 03468 g002
Figure 3. The results of MYHC immunofluorescence staining and fusion index of myoblasts on D4, D6 and D8 days after ACTC1 knockdown (Olympus IX71 microscope 100×). Each experiment was performed in triplicate. Error bars represent s.e.m. ** p < 0.01.
Animals 11 03468 g003
Figure 4. Expression of myogenic marker gene at mRNA level after ACTC1 knockdown. (ah) Detection of mRNA expression of ACTC1, MYOD, MYOG, MYH3, MRF4, MYF5, CKM and MEF2A on D0, D2, D4, D6, D8 days by qRT-PCR after ACTC1 knockdown. Each experiment was performed in triplicate. Error bars represent s.e.m. * p < 0.05; ** p < 0.01.
Animals 11 03468 g004
Figure 5. Expression of myogenic marker gene at protein level after ACTC1 knockdown. (a) Detect the proteins expression of ACTC1, MYOD1, MYOG, MYHC, MRF4 and MEF2A at D2, D4, D6 and D8 days by Western blot after ACTC1 knockdown. (bg) Use Image J software to measure the gray value of protein bands. Each experiment was performed in triplicate. Error bars represent s.e.m. ** p < 0.01. Original western blot figures in Figure S1a–g.
Animals 11 03468 g005
Figure 6. Detection of myoblast differentiation and expression of myoblast marker gene mRNA after overexpression of ACTC1. (a) The myotube formation in bright field was observed D2, D4, D6, D8 and D10 days after AD-NC and AD-ACTC1 adenovirus infection. Olympus IX71 microscope (40×); (bg) Detection of mRNA expression of ACTC1, MEF2A, MYOG, MYH3, MRF4 and MYF5 on D6 after overexpression of ACTC1. Each experiment was performed in triplicate. Error bars represent s.e.m. * p < 0.05; ** p < 0.01.
Animals 11 03468 g006
Figure 7. Effect of interfering ACTC1 on proliferation cycle of bovine myoblasts and detection of mRNA expression of proliferation marker gene. (a,b) Flow cytometric measurement of DNA content using propidium iodide (PI) staining in AD-shRNA-NC/AD-shRNA-ACTC1 treated proliferating myoblast. (ch) Relative mRNA expression of cell cycle genes: PCNA, P21, P27, CCNA2 and CCND2. Each experiment was performed in triplicate. Error bars represent s.e.m. * p < 0.05; ** p < 0.01.
Animals 11 03468 g007
Figure 8. Effect of overexpression of ACTC1 on proliferation cycle of bovine myoblasts and detection of mRNA expression of proliferation marker gene. (a,b) Flow cytometric measurement of DNA content using propidium iodide (PI) staining in AD-NC/AD-ACTC1 treated proliferating myoblast. (ch) Relative mRNA expression of cell cycle genes: PCNA, P21, P27, CCNA2 and CCND2. Each experiment was performed in triplicate. Error bars represent s.e.m. * p < 0.05; ** p < 0.01.
Animals 11 03468 g008
Figure 9. Lipid droplet formation in adipocytes after ectopic expression of ACTC1. Lipid droplets on D0, D2, D4, D6, D8 and D10 days after infection of AD-NC and AD-ACTC1 adenovirus by oil red O staining (Olympus IX71 microscope 400×). Each experiment was performed in triplicate. Image J software was used to measure the oil red O area. Randomly collect 3 images for each observation field. Error bars represent s.e.m. ** p < 0.01.
Animals 11 03468 g009
Figure 10. Detection of adipogenic marker gene expression at mRNA level after ectopic expression of ACTC1. (ae) Detection of mRNA expression of ACTC1, PPARγ, FABP4, FASN and SCD1 genes on D0, D2, D4, D6 and D8 days by qRT-PCR after ectopic expression ACTC1. Each experiment was performed in triplicate. Error bars represent s.e.m. * p < 0.05; ** p < 0.01.
Animals 11 03468 g010
Figure 11. Detection of adipogenic marker gene expression at protein level after ectopic expression of ACTC1. (a) Detect the proteins expression of ACTC1, PPARγ, FABP4, FASN and SCD1 on D2, D4, D6 and D8 days by Western blot after ectopic expression of ACTC1. (bf) Use Image J software to measure the gray value of protein bands. Each experiment was performed in triplicate. Error bars represent s.e.m. * p < 0.05; ** p < 0.01. Original western blot figures in Figure S2.
Animals 11 03468 g011
Figure 12. Effect of ectopic expression of ACTC1 on proliferation cycle of bovine adipocytes and detection of mRNA expression of proliferation marker gene. (a,b) Flow cytometric measurement of DNA content using propidium iodide (PI) staining in AD-NC/AD-ACTC1 treated proliferating myoblast. (ch) Relative mRNA expression of cell cycle genes: PCNA, P21, P27, CCNA2 and CCND2. Each experiment was performed in triplicate. Error bars represent s.e.m. ** p < 0.01.
Animals 11 03468 g012
Figure 13. Proliferation (a) and differentiation (b) model of myoblasts and preadipocytes. Animals 11 03468 i001 and Animals 11 03468 i002 respectively represent myoblasts and preadipocytes (all infected with control adenovirus); Animals 11 03468 i003 represents the myoblasts after knocking down ACTC1; Animals 11 03468 i004 represents the myoblasts after overexpression of ACTC1; Animals 11 03468 i005 are preadipocytes after ectopic expression ACTC1; “−” means inhibition; and “+” means promotion.
Animals 11 03468 g013
Table 1. The primer sequence of the CDS region of ACTC1.
Gene NameAccession NumbersPrimer Sequence (5′ > 3′)Fragments Size (bp)
ACTC1NM_001034585.2Forward: ATGTGCGACGATGAGGAGAC
Reverse: TTAGAAGCACTTGCGGTGGA
1134
Table 2. RT-qPCR primer sequence.
Gene NameAccession NumbersPrimer Sequence (5′ > 3′)Primer Length (bp)
GAPDHNM_001034034Forward: AGTTCAACGGCACAGTCAAGG
Reverse: ACCACATACTCAGCACCAGCA
124
ACTC1NM_001034585.2Forward: CAGTGCTGTCCCTGTATGCT
Reverse: AAGCAGCCGTAGCCATTTCA
282
PPARγNM_181024Forward: TGAAGAGCCTTCCAACTCCC
Reverse: GTCCTCCGGAAGAAACCCTTG
117
SCD1NM_173959Forward: TCCGACCTAAGAGCCGAGAA
Reverse: TGGGCAGCACTATTCACCAG
200
FASNNM_001012669Forward: GGCAAACGGAAAAACGGTGA
Reverse: CTTGGTATTCCGGGTCCGAG
183
FABP4NM_174314Forward: TGAGATTTCCTTCAAATTGGG
Reverse: CTTGTACCAGAGCACCTTCATC
101
MYOD1NM_001040478Forward: AACCCCAACCCGATTTACC
Reverse: CACAACAGTTCCTTCGCCTCT
196
MYOGNM_001111325Forward: GGCGTGTAAGGTGTGTAAG
Reverse: CTTCTTGAGTCTGCGCTTCT
85
MYH3NM_001101835.1Forward: AAATGAGGGATGACCGCCTG
Reverse: GCACTCTTGAGAAGGGGCTT
205
MYF5NM_174116Forward: CCTCTAGTTCCAGGCTCATCTA
Reverse: ACCTCCTTCCTCCTGTGTAATA
90
MRF4NM_181811Forward: GTGATAACTGCCAAGGAAGGAG
Reverse: CGAGGAAATGCTGTCCACGA
93
MEF2ANM_001083638Forward: AATGAACCTCACGAAAGCAGAAC
Reverse: TTAGCACATAGGAAGTATCAGGGTC
106
CKMNM_174773Forward: GTGGCTGGTGATGAGGAGTC
Reverse: TTTCCCCTTGAACTCACCCG
270
PCNANM_001034494.1Forward: TGAACCTCACCAGCATGTCCAAAAT
Reverse: TTCAAATACTAGTGCCAACGTGTCCG
104
P21NM_001098958.2Forward: GACCAGCATGACAGATTTCTACCA
Reverse: TGAAGGCCCAAGGCAAAAG
144
P27NM_001271625.3Forward: AGATGTCAAACGTGCGAGTG
Reverse: GCCAAAGAGGTTTCTGCAAG
104
CCND2NM_001076372.1Forward: GGGCAAGTTGAAATGGAA
Reverse: TCATCGACGGCGGGTAC
173
CCNA2NM_001075123.1Forward: GCCACTGGCACCTCTTGATTA
Reverse: TCCACGAGGATAGCCCTCATA
231
Note: GAPDH, glyceraldehyde-3-phosphate dehydrogenase; ACTC1, actin alpha cardiac muscle 1; PPARγ, peroxisome proliferator-activated receptor γ; SCD1, stearoyl-CoA desaturase; FASN, fatty acid synthase; FABP4, fatty acid-binding proteins 4; MYOD1, myogenic differentiation 1; MYOG, myogenin; MYH3, myosin heavy chain 3; MYF5, myogenic factor 5; MRF4, myogenic regulatory factor 4; MEF2A, myocyte enhancer factor 2A; CKM, creatine kinase-M; MYHC, myosin heavy chains; PCNA, proliferating cell nuclear antigen; P21, cyclin-dependent kinase inhibitor 1A; P27, cyclin-dependent kinase; CCNA2, cyclin A2; CCND2, cyclin D2.
Publisher’s Note: MDPI stays neutral with regard to jurisdictional claims in published maps and institutional affiliations.

