Fermented Feed Modulates Meat Quality and Promotes the Growth of Longissimus Thoracis of Late-Finishing Pigs

 ,
,
Simple Summary
Abstract
1. Introduction
2. Materials and Methods
2.1. Diets Preparation and Laboratory Analyses
2.2. Animals and Experimental Design
2.3. Carcass Measurement and Tissue Sampling
2.4. Meat Quality Measurements
2.5. Quantitative Real-Time PCR (qPCR)
2.6. Western Blot Analysis
2.7. Proteome Analysis
2.8. Statistical Analysis
3. Results
3.1. Characterization of Diets
3.2. Diets Effect on Growth Performance, Carcass Traits and Meat Quality of LT in Finishing Pigs
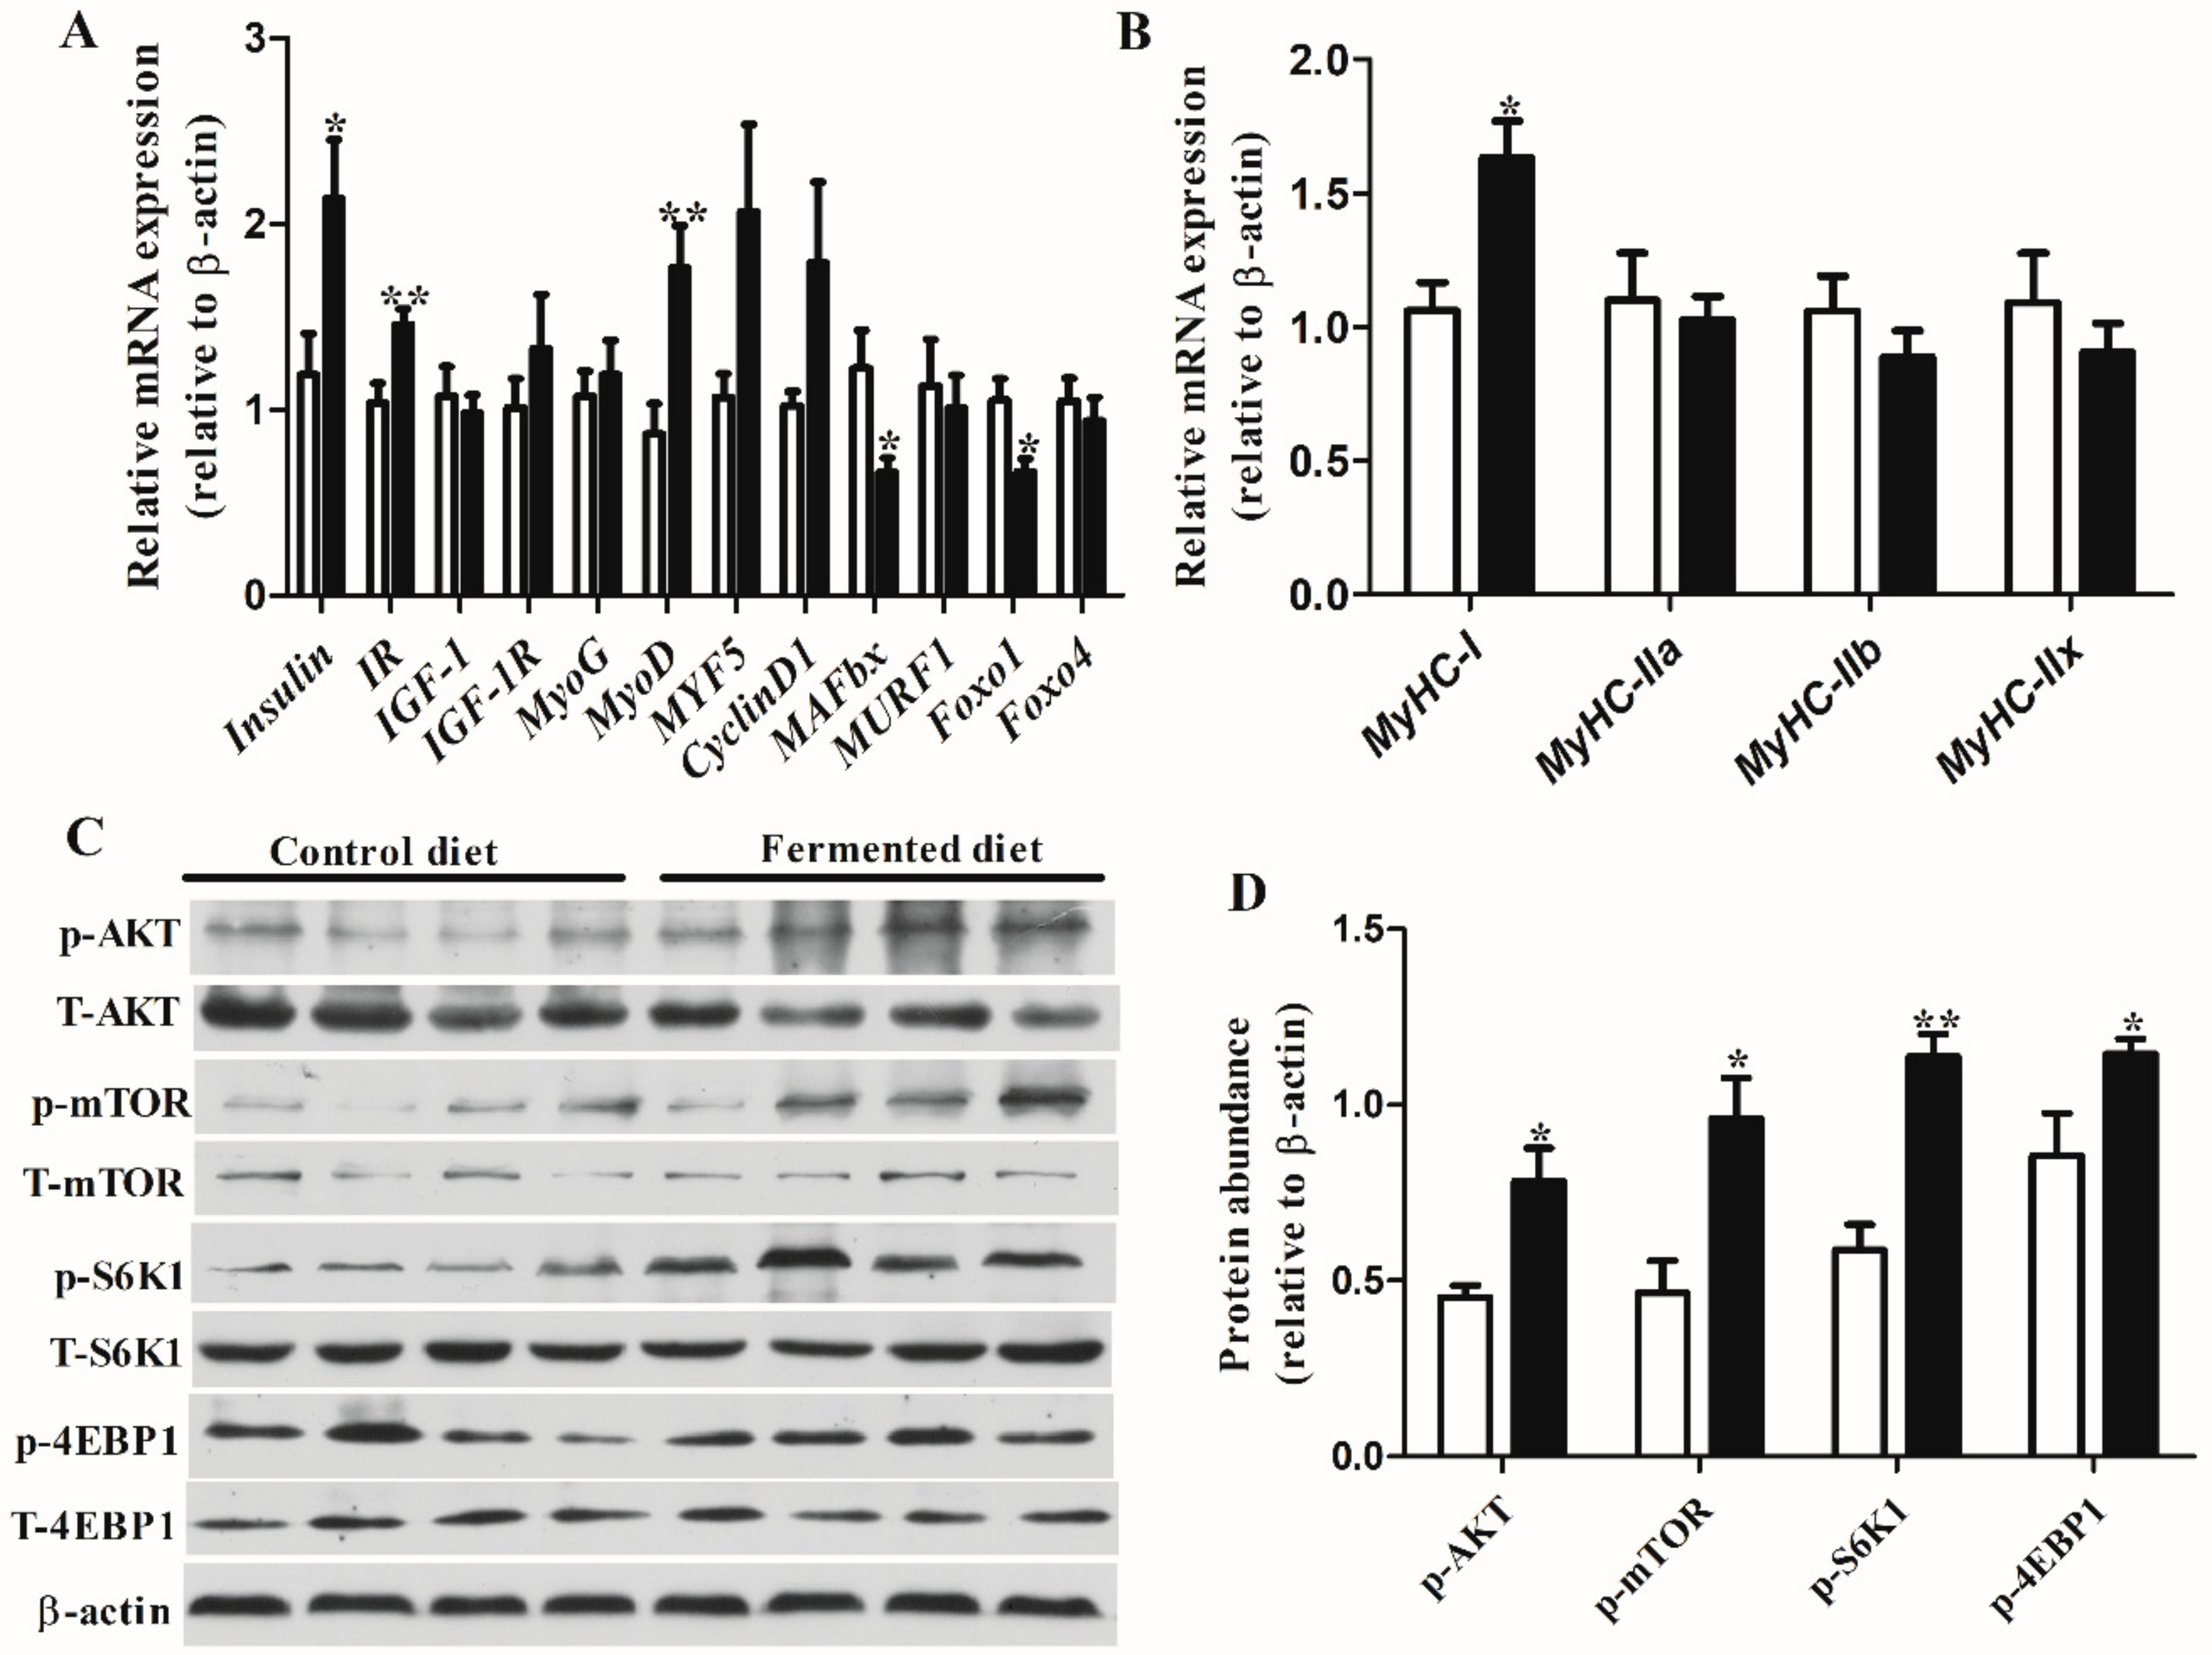
3.3. Diets Effect on Expression of Genes and Proteins Involved in Muscle Growth in LT
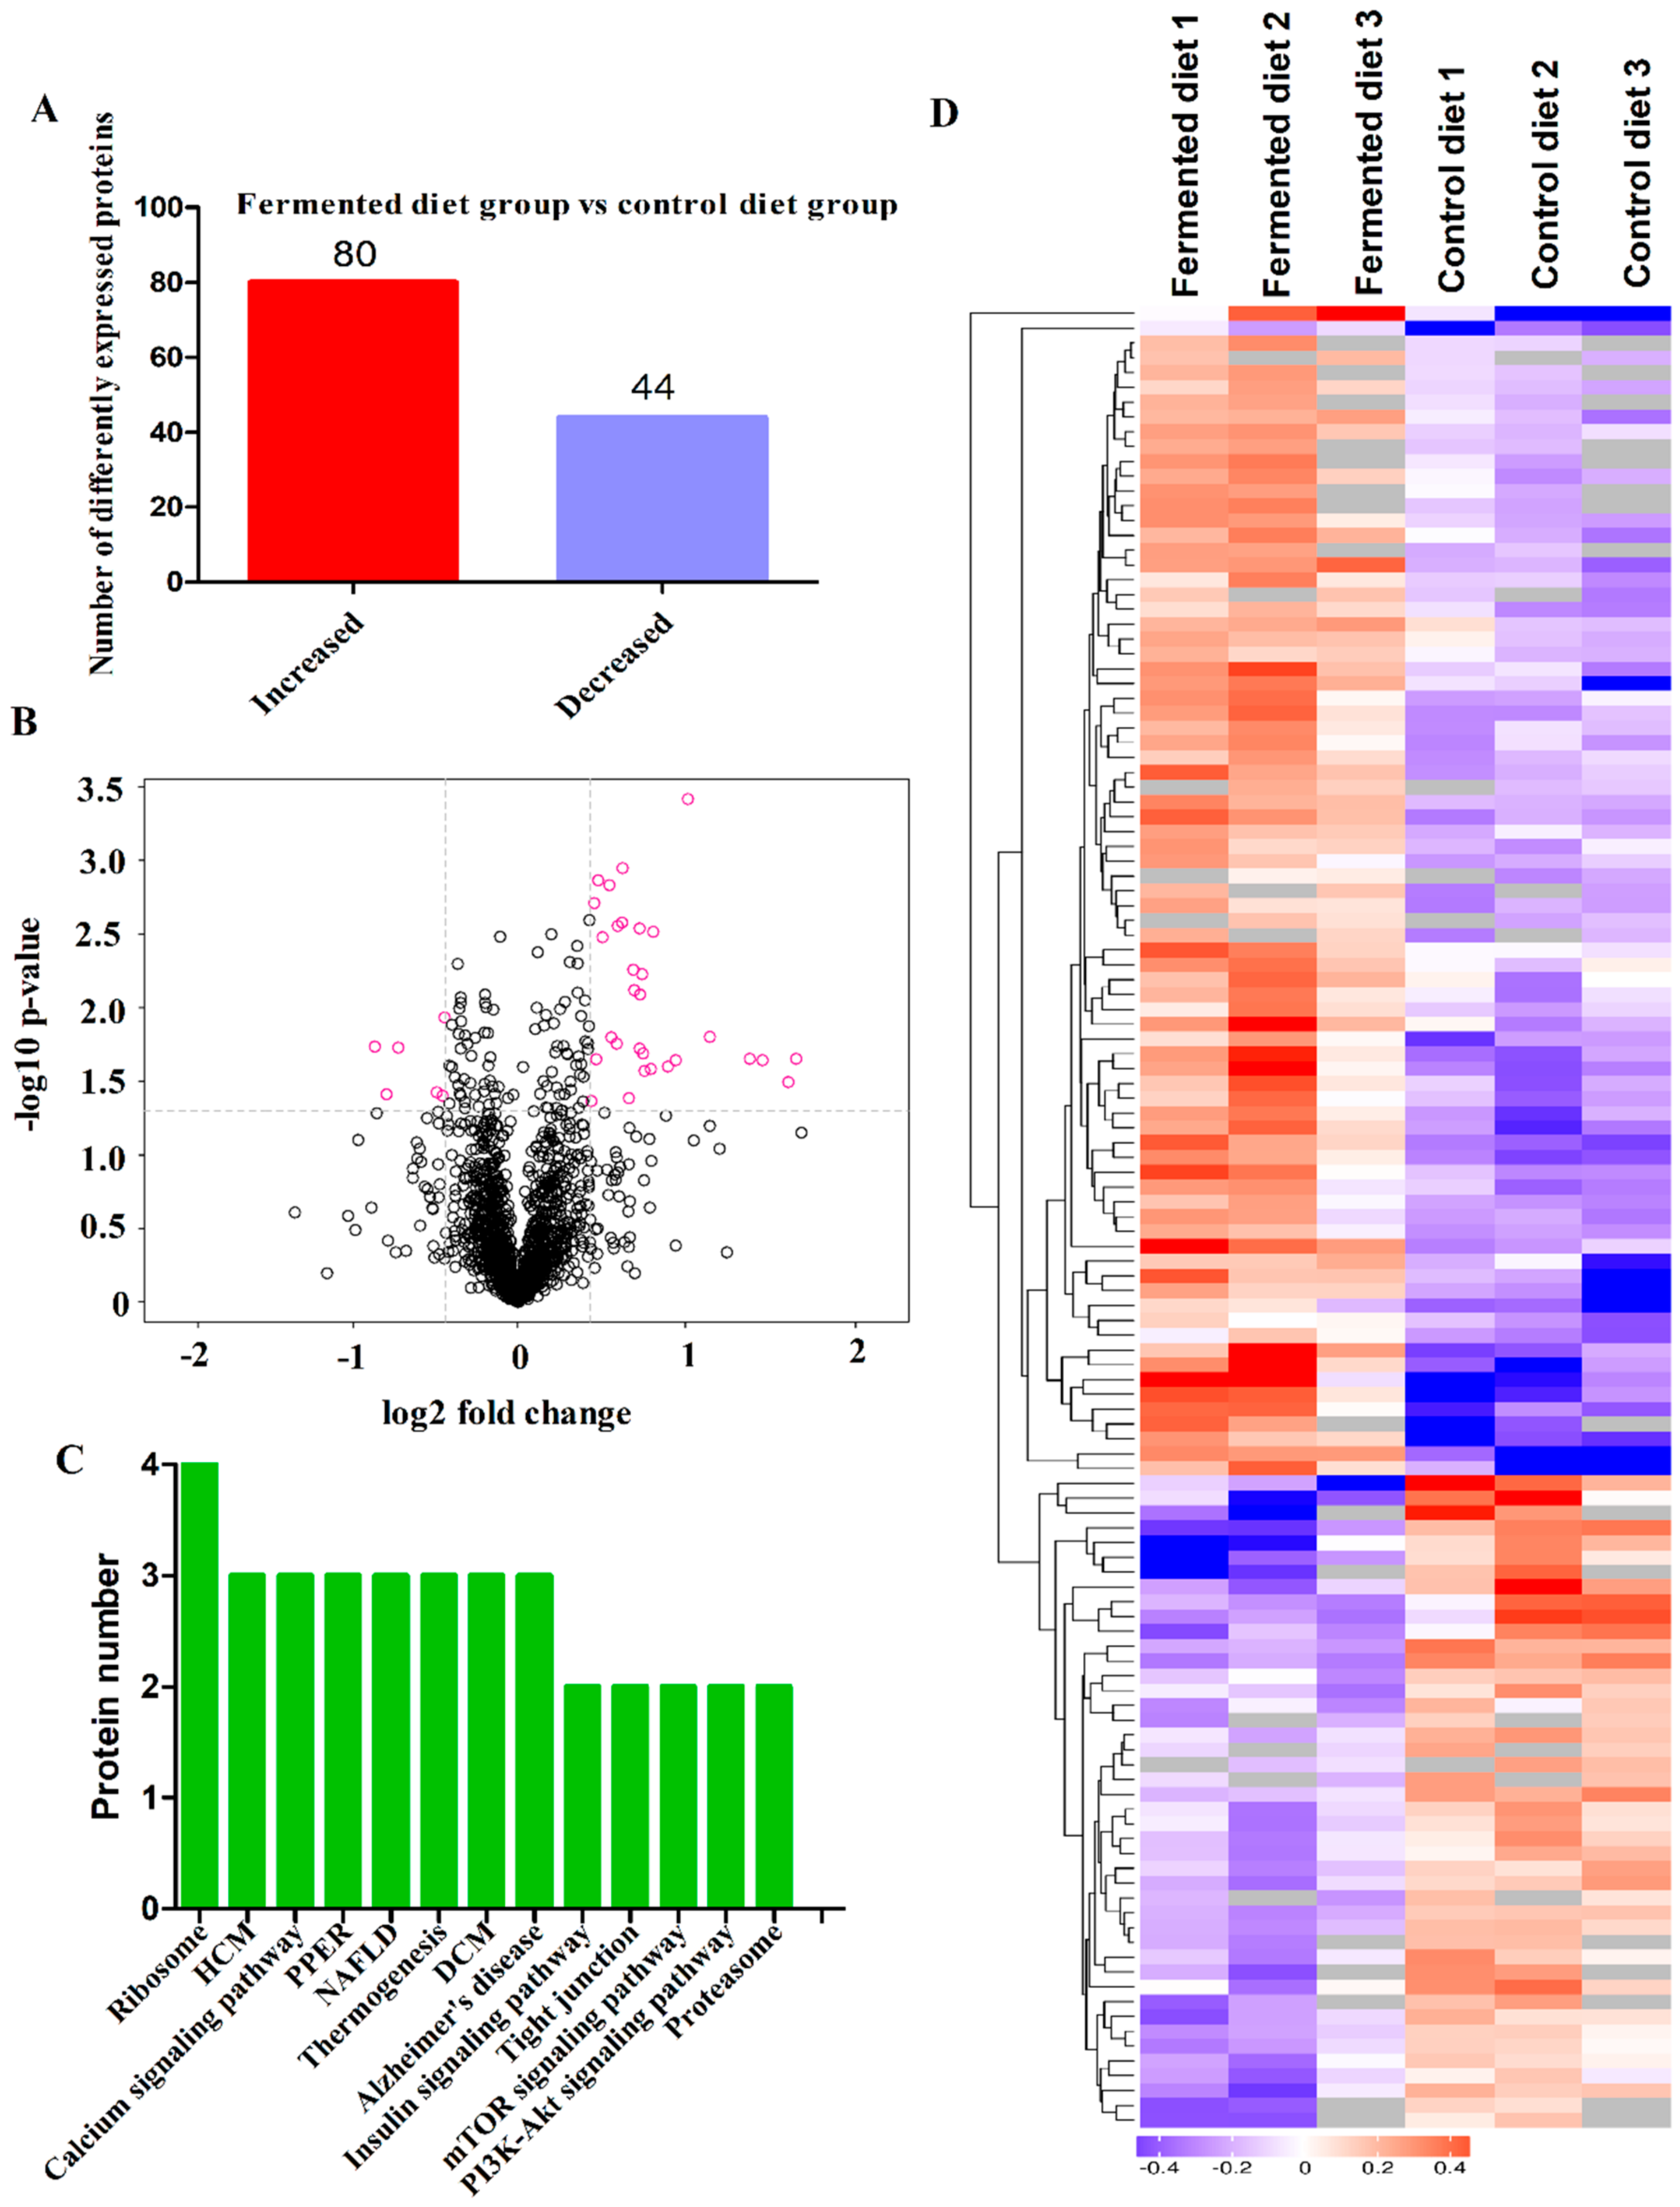
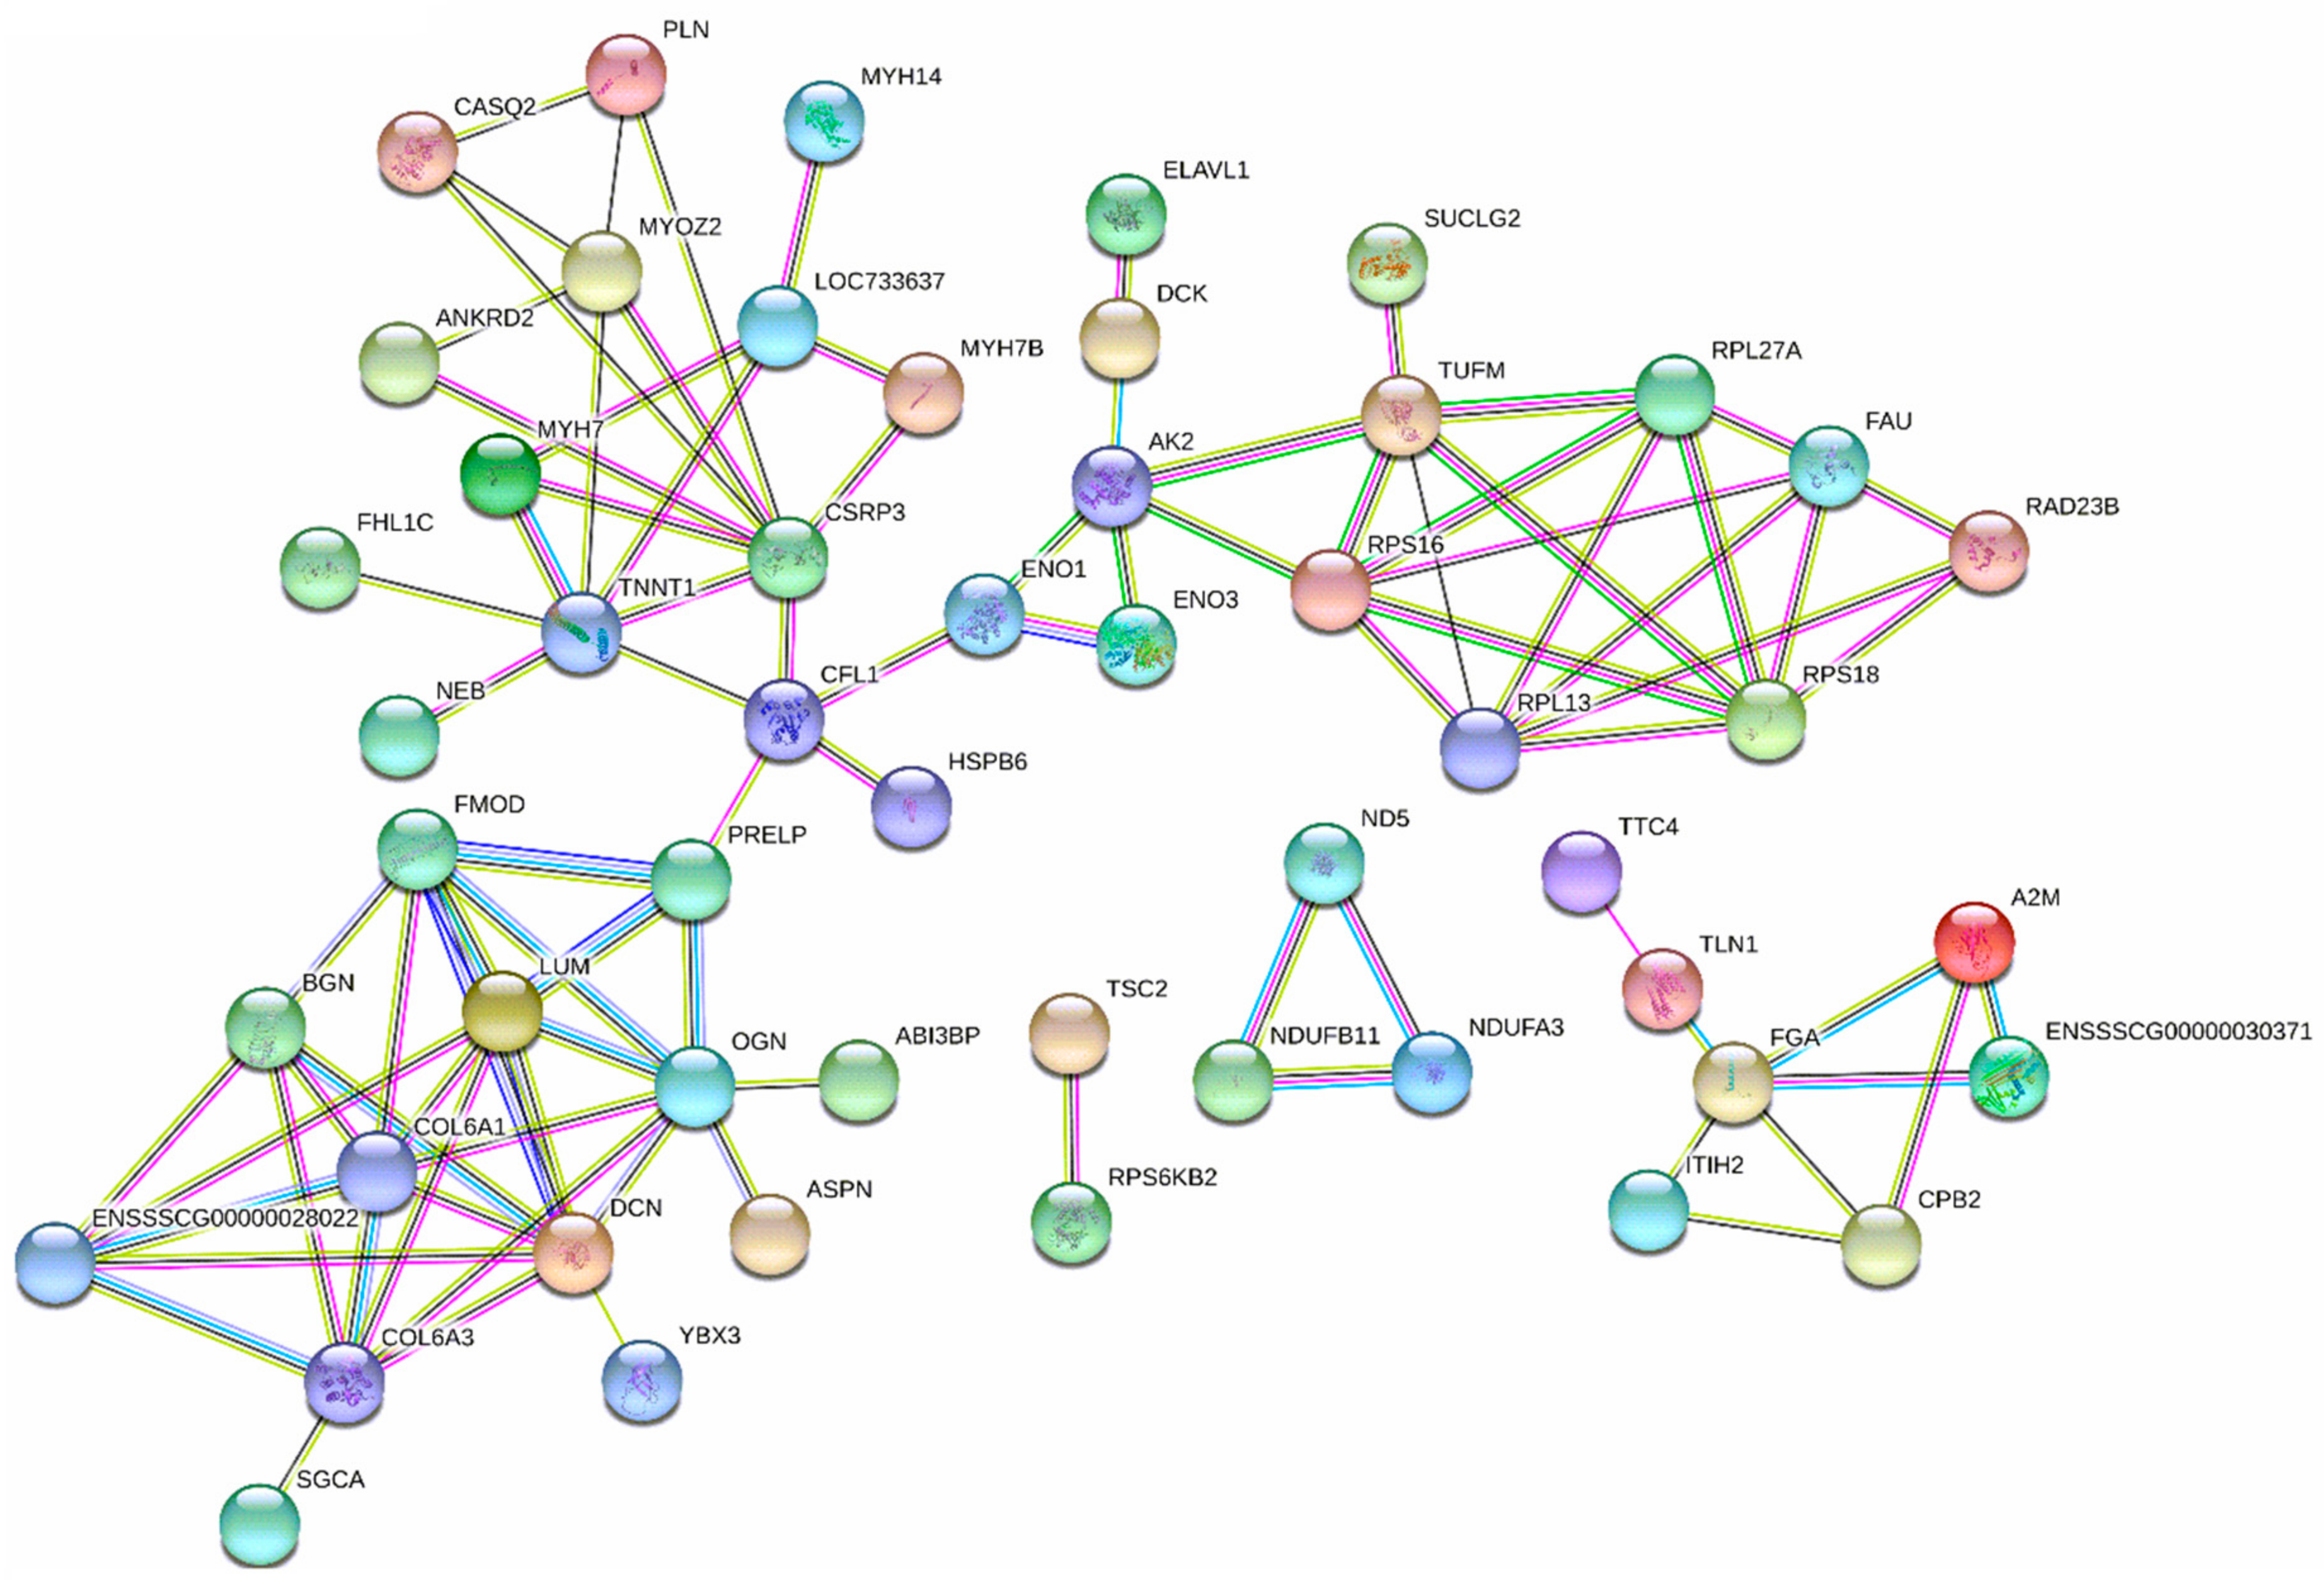
3.4. Diets Effect on Proteomics Profiles of LT
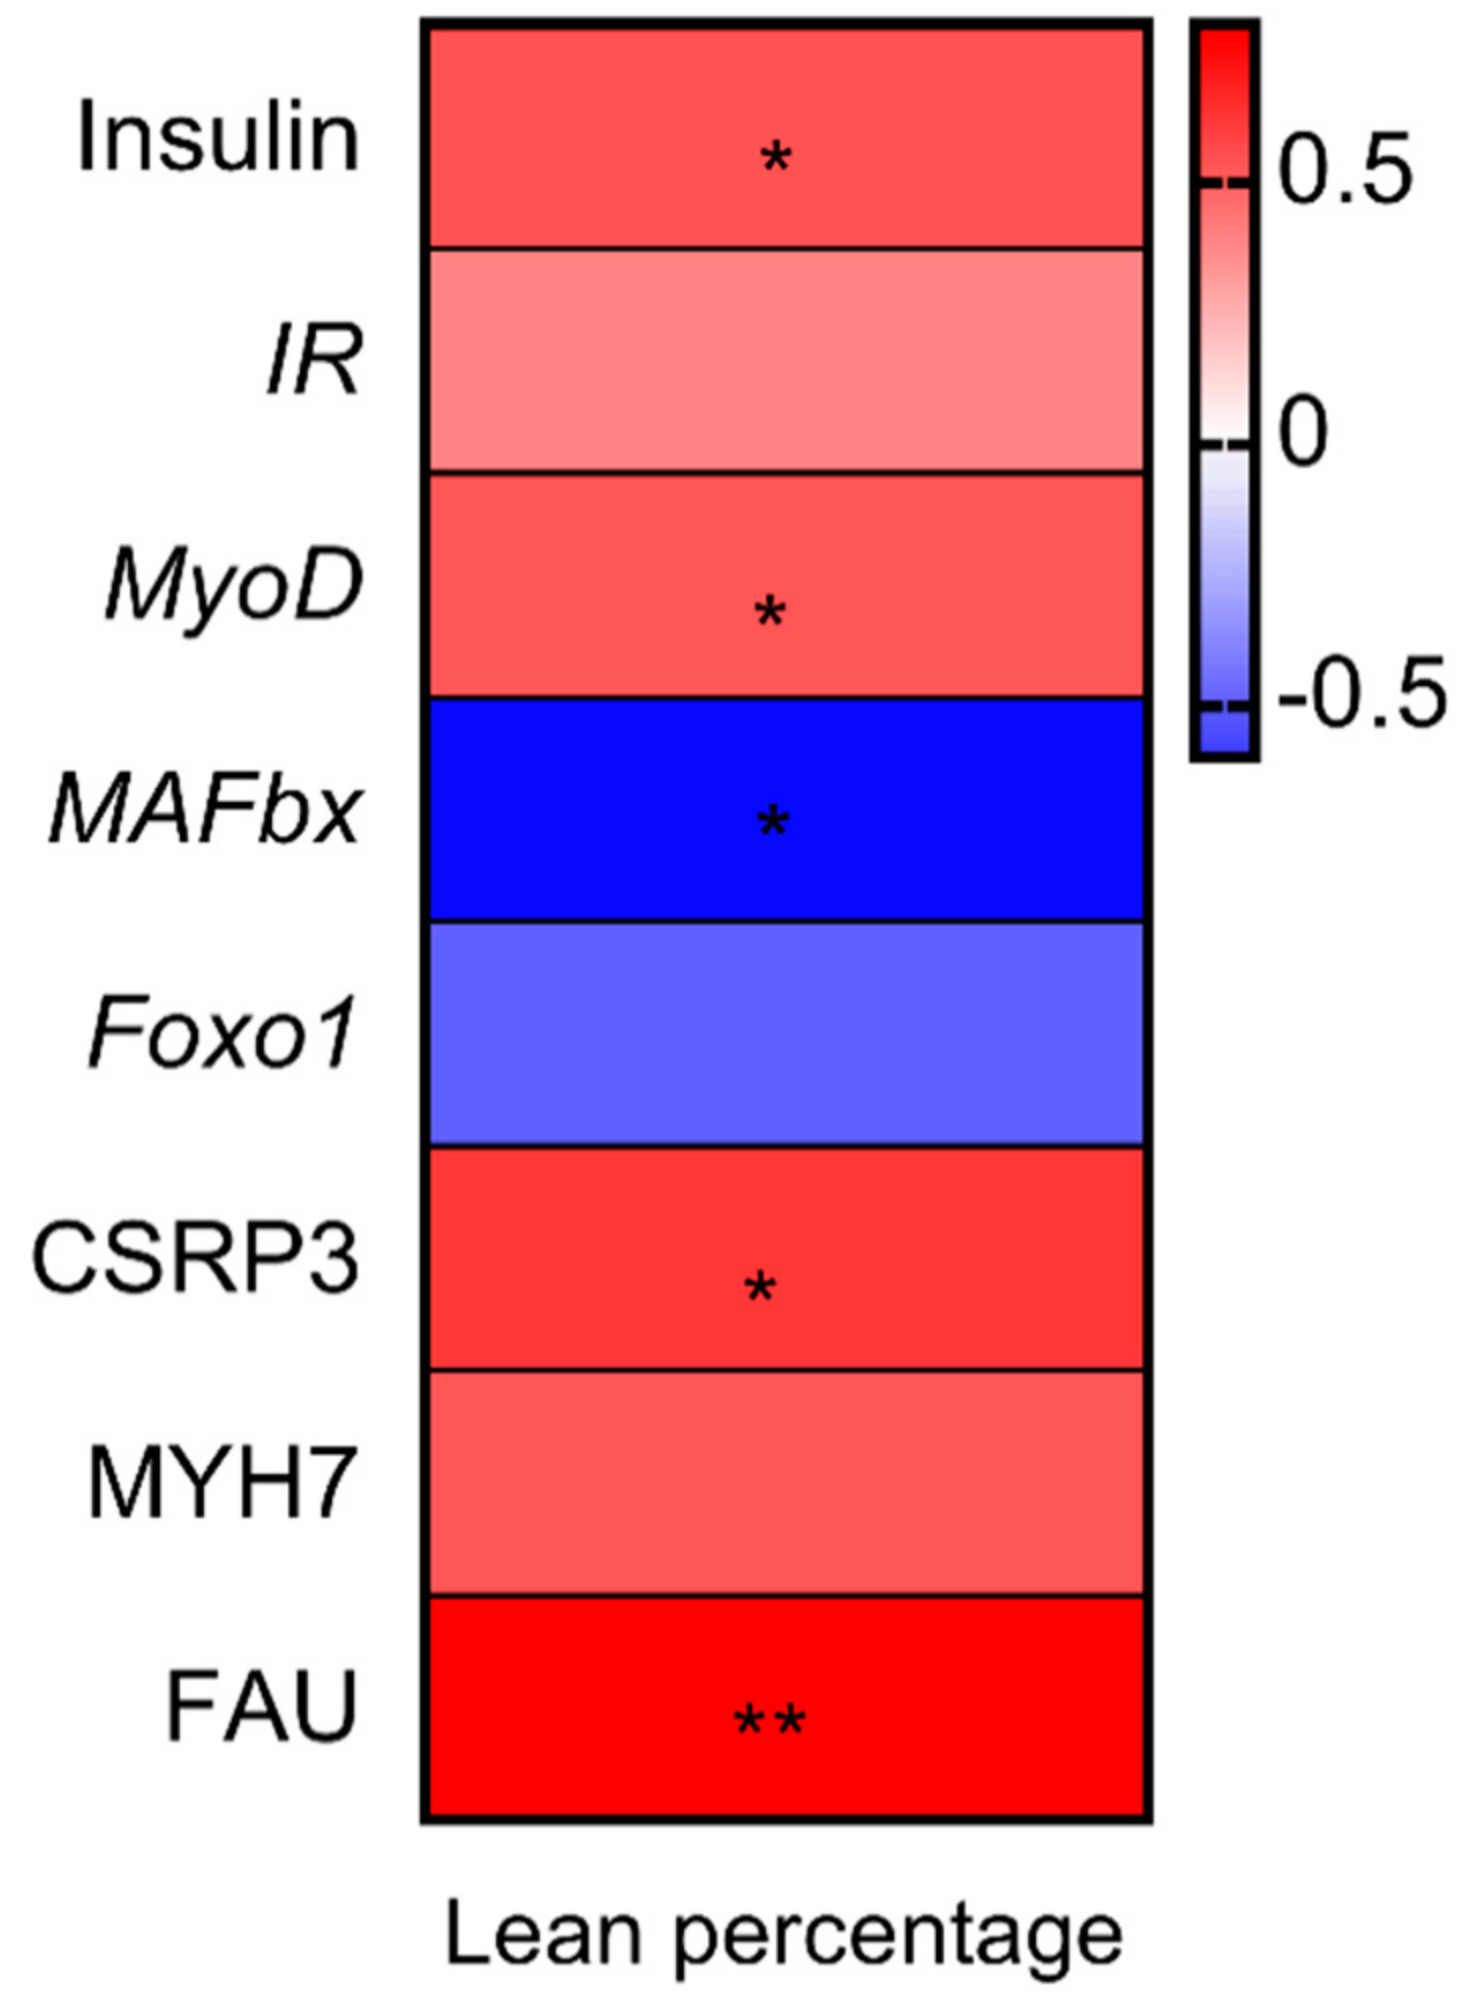
3.5. Correlation Analysis between Percentage Lean Meat, Gene Expression and Proteins Related to Muscle Growth
4. Discussion
5. Conclusions
Author Contributions
Funding
Acknowledgments
Conflicts of Interest
References
- Plumed-Ferrer, C.; Von Wright, A. Fermented pig liquid feed: nutritional, safety and regulatory aspects. J. Appl. Microbiol. 2009, 106, 351–368. [Google Scholar] [CrossRef] [PubMed]
- Olstorpe, M.; Axelsson, L.; Schnurer, J.; Passoth, V.; Schnürer, J. Effect of starter culture inoculation on feed hygiene and microbial population development in fermented pig feed composed of a cereal grain mix with wet wheat distillers’ grain. J. Appl. Microbiol. 2010, 108, 129–138. [Google Scholar] [CrossRef] [PubMed]
- Kiarie, E.; Bhandari, S.; Scott, M.; Krause, D.O.; Nyachoti, C.M. Growth performance and gastrointestinal microbial ecology responses of piglets receiving Saccharomyces cerevisiae fermentation products after an oral challenge with Escherichia coli (K88)1. J. Anim. Sci. 2011, 89, 1062–1078. [Google Scholar] [CrossRef] [PubMed]
- Wang, C.; Shi, C.; Zhang, Y.; Song, D.; Lu, Z.; Wang, Y. Microbiota in fermented feed and swine gut. Appl. Microbiol. Biotechnol. 2018, 102, 2941–2948. [Google Scholar] [CrossRef]
- Zheng, L.; Li, D.; Li, Z.-L.; Kang, L.-N.; Jiang, Y.-Y.; Liu, X.-Y.; Chi, Y.-P.; Li, Y.-Q.; Wang, J.-H. Effects of Bacillus fermentation on the protein microstructure and anti-nutritional factors of soybean meal. Lett. Appl. Microbiol. 2017, 65, 520–526. [Google Scholar] [CrossRef]
- Shi, C.; He, J.; Yu, J.; Yu, B.; Mao, X.; Zheng, P.; Huang, Z.; Chen, D. Physicochemical Properties Analysis and Secretome of Aspergillus niger in Fermented Rapeseed Meal. PLoS ONE 2016, 11, e0153230. [Google Scholar] [CrossRef]
- Le, M.H.A.; Galle, S.; Yang, Y.; Landero, J.L.; Beltranena, E.; Gänzle, M.G.; Zijlstra, R.T. Effects of feeding fermented wheat with Lactobacillus reuteri on gut morphology, intestinal fermentation, nutrient digestibility, and growth performance in weaned pigs1. J. Anim. Sci. 2016, 94, 4677–4687. [Google Scholar] [CrossRef]
- Shi, C.; Zhang, Y.; Yin, Y.; Wang, C.; Lu, Z.; Wang, F.; Feng, J.; Wang, Y. Amino acid and phosphorus digestibility of fermented corn-soybean meal mixed feed with Bacillus subtilis and Enterococcus faecium fed to pigs1. J. Anim. Sci. 2017, 95, 3996–4004. [Google Scholar] [CrossRef] [PubMed]
- Shi, C.; Zhang, Y.; Lu, Z.; Wang, Y. Solid-state fermentation of corn-soybean meal mixed feed with Bacillus subtilis and Enterococcus faecium for degrading antinutritional factors and enhancing nutritional value. J. Anim. Sci. Biotechnol. 2017, 8, 50. [Google Scholar] [CrossRef]
- Canibe, N.; Jensen, B.B. Fermented and nonfermented liquid feed to growing pigs: effect on aspects of gastrointestinal ecology and growth performance. J. Anim. Sci. 2003, 81, 2019–2031. [Google Scholar] [CrossRef]
- Wang, N.F.; Chen, Q.; Le, G.W.; Shi, Y.H.; Sun, J. Effect of lactic acid fermented soybean meal on the growth performance, intestinal microflora and morphology of weaned piglets. J. Anim. Feed Sci. 2007, 16, 75–85. [Google Scholar] [CrossRef]
- Missotten, J.; Michiels, J.; DeGroote, J.; De Smet, S. Fermented liquid feed for pigs: an ancient technique for the future. J. Anim. Sci. Biotechnol. 2015, 6, 4. [Google Scholar] [CrossRef]
- Yin, F.; Farzan, A.; Wang, Q.; Yu, H.; Yin, J.; Hou, Y.; Friendship, R.; Gong, J. Reduction of salmonella enterica serovar typhimurium DT104 infection in experimentally challenged weaned pigs fed a lactobacillus-fermented feed. Foodborne Pathog. Dis. 2014, 11, 628–634. [Google Scholar] [CrossRef] [PubMed]
- Lee, S.D.; Kim, H.Y.; Jung, H.J.; Ji, S.Y.; Chowdappa, R.; Ha, J.H.; Song, Y.M.; Park, J.C.; Kil Moon, H.; Kim, I.C. The effect of fermented apple diet supplementation on the growth performance and meat quality in finishing pigs. Anim. Sci. J. 2009, 80, 79–84. [Google Scholar] [CrossRef] [PubMed]
- Xu, X.; Li, L.-M.; Li, B.; Guo, W.-J.; Ding, X.-L.; Xu, F.-Z. Effect of fermented biogas residue on growth performance, serum biochemical parameters, and meat quality in pigs. Asian-Australas. J. Anim. Sci. 2017, 30, 1464–1470. [Google Scholar] [CrossRef]
- Liu, P.; Zhao, J.; Guo, P.; Lu, W.; Geng, Z.; Levesque, C.L.; Johnston, L.J.; Wang, C.; Liu, L.; Zhang, J.; et al. Dietary corn bran fermented by bacillus subtilis MA139 decreased gut cellulolytic bacteria and microbiota diversity in finishing pigs. Front. Microbiol. 2017, 7. [Google Scholar] [CrossRef]
- Hu, J.; Lu, W.; Wang, C.; Zhu, R.; Qiao, J. Characteristics of solid-state fermented feed and its effects on performance and nutrient digestibility in growing-finishing pigs. Asian-Australas. J. Anim. Sci. 2008, 21, 1635–1641. [Google Scholar] [CrossRef]
- Kim, H.-Y.; Song, Y.-M.; Jin, S.-K.; Kim, I.-S.; Kang, Y.-S.; Lee, S.-D.; Chowdappa, R.; Ha, J.-H.; Kang, S.-M. The effect of change in meat quality parameters on pig longissimus dorsi muscle by the addition of fermented persimmon shell diet. Asian-Australas. J. Anim. Sci. 2005, 19, 286–291. [Google Scholar] [CrossRef]
- Yan, L.; Meng, Q.W.; Kim, I.H. Effects of fermented garlic powder supplementation on growth performance, nutrient digestibility, blood characteristics and meat quality in growing-finishing pigs. Anim. Sci. J. 2011, 83, 411–417. [Google Scholar] [CrossRef]
- Ahmed, S.T.; Mun, H.-S.; Islam, M.; Ko, S.-Y.; Yang, C.-J. Effects of dietary natural and fermented herb combination on growth performance, carcass traits and meat quality in grower-finisher pigs. Meat Sci. 2016, 122, 7–15. [Google Scholar] [CrossRef]
- Åby, B.A.; Kantanen, J.; Aass, L.; Meuwissen, T. Current status of livestock production in the Nordic countries and future challenges with a changing climate and human population growth. Acta Agric. Scand. Sect. A Anim. Sci. 2014, 64, 73–97. [Google Scholar] [CrossRef]
- Pandey, A. Solid-state fermentation. Biochem. Eng. J. 2003, 13, 81–84. [Google Scholar] [CrossRef]
- Luque de Castro, M.D.; Priego-Capote, F. Soxhlet extraction: Past and present panacea. J. Chromatogr. A 2010, 121, 2383–2389. [Google Scholar] [CrossRef]
- Wiśniewski, J.R.; Zougman, A.; Nagaraj, N.; Mann, M. Universal sample preparation method for proteome analysis. Nat. Methods 2009, 6, 359–362. [Google Scholar] [CrossRef] [PubMed]
- Chen, C.C.; Shih, Y.C.; Chiou, P.W.S.; Yu, B. Evaluating nutritional quality of single stage- and two stage-fermented soybean meal. Asian-Australas. J. Anim. Sci. 2010, 23, 598–606. [Google Scholar] [CrossRef]
- Shi, C.; He, J.; Yu, J.; Yu, B.; Mao, X.; Zheng, P.; Huang, Z.; Chen, D. Amino acid, phosphorus, and energy digestibility of Aspergillus niger fermented rapeseed meal fed to growing pigs1. J. Anim. Sci. 2015, 93, 2916–2925. [Google Scholar] [CrossRef]
- Sun, H.; Tang, J.-W.; Yao, X.-H.; Wu, Y.; Wang, X.; Liu, Y.; Lou, B. Partial substitution of fish meal with fermented cottonseed meal in juvenile black sea bream (Acanthopagrus schlegelii) diets. Aquaculture 2015, 446, 30–36. [Google Scholar] [CrossRef]
- Raimbault, M. General and microbiological aspects of solid substrate fermentation. Electron. J. Biotechnol. 1998, 1, 174–188. [Google Scholar] [CrossRef]
- Lohlum, S.A.; Forcados, E.G.; Chuku, A.; Agida, O.G.; Ozele, N. Corn cob as a feed component through fungal fermentation using Aspergillus niger. CIBTech. J. Microbiol. 2014, 3, 37–42. [Google Scholar]
- Rozan, P.; Villaum, C.; Bau, H.M.; Schwertz, A.; Nicolas, J.P.; Mejean, L. Detoxication of rapeseed meal by Rhizopus Oligosporus sp-T3: A first step towards rapeseed protein concentrate. Int. J. Food Sci. Technol. 1996, 31, 85–90. [Google Scholar] [CrossRef]
- Fang, J.; Cao, Y.; Matsuzaki, M.; Suzuki, H.; Kimura, H. Effects of apple pomace-mixed silage on growth performance and meat quality in finishing pigs. Anim. Sci. J. 2016, 87, 1516–1521. [Google Scholar] [CrossRef]
- Maltin, C.A.; Warkup, C.C.; Matthews, K.R.; Grant, C.M.; Porter, A.D.; Delday, M.I. Pig muscle fiber characteristics as a source of variation in eating quality. Meat Sci. 1997, 47, 237–248. [Google Scholar] [CrossRef]
- Ryu, Y.; Kim, B. The relationship between muscle fiber characteristics, postmortem metabolic rate, and meat quality of pig longissimus dorsi muscle. Meat Sci. 2005, 71, 351–357. [Google Scholar] [CrossRef] [PubMed]
- Fan, Q.; Long, B.; Yan, G.; Wang, Z.; Shi, M.; Bao, X.; Hu, J.; Li, X.; Chen, C.; Zheng, Z.; et al. Dietary leucine supplementation alters energy metabolism and induces slow-to-fast transitions in longissimus dorsi muscle of weanling piglets. Br. J. Nutr. 2017, 117, 1222–1234. [Google Scholar] [CrossRef]
- Zheng, L.; Wei, H.-K.; Cheng, C.; Xiang, Q.; Pang, J.; Peng, J. Supplementation of branched-chain amino acids to a reduced-protein diet improves growth performance in piglets: involvement of increased feed intake and direct muscle growth-promoting effect. Br. J. Nutr. 2016, 115, 2236–2245. [Google Scholar] [CrossRef] [PubMed]
- Saltiel, A.; Kahn, C.R. Insulin signalling and the regulation of glucose and lipid metabolism. Nature 2001, 414, 799–806. [Google Scholar] [CrossRef]
- Manning, B.D.; Cantley, L.C. AKT/PKB signaling: Navigating downstream. Cell 2007, 129, 1261–1274. [Google Scholar] [CrossRef]
- Suryawan, A.; Torrazza, R.M.; Gazzaneo, M.C.; Orellana, R.A.; Fiorotto, M.L.; El-Kadi, S.W.; Srivastava, N.; Nguyen, H.V.; Davis, T.A. Enteral leucine supplementation increases protein synthesis in skeletal and cardiac muscles and visceral tissues of neonatal pigs through mTORC1-dependent pathways. Pediatr. Res. 2012, 71, 324–331. [Google Scholar] [CrossRef]
- Zheng, L.; Wei, H.-K.; He, P.; Zhao, S.; Xiang, Q.; Pang, J.; Peng, J. Effects of supplementation of branched-chain amino acids to reduced-protein diet on skeletal muscle protein synthesis and degradation in the fed and fasted states in a piglet model. Nutrients 2016, 9, 17. [Google Scholar] [CrossRef]
- Zhang, B.; Lin, M.; Yu, C.; Li, J.; Zhang, L.; Zhou, P.; Yang, W.; Gao, F.; Zhou, G. Alanyl-glutamine supplementation regulates mTOR and ubiquitin proteasome proteolysis signaling pathways in piglets. Nutrients 2016, 32, 1123–1131. [Google Scholar] [CrossRef]
- Zhang, S.-H.; Ren, M.; Zeng, X.; He, P.; Ma, X.; Qiao, S. Leucine stimulates ASCT2 amino acid transporter expression in porcine jejunal epithelial cell line (IPEC-J2) through PI3K/Akt/mTOR and ERK signaling pathways. Amino Acids 2014, 46, 2633–2642. [Google Scholar] [CrossRef] [PubMed]
- Zhang, S.R.; Chen, X.L.; Huang, Z.Q.; Chen, D.W.; Yu, B.; Chen, H.; Luo, J.Q.; He, J.; Zheng, P.; Yu, J. Leucine promotes differentiation of porcine myoblasts through the protein kinase B (Akt)/Forkhead box O1 signalling pathway. Br. J. Nutr. 2018, 119, 727–733. [Google Scholar] [CrossRef] [PubMed]
- Nakashima, K.; Ishida, A.; Yamazaki, M.; Abé, H. Leucine suppresses myofibrillar proteolysis by down-regulating ubiquitin–proteasome pathway in chick skeletal muscles. Biochem. Biophys. Res. Commun. 2005, 336, 660–666. [Google Scholar] [CrossRef]
- Louard, R.J.; Barrett, E.J.; Gelfand, R.A. Overnight branched-chain amino acid infusion causes sustained suppression of muscle proteolysis. Metabolism 1995, 44, 424–429. [Google Scholar] [CrossRef]
- Maki, T.; Yamamoto, D.; Nakanishi, S.; Iida, K.; Iguchi, G.; Takahashi, Y.; Kaji, H.; Chihara, K.; Okimura, Y. Branched-chain amino acids reduce hindlimb suspension-induced muscle atrophy and protein levels of atrogin-1 and MuRF1 in rats. Nutr. Res. 2012, 32, 676–683. [Google Scholar] [CrossRef]
- Kousteni, S. FoxO1, the transcriptional chief of staff of energy metabolism. Bone 2012, 50, 437–443. [Google Scholar] [CrossRef]
- Shi, X.; Garry, D.J. Muscle stem cells in development, regeneration, and disease. Genes Dev. 2006, 20, 1692–1708. [Google Scholar] [CrossRef]
- Lindström, M.S. Emerging functions of ribosomal proteins in gene-specific transcription and translation. Biochem. Biophys. Res. Commun. 2009, 379, 167–170. [Google Scholar] [CrossRef] [PubMed]
- De Klerk, E.; Fokkema, I.F.; Thiadens, K.A.; Goeman, J.J.; Palmblad, M.; Dunnen, J.T.D.; Von Lindern, M.; Hoen, P.A.C. Assessing the translational landscape of myogenic differentiation by ribosome profiling. Nucleic Acids Res. 2015, 43, 4408–4428. [Google Scholar] [CrossRef] [PubMed]
- Geier, C.; Gehmlich, K.; Ehler, E.; Hassfeld, S.; Perrot, A.; Hayess, K.; Cardim, N.; Wenzel, K.; Erdmann, B.; Krackhardt, F.; et al. Beyond the sarcomere: CSRP3 mutations cause hypertrophic cardiomyopathy. Hum. Mol. Genet. 2008, 17, 2753–2765. [Google Scholar] [CrossRef]
- Bian, Z.-Y.; Huang, H.; Jiang, H.; Shen, D.-F.; Yan, L.; Zhu, L.-H.; Wang, L.; Cao, F.; Liu, C.; Tang, Q.-Z.; et al. LIM and cysteine-rich domains 1 regulates cardiac hypertrophy by targeting calcineurin/nuclear factor of activated T cells signaling. Hypertension 2010, 55, 257–263. [Google Scholar] [CrossRef] [PubMed]
- Goody, M.F.; Sher, R.B.; Henry, C.A. Hanging on for the ride: adhesion to the extracellular matrix mediates cellular responses in skeletal muscle morphogenesis and disease. Dev. Biol. 2015, 401, 75–91. [Google Scholar] [CrossRef] [PubMed]
- Ohlendieck, K. The extracellular matrix complexome from skeletal muscle. In Composition and Function of the Extracellular Matrix in the Human Body; IntechOpen: London, UK, 2016; pp. 69–92. [Google Scholar]


 : proteins of unknown three-dimensional structure; filled nodes
  : some three-dimensional structure is known or predicted; colored nodes: query proteins and first shell of interactors. Edges represent protein-protein associations; known Interactions:
  from curated databases and
  experimentally determined; predicted interactions:
  gene neighborhood,
  gene fusions and
  gene co-occurrence. Others:
  text mining,
  co-expression and
  protein homolog.
: proteins of unknown three-dimensional structure; filled nodes : some three-dimensional structure is known or predicted; colored nodes: query proteins and first shell of interactors. Edges represent protein-protein associations; known Interactions: from curated databases and experimentally determined; predicted interactions: gene neighborhood, gene fusions and gene co-occurrence. Others: text mining, co-expression and protein homolog.
protein homolog.
: proteins of unknown three-dimensional structure; filled nodes : some three-dimensional structure is known or predicted; colored nodes: query proteins and first shell of interactors. Edges represent protein-protein associations; known Interactions: from curated databases and experimentally determined; predicted interactions: gene neighborhood, gene fusions and gene co-occurrence. Others: text mining, co-expression and protein homolog.


| Ingredients, % | % | Nutrient Content 2 | |
|---|---|---|---|
| yellow corn (8.1% CP) | 66 | Digestible energy, kcal/kg | 3386.63 |
| soybean meal (46% CP) | 13 | Metabolizable energy, kcal/kg | 3233.67 |
| soybean hulls | 15 | Net energy, kcal/kg | 2433.02 |
| L-Lys-HCL | 0.2 | Crude protein | 13.03 |
| L-Thr | 0.05 | Calcium | 0.68 |
| soybean oil | 2 | Total phosphorus | 0.50 |
| limestone powder | 0.8 | Available phosphorus | 0.28 |
| Calcium monohydrogen phosphate | 1 | Standardized ileal digestible Lys | 0.66 |
| sodium chloride | 0.95 | Standardized ileal digestible Met | 0.19 |
| Premix 1 | 1 | Standardized ileal digestible Met + cys | 0.4 |
| Total | 100 | Standardized ileal digestible Thr | 0.44 |
| Standardized ileal digestible Trp | 0.11 |
| Genes | Sequences (5′–3′) | Product Size (bp) | GenBank Accession | |
|---|---|---|---|---|
| MAFbX | Forward | CCCTCTCATTCTGTCACCTTG | 104 | NM_001044588 |
| Reverse | ATGTGCTCTCCCACCATAGC | |||
| MyoG | Forward | CTTCTACCAGGAACCCCACT | 230 | NM_001012406 |
| Reverse | TCCCCAGCCCCTTATCTT | |||
| MyoD | Forward | ATGATGACCCGTGTTTCG | 383 | NM_001002824 |
| Reverse | GCCTCGTTGACTTTGCTC | |||
| MuRF1 | Forward | GCTGGATTGGAAGAAGATGTAT | 144 | NM_001184756 |
| Reverse | AGGAAAGAATGTGGCAGTGTCT | |||
| IGF-1 | Forward | TCTTCAGTTCGTGTGCGGAG | 165 | NM_214256 |
| Reverse | TTGGCAGGCTTGAGGGGT | |||
| IGF-1R | Forward | ATGGAGGAAGTGACAGGGACTA | 116 | XM_003361272 |
| Reverse | GTGGTGGTGGAGGTGAAGTG | |||
| Foxo1 | Forward | F: CGGCATCATCTTCATCGTC 125 | 125 | NM_214014.2 |
| Reverse | R: CTGTCCTCCCACTCCAGGTA | |||
| Foxo4 | Forward | F: CTGTCCTACGCCGACCTCAT 103 | 103 | NM_003135172.2 |
| Reverse | R: TTGCTGTCACCCTTATCCTTG | |||
| IR | Forward | F: CATACCTGAACGCCAAGAAGTT | 100 | XM_003123154 |
| Reverse | R: GTCATTCCAAAGTCTCCGATTT | |||
| Insulin | Forward | CGCGGCTTCTTCTACAC | 134 | NM_001109772 |
| Reverse | ACGATGCCACGCTTCTG | |||
| CyclinD1 | Forward | AGGTTGGGAGTGCGTTG | 166 | XM_021082686.1 |
| Reverse | TTGGCGGAGATTTGGAG | |||
| MYF5 | Forward | GTTCGGGGACGAGTTTG | 272 | NM_001278775.1 |
| Reverse | GCCTCTGGTTGGGGTTA | |||
| MyHC-I | Forward | GGCCCCTTCCAGCTTGA | 63 | L10129 |
| Reverse | TGGCTGCGCCTTGGTTT | |||
| MyHC-IIa | Forward | TTAAAAAGCTCCAAGAACTGTTTCA | 100 | U11772 |
| Reverse | CCATTTCCTGGTCGGAACTC | |||
| MyHC-IIb | Forward | CACTTTAAGTAGTTGTCTGCCTTGAG | 80 | U90720 |
| Reverse | GGCAGCAGGGCACTAGATGT | |||
| MyHC-IIx | Forward | AGCTTCAAGTTCTGCCCCACT | 76 | U90719 |
| Reverse | GGCTGCGGGTTATTGATGG | |||
| β-actin | Forward | CATCGTCCACCGCAAAT | 210 | NC_010445 |
| Reverse | TGTCACCTTCACCGTTCC | |||
| Item | Control Diet | Fermented Diet | p Value |
|---|---|---|---|
| Analyzed Chemical Composition 1 | |||
| Dry matter (%) | 87.95 ± 0.10 | 62.19 ± 0.29 | <0.01 |
| Crude fiber (%) | 6.72 ± 0.36 | 6.29 ± 0.22 | 0.04 |
| Neutral detergent fiber (%) | 15.05 ± 1.01 | 15.85 ± 0.53 | 0.85 |
| Acid detergent fiber (%) | 7.22 ± 0.32 | 8.64 ± 0.18 | 0.44 |
| Crude protein (%) | 12.94 ± 0.07 | 13.77 ± 0.09 | <0.01 |
| Crude fat (%) | 4.15 ± 0.06 | 4.55 ± 0.20 | 0.43 |
| Profile of Amino Acids (mg 100 g−1) | |||
| Aspartic acid | 1.17 ± 0.01 | 1.27 ± 0.02 | <0.01 |
| Threonine | 0.52 ± 0.00 | 0.53 ± 0.01 | 0.43 |
| Serine | 0.62 ± 0.01 | 0.66 ± 0.01 | 0.01 |
| Glutamic acid | 2.33 ± 0.03 | 2.40 ± 0.03 | 0.02 |
| Glycine | 0.51 ± 0.01 | 0.66 ± 0.01 | <0.01 |
| Alanine | 0.73 ± 0.01 | 0.83 ± 0.01 | <0.01 |
| Cysteine | 0.16 ± 0.00 | 0.22 ± 0.01 | <0.01 |
| Valine | 0.61 ± 0.01 | 0.67 ± 0.01 | <0.01 |
| Methionine | 0.09 ± 0.00 | 0.09 ± 0.00 | 0.66 |
| Isoleucine | 0.52 ± 0.01 | 0.58 ± 0.01 | 0.00 |
| Leucine | 1.18 ± 0.00 | 1.30 ± 0.01 | <0.01 |
| Tyrosine | 0.22 ± 0.01 | 0.35 ± 0.01 | <0.01 |
| Phenylalanine | 0.61 ± 0.01 | 0.66 ± 0.01 | 0.01 |
| Lysine | 0.87 ± 0.01 | 0.92 ± 0.01 | 0.02 |
| Histidine | 0.35 ± 0.00 | 0.38 ± 0.01 | 0.01 |
| Arginine | 0.67 ± 0.01 | 0.65 ± 0.01 | 0.25 |
| Proline | 0.82 ± 0.01 | 0.90 ± 0.01 | <0.01 |
| Other Biochemical Indexes | |||
| pH | 6.11 ± 0.00 | 4.88 ± 0.03 | <0.01 |
| Lactic acid (mmol/kg) | 23.56 ± 1.34 | 165.07 ± 5.25 | <0.01 |
| Control Diet | Fermented Diet | p Value | ||
|---|---|---|---|---|
| Initial BW (kg) | 98.86 ± 0.32 | 98.25 ± 0.27 | 0.16 | |
| Final BW (kg) | 130.78 ± 1.14 | 134.93 ± 1.97 | 0.66 | |
| ADG (kg) | 0.84 ± 0.03 | 0.94 ± 0.10 | 0.27 | |
| ADFI (kg, on an 88% DM basis) | 3.34 ± 0.12 | 3.06 ± 0.11 | 0.13 | |
| F/G | 4.05 ± 0.15 | 3.29 ± 0.08 | 0.07 | |
| Loin eye area (cm2) | 61.56 ± 2.47 | 70.61 ± 2.25 | 0.03 | |
| Lean mass (%) | 53.1 ± 1.26 | 61.3 ± 1.72 | <0.01 | |
| Backfat depth (cm) | First rib | 4.36 ± 0.34 | 4.49± 0.31 | 0.67 |
| 10th rib | 3.13 ± 0.34 | 3.01 ± 0.23 | 0.80 | |
| Last rib | 2.67 ± 0.15 | 2.11 ± 0.16 | 0.03 | |
| Control Diet | Fermented Diet | p Value | |
|---|---|---|---|
| Drip loss24h (%) | 2.55 ± 0.15 | 2.43 ± 0.07 | 0.46 |
| Drip loss48h (%) | 3.85 ± 0.14 | 3.08 ± 0.23 | 0.01 |
| Shear force (N) | 66.78 ± 4.50 | 49.96 ± 3.10 | 0.01 |
| pH45min | 5.94 ± 0.11 | 6.07 ± 0.06 | 0.36 |
| pH24h | 5.51 ± 0.03 | 5.53 ± 0.03 | 0.92 |
| pH48h | 5.61 ± 0.03 | 5.51 ± 0.03 | 0.09 |
| L * (lightness)45min | 46.63 ± 0.94 | 46.14 ± 0.62 | 0.66 |
| a * (redness)45min | 16.82 ± 0.60 | 16.66 ± 0.62 | 0.81 |
| b * (yellowness)45min | 1.71 ± 0.38 | 2.01 ± 0.18 | 0.47 |
| L * (lightness)24h | 54.93 ± 0.54 | 54.47 ± 0.15 | 0.77 |
| a * (redness)24h | 17.67 ± 0.48 | 17.18 ± 0.28 | 0.40 |
| b * (yellowness)24h | 2.21 ± 0.25 | 2.46 ± 0.25 | 0.48 |
| L * (lightness)48h | 54.60 ± 0.82 | 54.33 ± 0.15 | 0.85 |
| a * (redness)48h | 18.72 ± 0.59 | 17.90 ± 0.49 | 0.31 |
| b * (yellowness)48h | 1.82 ± 0.31 | 2.41 ± 0.26 | 0.18 |
| Intramuscular fat (%) | 1.22 ± 0.11 | 1.13 ± 0.26 | 0.75 |
| Control Diet | Fermented Diet | p Value | |
|---|---|---|---|
| Cooked Pork Sensory Traits | |||
| Juiciness | 4.52 ± 0.10 | 4.48 ± 0.13 | 0.56 |
| Tenderness | 4.26 ± 0.22 | 4.73 ± 0.11 | 0.04 |
| Flavor | 4.72 ± 0.07 | 4.96 ± 0.10 | 0.07 |
| Fragrance | 4.79 ± 0.07 | 5.18 ± 0.10 | 0.02 |
| Off-flavors | 5.13 ± 0.07 | 5.27 ± 0.17 | 0.29 |
| Broth freshness | 4.85 ± 0.07 | 5.31 ± 0.10 | 0.01 |
| Color | 4.89 ± 0.09 | 5.15 ± 0.1 | 0.10 |
| Protein IDs | Gene Name | Protein Name | Fold Change | p Value |
|---|---|---|---|---|
| Protein Synthesis | ||||
| F1RFI1 | TUFM | Elongation factor Tu | 0.82 | 0.04 |
| P62272 | RPS18 | 40S ribosomal protein S18 | 1.29 | 0.01 |
| K7GKC0 | RPS16 | 40S ribosomal protein S16 | 1.83 | 0.05 |
| A0A287AWS4 | RPL27A | 60S ribosomal protein L27a | 1.30 | 0.03 |
| I3LSD3 | RPL13 | 60S ribosomal protein L13 | 1.33 | 0.02 |
| P62863 | FAU | 40S ribosomal protein S30 | 1.56 | 0.001 |
| SLRP-type proteoglycans and collagens | ||||
| F1SUE4 | ASPN | Aspirin | 1.24 | 0.03 |
| F1SQ09 | LUM | Lumican | 1.31 | 0.04 |
| A0A0H5ANC0 | OGN | Osteoglycin | 1.45 | 0.00 |
| F1S6B4 | PRELP | Proline and arginine rich end leucine rich repeat protein | 1.73 | 0.01 |
| F1S6B5 | FMOD | Fibromodulin | 2.24 | 0.05 |
| F1S2B6 | BGN | Biglycan | 1.70 | 0.02 |
| Q9XSD9 | DCN | Decorin | 1.51 | 0.01 |
| Q1T7A8 | COL6A1 | Type VI collagen alpha-1 chain | 1.47 | 0.01 |
| I3LQ84 | COL6A2 | Collagen type VI alpha 2 chain | 1.48 | 0.02 |
| A0A287BPF4 | COL6A3 | Collagen type VI alpha 3 chain | 1.65 | 0.00 |
| Muscle contraction and hypertrophy | ||||
| F1S4 × 7 | MYH7B | Myosin heavy chain 7B | 1.32 | 0.01 |
| P79293 | MYH7 | Myosin-7 | 1.68 | 0.03 |
| Q75ZZ6 | TNNT1 | Troponin T | 0.68 | 0.02 |
| F6Q6A7 | CSRP3 | Cysteine and glycine-rich protein 3 | 1.26 | 0.04 |
© 2020 by the authors. Licensee MDPI, Basel, Switzerland. This article is an open access article distributed under the terms and conditions of the Creative Commons Attribution (CC BY) license (http://creativecommons.org/licenses/by/4.0/).
Share and Cite
Qiu, Y.; Li, K.; Zhao, X.; Liu, S.; Wang, L.; Yang, X.; Jiang, Z. Fermented Feed Modulates Meat Quality and Promotes the Growth of Longissimus Thoracis of Late-Finishing Pigs. Animals 2020, 10, 1682. https://doi.org/10.3390/ani10091682
Qiu Y, Li K, Zhao X, Liu S, Wang L, Yang X, Jiang Z. Fermented Feed Modulates Meat Quality and Promotes the Growth of Longissimus Thoracis of Late-Finishing Pigs. Animals. 2020; 10(9):1682. https://doi.org/10.3390/ani10091682
Chicago/Turabian StyleQiu, Yueqin, Kebiao Li, Xichen Zhao, Shilong Liu, Li Wang, Xuefen Yang, and Zongyong Jiang. 2020. "Fermented Feed Modulates Meat Quality and Promotes the Growth of Longissimus Thoracis of Late-Finishing Pigs" Animals 10, no. 9: 1682. https://doi.org/10.3390/ani10091682
APA StyleQiu, Y., Li, K., Zhao, X., Liu, S., Wang, L., Yang, X., & Jiang, Z. (2020). Fermented Feed Modulates Meat Quality and Promotes the Growth of Longissimus Thoracis of Late-Finishing Pigs. Animals, 10(9), 1682. https://doi.org/10.3390/ani10091682