Reestablishment of Social Hierarchies in Weaned Pigs after Mixing

 and
and
Simple Summary
Abstract

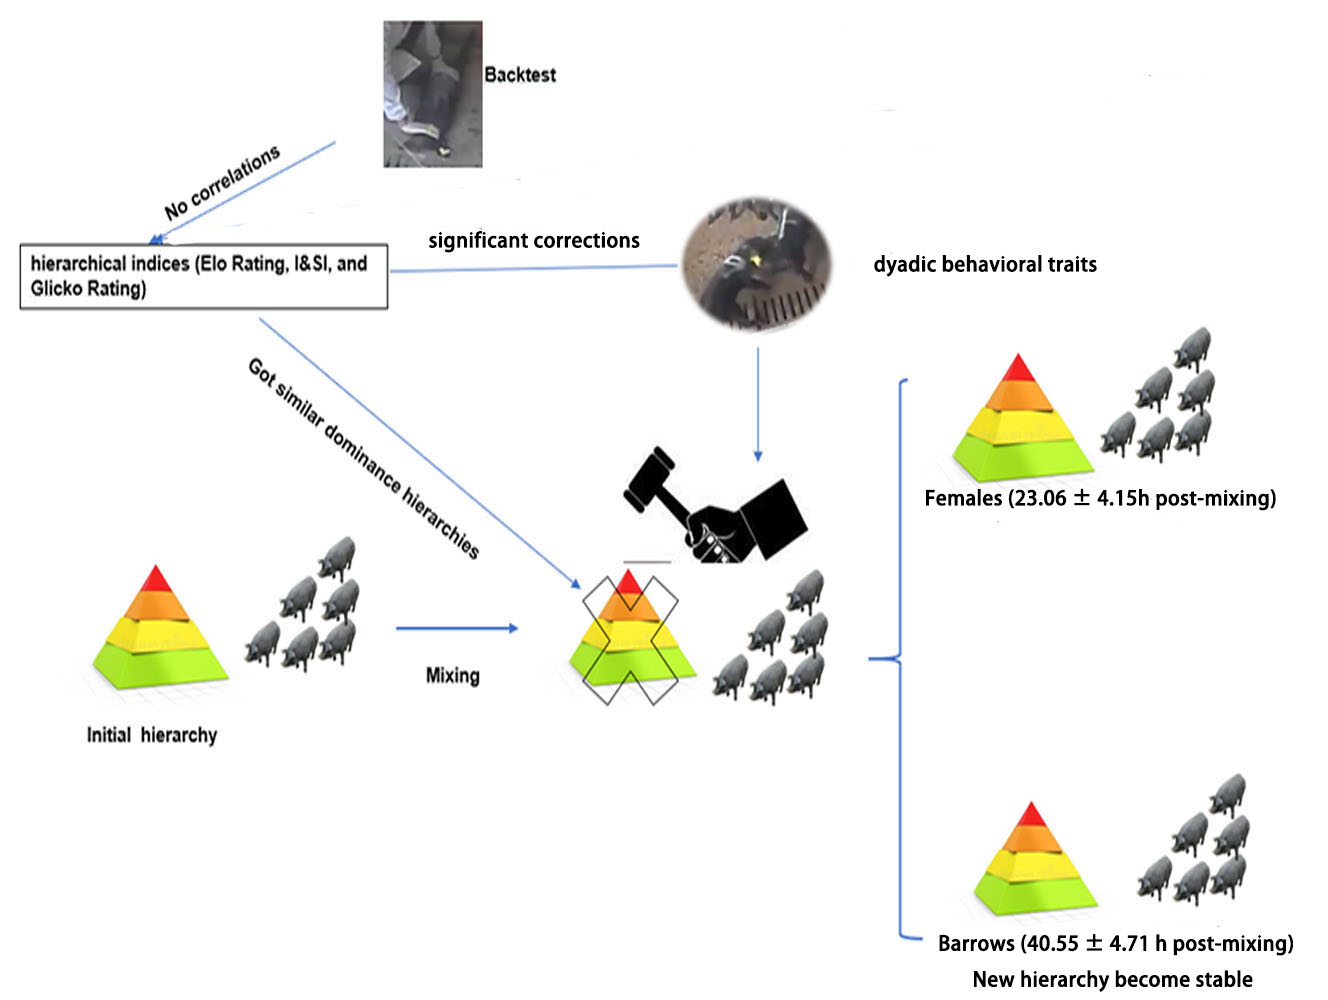
1. Introduction
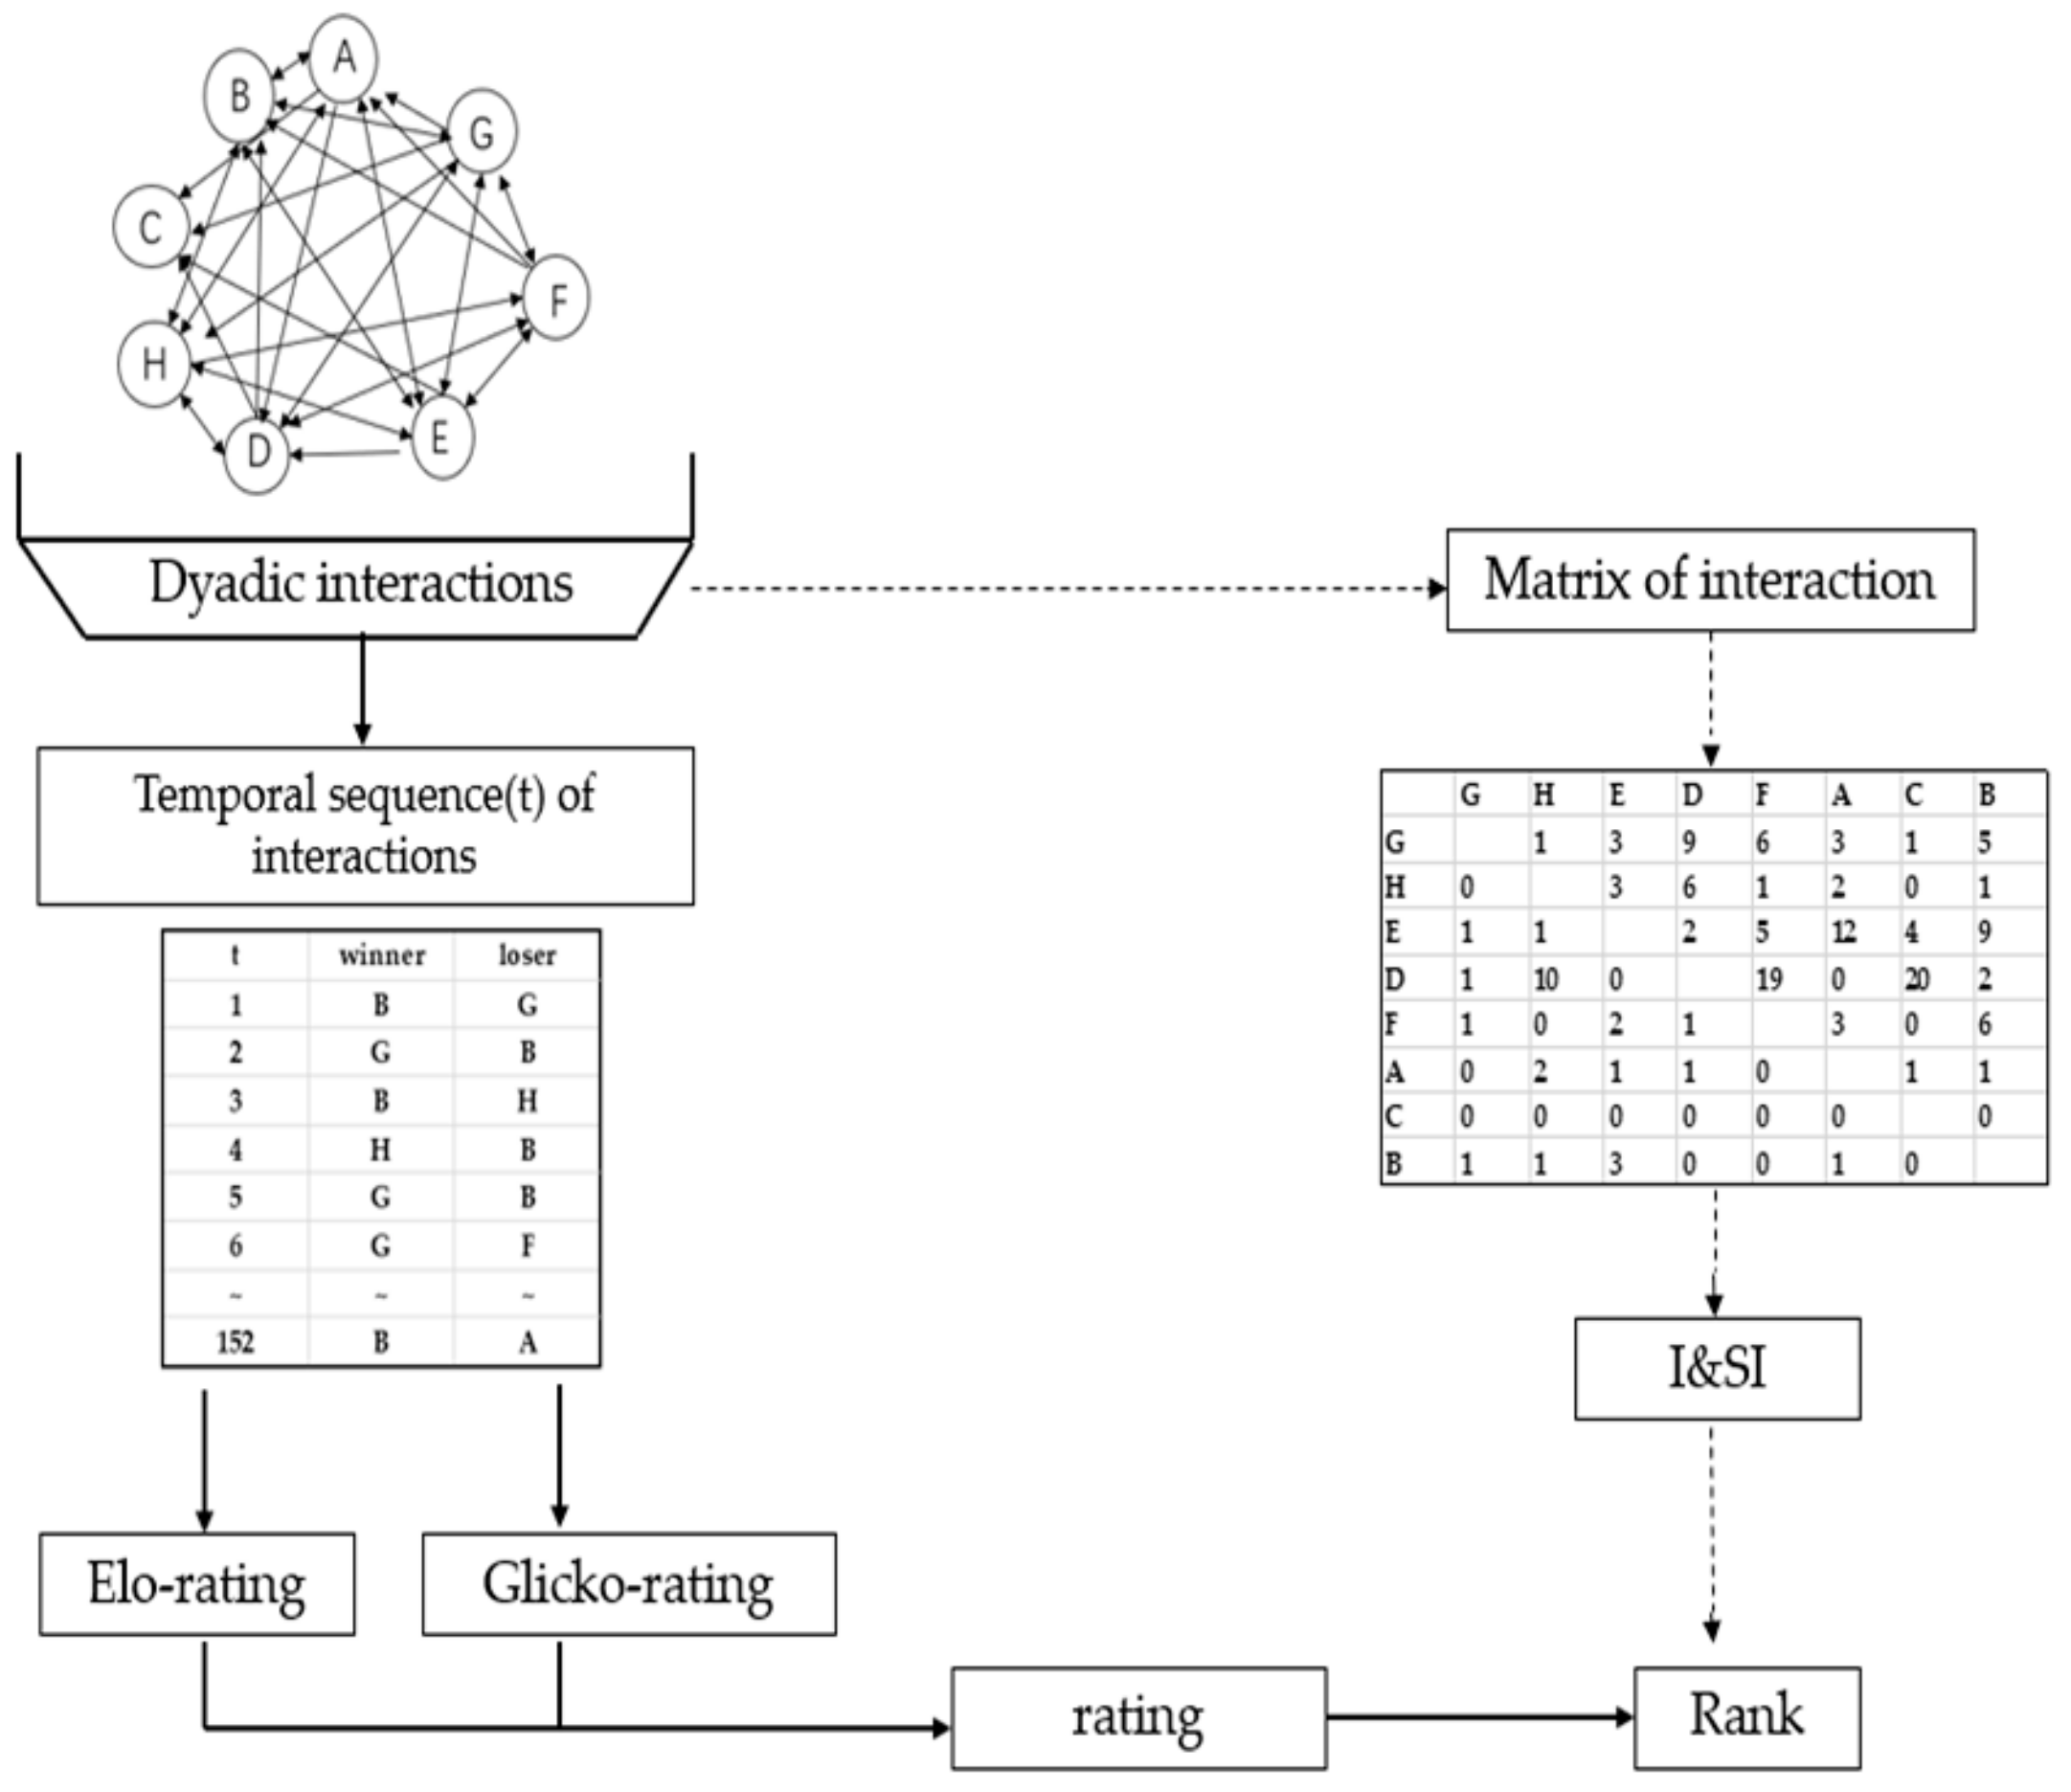
2. Materials and Methods
2.1. Animals and Housing
2.2. Backtest
2.3. Behavioral Observations
2.4. Statistical Analysis
3. Results
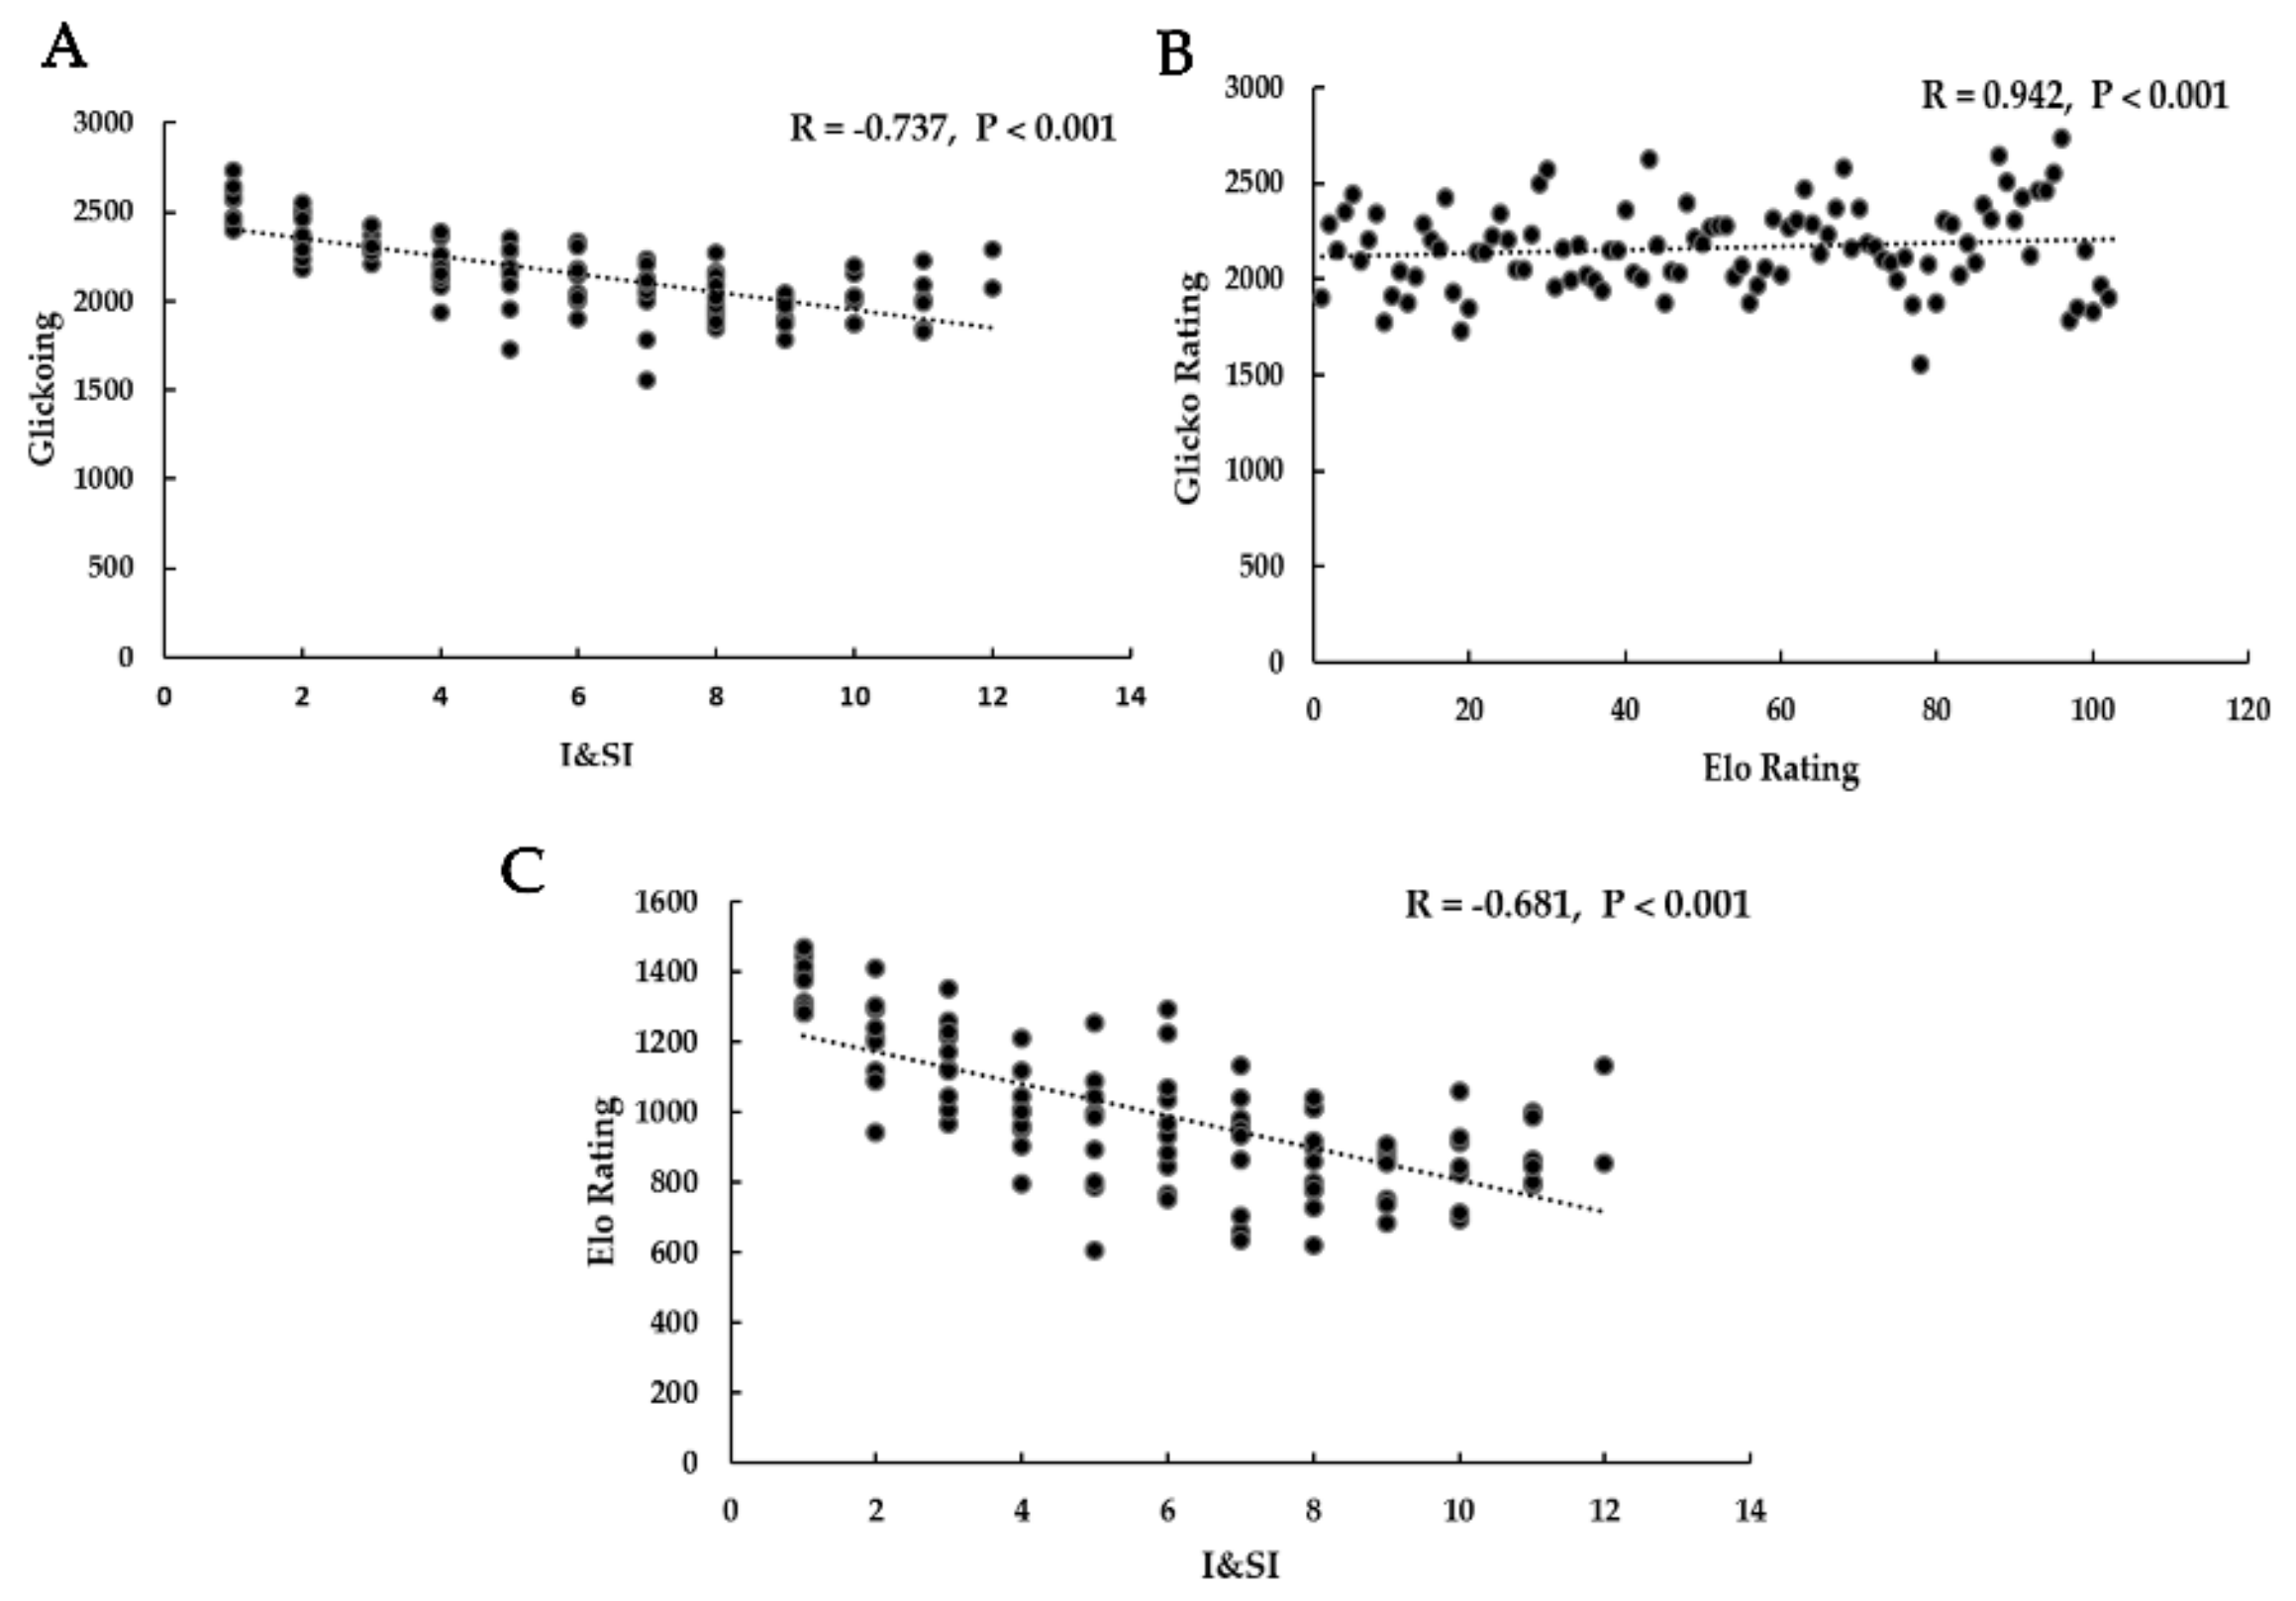
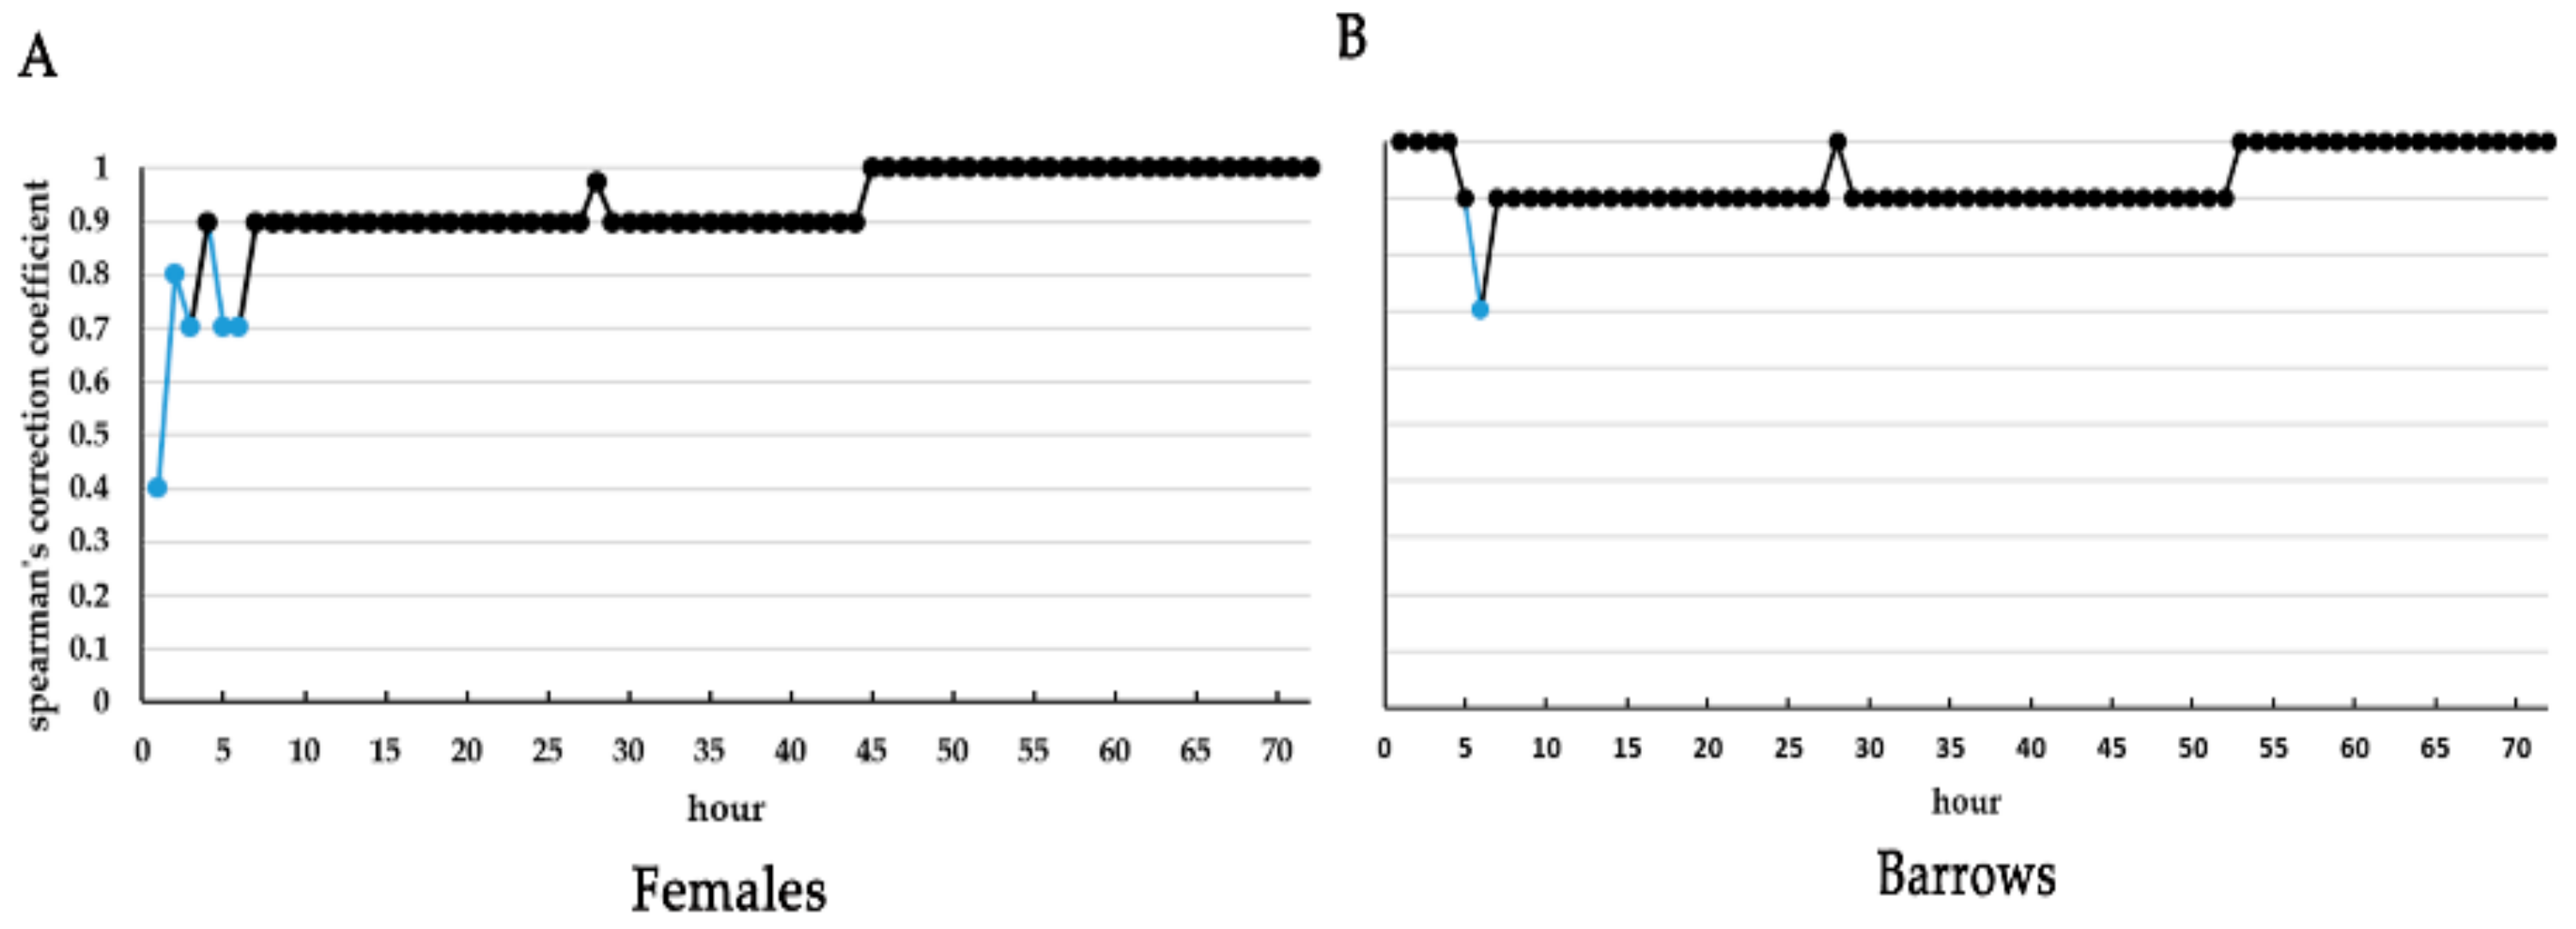
3.1. Similarity between I&SI, Elo Rating Indices, and Glicko Ratings
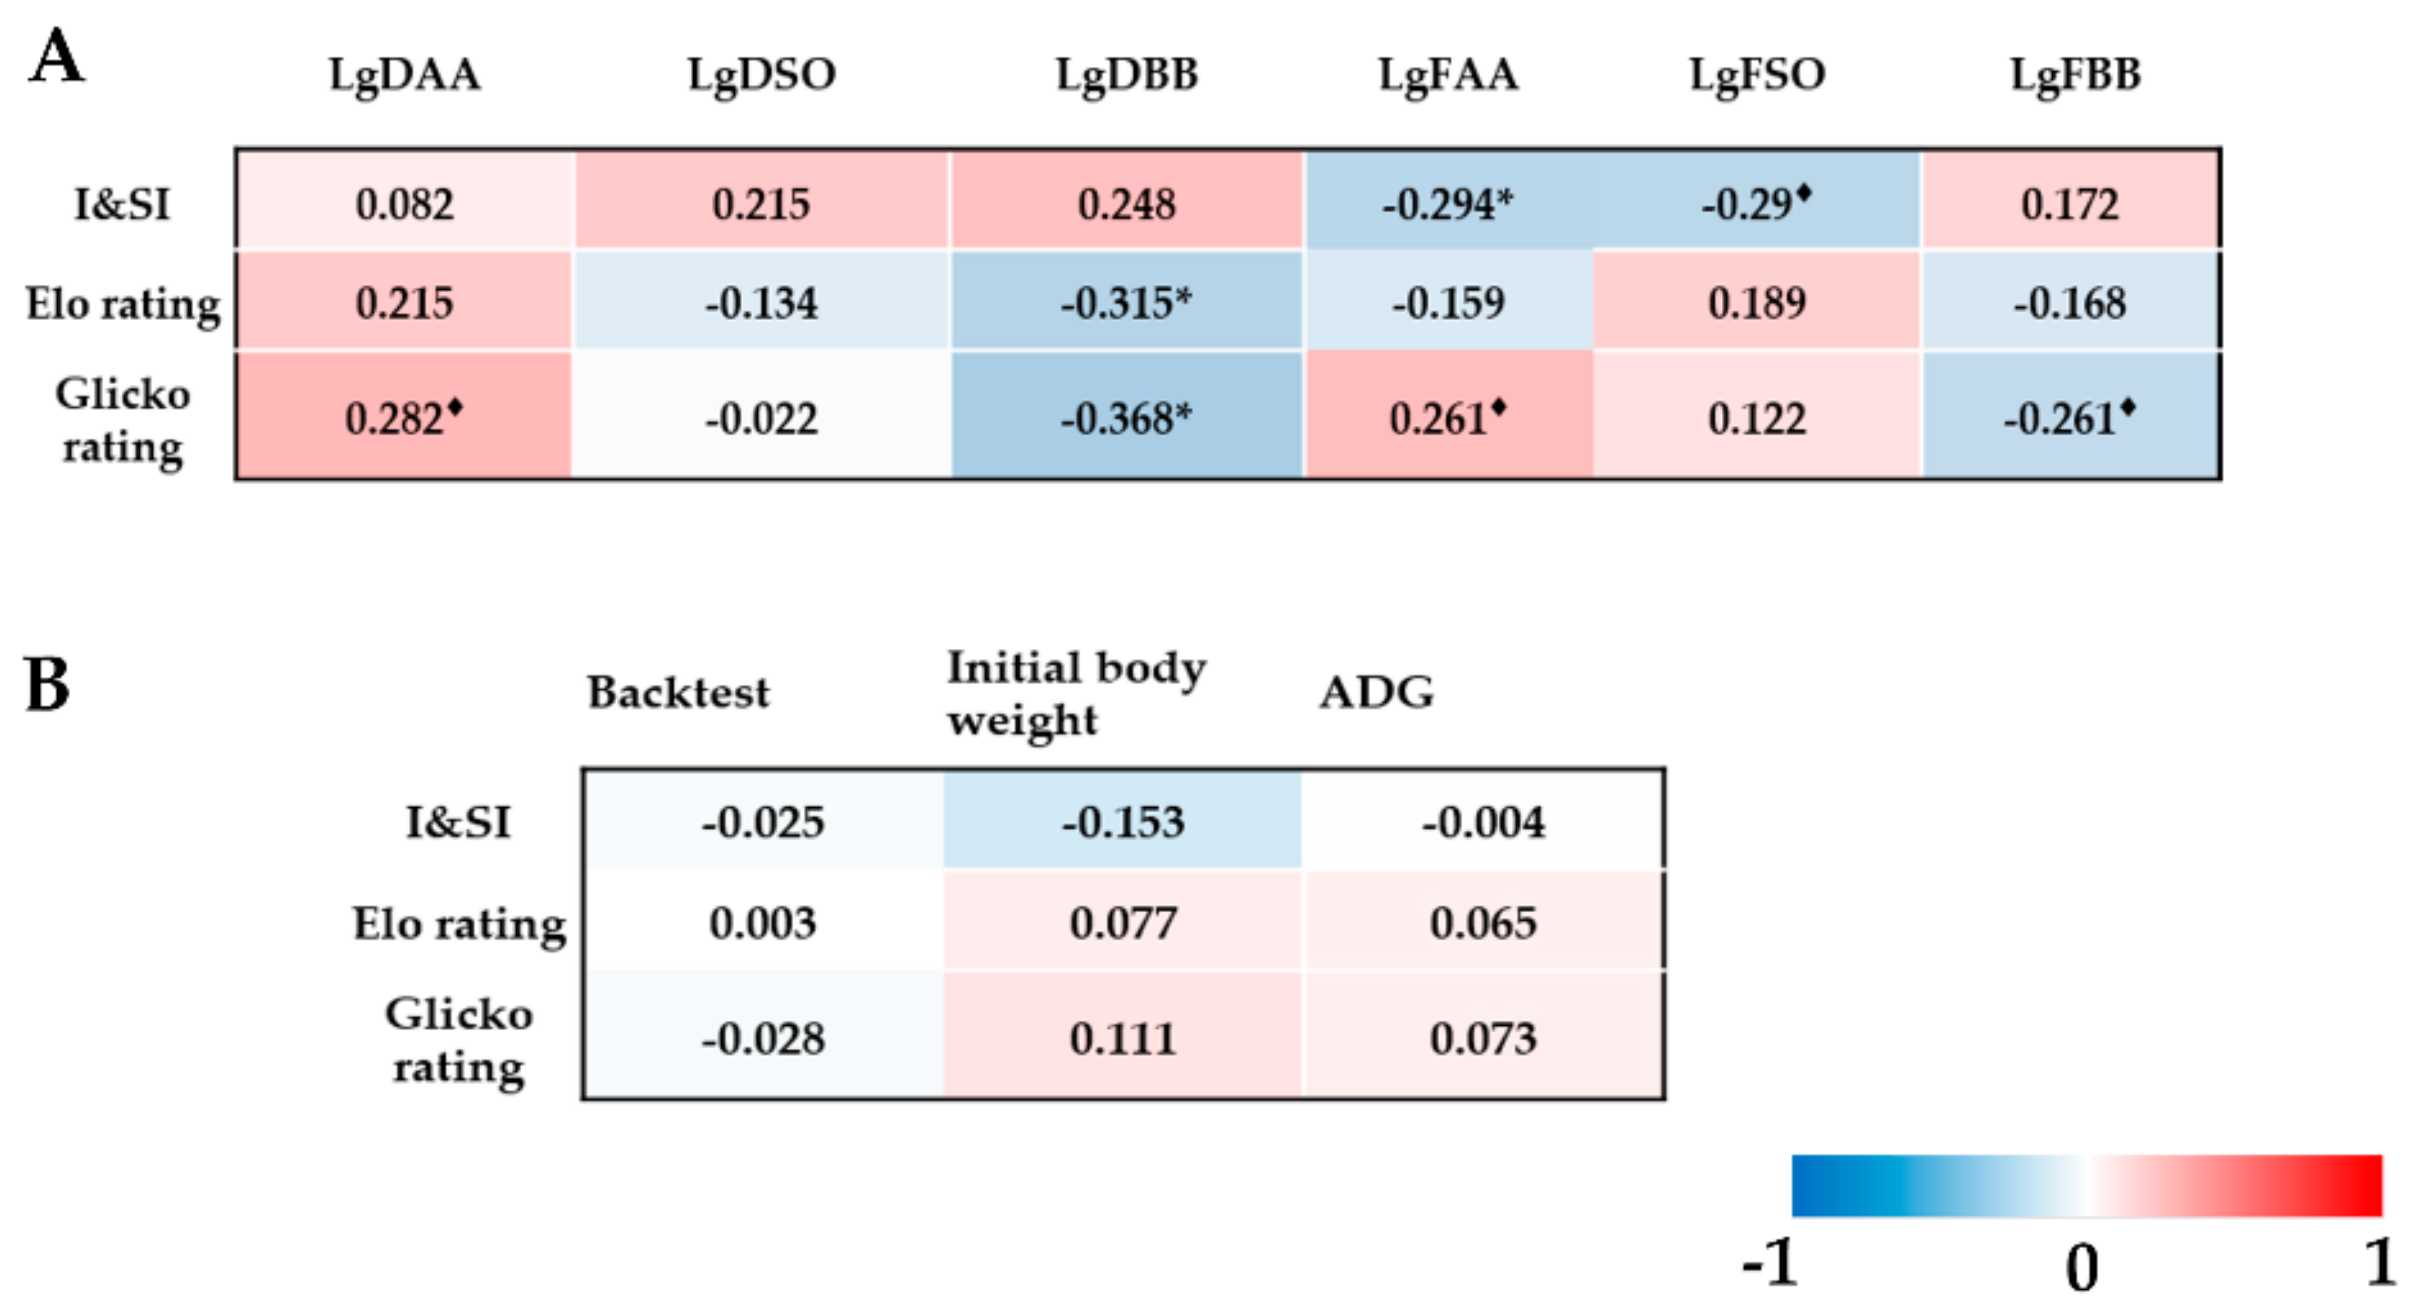
3.2. Partial Correlation Analyses of Hierarchical Indices with Dyadic Behavioral Indicators, Backtest Score, Body Weight, and Average Daily Gain (ADG)
3.3. Multiple Linear Regression Analyses of Logarithms of Dyadic Behavior Indicators for Hierarchical Indices
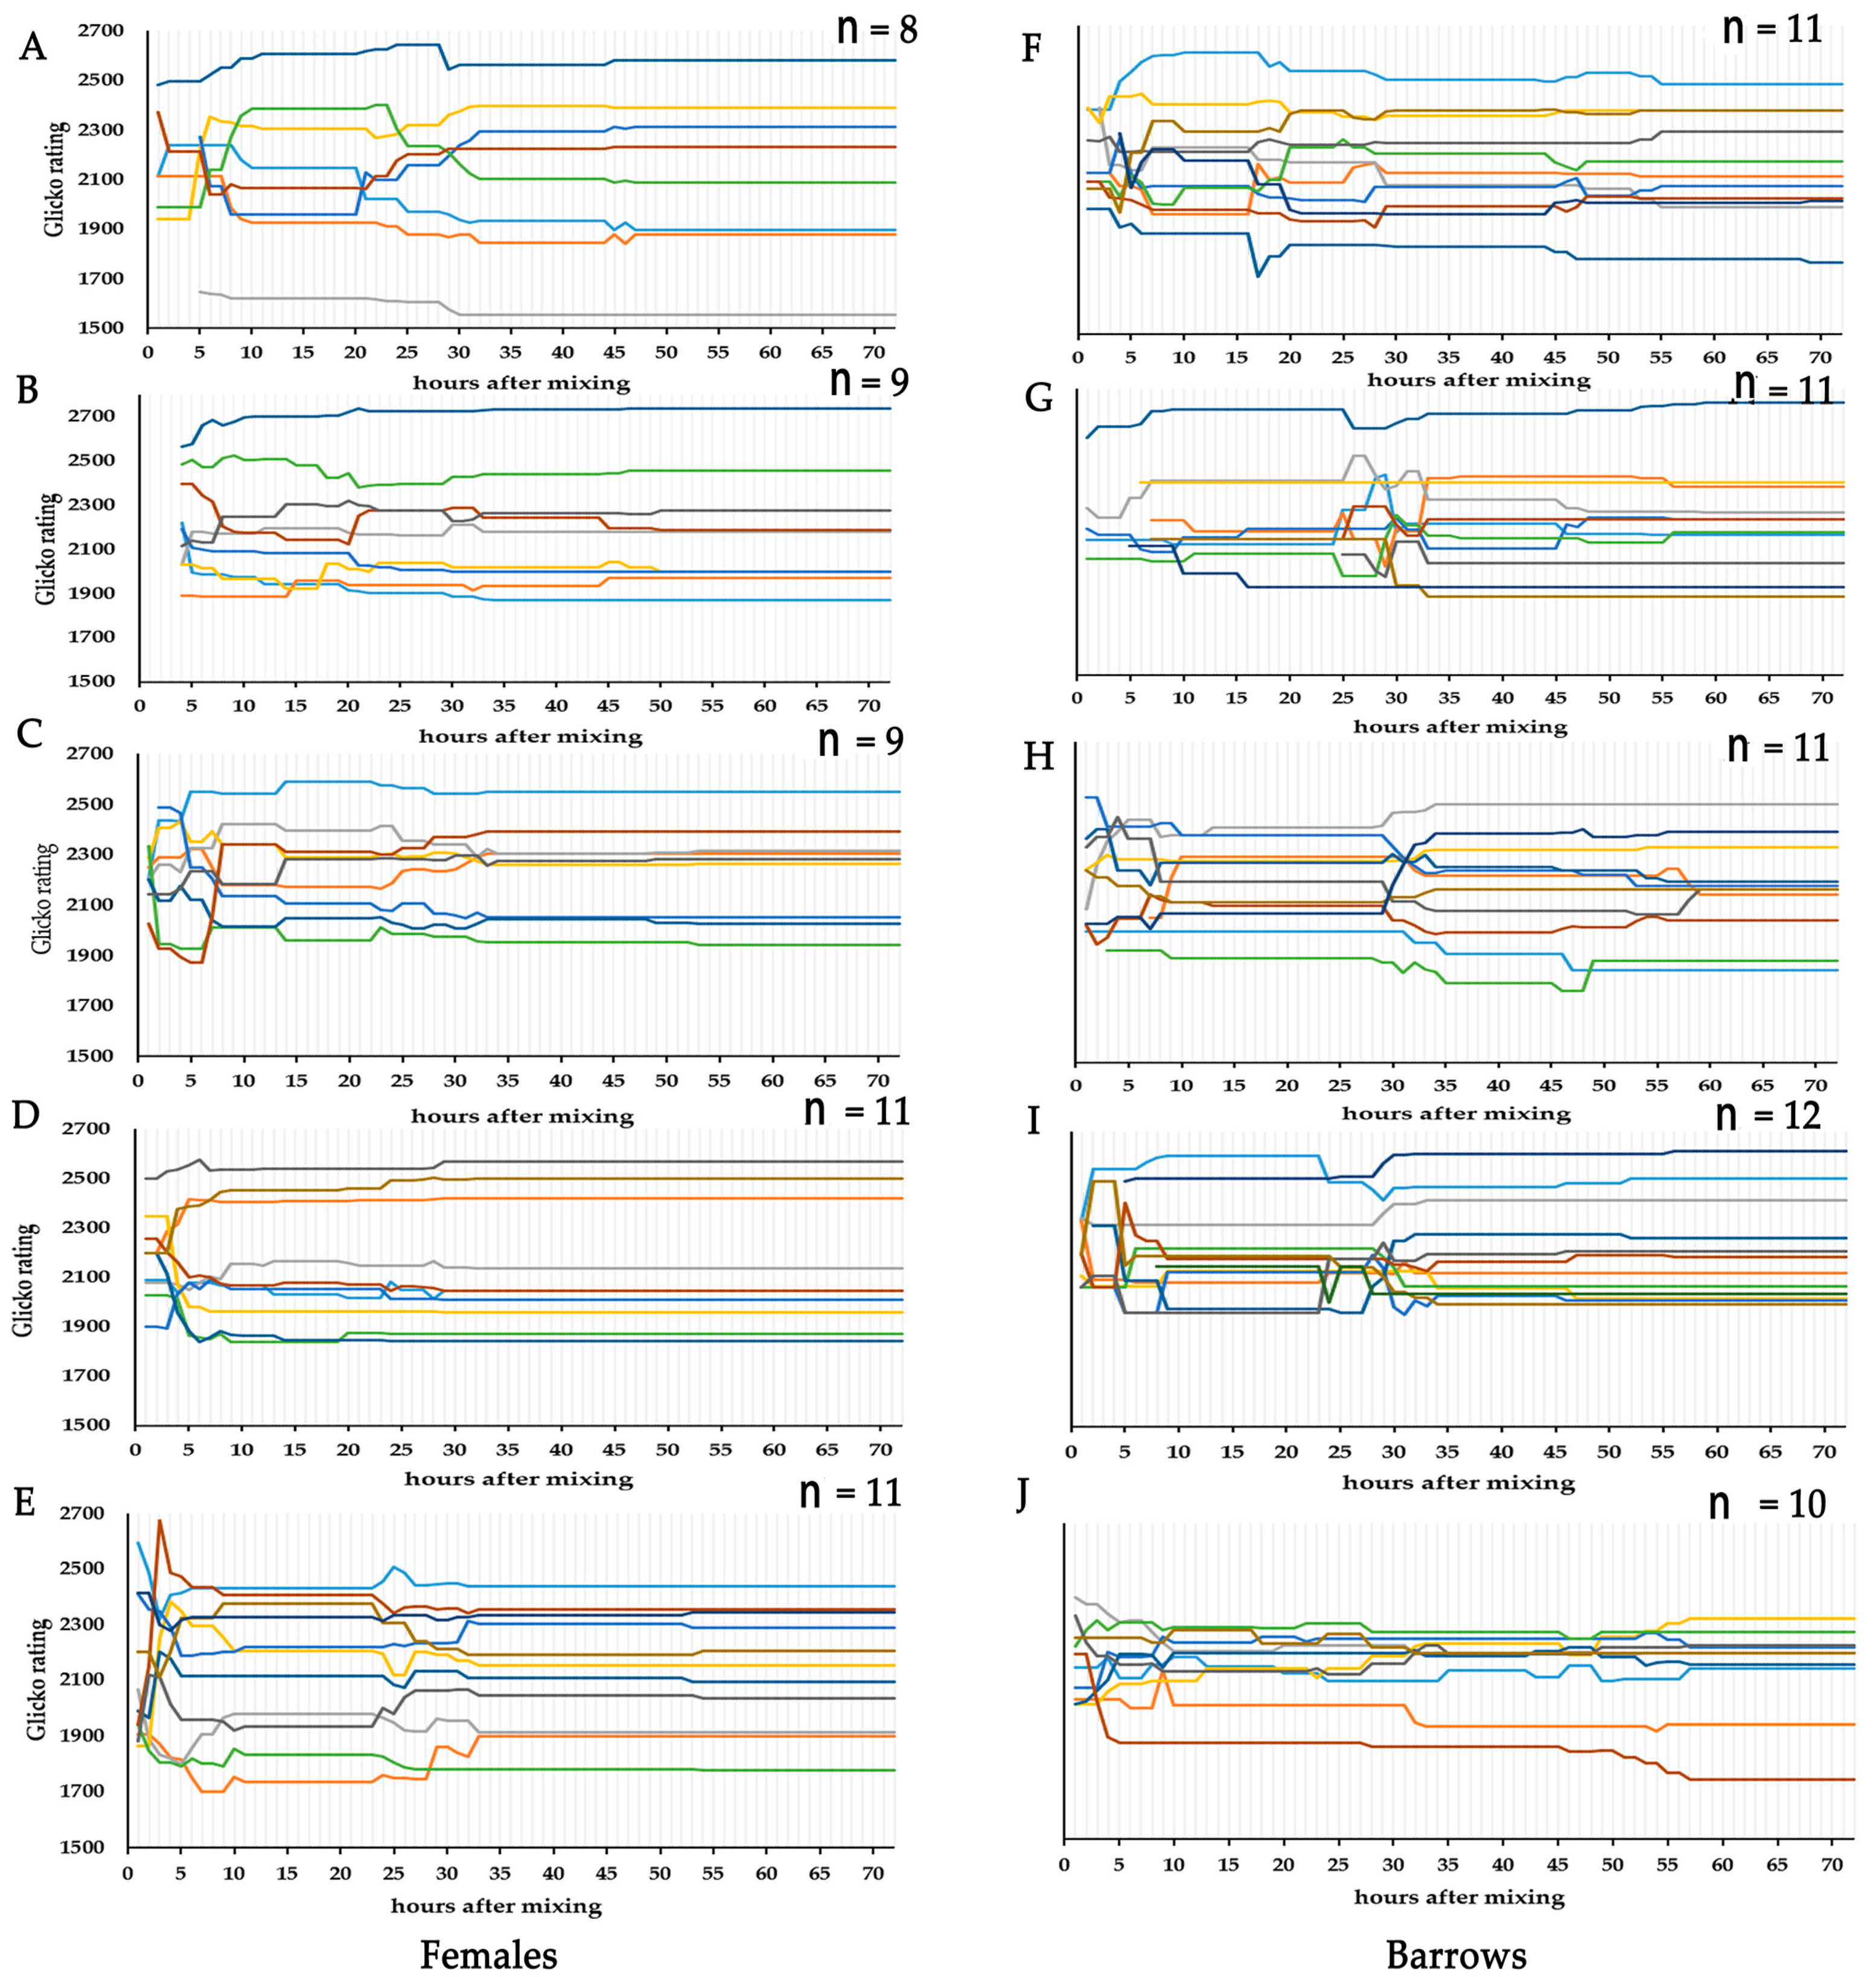
3.4. Temporal Dynamics of Individual Glicko Ratings
4. Discussion
4.1. Similarity between I&SI, Elo Rating, and Glicko Rating Indices
4.2. Correlation Analyses of Dominance Hierarchical Indices with Behavioral Indicators, Backtest Score, and Body Weight
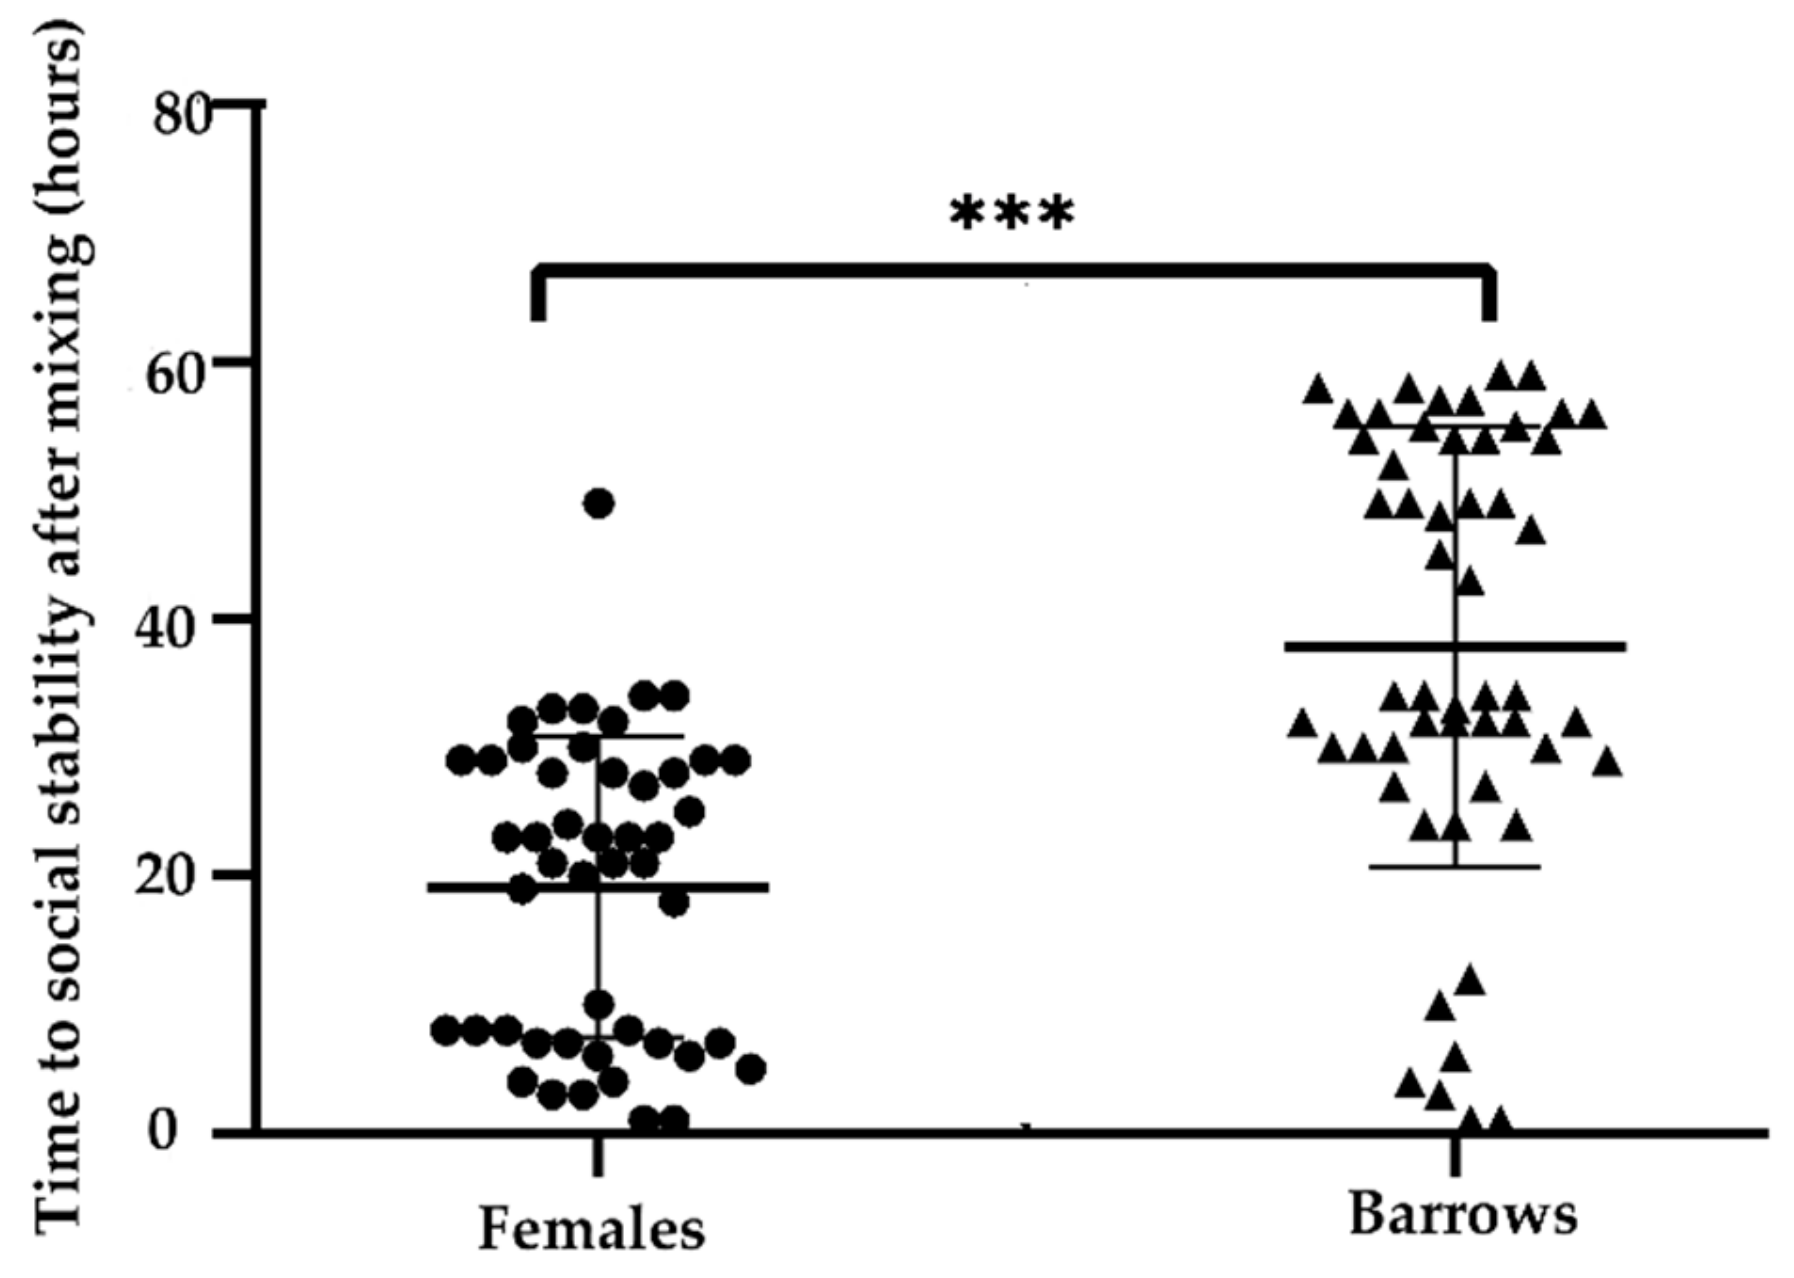
4.3. Temporal Dynamics of Individual Glicko Ratings
5. Conclusions
Supplementary Materials
Author Contributions
Funding
Acknowledgments
Conflicts of Interest
References
- Williamson, C.M.; Lee, W.; Curley, J.P. Temporal dynamics of social hierarchy formation and maintenance in male mice. Anim. Behav. 2016, 115, 259–272. [Google Scholar] [CrossRef]
- Sapolsky, R.M. The influence of social hierarchy on primate health. Science 2005, 308, 648–652. [Google Scholar] [CrossRef] [PubMed]
- Meese, G.B.; Ewbank, R. A note on instability of the dominance hierarchy and variations in level of aggression within groups of fattening pigs. Anim. Sci. 2010, 14, 359–362. [Google Scholar] [CrossRef]
- Svajgr, A.J.; Hays, V.W.; Cromwell, G.L.; Dutt, R.H. Effect of lactation duration on reproductive performance of sows. J. Anim. Sci. 1974, 38, 100–105. [Google Scholar] [CrossRef]
- Coutellier, L.; Arnould, C.; Boissy, A.; Orgeur, P.; Prunier, A.; Veissier, I.; Meunier-Salaun, M.C. Pig’s responses to repeated social regrouping and relocation during the growing-finishing period. Appl. Anim. Behav. Sci. 2007, 105, 102–114. [Google Scholar] [CrossRef]
- Meese, G.B.; Ewbank, R. The establishment and nature of the dominance hierarchy in the domesticated pig. Anim. Behav. 1973, 21, 326–334. [Google Scholar] [CrossRef]
- Jensen, P. Fighting between unacquainted pigs—Effects of age and of individual reaction pattern. Appl. Anim. Behav. Sci. 1994, 41, 37–52. [Google Scholar] [CrossRef]
- Fels, M.; Hartung, J.; Hoy, S. Social hierarchy formation in piglets mixed in different group compositions after weaning. Appl. Anim. Behav. Sci. 2014, 152, 17–22. [Google Scholar] [CrossRef]
- Petersen, H.V.; Vestergaard, K.; Jensen, P. Integration of Piglets into Social-Groups of Free-Ranging Domestic Pigs. Appl. Anim. Behav. Sci. 1989, 23, 223–236. [Google Scholar] [CrossRef]
- Graves, H.B.; Graves, K.L.; Sherritt, G.W. Social behavior and growth of pigs following mixing during the growing—Finishing period. Appl. Anim. Ethol. 1978, 4, 169–180. [Google Scholar] [CrossRef]
- Tan, S.S.L.; Shackleton, D.M.; Beames, R.M. The Effect of Mixing Unfamiliar Individuals on the Growth and Production of Finishing Pigs. Anim. Prod. 1991, 52, 201–206. [Google Scholar] [CrossRef]
- Lahrmann, H.P.; Oxholm, L.C.; Steinmetz, H.; Nielsen, M.B.; D’Eath, R.B. The effect of long or chopped straw on pig behaviour. Animal 2015, 9, 862–870. [Google Scholar] [CrossRef] [PubMed]
- Rhim, S.J.; Son, S.H.; Hwang, H.S.; Lee, J.K.; Hong, J.K. Effects of Mixing on the Aggressive Behavior of Commercially Housed Pigs. Asian-Australas J. Anim. Sci. 2015, 28, 1038–1043. [Google Scholar] [CrossRef] [PubMed]
- Drews, C. The Concept and Definition of Dominance in Animal Behavior. Behaviour 1993, 125, 283–313. [Google Scholar] [CrossRef]
- Schmid, V.S.; de Vries, H. Finding a dominance order most consistent with a linear hierarchy: An improved algorithm for the I&SI method. Anim. Behav. 2013, 86, 1097–1105. [Google Scholar]
- Neumann, C.; Duboscq, J.; Dubuc, C.; Ginting, A.; Irwan, A.M.; Agil, M.; Widdig, A.; Engelhardt, A. Assessing dominance hierarchies: Validation and advantages of progressive evaluation with Elo-rating. Anim. Behav. 2011, 82, 911–921. [Google Scholar] [CrossRef]
- Williamson, C.M.; Lee, W.; Romeo, R.D.; Curley, J.P. Social context-dependent relationships between mouse dominance rank and plasma hormone levels. Physiol. Behav. 2017, 171, 110–119. [Google Scholar] [CrossRef]
- Kulik, L.; Amici, F.; Langos, D.; Widdig, A. Sex Differences in the Development of Social Relationships in Rhesus Macaques (Macaca mulatta). Int. J. Primatol. 2015, 36, 353–376. [Google Scholar] [CrossRef]
- Balasubramaniam, K.N.; Berman, C.M.; De Marco, A.; Dittmar, K.; Majolo, B.; Ogawa, H.; Thierry, B.; De Vries, H. Consistency of dominance rank order: A comparison of David’s Scores with I&SI and Bayesian methods in macaques. Am. J. Primatol. 2013, 75, 959–971. [Google Scholar]
- Jennings, D.J.; Carlin, C.M.; Hayden, T.J.; Gammell, M.P. Third-party intervention behaviour during fallow deer fights: The role of dominance, age, fighting and body size. Anim. Behav. 2011, 81, 1217–1222. [Google Scholar] [CrossRef]
- Cafazzo, S.; Lazzaroni, M.; Marshall-Pescini, S. Dominance relationships in a family pack of captive arctic wolves (Canis lupus arctos): The influence of competition for food, age and sex. PeerJ 2016, 4, e2707. [Google Scholar] [CrossRef] [PubMed]
- So, N.; Franks, B.; Lim, S.; Curley, J.P. A Social Network Approach Reveals Associations between Mouse Social Dominance and Brain Gene Expression. PLoS ONE 2015, 10, e0134509. [Google Scholar] [CrossRef] [PubMed]
- van den Berg, W.E.; Lamballais, S.; Kushner, S.A. Sex-specific mechanism of social hierarchy in mice. Neuropsychopharmacology 2015, 40, 1364–1372. [Google Scholar] [CrossRef] [PubMed]
- Boyle, L.A.; Bjorklund, L. Effects of fattening boars in mixed or single sex groups and split marketing on pig welfare. Anim. Welf. 2007, 16, 259–262. [Google Scholar]
- Colson, V.; Orgeur, P.; Courboulay, V.; Dantec, S.; Foury, A.; Mormede, P. Grouping piglets by sex at weaning reduces aggressive behaviour. Appl. Anim. Behav. Sci. 2006, 97, 152–171. [Google Scholar] [CrossRef]
- Melotti, L.; Oostindjer, M.; Bolhuis, J.E.; Held, S.; Mendl, M. Coping personality type and environmental enrichment affect aggression at weaning in pigs. Appl. Anim. Behav. Sci. 2011, 133, 144–153. [Google Scholar] [CrossRef]
- Hessing, M.J.; Hagelsø, A.M.; Van Beek, J.; Wiepkema, R.; Schouten, W.; Krukow, R. Individual behavioural characteristics in pigs. Appl. Anim. Behav. Sci. 1993, 37, 285–295. [Google Scholar] [CrossRef]
- Bolhuis, E.J.; Schouten, W.G.P.; Schrama, J.W.; Wiegant, V.M. Individual coping characteristics, aggressiveness and fighting strategies in pigs. Anim. Behav. 2005, 69, 1085–1091. [Google Scholar] [CrossRef]
- Geverink, N.A.; Schouten, W.G.P.; Gort, G.; Wiegant, V.M. Individual differences in aggression and physiology in peri-pubertal breeding gilts. Appl. Anim. Behav. Sci. 2002, 77, 43–52. [Google Scholar] [CrossRef]
- Spake, J.R.; Gray, K.A.; Cassady, J.P. Relationship between backtest and coping styles in pigs. Appl. Anim. Behav. Sci. 2012, 140, 146–153. [Google Scholar] [CrossRef]
- Stukenborg, A.; Traulsen, I.; Puppe, B.; Presuhn, U.; Krieter, J. Agonistic behaviour after mixing in pigs under commercial farm conditions. Appl. Anim. Behav. Sci. 2011, 129, 28–35. [Google Scholar] [CrossRef]
- Camerlink, I.; Arnott, G.; Farish, M.; Turner, S.P. Complex contests and the influence of aggressiveness in pigs. Anim. Behav. 2016, 121, 71–78. [Google Scholar] [CrossRef]
- O’Malley, C.I.; Wurtz, K.E.; Steibel, J.P.; Bates, R.O.; Ernst, C.W.; Siegford, J.M. Relationships among aggressiveness, fearfulness and finisher pigs response to humans in finisher pigs. Appl. Anim. Behav. Sci. 2018, 205, 194–201. [Google Scholar] [CrossRef]
- Langbein, J.; Puppe, B. Analysing dominance relationships by sociometric methods—a plea for a more standardised and precise approach in farm animals. Appl. Anim. Behav. Sci. 2004, 87, 293–315. [Google Scholar] [CrossRef]
- Compete: Analyzing competitive interaction data. Available online: https://github.com/jalapic/compete (accessed on 20 December 2018).
- Appleby, M.C. The probability of linearity in hierarchies. Anim. Behav. 1983, 31, 600–608. [Google Scholar] [CrossRef]
- Animal Dominance Hierarchies by Elo Rating. Available online: https://rdrr.io/github/gobbios/EloRating/ (accessed on 20 December 2018).
- Albers, P.C.H.; De Vries, H. Elo-rating as a tool in the sequential estimation of dominance strengths. Anim. Behav. 2001, 61, 489–495. [Google Scholar] [CrossRef]
- PlayerRatings: Dynamic Updating Methods for Player Ratings Estimation. Available online: http://CRAN.R-project.org/package=PlayerRati (accessed on 20 December 2018).
- Glickman, M.E. Parameter estimation in large dynamic paired comparison experiments. J. R. Stat. Soc. Ser. C-Appl. Stat. 1999, 48, 377–394. [Google Scholar] [CrossRef]
- R: A Language and Environment for Statistical Computing. Available online: http://softlibre.unizar.es/manuales/aplicaciones/r/fullrefman.pdf (accessed on 20 December 2018).
- Sánchez-Tójar, A.; Schroeder, J.; Farine, D.R. A practical guide for inferring reliable dominance hierarchies and estimating their uncertainty. J. Anim. Ecol. 2018, 87, 594–608. [Google Scholar] [CrossRef]
- Jensen, P.; Yngvesson, J. Aggression between unacquainted pigs—sequential assessment and effects of familiarity and weight. Appl. Anim. Behav. Sci. 1998, 58, 49–61. [Google Scholar] [CrossRef]
- Weller, J.E.; Camerlink, I.; Turner, S.P.; Farish, M.; Arnott, G. Socialisation and its effect on play behaviour and aggression in the domestic pig (Sus scrofa). Sci. Rep. 2019, 9, 4180. [Google Scholar] [CrossRef]
- Erhard, H.W.; Mendl, M.; Ashley, D.D. Individual aggressiveness of pigs can be measured and used to reduce aggression after mixing. Appl. Anim. Behav. Sci. 1997, 54, 137–151. [Google Scholar] [CrossRef]
- Chu, Q.; Liang, T.; Fu, L.; Li, H.; Zhou, B. Behavioural genetic differences between Chinese and European pigs. J. Genet. 2017, 96, 707–715. [Google Scholar] [CrossRef] [PubMed]
- Spoolder, H.A.M.; Edwards, S.A.; Corning, S. Effects of group size and feeder space allowance on welfare in finishing pigs. Anim. Sci. 1999, 69, 481–489. [Google Scholar] [CrossRef]


| Trait | Description |
|---|---|
| Active attack | In a fight, a pig demonstrates biting, pushing, chasing [32]. |
| Being bullied | When the recipient pig suffers from biting and head-knocking performed by the actor pig and the recipient moved away without retaliation, it was identified as a being bullied [33]. |
| Standoff | Two pigs stand side by side, shoulder by shoulder, and one pig throws its head to the head or neck of the other pig. Not including active attack and being bullied. |
| Win/lose/draw | A pig showed a submissive manner, such as stopping fighting, turning away from an attack, trying to flee or was displaced from the location, was defined as a loser, the other pig in the fight was defined as a winner [34]. If there was no clear outcome, the fight was designated as a draw [31]. |
| Covariates | Unstandardized Coefficients B | Unstandardized Coefficients Standard Error | Test Statistic (t Value) | Significance Level (p-Value) |
|---|---|---|---|---|
| Dependent Variable: ISI | ||||
| LgDAA | 0.682 | 1.269 | 0.537 | 0.594 |
| LgDSO | 1.611 | 1.113 | 1.447 | 0.155 |
| LgDBB | 2.324 | 1.387 | 1.676 | 0.101 |
| LgFAA | −4.644 | 2.302 | −2.017 | 0.050 ♦ |
| LgFSO | −3.634 | 1.828 | −1.989 | 0.053 ♦ |
| LgFBB | 2.623 | 2.297 | 1.142 | 0.260 |
| Dependent Variable: Elo rating | ||||
| LgDAA | 109.617 | 75.800 | 1.446 | 0.155 |
| LgDSO | −58.860 | 66.475 | −0.885 | 0.381 |
| LgDBB | −180.248 | 82.824 | −2.176 | 0.035 * |
| LgFAA | 145.088 | 137.488 | 1.055 | 0.297 |
| LgFSO | 137.923 | 109.138 | 1.264 | 0.213 |
| LgFBB | −152.971 | 137.182 | −1.115 | 0.271 |
| Dependent Variable: Glicko rating | ||||
| LgDAA | 130.327 | 67.489 | 1.931 | 0.060 ♦ |
| LgDSO | −8.696 | 59.186 | −0.147 | 0.884 |
| LgDBB | −191.441 | 73.742 | −2.596 | 0.013 * |
| LgFAA | 217.211 | 122.413 | 1.774 | 0.083 ♦ |
| LgFSO | 78.576 | 97.171 | 0.809 | 0.423 |
| LgFBB | −216.628 | 122.140 | −1.774 | 0.083 ♦ |
© 2019 by the authors. Licensee MDPI, Basel, Switzerland. This article is an open access article distributed under the terms and conditions of the Creative Commons Attribution (CC BY) license (http://creativecommons.org/licenses/by/4.0/).
Share and Cite
Tong, X.; Shen, C.; Chen, R.; Gao, S.; Liu, X.; Schinckel, A.P.; Zhou, B. Reestablishment of Social Hierarchies in Weaned Pigs after Mixing. Animals 2020, 10, 36. https://doi.org/10.3390/ani10010036
Tong X, Shen C, Chen R, Gao S, Liu X, Schinckel AP, Zhou B. Reestablishment of Social Hierarchies in Weaned Pigs after Mixing. Animals. 2020; 10(1):36. https://doi.org/10.3390/ani10010036
Chicago/Turabian StyleTong, Xian, Chunyan Shen, Ruonan Chen, Siyuan Gao, Xinpeng Liu, Allan P. Schinckel, and Bo Zhou. 2020. "Reestablishment of Social Hierarchies in Weaned Pigs after Mixing" Animals 10, no. 1: 36. https://doi.org/10.3390/ani10010036
APA StyleTong, X., Shen, C., Chen, R., Gao, S., Liu, X., Schinckel, A. P., & Zhou, B. (2020). Reestablishment of Social Hierarchies in Weaned Pigs after Mixing. Animals, 10(1), 36. https://doi.org/10.3390/ani10010036