Article

Schizosaccharomyces pombe Can Reduce Acetic Acid Produced by Baijiu Spontaneous Fermentation Microbiota

1
State Key Laboratory of Food Science and Technology, Key Laboratory of Industrial Biotechnology of Ministry of Education, Synergetic Innovation Center of Food Safety and Nutrition, School of Biotechnology, Jiangnan University, Wuxi 214122, China
2
State Key Laboratory of Microbial Metabolism, Joint International Research Laboratory of Metabolic & Developmental Sciences, Department of Microbiology, School of Life Sciences and Biotechnology, Shanghai Jiao Tong University, Shanghai 200240, China
*
Authors to whom correspondence should be addressed.
These authors contributed equally to this work.
Microorganisms 2019, 7(12), 606; https://doi.org/10.3390/microorganisms7120606
Submission received: 18 October 2019 / Revised: 20 November 2019 / Accepted: 21 November 2019 / Published: 22 November 2019
(This article belongs to the Special Issue Feature Papers in Food Microbiology)

Abstract

:
The spontaneous fermentation of alcoholic beverage is a bioprocess donated by microbiota with complex stress environments. Among various microbes, non-Saccharomyces yeasts have high stress tolerance and significantly affect the taste and quality of products in process. Although many researchers have focused on the influence of acid stress, the mechanism of non-Saccharomyces yeasts to tolerant stress remains unclear in microbiota. To bridge the gap, we constructed in situ and in vitro studies to explore the reduction pathway of acetic acid in non-Saccharomyces yeasts. In this study, we found Schizosaccharomyces pombe has special capacities to resist 10 g/L acetic acid in laboratory cultures and decrease the average concentration of acetic acid from 9.62 to 6.55 g/kg fermented grains in Chinese Maotai-flavor liquor (Baijiu) production. Moreover, Schi. pombe promoted metabolic level of mevalonate pathway (high expressions of gene ACCAT1, HMGCS1, and HMGCR1) to degrade a high concentration of acetic acid. Meanwhile, Schi. pombe also improved the concentration of mevalonic acid that is the precursor of terpenes to enhance the taste and quality of Baijiu. Overall, the synchronicity of reduction and generation in Schi. pombe advances the current knowledge to guide more suitable strategies for mechanism studies of non-Saccharomyces yeasts in fermented industries of alcoholic beverages.

1. Introduction

The recent studies of modern biotechnologies have shown that non-Saccharomyces yeasts have significant effects which improve product quality in various alcoholic beverage industries [1,2,3]. With the developing of this field in the production, researchers have isolated and identified a serious of non-Saccharomyces yeasts including Pichia kudriavzevii [4], Candida humilis [5], Saccharomycopsis fibuligera [6], Wickerhamomyces anomalus [7], Zygosaccharomyces bailii [8], Schizosaccharomyces pombe [9], and Torulaspora delbrueckii [10] in microbiota. Moreover, the major functions of these non-Saccharomyces yeast have been discovered, such as acid regulation [2], higher alcohol reduction [11], and ester generation [12]. They can also decrease the concentrations of unsafe compounds that affect product quality, such as ethyl carbamate [13] in fermentation production.
In alcoholic beverage industries, ethanol generation is limited because some inhibitory compounds are generated during the fermentation process [14]. As a major inhibitory compound, acetic acid causes intracellular acidification and inhabits cell metabolism that acts to stress microbiota, ultimately leading to reduced product formation [15]. Previous studies have shown that non-Saccharomyces yeasts have a special capacity to deacidify products during fermentation process of alcoholic beverage industries [16,17]. For instance, non-Saccharomyces yeasts have the remarkable metabolic property to decrease concentration of acetic acid [18]. As a traditional spontaneous fermentation, there were Saccharomyces and multiple non-Saccharomyces yeasts to generate high quality and taste products in the Chinese Maotai-flavor Baijiu fermentation process [19]. The Baijiu production is often accompanied with a high concentration of acetic acid [9,20]. However, the tolerance mechanism of microbiota to acetic acid accumulation is not clear. Moreover, the pathway of acetic acid reduction involving key deacidifying non-Saccharomyces yeasts in microbiota is still unknown.
The aims of our study, to better understand the above problems, included (i) explore the influence of acetic acid accumulation to core functional yeasts involving Saccharomyces and multiple non-Saccharomyces yeasts in situ and in vitro; (ii) reveal the gene expressions related to acetic acid metabolism in Saccharomyces and non-Saccharomyces yeasts via metatranscriptomic sequencing; and (iii) illustrate the reduction pathway of acetic acid in non-Saccharomyces yeasts during Chinese Maotai-flavor Baijiu fermentation.

2. Materials and Methods

2.1. Experimental Design and Sample Collection

The complete fermentation process was carried out in a natural environment with cereal materials (Figure S1). Sorghum was the main cereal material used in the Baijiu fermentation process. In addition, raw materials (almost 15 tons) were mixed with sorghum and wheat in a pit (3 m × 2.5 m × 4 m). The samples were collected in Zunyi City (27.42 N, 106.55 E), Guizhou Province, China. We selected a group of samples from a factory for Chinese Maotai-flavor Baijiu production. The fermentation process in pits usually lasted approximately 30 days, and three replicate samples were collected from the upper, middle, and bottom locations at five-day intervals (Figure S1). The samples from the different pit locations at day 5, 15, and 30 (three biological replicates, day 05-1, day 05-2, and day 05-3 for day 5; day 15-1, day 15-2, and day 15-3 for day 15; and day 30-1, day 30-2, and day 30-3 for day 30) were immediately pretreated to extract total RNA. Additional samples from the different pit locations were stored at −20 °C for metabolites analysis.

2.2. RNA Extraction, Metatranscriptomic Sequencing, and Analysis

The samples in situ for total RNA extraction were pretreated with sterile phosphate-buffered saline (PBS, 0.1 mol/L). Then, the samples were centrifuged at 70× g for 5 min to obtain the supernatant. After centrifugation, the supernatant was centrifuged at 12,000× g for 5 min to collect cells. The sediment was cooled and ground in liquid nitrogen and extracted with sodium laurate buffer (sodium laurate 10 g/L, Tris-HCl 0.1 mol/L, NaCl 0.1 mol/L, ethylenediaminetetraacetic acid (EDTA) 0.02 mol/L) with TRIzol (Sigma-Aldrich, St. Louis, MO, USA) to obtain total RNA. In addition, the metatranscriptomics libraries were constructed via the NEBNext® Ultra™ RNA Library Prep Kit for Illumina (New England Biolabs, Ipswich, Ma). The ribosomal RNA was removed by Ribo-Zero™ rRNA Removal Kits (Bacteria) and Ribo-Zero™ Magnetic Gold Kits (Yeast) (Illumina, San Diego, CA, USA). Then, samples were quantified and sequenced on an Illumina Hiseq 2500 platform (Illumina, San Diego, CA, USA).
The raw reads from the metatranscriptomic gene sequencing were processed to obtain clean reads through the removal of ribosomal RNA sequences and low-quality reads (Q < 0.02) via Trimmomatic (version 0.36) [21]. The de novo transcriptomic assemblies were performed using the Trinity platform (version 2.40) [22]. We also input the results into MEGAN (version 5.11) [23] to obtain the species composition and relative abundance of information in the samples using DIAMOND (version 0.83) [24]. Then, we compared high-quality reads to a nonredundant protein database (Nr, NCBI) [25] and Kyoto Encyclopedia of Genes and Genomes (KEGG) [26] database to obtain functional annotation information using the basic local alignment search tool (BLAST, NCBI) software [27]. Details of the quality and assembly information about the metatranscriptomic data are shown in Tables S1 and S2. The metatranscriptomic data were submitted to NCBI SRA under accession number PRJNA377357.

2.3. Culture Fermentation

The core yeast strains in Baijiu and culture fermentation were Pichia kudriavzevii C-16, Saccharomyces cerevisiae C-3, Schizosaccharomyces pombe C-11, and Zygosaccharomyces bailii C-7. In our study, four yeast species were isolated from Baijiu production and were identified via the forward primer ITS 1 (5′-TCCGTAGGTGAACCTGCGG-3′) and the reverse primer ITS 4 (5′-TCCTCCGCTTATTGATATGC-3′). Sorghum extract medium was used for mono- and co-culture fermentation [28]. We selected these yeast species (P. kudriavzevii C-16, S. cerevisiae C-3, Schi. pombe C-11, and Z. bailii C-7) to construct a synthetic consortium. They were pre-cultured in seed medium (sorghum extract medium) at 30 °C and 200 rpm for 48 h. Then, in mono-culture fermentation, 10% of the seed medium from one yeast strain was inoculated into the fermentation medium (sorghum extract medium) with an initial total strain density of about 2 × 10⁶ cells per milliliter. In co-culture fermentation, 10% of the seed medium from each yeast strains (totally 40% from four yeast species) was inoculated into the fermentation medium (sorghum extract medium) to form the synthetic consortium with an initial total strain density of about 8 × 10⁶ cells per milliliter. Mono- and co-culture fermentation were carried out with shake flasks. Uninoculated sorghum extract medium was also cultured as a negative control. The mono- and co-culture fermentations were all performed with 200 rpm at 30 °C for 72 h. All the experiments were performed in triplicate. According to the maximum concentration of acetic acid in the previous study [9], we created four sample groups in vitro with different conditions: in group +AA 10 g/L, co-culture fermentation (involved P. kudriavzevii C-16, S. cerevisiae C-3, Schi. pombe C-11, and Z. bailii C-7) or mono-culture fermentation (only Schi. pombe C-11) under initial concentration of 10 g/L acetic acid; in the none group, co-culture fermentation (involved P. kudriavzevii C-16, S. cerevisiae C-3, Schi. pombe C-11, and Z. bailii C-7) or mono-culture fermentation (only Schi. pombe C-11) without initial concentration of 10 g/L acetic acid.

2.4. Reverse-Transcription and Real-Time Quantitative PCR

Samples were collected from mono- and co-culture fermentations by centrifugation at 12,000× g at 4 °C for 5 min and the total RNA was extracted as follows: the samples were cooled and ground in liquid nitrogen and were transferred to a sterile Eppendorf tube, filled with 1.0 mL of precooled TRIzol reagent (Takara, Dalian, China). The ratios of A260/A280 and A260/A230 was calculated to assess RNA purity using a NanoDrop 8000 spectrophotometer (Thermo Scientific, Wilmington, DE, USA). The quality of the total RNA was analyzed by 1% nondenatured agarose gel electrophoresis. After that, the total RNA was immediately purified with 4 × gDNA wiper (Vazyme, Nanjing, China). Reverse transcription was conducted with 1 μg of total RNA sample in a 20 μL reaction mixture using the HiScript® II QRT SuperMix for qPCR (+gDNA wiper) (Vazyme, Nanjing, China) to synthesize cDNA. All the operations followed the manufacturer’s instructions. Reactions without reverse transcriptase or a template were both used as negative controls.
The microbial populations and gene transcription of different yeasts in mono- and co-culture fermentations were determined by real-time quantitative PCR. This quantitation was performed by a StepOnePlus real-time PCR system (Applied Biosystems, Foster City, CA, USA) with QuantiNova® SYBR Green PCR Kit (Qiagen, Hilden, German). All the operations followed the manufacturer’s instructions. To quantify microbial populations in P. kudriavzevii C-16, S. cerevisiae C-3, Schi. pombe C-11, and Z. bailii C-7, we extracted total DNAs from samples in mono- and co-culture fermentations. All samples were pretreated with sterile phosphate-buffered saline (PBS, 0.1 mol/L). Then, the samples were centrifuged at 70× g for 5 min to obtain the supernatant. After centrifugation, the supernatant was centrifuged at 12,000× g for 5 min to collect microorganisms. After centrifugation, the sediment was cooled and ground in liquid nitrogen and extracted with sodium laurate buffer (sodium laurate 10 g/L, Tris-HCl 0.1 mol/L, NaCl 0.1 mol/L, ethylenediaminetetraacetic acid (EDTA) 0.02 mol/L) with phenol: chloroform: isoamyl alcohol (25:24:1) to obtain total DNA. High-quality total DNA was measured by 1% agarose gel electrophoresis and a NanoDrop 8000 Spectrophotometer (Thermo Scientific, Waltham, MA, USA) (260 nm/280 nm ratio). Genomic DNA samples were stored at −20 °C until used in additional procedures. All genomic DNAs and cDNAs were amplified in triplicate. The PCR mixtures comprised 10 μL 2 × QuantiNova SYBR Green RT-PCR Master Mix, 1 μL each of forward and reverse primer (1 μmol/L), and 1 μL of DNA template in a final volume of 20 μL. All qPCR runs were followed by preheating at 95 °C for 3 min, 40 cycles of 95 °C for 10 s, 60 °C for 30 s, and an increase of 0.5 °C every 5 s from 65 °C to 95 °C for melting curve analysis to confirm the specificity of the amplification. Negative controls were performed with no SYBR Premix Ex Taq, no template, or only double-distilled water. The primers used to amplify the microbial populations related to P. kudriavzevii C-16, S. cerevisiae C-3, Schi. pombe C-11, and Z. bailii C-7 are listed in Table 1. To quantify microbial populations in P. kudriavzevii C-16, S. cerevisiae C-3, Schi. pombe C-11, and Z. bailii C-7, ten-, and five-dilution series from four yeast genomic DNA were amplified by real-time quantitative PCR. To quantify expression genes in P. kudriavzevii C-16, S. cerevisiae C-3, Schi. pombe C-11, and Z. bailii C-7, the cycle threshold (CT) values of the replicates and reference genes (UBC6) were calculated. The genes acetyl-CoA hydrolase 1 (ACH1), acetyl-CoA C-acetyltransferase 1 (ACCAT1), acetyl-CoA synthetase 2 (ACS2), aldehyde dehydrogenase 5 (ADH5), hydroxymethylglutaryl-CoA synthase 1 (HMGCS1), hydroxymethylglutaryl-CoA reductase 1 (NADPH) (HMGCR1), and hexose transporter 1 (HXT1) were normalized to reference genes (UBC6). Finally, the relative expression of genes was quantified by the 2−ΔΔCT method [29]. The primers for above expression genes in P. kudriavzevii C-16, S. cerevisiae C-3, Schi. pombe C-11, and Z. bailii C-7 also were designed via the primer-BLAST tool [30] and are shown in Table 2.

2.5. Metabolites Analysis

The acetic acid of samples was identified with high-performance liquid chromatography (HPLC). All samples were pretreated with sterile PBS (0.1 mol/L). For the HPLC analysis, 4 g of material from each sample was taken and placed in 50 mL centrifuge tubes. Then, 30 mL of sterile, distilled water were added and mixed for 30 min in an ice-water bath. The HPLC analysis was performed with the same method as that in UPLC analysis. The HPLC system consisted of an Agilent 1200 HPLC (Agilent Technologies, Santa Clara, CA, USA) coupled to an Agilent 1200 Refractive Index Detector. The column was an Aminex 389 HPX-87H (300 mm × 7.8 mm, Bio-Rad, Hercules, CA, USA) column and the eluent was H2SO4.
The ethyl acetate of samples was identified with headspace-solid phase microextraction-gas chromatography-mass spectrometry (HS-SPME-GC-MS). For metabolite analysis of ethyl acetate, 4 g of material from each sample was taken and placed in 50 mL centrifuge tubes. Then, 30 mL of sterile, distilled water and 0.3 g CaCl2 were added and mixed for 30 min in an ice-water bath. Finally, the supernatants were collected after centrifugation at 8000× g for 10 min. The automatic headspace sampling system (multipurpose sample MPS 2 with an adapter) for the solid-phase microextraction (SPME) (GERSTEL Inc., Baltimore, MD, USA) with 50/30 μm DVB/CAR/PDMS fiber (Supelco Inc., Bellefonte, PA, USA) were used for the SPME. The samples were preheated for 5 min and extracted for 45 min at 50 °C. An Agilent 6890N GC coupled with an Agilent 5975 mass selective detector (MSD) was used for gas chromatography-mass spectrometry (GC-MS). The GC-MS conditions were as follows: the starting temperature was 50 °C (held for 2 min), and it increased to 230 °C at a rate of 4 °C/min and was held at 230 °C for 15 min.
The mevalonic acid of samples was also identified with GC-MS. During the fermentation process, mevalonic acid is easily to form mevalonolactone. A detailed description of mevalonic acid was recently described [32]. A 10 μL sample was injected using an Agilent GC 6890 N with an Agilent 5975 mass selective detector (MSD). The GC-MS conditions were as follows: The starting temperature was 90 °C (held for 1 min), and it increased to 250 °C at a rate of 30 °C/min and was held at 250 °C for 2 min. For absolute quantification, values of samples were fit to a generalized linear model generated from mevalonolactone standards.

2.6. Statistical Analysis

All statistical analyses and data plots were carried out with OriginPro (version 9.01), GraphPad Prism (version 8.02), Microsoft® Excel, and Adobe Illustrator CS6. P-values were calculated with a nonparametric analysis in the Statistical Package for Social Science (SPSS, version 22.0) (Web Atlas, Paris, France).

3. Results

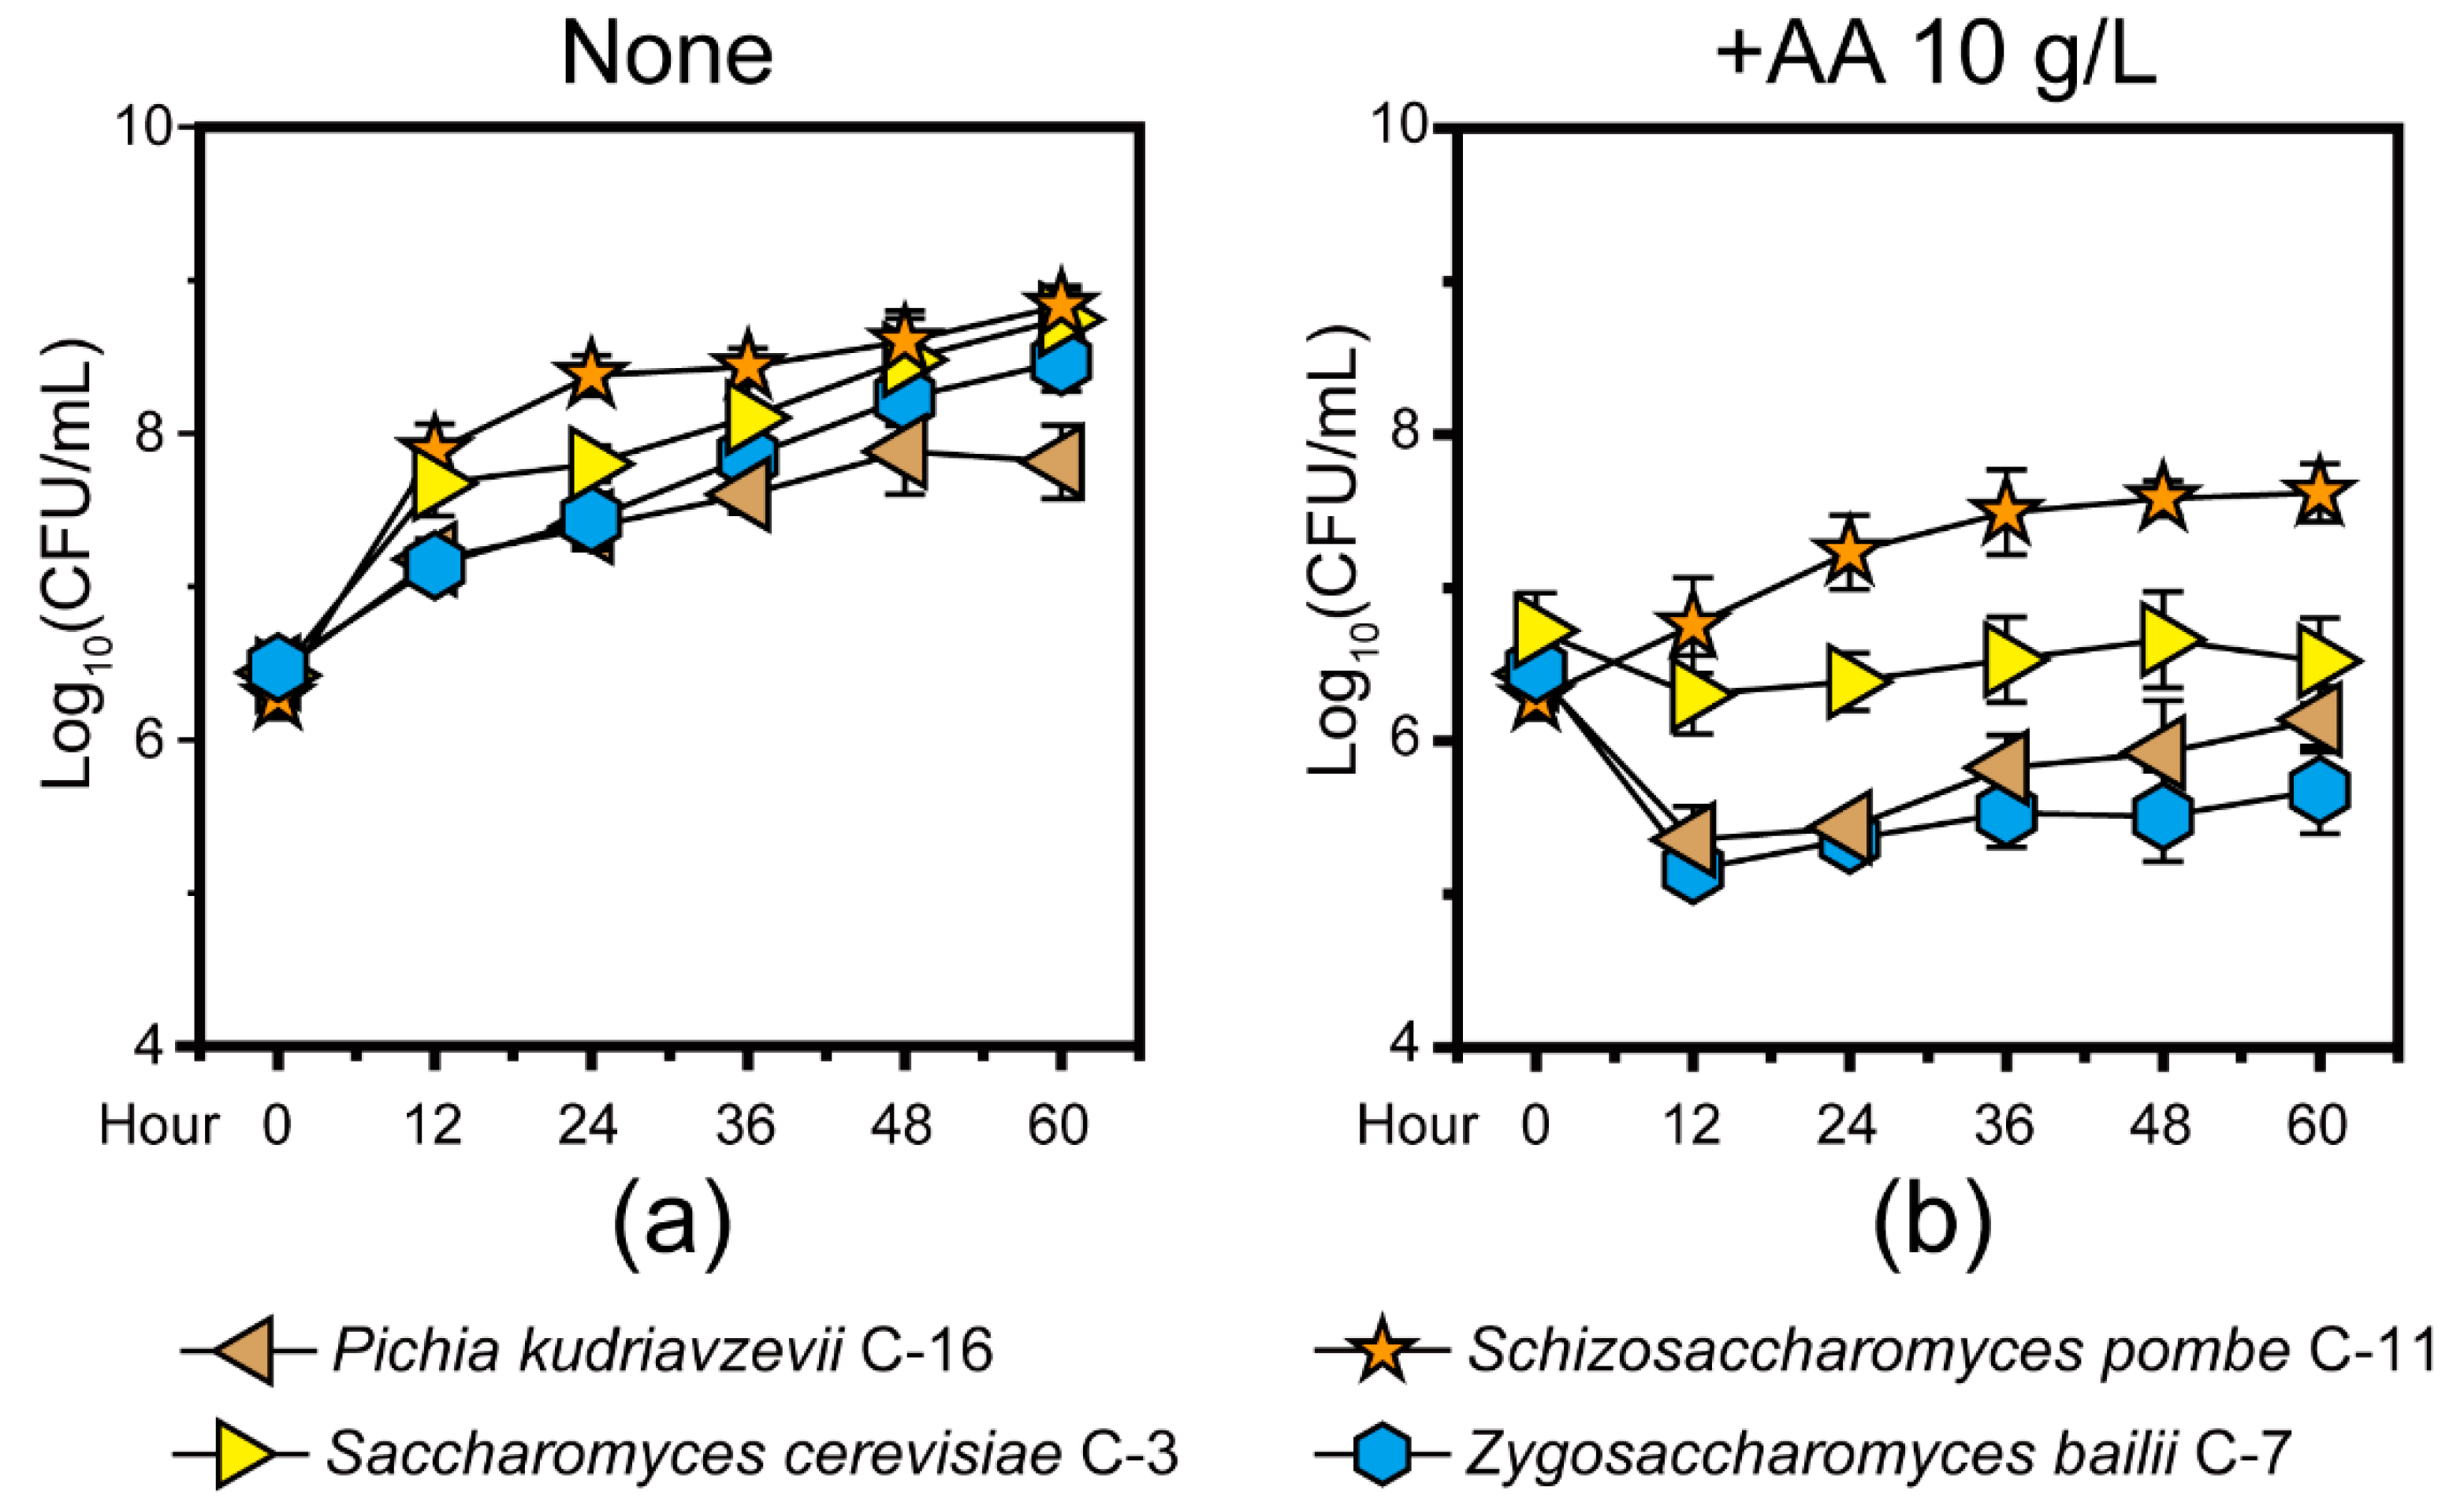
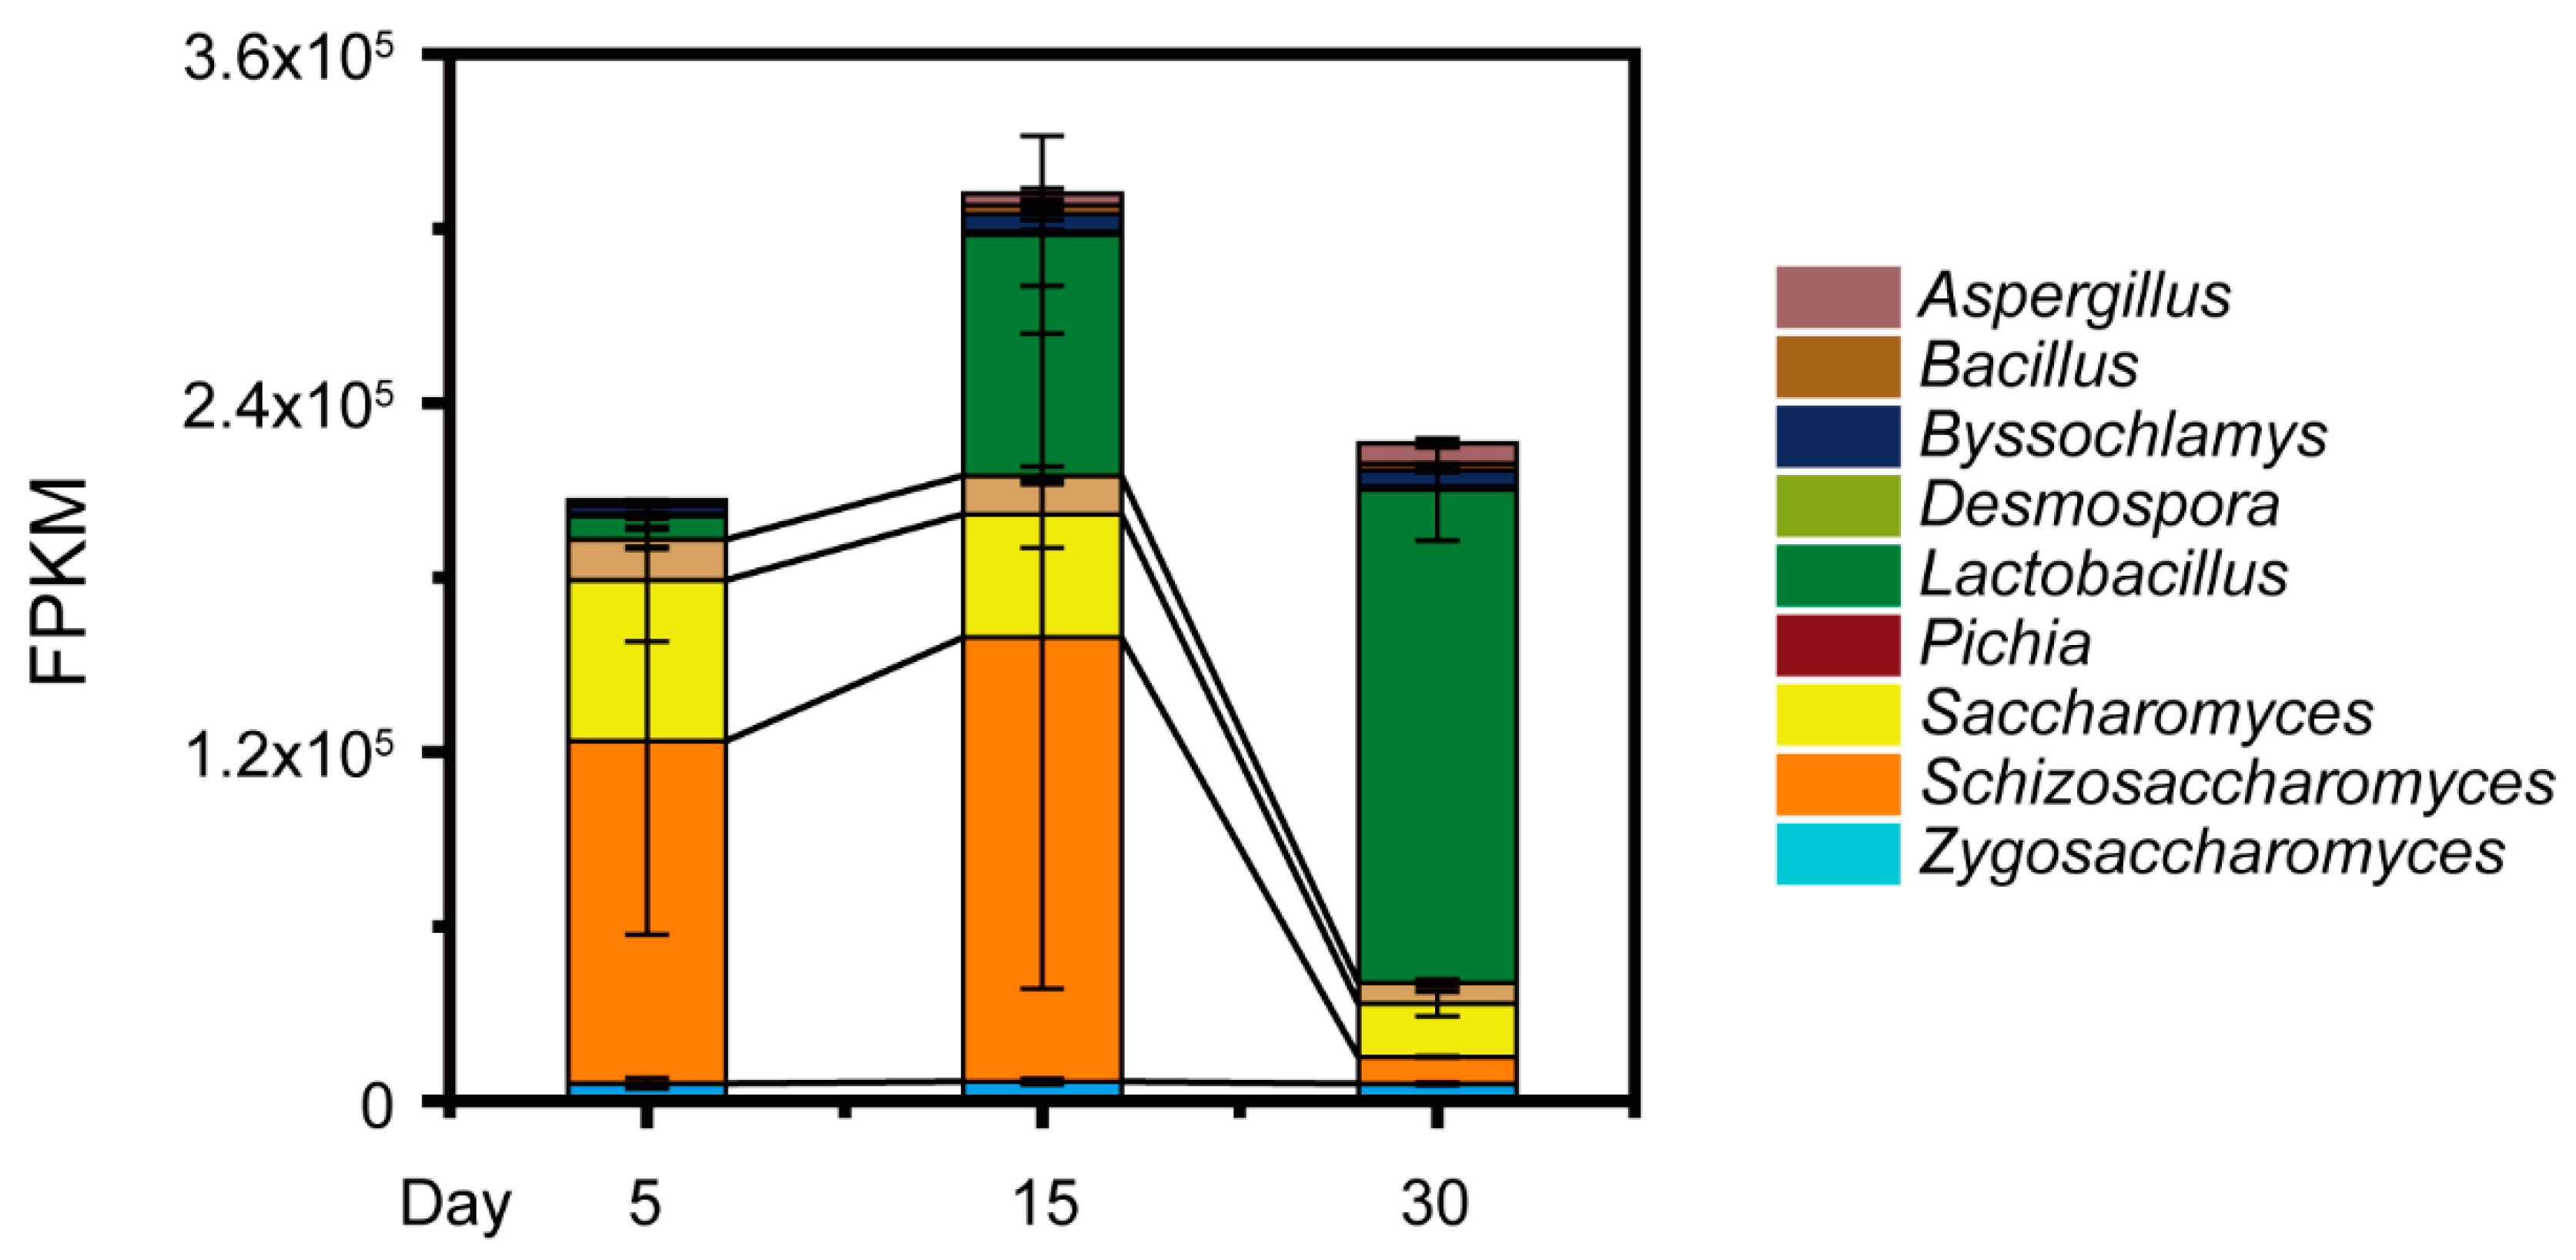
3.1. Potential Capacity of Non-Saccharomyces Yeast Schi. pombe in Response to Acetic Acid Stress

In the previous study, we found P. kudriavzevii, S. cerevisiae, Schi. Pombe, and Z. bailii are the major functional contributors in Chinese Maotai-flavor Baijiu production [9]. Thus, we isolated and identified four core yeast strains that involved S. cerevisiae C-3 and three non-Saccharomyces yeast strains (P. kudriavzevii C-16, Schi. pombe C-11, and Z. bailii C-7) from fermentation microbiota. To illustrate how the four yeast strains tolerated acetic acid, we quantified the microbial populations in +AA 10 g/L and none group samples in vitro (Figure 1, see details in Materials and Methods). Compared with the none group samples, the population of four yeast strains showed a downward trend in the +AA 10 g/L group samples. With an initial concentration of about 10 g/L acetic acid, the population of P. kudriavzevii C-16 and Z. bailii C-7 showed a significant downward trend during the fermentation (Mann–Whitney U test, p < 0.001). Conversely, in the +AA 10 g/L group samples, the population of Schi. pombe C-11 showed an upward trend and reached a maximum of 3.82 × 10⁷ cells per milliliter at 48 h (Figure 1B). The growth curve analysis suggested that there was a significant apparent difference in growth of the four core yeasts between the none group and +AA 10 g/L group samples (Mann–Whitney U test, p < 0.001). However, the Schi. pombe C-11 samples exhibited clearly accelerated growth as compared to the other yeast strains in the samples from +AA 10 g/L group samples. Moreover, the acetic acid profiles in situ were qualified and quantified (Figure 2). The concentration of acetic acid decreased from the fifth day to day 15, with the average ranging from 9.62 g/kg fermented grains to 6.55 g/kg fermented grains. Moreover, the production rate of acetic acid decreased from day zero to 10, with the average ranging from 2.59 g/(kg fermented grains × day) to −0.36 g/(kg fermented grains × day). Although acetic acid accumulated during fermentation, the concentration of acetic acid decreased continuously, and the product rate remained unchanged substantially from the fifth day to day 15, during the fermentation process.
To further illustrate the potential mechanisms underlying acetic acid change in situ, a total of 59.12 G metatranscriptomic sequencing data were generated in the samples from pit A and pit B (4.93 ± 0.95 G per sample) (Tables S1 and S2). On the basis of the data accounting for 34.2% of the total metatranscriptomic (Fragments Per Kilobase per Million, FPKM), we observed nine core genera in the samples from the two pits (i.e., abundance >1%): Aspergillus, Bacillus, Byssochlamys, Desmospora, Lactobacillus, Pichia (major P. kudriavzevii), Saccharomyces (major S. cerevisiae), Schizosaccharomyces (major Schi. pombe), and Zygosaccharomyces (major Z. bailii) (Figure 3). The Schizosaccharomyces and Lactobacillus had high abundance of gene expression (748,663.11 FPKM and 781,4654.71 FPKM, respectively). Moreover, the abundance of gene expression related to core yeast Schi. pombe (368,058.68 FPKM) was much higher than that related to other core yeast species (187,219.88 FPKM) at day 15 during Baijiu production (Mann–Whitney U test, p < 0.001). These analyses demonstrated that non-Saccharomyces yeast Schizosaccharomyces, major Schi. pombe, could had direct correlation with the reduction of acetic acid during Baijiu production.

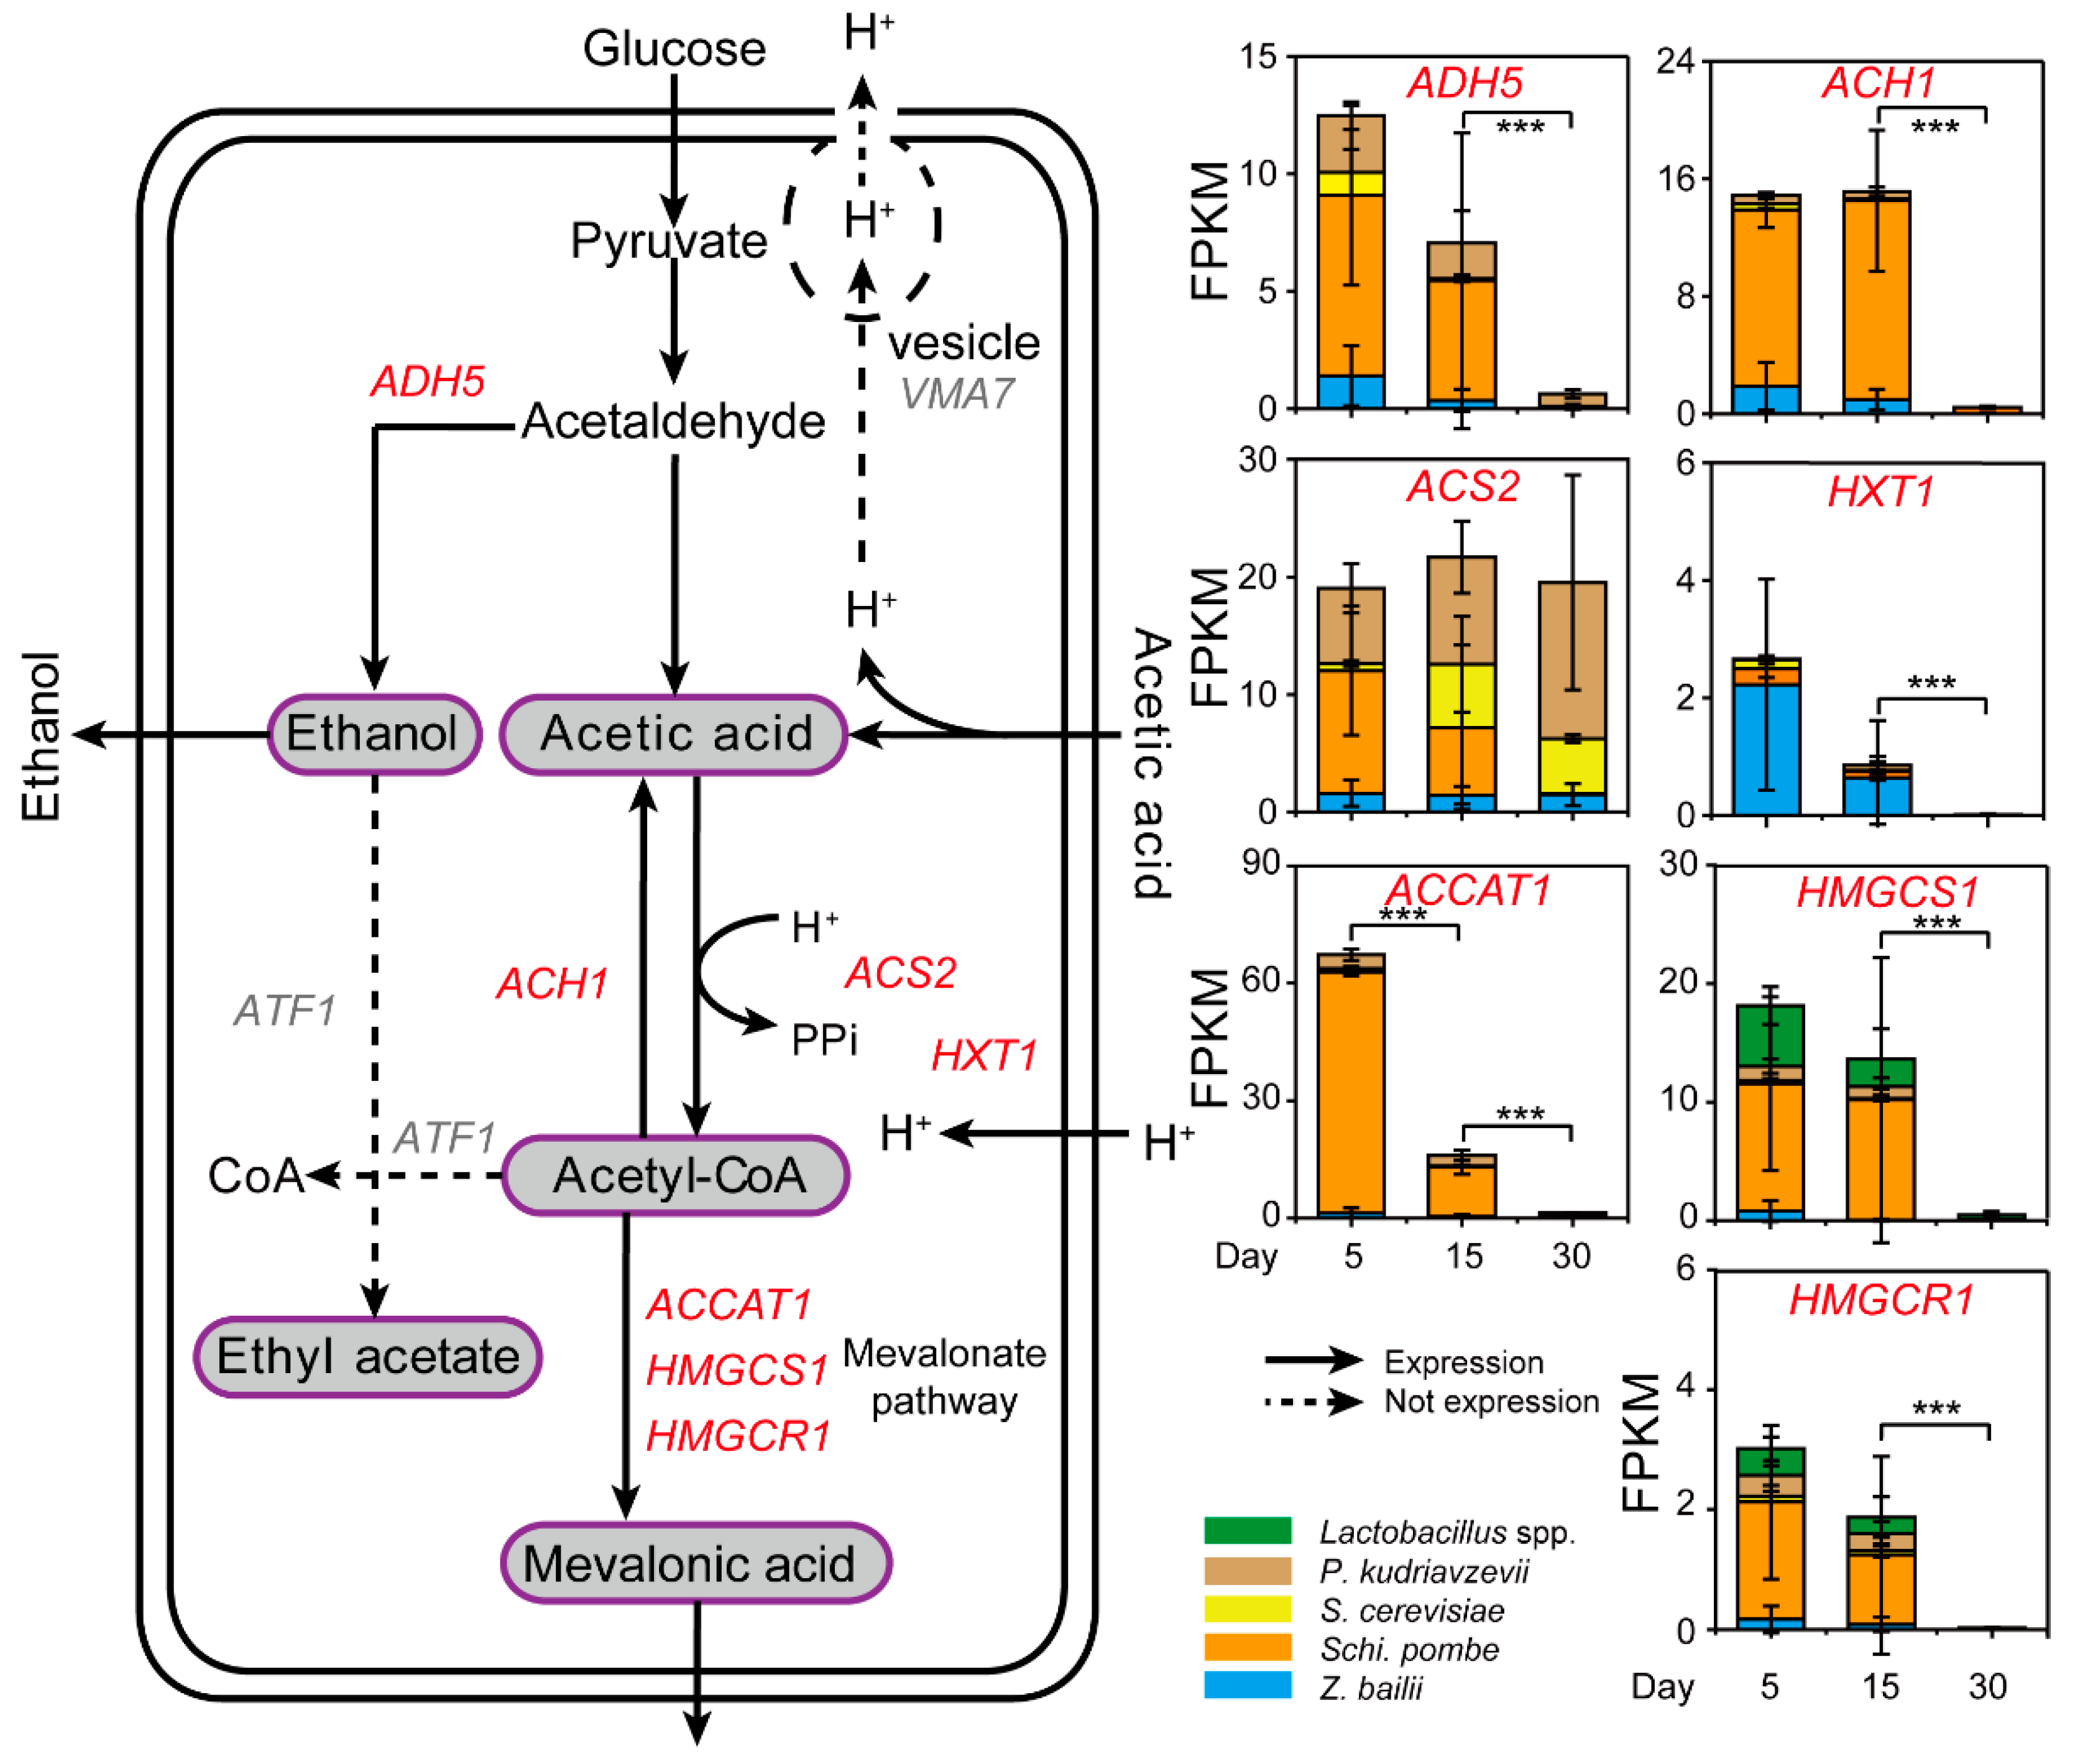
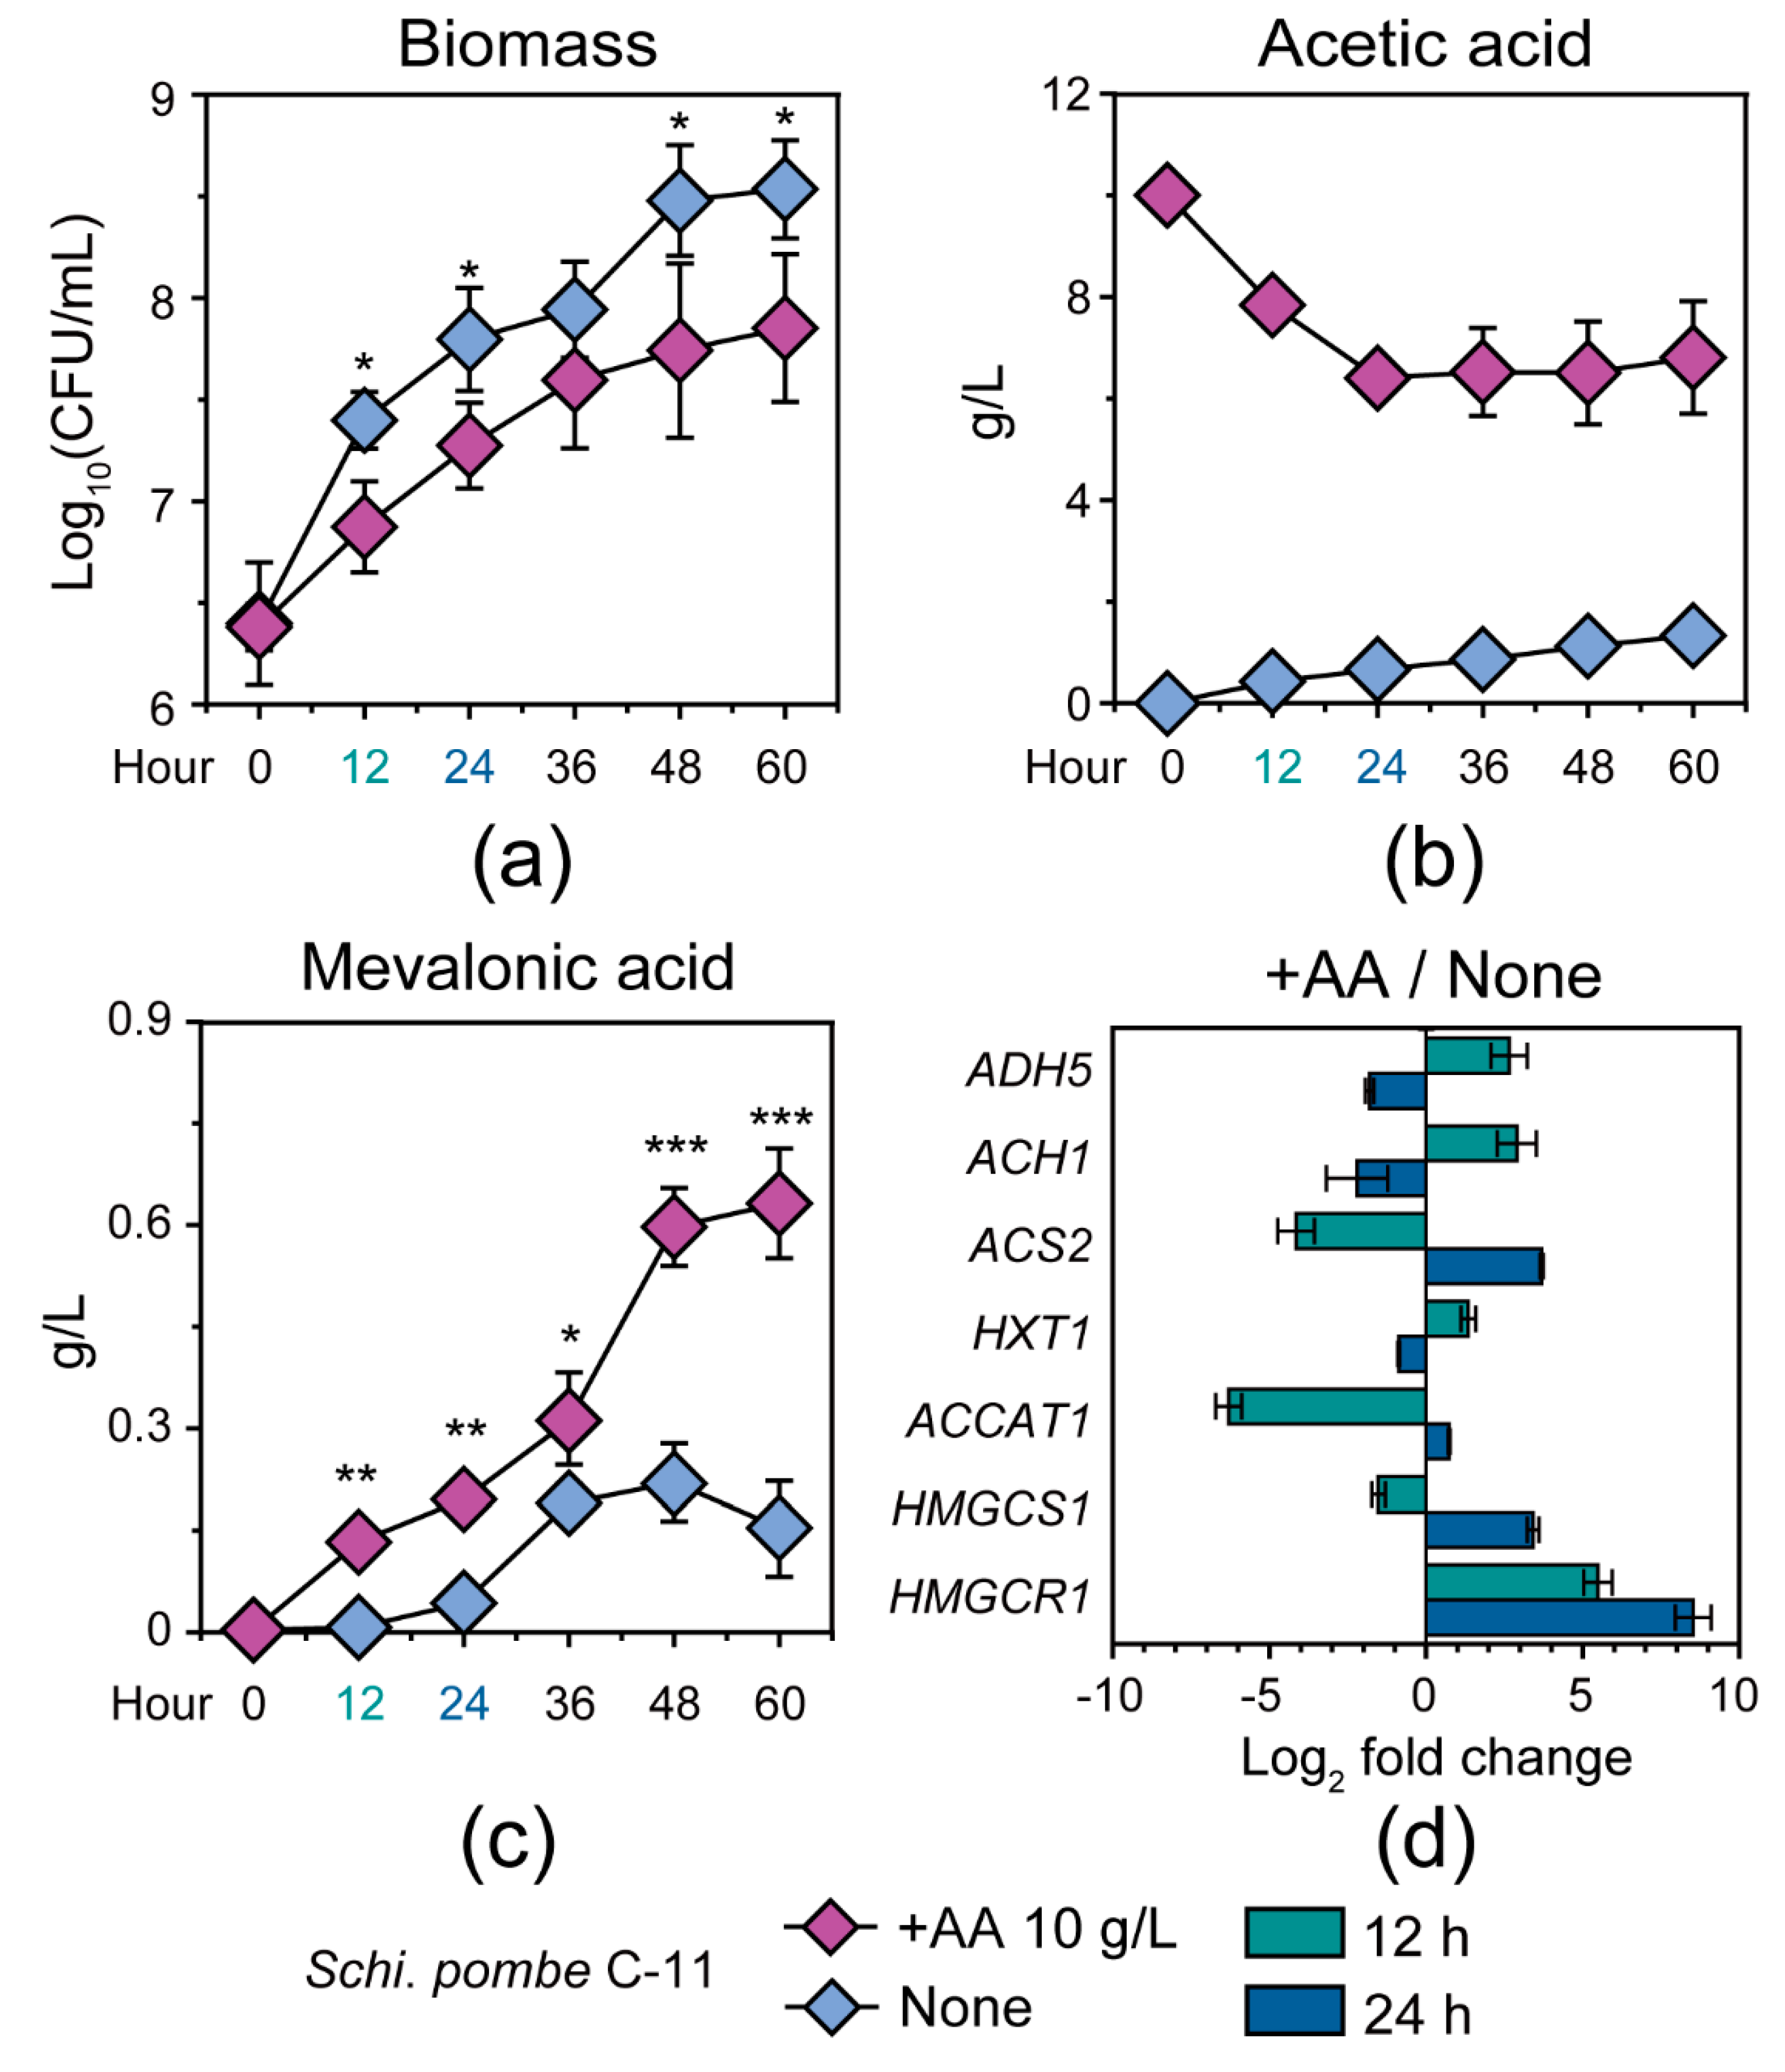
3.2. Schi. pombe Enhanced Conversion Efficiency of Acetic Acid to Generate Mevalonic Acid by Multiple Gene Upregulation

To explore the potential reduction mechanism of acetic acid, gene expressions relevant to the acetic acid generation and utilization were determined by metatranscriptomic analysis in situ (Figure 4 and Table S3). According to the Kyoto Encyclopedia of Genes and Genomes (KEGG) database, we found seven major expressed genes relevant to acetic acid reduction from the samples during Baijiu production. Among them, the gene ACS2 (K01895) expressed at a high level during day five, 15, and 30 in situ (Figure 4). Expression of ACS2 by Schi. pombe and P. kudriavzevii (average 10.44 and 6.40 FPKM, respectively) was observed in the samples, whereas the expression in Z. bailii and S. cerevisiae was 1.60 and 0.60 FPKM (on average) in the samples from day five. Conversely, expression of HXT1 (K08139) by Z. bailii (average 2.23 FPKM) was observed in the samples from day five, whereas there was little expression in S. cerevisiae (average 0.27 FPKM) and P. kudriavzevii (average 0.01 FPKM). In addition, high expression of ACCAT1 (K00626) was in Schi. pombe (average 61.58 FPKM), whereas there were few expressions in Z. bailii and S. cerevisiae (average 1.29 and 0.91 FPKM, respectively) in the samples from day five. Moreover, Schi. pombe had higher expression of HMGCS1 (K01641, total 62.92 FPKM) and HMGCR1 (K00021, total 9.37 FPKM) than other core yeast species and Lactobacillus spp. related to mevalonate pathway in the samples. These three genes also showed significant differences in expression between samples from day 15 and day 30 (Mann–Whitney U test, p < 0.001). However, there were no expression of VMA7 (K02151) and ATF1 (K00664). As shown in Figure S2A, the concentration of ethyl acetate decreased from the fifth day to day 15 with the average ranging from 0.78 g/kg fermented grains to 0.35 g/kg fermented grains. The concentration of ethyl acetate decreased with no expression of ATF1 from day zero to 15 during fermentation. In addition, pH increased from day five to 15 with the average ranging from 3.65 to 3.67 (Figure S2B). Overall, the non-Saccharomyces yeast Schi. pombe reduced the concentration of acetic acid by enhancing the conversion efficiency from acetic acid to mevalonic acid during the fermentation process.

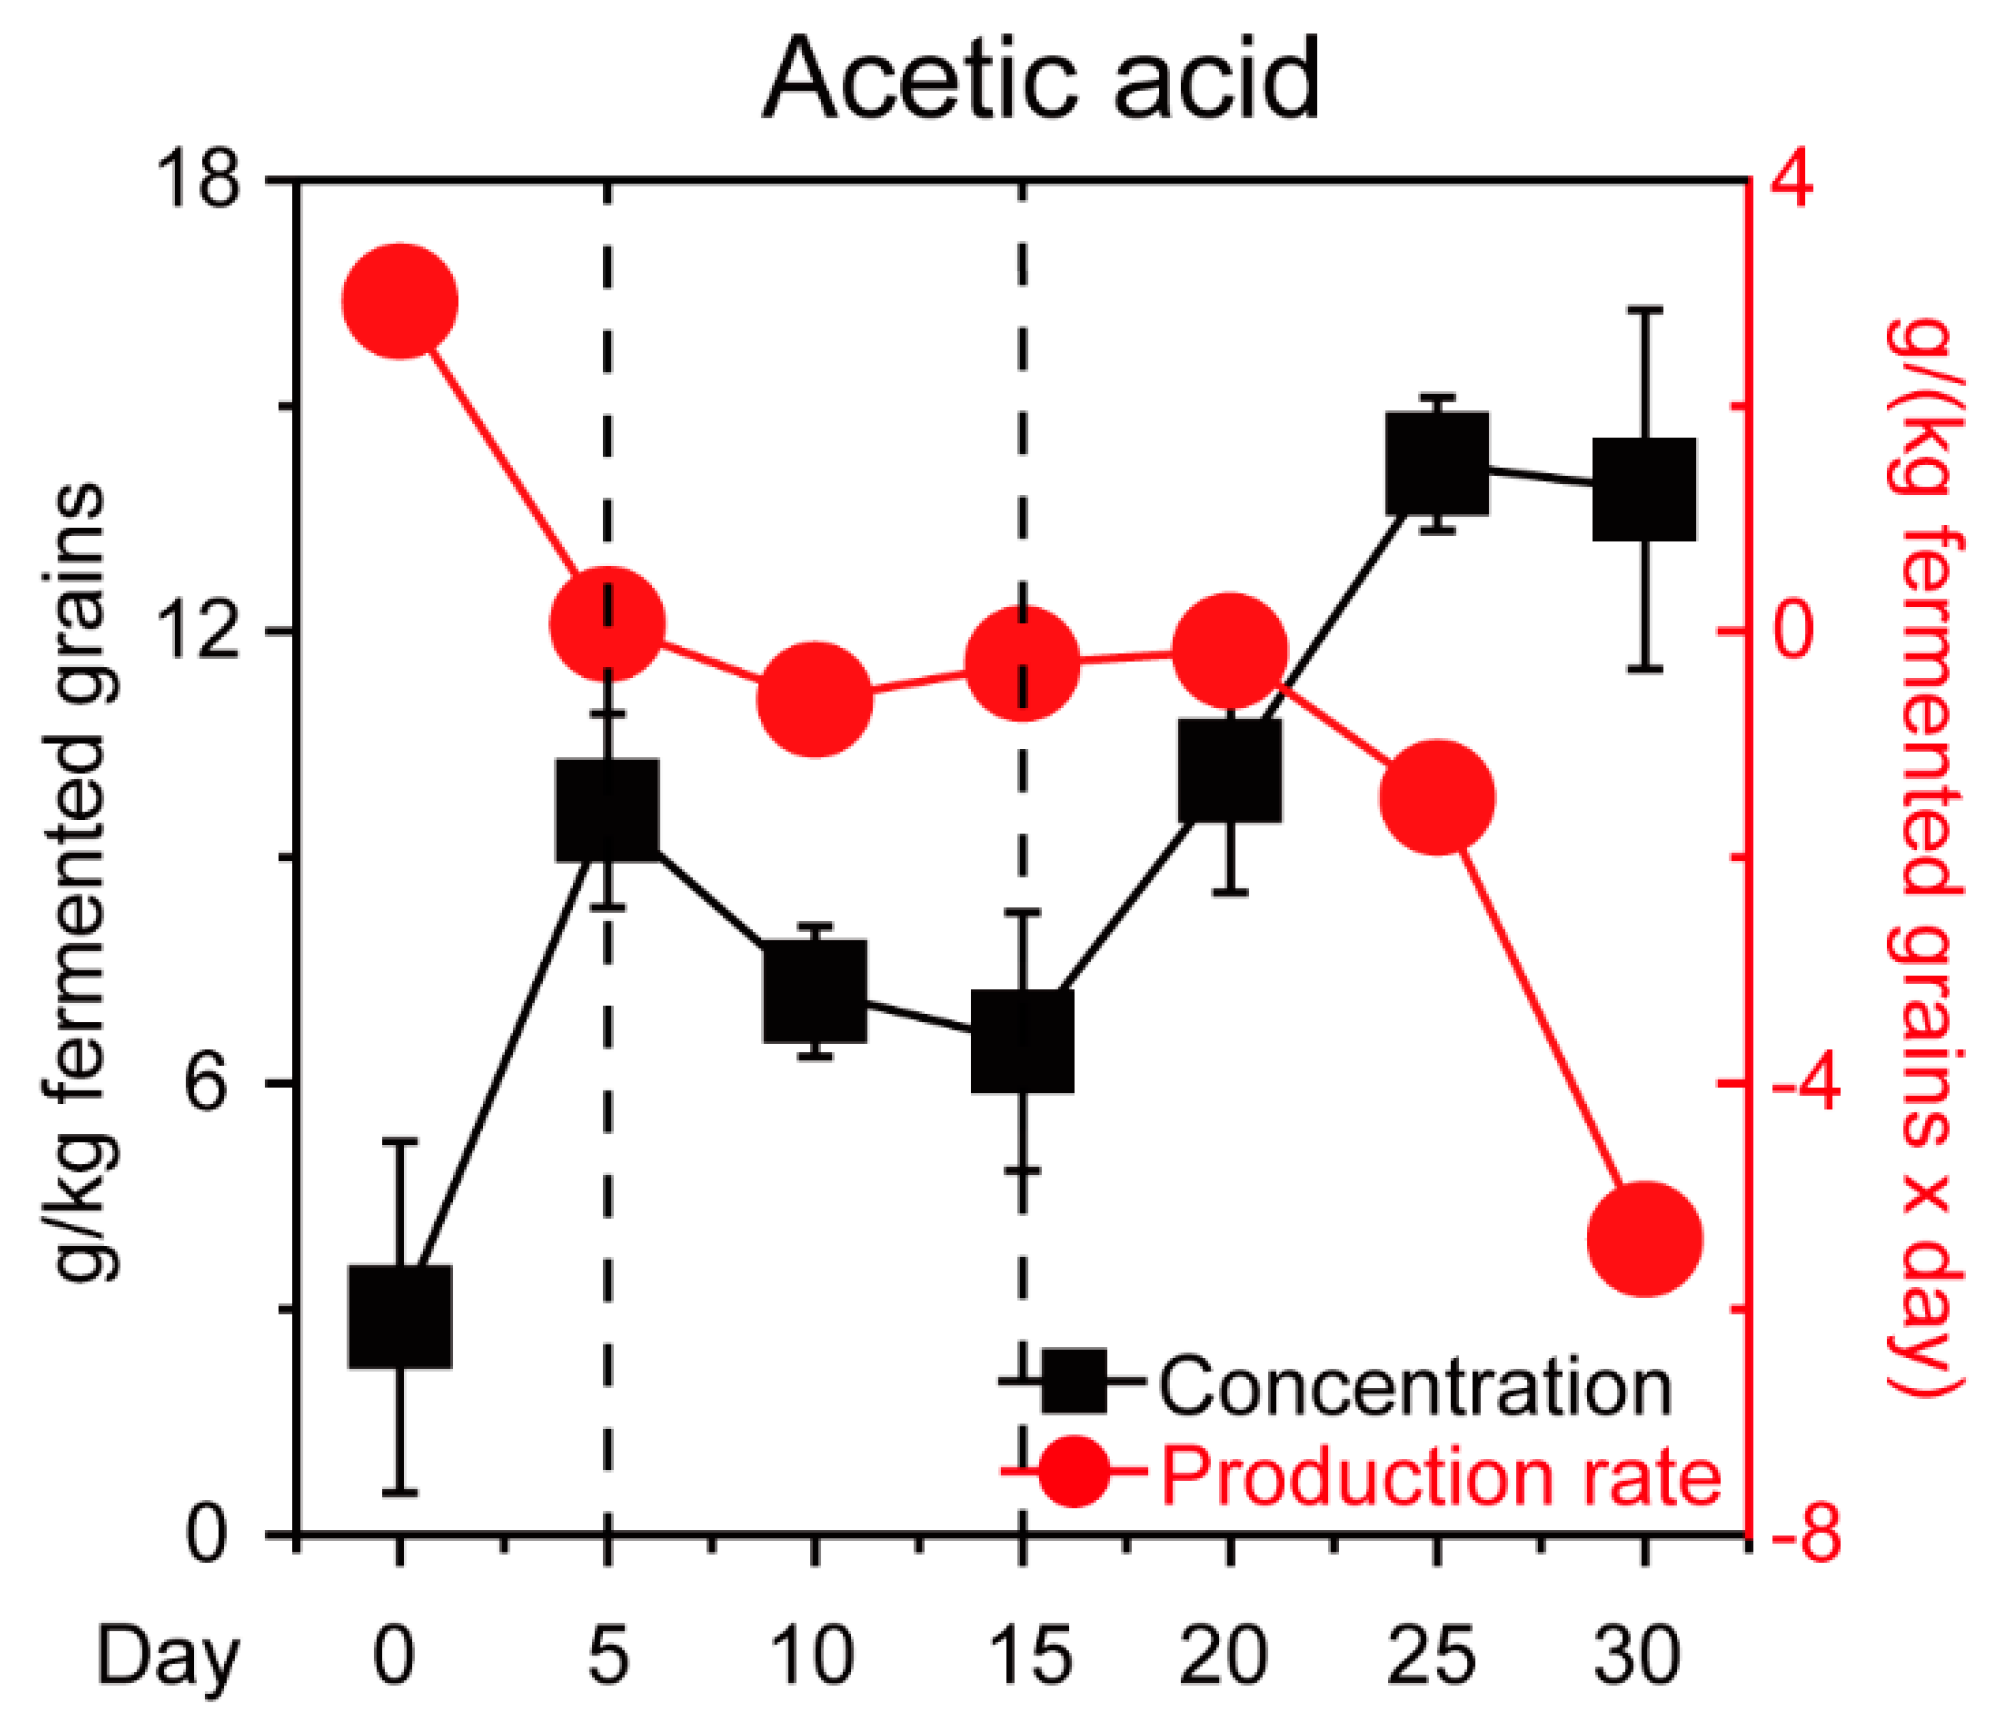
3.3. Response Mechanism of Schi. pombe to Acetic Acid Accumulation

To test and verify the conversion ability of Schi. pombe from acetic acid to mevalonic acid in Baijiu production, we identified and quantified the populations of Schi. pombe C-11 in the +AA 10 g/L and none group samples in mono-culture fermentation (see details in Section 2) (Figure 5). As shown in Figure 5A, the population of Schi. pombe C-11 showed a strong bias between the samples from the +AA 10g/L and the none groups (Figure 5A). Schi. pombe C-11 reached a maximum population of 1.15 × 10⁹ cells per milliliter at 60 h in the + AA 10 g/L group samples, whereas Schi. pombe C-11 reached a maximum population of 4.05 × 10⁹ cells per milliliter at 60 h in the none group samples (Figure 5A). In addition, the concentration of acetic acid showed a downward trend and reached a minimum of 6.40 ± 0.18 g/L at 24 h from +AA 10 g/L samples with the initial concentration of acetic acid about 10 g/L in mono-culture fermentation (Figure 5B). Interestingly, the concentration of mevalonic acid had a significant change from the +AA 10 g/L group samples. In comparison to the samples of the none group, mevalonic acid showed a distinct upward trend from 36 h to 60 h (Figure 5C, Mann–Whitney U test, p < 0.001). Moreover, we also explored the transcription levels of related genes (ADH5, ACH1, ACS2, HXT1, ACCAT1, HMGCS1, and HMGCR1) at 12 h and 24 h in the samples from the +AA 10 g/L and none groups (Figure 5D). As compared with culture fermentation of no added acetic acid, the transcription of ADH5 (average from 2.65 to −1.80, log2 fold change), ACH1 (average from 2.90 to −2.20, log2 fold change) and HXT1 (average from 1.35 to −0.87, log2 fold change) was decreased from 12 h to 24 h in the +AA 10 g/L group. Moreover, the transcription levels of genes related to acetic acid utilization were upregulated, including ACS2 (average from −4.15 to 3.69, log2 fold change), ACCAT1 (average from −6.30 to 0.73, log2 fold change), HMGCS1 (average from −1.52 to 3.42, log2 fold change), and HMGCR1 (average from 5.48 to 8.53, log2 fold change) in Schi. pombe C-11 from 12 h to 24 h in the +AA 10 g/L group samples.

4. Discussion

Chinese Maotai-flavor Baijiu production is a traditional spontaneous fermentation process with various non-Saccharomyces yeasts and multiple flavor-related products [6]. It provides a good opportunity to explore the functions of non-Saccharomyces yeasts in microbiota [5,33]. We have previously reported that non-Saccharomyces yeasts have important effects on the concentration of acetic acid [9]. Moreover, previous reports have also demonstrated that non-Saccharomyces yeasts could moderate acetic acid with final concentrations below 0.3 g/L [18,34]. Thus, discovering the characteristics of non-Saccharomyces yeasts could help to illustrate concentration changes of acetic acid during Baijiu production.
In our work, a high concentration of acetic acid inhibited the growth of core functional yeasts that involved one Saccharomyces and three non-Saccharomyces yeast strains (Figure 1). In addition, one unanticipated finding was that the concentration of acetic acid decreased in the samples from the fifth day to day 15 and non-Saccharomyces yeast Schi. pombe had a direct correlation with the reduction in situ (Figure 2 and Figure 3). Although multiple Lactobacillus species have great acetic acid productivity, they have no ability to degrade the concentration of acetic acid in Baijiu production [9,14]. Conversely, Schi. pombe has great acetic acid productivity and could produce low levels of acetic acid with other non-Saccharomyces yeasts [18]. As compared with previous reports, our findings suggested that Schi. pombe could convert acetic acid to other metabolites although the microbial biomass is limited by the stress of acetic acid. The high-level expressions of gene ACCAT1, HMGCS1, and HMGCR1 explained that microbiota reduces the concentration of acetic acid in the cell through the mevalonate pathway in Schi. pombe instead of ethyl acetate synthesis in S. cerevisiae, thereby improving microbiota to tolerate the stress of acetic acid in situ (Figure 4). It was reported that the undissociated form of acetic acid can enter the yeast cells by simple diffusion (pKa > pHext) or through the S. cerevisiae Fps1p [35]. To maintain neutral pH in the cytoplasm, the hydrogen ion (H+) dissociated from acetic acid can be excluded via vacuolar efflux from intracellular to extracellular, such as VMA7 [36]. Intracellular acetate ion (CH3COO−) dissociated from acetic acid can also be metabolized through the conversion to acetyl-CoA [37,38]. Then, acetyl-CoA in the cell could product ethyl acetate by alcohol acetyltransferases (e.g., ATF1) with ethanol to tolerate acetic acid stress in S. cerevisiae [39]. Thus, the formation of ethyl acetate is an effective way to reduce acetic acid [40]. However, our findings assumed that the Schi. pombe uses a new way to convert acetic acid and improves the reduction capacity under acid stress.
To test and verify the abovementioned hypothesis, we cultivated the strain Schi. pombe C-11 under different acid conditions in vitro. The results showed that acetic acid inhibited the growth of Schi. pombe C-11 in the + AA 10 g/L group samples as compared with the none group (Figure 5, see details in Materials and Methods). Moreover, Schi. pombe C-11 improved the conversion efficiency of acetic acid to generate mevalonic acid in the + AA 10 g/L group samples, which could reduce the concentration of acetic acid and relieve its inhibition in fermentation microbiota (Figure 5). There are several reasons why the microbiota chose the mevalonate pathway to reduce acetic acid by Schi. pombe C-11 in Chinese Maotai-flavor Baijiu production. These reasons include: (i) The first possible explanation is that efflux H+ from the cell cannot solve the problem of intracellular low pH. The extracellular H+ would pass through the membrane again into the cells, thereby energy stored in the cells is continuously consumed. With the fermentation process, yeast cells cannot maintain their normal pH range, eventually causing yeast to lack their functions [41]. (ii) In the case of low pH in cell, ATF gene (optimum pH ≈ 7) was inhibited and its function was lacking in S. cerevisiae [42]. Thus, S. cerevisiae cannot reduce acetic acid by forming ethyl acetate [42]. (iii) As a non-Saccharomyces yeast, Schi. pombe has no metabolic pathway related to ATF gene. However, Schi. pombe has mevalonate pathway to generate terpenes from acetic acid, thereby reducing the stress of acetic acid ultimately in microbiota [43,44]. Therefore, studies need to explore further information about the microbial interactions between S. cerevisiae and non-Saccharomyces yeasts at the molecular level.
In conclusion, we revealed the function of non-Saccharomyces yeast Schi. pombe in fermentation microbiota based on culture-independent and -dependent methods. By converting acetic acid to form mevalonic acid, Schi. pombe reduced the concentration of acetic acid to improve acid resistance in fermentation microbiota. In addition, Schi. pombe also generated the precursor of terpenes synchronously to enhance the quality and taste of Chinese Maotai-flavor Baijiu. These findings enriched our knowledge about a new metabolic mechanism of non-Saccharomyces yeasts in acetic acid utilization. Our study also provided reference approaches to decode the functions of non-Saccharomyces yeasts in various alcoholic beverage industries.

Supplementary Materials

The following are available online at https://www.mdpi.com/2076-2607/7/12/606/s1, Figure S1: Fermentation process, Figure S2: Dynamic concentration of ethyl acetate and pH, Table S1: Metatranscriptomic sequencing quality information, Table S2: Metatranscriptomic sequencing assembly information, Table S3: KEGG expression genes.

Author Contributions

Z.S., H.D., and Y.X. designed this research; Z.S., H.D., M.Z., and Y.X. executed the experiments and analyzed the data; H.D., M.Z., Y.N., and Y.X had reviewed and edited this manuscript; Z.S. wrote the manuscript.

Funding

This research was funded by the National Natural Science Foundation of China (NSFC) (grants 31530055), the National Key R&D Program (no. 2016YFD0400503, 2018YFC1604100), the National First-Class Discipline Program of Light Industry Technology and Engineering (LITE2018-12), and the Postgraduates Research & Practice Innovation Program of Jiangsu Province (grant KYCX17_1426).

Acknowledgments

The authors would like to thank Yan Zhang (Shanghai Jiao Tong University) for critical reading of this manuscript. The authors also thank Liwen Bianji, Edanz Group China (www.liwenbianji.cn/ac), for editing the English text of a draft of this manuscript. The authors are grateful to China Kweichow Moutai Distillery Co., Ltd. for supporting this study.

Conflicts of Interest

The authors declare no conflict of interest.

References

  1. Roca-Domenech, G.; Cordero-Otero, R.; Rozes, N.; Cleroux, M.; Pernet, A.; de Orduna, R.M. Metabolism of Schizosaccharomyces pombe under reduced osmotic stress conditions afforded by fed-batch alcoholic fermentation of white grape must. Food Res. Int. 2018, 113, 401–406. [Google Scholar] [CrossRef]
  2. Liu, S.; Laaksonen, O.; Kortesniemi, M.; Kalpio, M.; Yang, B. Chemical composition of bilberry wine fermented with non-Saccharomyces yeasts (Torulaspora delbrueckii and Schizosaccharomyces pombe) and Saccharomyces cerevisiae in pure, sequential and mixed fermentations. Food Chem. 2018, 266, 262–274. [Google Scholar] [CrossRef]
  3. Wei, J.; Zhang, Y.; Yuan, Y.; Dai, L.; Yue, T. Characteristic fruit wine production via reciprocal selection of juice and non-Saccharomyces species. Food Microbiol. 2019, 79, 66–74. [Google Scholar] [CrossRef] [PubMed]
  4. Du, H.; Wang, X.; Zhang, Y.; Xu, Y. Exploring the impacts of raw materials and environments on the microbiota in Chinese Daqu starter. Int. J. Food Microbiol. 2019, 297, 32–40. [Google Scholar] [CrossRef] [PubMed]
  5. Wang, X.; Du, H.; Zhang, Y.; Xu, Y. Environmental microbiota drives microbial succession and metabolic profiles during Chinese liquor fermentation. Appl. Environ. Microbiol. 2018, 84. [Google Scholar] [CrossRef] [PubMed]
  6. Jin, G.; Zhu, Y.; Xu, Y. Mystery behind Chinese liquor fermentation. Trends Food Sci. Tech. 2017, 63, 18–28. [Google Scholar] [CrossRef]
  7. Zha, M.; Sun, B.; Wu, Y.; Yin, S.; Wang, C. Improving flavor metabolism of Saccharomyces cerevisiae by mixed culture with Wickerhamomyces anomalus for Chinese Baijiu making. J. Biosci. Bioeng. 2018, 126, 189–195. [Google Scholar] [CrossRef]
  8. Xu, Y.; Zhi, Y.; Wu, Q.; Du, R. Zygosaccharomyces bailii is a potential producer of various flavor compounds in Chinese Maotai-flavor liquor fermentation. Front. Microbiol. 2017, 8, 2609. [Google Scholar] [CrossRef]
  9. Song, Z.; Du, H.; Zhang, Y.; Xu, Y. Unraveling core functional microbiota in traditional solid-state fermentation by high-throughput amplicons and metatranscriptomics sequencing. Front. Microbiol. 2017, 8, 1294. [Google Scholar] [CrossRef]
  10. Wang, D.; Chen, L.; Yang, F.; Wang, H.; Wang, L. Yeasts and their importance to the flavour of traditional Chinese liquor: A review. J. Inst. Brew. 2019, 125, 214–221. [Google Scholar] [CrossRef]
  11. Jiang, J.; Liu, Y.; Li, H.; Yang, Q.; Wu, Q.; Chen, S.; Tang, J.; Xu, Y. Modeling and regulation of higher alcohol production through the combined effects of the C/N ratio and microbial interaction. J. Agric. Food Chem. 2019, 67, 10694–10701. [Google Scholar] [CrossRef] [PubMed]
  12. Fan, G.; Teng, C.; Xu, D.; Fu, Z.; Liu, P.; Wu, Q.; Yang, R.; Li, X. Improving ethyl acetate production in Baijiu manufacture by Wickerhamomyces anomalus and Saccharomyces cerevisiae mixed culture fermentations. Biomed Res. Int. 2019, 2019, 1–11. [Google Scholar] [CrossRef] [PubMed]
  13. Du, H.; Song, Z.; Xu, Y. Ethyl carbamate formation regulated by lactic acid bacteria and nonconventional yeasts in solid-state fermentation of Chinese Moutai-flavor liquor. J Agric. Food Chem. 2017, 66, 387–392. [Google Scholar] [CrossRef] [PubMed]
  14. Xu, Y.; Ji, K. Moutai (Maotai): Production and sensory properties. In Alcoholic Beverages; John, P., Ed.; Woodhead Publishing: London, UK, 2012; pp. 315–330. [Google Scholar]
  15. Wu, Q.; Xu, Y.; Chen, L. Diversity of yeast species during fermentative process contributing to Chinese Maotai-flavour liquor making. Lett. Appl. Microbiol. 2012, 55, 301–307. [Google Scholar] [CrossRef] [PubMed]
  16. Su, J.; Wang, T.; Wang, Y.; Li, Y.Y.; Li, H. The use of lactic acid-producing, malic acid-producing, or malic acid-degrading yeast strains for acidity adjustment in the wine industry. Appl. Microbiol. Biotechnol. 2014, 98, 2395–2413. [Google Scholar] [CrossRef]
  17. Benito, A.; Calderon, F.; Benito, S. Schizosaccharomyces pombe isolation protocol. In Methods Molecular Biology, 1st ed.; Singleton, T., Ed.; Springer: Berlin/Heidelberg, Germany, 2018; pp. 227–234. [Google Scholar]
  18. Benito, S. The impacts of Schizosaccharomyces on winemaking. Appl. Microbiol. Biotechnol. 2019, 103, 4291–4312. [Google Scholar] [CrossRef]
  19. Wu, Q.; Chen, L.; Xu, Y. Yeast community associated with the solid-state fermentation of traditional Chinese Maotai-flavor liquor. Int. J. Food Microbiol. 2013, 166, 323–330. [Google Scholar] [CrossRef]
  20. Wu, Q.; Chen, B.; Xu, Y. Regulating yeast flavor metabolism by controlling saccharification reaction rate in simultaneous saccharification and fermentation of Chinese Maotai-flavor liquor. Int. J. Food Microbiol. 2015, 200, 39–46. [Google Scholar] [CrossRef]
  21. Zhang, J.; Presley, G.N.; Hammel, K.E.; Ryu, J.S.; Menke, J.R.; Figueroa, M.; Hu, D.; Orr, G.; Schilling, J.S. Localizing gene regulation reveals a staggered wood decay mechanism for the brown rot fungus Postia placenta. Proc. Natl. Acad. Sci. USA 2016, 113, 10968–10973. [Google Scholar] [CrossRef]
  22. Azvolinsky, A.; DeFrancesco, L.; Waltz, E.; Webb, S. 20 years of Nature Biotechnology research tools. Nature Biotech. 2016, 34, 256. [Google Scholar] [CrossRef]
  23. Louis, S.; Tappu, R.M.; Damms-Machado, A.; Huson, D.H.; Bischoff, S.C. Characterization of the gut microbial community of obese patients following a weight-loss intervention using whole metagenome shotgun sequencing. PLoS ONE 2016, 11, e0149564. [Google Scholar] [CrossRef] [PubMed]
  24. Buchfink, B.; Xie, C.; Huson, D.H. Fast and sensitive protein alignment using DIAMOND. Nat. Methods 2015, 12, 59. [Google Scholar] [CrossRef] [PubMed]
  25. Burstein, D.; Harrington, L.B.; Strutt, S.C.; Probst, A.J.; Anantharaman, K.; Thomas, B.C.; Doudna, J.A.; Banfield, J.F. New CRISPR-Cas systems from uncultivated microbes. Nature 2017, 542, 237. [Google Scholar] [CrossRef] [PubMed]
  26. Kanehisa, M.; Furumichi, M.; Tanabe, M.; Sato, Y.; Morishima, K. KEGG: New perspectives on genomes, pathways, diseases and drugs. Nucleic Acids Res. 2016, 45, D353–D361. [Google Scholar] [CrossRef]
  27. Abergel, A.; Metivier, S.; Samuel, D.; Jiang, D.; Kersey, K.; Pang, P.S.; Svarovskaia, E.; Knox, S.J.; Loustaud-Ratti, V.; Asselah, T. Ledipasvir plus sofosbuvir for 12 weeks in patients with hepatitis C genotype 4 infection. Hepatology 2016, 64, 1049–1056. [Google Scholar]
  28. Meng, X.; Wu, Q.; Wang, L.; Wang, D.; Chen, L.; Xu, Y. Improving flavor metabolism of Saccharomyces cerevisiae by mixed culture with Bacillus licheniformis for Chinese Maotai-flavor liquor making. J. Ind. Microbiol. Biotechnol. 2015, 42, 1601–1608. [Google Scholar] [CrossRef]
  29. Wang, X.; Jiang, D.; Yang, D. Fast-tracking determination of homozygous transgenic lines and transgene stacking using a reliable quantitative real-time PCR assay. Appl. Biochem. Biotechnol. 2015, 175, 996–1006. [Google Scholar] [CrossRef]
  30. Ye, J.; Coulouris, G.; Zaretskaya, I.; Cutcutache, I.; Rozen, S.; Madden, T.L. Primer-BLAST: A tool to design target-specific primers for polymerase chain reaction. BMC Bioinform. 2012, 13, 134. [Google Scholar] [CrossRef]
  31. Zott, K.; Claisse, O.; Lucas, P.; Coulon, J.; Lonvaud-Funel, A.; Masneuf-Pomarede, I. Characterization of the yeast ecosystem in grape must and wine using real-time PCR. Food Microbiol. 2010, 27, 559–567. [Google Scholar] [CrossRef]
  32. Rodriguez, S.; Denby, C.M.; Van Vu, T.; Baidoo, E.E.; Wang, G.; Keasling, J.D. ATP citrate lyase mediated cytosolic acetyl-CoA biosynthesis increases mevalonate production in Saccharomyces cerevisiae. Microb. Cell Fac. 2016, 15, 48. [Google Scholar] [CrossRef]
  33. Benito, S.; Palomero, F.; Calderón, F.; Palmero, D.; Suárez-Lepe, J.A. Selection of appropriate Schizosaccharomyces strains for winemaking. Food Microbiol. 2014, 42, 218–224. [Google Scholar] [CrossRef] [PubMed]
  34. Benito, A.; Jeffares, D.; Palomero, F.; Calderon, F.; Bai, F.; Bahler, J.; Benito, S. Selected Schizosaccharomyces pombe strains have characteristics that are beneficial for winemaking. PLoS ONE 2016, 11, e0151102. [Google Scholar] [CrossRef] [PubMed]
  35. Geng, P.; Zhang, L.; Shi, G.Y. Omics analysis of acetic acid tolerance in Saccharomyces cerevisiae. World J. Microbiol. Biotechnol. 2017, 33, 94. [Google Scholar] [CrossRef]
  36. Meijnen, J.P.; Randazzo, P.; Foulquie-Moreno, M.R.; van den Brink, J.; Vandecruys, P.; Stojiljkovic, M.; Dumortier, F.; Zalar, P.; Boekhout, T.; Gunde-Cimerman, N.; et al. Polygenic analysis and targeted improvement of the complex trait of high acetic acid tolerance in the yeast Saccharomyces cerevisiae. Biotechnol. Biofuels 2016, 9, 5. [Google Scholar] [CrossRef] [Green Version]
  37. Rodrigues, F.; Zeeman, A.M.; Cardoso, H.; Sousa, M.J.; Steensma, H.Y.; Côrte-Real, M.; Leão, C. Isolation of an acetyl-CoA synthetase gene (ZbACS2) from Zygosaccharomyces bailii. Yeast 2004, 21, 325–331. [Google Scholar] [CrossRef] [Green Version]
  38. Rodrigues, F.; Sousa, M.J.; Ludovico, P.; Santos, H.; Côrte-Real, M.; Leão, C. The fate of acetic acid during glucose co-metabolism by the spoilage yeast Zygosaccharomyces bailii. PLoS ONE 2012, 7, e52402. [Google Scholar] [CrossRef] [Green Version]
  39. Kruis, A.J.; Mars, A.E.; Kengen, S.W.; Borst, J.W.; van der Oost, J.; Weusthuis, R.A. Alcohol acetyltransferase Eat1 is located in yeast mitochondria. Appl. Environ. Microbiol. 2018, 84. [Google Scholar] [CrossRef] [Green Version]
  40. Mason, A.B.; Dufour, J.P. Alcohol acetyltransferases and the significance of ester synthesis in yeast. Yeast 2000, 16, 1287–1298. [Google Scholar] [CrossRef]
  41. Orij, R.; Brul, S.; Smits, G.J. Intracellular pH is a tightly controlled signal in yeast. BBA Gen. Subj. 2011, 1810, 933–944. [Google Scholar] [CrossRef]
  42. Ding, B.J.; Lager, I.; Bansal, S.; Durrett, T.P.; Stymne, S.; Löfstedt, C. The yeast ATF1 acetyltransferase efficiently acetylates insect pheromone alcohols: Implications for the biological production of moth pheromones. Lipids 2016, 51, 469–475. [Google Scholar] [CrossRef] [Green Version]
  43. Dirkmann, M.; Nowack, J.; Schulz, F. An in vitro biosynthesis of sesquiterpenes starting from acetic acid. ChemBioChem 2018, 19, 2146–2151. [Google Scholar] [CrossRef] [PubMed]
  44. Sun, W.; Qin, L.; Xue, H.; Yu, Y.; Ma, Y.; Wang, Y.; Li, C. Novel trends for producing plant triterpenoids in yeast. Crit. Rev. Biotechnol. 2019, 39, 618–632. [Google Scholar] [CrossRef] [PubMed]
Figure 1. The microbial biomass of four core yeast strains (Pichia kudriavzevii C-16, Saccharomyces cerevisiae C-3, Schizosaccharomyces pombe C-11, and Zygosaccharomyces bailii C-7) isolated from fermentation microbiota in None (a) and +AA 10 g/L (b) group samples (see details in Section 2). Data are expressed as mean ± SD from biological triplicates. Error bars indicate standard deviation from three independent experiments.
Microorganisms 07 00606 g001
Figure 2. Dynamic concentration and production rate of acetic acid during Baijiu production. Data are expressed as mean ± SD from biological triplicates. Error bars indicate standard deviation from three independent sampling points.
Microorganisms 07 00606 g002
Figure 3. The gene expression of nine dominant fungal and bacterial genera (i.e., abundance >1%) by metatranscriptomic analysis on day 5, 15, and 30 during Baijiu production. The nine dominant genera are Aspergillus, Bacillus, Byssochlamys, Desmospora, Lactobacillus, Pichia, Saccharomyces, Schizosaccharomyces, and Zygosaccharomyces. Data are expressed as mean ± SD from biological triplicates. Error bars indicate standard deviation from three independent sampling points.
Microorganisms 07 00606 g003
Figure 4. The differentially expressed genes of core yeast species (P. kudriavzevii, S. cerevisiae, Schi. Pombe, and Z. bailii) and Lactobacillus spp. related to acetic acid conversion on day 5, 15 and 30 during Baijiu production. According to the Kyoto Encyclopedia of Genes and Genomes (KEGG) database, these genes include alcohol dehydrogenase 5 (ADH5, K00121), acetyl-CoA hydrolase (ACH1, K01067), acetyl coenzyme A synthetase 2 (ACS2, K01895), hexose transporter (HXT1, K08139), V-type H+-transporting ATPase subunit F (VMA7, K02151), alcohol acetyltransferase 1 (ATF1), acetyl-CoA C-acetyltransferase 1 (ACCAT1, K00626), hydroxymethylglutaryl-CoA synthase 1 (HMGCS1, K01641), and hydroxymethylglutaryl-CoA reductase 1 (NADPH) (HMGCR1, K00021) in the core yeast species P. kudriavzevii, S. cerevisiae, Schi. Pombe, and Z. bailii. The genes related to different species are showed in different colors: P. kudriavzevii (brown), S. cerevisiae (yellow), Schi. pombe (orange) and Z. bailli (blue). Data are expressed as mean ± SD from biological triplicates. Error bars indicate standard deviation from three independent sampling points and asterisks represent significant differences between the two groups (*** p < 0.001, Mann–Whitney U test).
Microorganisms 07 00606 g004
Figure 5. The microbial biomass, the metabolites concentration, and the gene expression of Schizosaccharomyces pombe C-11 in the +AA 10 g/L and none group samples in the mono-culture fermentation process. (a) The microbial biomass; (b,c) the concentration of acetic acid and mevalonic acid in the +AA 10 g/L and none group samples during the fermentation process; (d) the relative expression ratios of genes ADH5, ACH1, ACS2, HXT1, ACCAT1, HMGCS1, and HMGCR1 in +AA 10 g/L group as compared to the none group at 12 h and 24 h. In the +AA 10 g/L group samples, the mono-culture process using Schi. pombe C-11 under initial concentration of 10 g/L acetic acid; and in the none group samples, the mono-culture process using Schi. pombe C-11 without initial concentration of 10 g/L acetic acid. The length in each square frame represents relative gene expression ratio based on real-time quantitative PCR at 12 h and 24 h, respectively. Data are expressed as mean ± SD from biological triplicates. Error bars indicate standard deviation from three independent experiments and asterisks represent significant differences between the two groups (* p < 0.05, ** p < 0.01, *** p < 0.001, Mann–Whitney U test).
Microorganisms 07 00606 g005
Table 1. Primers used for microbial population analysis in four yeast strains.
Primer NameSequence (5′-3′)Primer Size (bp)Reference
PkFGTTTGAGCGTCGTTTCCATC20[31]
PkRAGCTCCGACGCTCTTTACAC20
ScFGTGCGCGGTCTTGCTAGGCT20this work
ScRTACCTCTGGGCCCCGATTGC20
SpFAGTGAAGCGGGAAAAGCTCA20this work
SpRATCGACCAAAGACGGGGTTC20
ZbFCATGGTGTTTTGCGCC16[8]
ZbRCGTCCGCCACGAAGTGGTAGA21
Table 2. Primers used for gene expression analysis in Schi. pombe.
Primer NameSequence (5′-3′)Primer Size (bp)Reference
ACH1SpFTGCATACACCATCGGTTCGT20this work
ACH1SpRGAGCACGTTCGGTAGGAGAC20
ACCAT1SpFGCTTCTCTTCCTGCCACCAA20this work
ACCAT1SpRTGGCCAAGATTGGCTGAGAC20
ACS2SpFAGAGTCTGTTGCAGACCGTG20this work
ACS2SpRCATACTGGCGGTAGGCTCAG20
ADH5SpFAGTTGGATCCATGGGTGCTT20this work
ADH5SpRTTCCGGTTTCGCTTCAGCAT20
HMGCS1SpFGTGGCGTGAACGCTCTTTTT20this work
HMGCS1SpRGGGGCATTAGGACCAACCAA20
HMGCR1SpFAGAGGTCGGCAATTGGACTG20this work
HMGCR1SpRAGTGCGAGCGATCAACTGAA20
HXT1SpFGCCGGTACTGTGAAAAGGGA20this work
HXT1SpRTCAGTTTGGATTGATGCGCTG21
UBC6SpFTTGGCTGTTGCCATCCTTTG20this work
UBC6SpRGGAAACGTCCGCTTGGAGTA20

