Abstract
This study explores the critical role of the flow deflector in suppressing boundary layer separation and enhancing aerodynamic efficiency through systematic geometric parameterization and computational analysis. By defining eight key design variables, this research identifies optimal configurations that significantly delay flow separation at high angles of attack. Computational Fluid Dynamics (CFD) simulations reveal that optimized deflector geometries enhance suction peaks near the airfoil leading edge, redirect separated flow toward the upper surface, and inject momentum into the boundary layer to generate a more positive lift coefficient. The numerical results demonstrate that the optimized design achieves a 58.4% increase in lift coefficient and an 83.3% improvement in the lift–drag ratio by effectively mitigating large-scale vortical structures inherent in baseline configurations. Sensitivity analyses further highlight threshold-dependent “sudden-jump” behaviors in lift coefficients for parameters such as element spacing and deflection angles, while thickness exhibits minimal influence. Additionally, pre-stall optimizations show that strategically aligned deflectors preserve baseline performance with a 0.4% lift gain, whereas misaligned configurations degrade aerodynamic efficiency by up to 9.1%. These findings establish a direct correlation between deflector-induced flow redirection and separation suppression, offering actionable insights for passive flow control in stalled regimes. This research advances fundamental understanding of flow deflector-based separation management and provides practical guidelines for enhancing aerodynamic performance in aerospace applications.
1. Introduction
Controlling stall characteristics [1,2,3,4] represents a critical challenge in modern aeronautical engineering. When the angle of attack (AoA) increases beyond a critical threshold, airflow over the upper wing’s surface experiences velocity reduction due to viscous effects while simultaneously encountering escalating adverse pressure gradients. Flow control technology [5] represents an innovative area of research with far-reaching practical implications across hydraulics, aerodynamics, modern turbine design, and wind power generation. In aerodynamic applications, this methodology [6] exerts profound influences across multiple aspects: aircraft lift-to-drag ratio enhancement, wing maneuverability improvement, noise emission reduction, and structural vibration mitigation. The core mechanism centers on strategically manipulating critical flow parameters—including velocity, pressure, temperature, and density—to actively or passively perturb flow fields, thereby optimizing fluid performance or reducing hydrodynamic resistance. Categorized by control-loop architecture and energy input requirements, L.D. Kral [7] classified flow control methodologies into two fundamental paradigms: active control and passive control.
Active flow control involves the addition of energy into the boundary layer to enhance or recover vehicle aerodynamic performance [8]. The required energy may include mass injection, zero net mass flux, or plasma excitation. Owing to its capability to modify aircraft aerodynamic forces or moments without external moving control surfaces, this technology demonstrates extensive potential applications in lift augmentation and flight control. Contemporary active control approaches primarily encompass fluidic blowing/suction [9,10], synthetic jets [11], and plasma flow control [12,13,14,15,16].
Passive flow control primarily employs fixed geometric configurations to modify targeted local flow environments, achieving control objectives through simplified implementation schemes without external energy input. Inability constraints manifest with limited adaptability to changing conditions, potentially resulting in suboptimal efficiency. Nevertheless, tactically deployed configurations can achieve substantial flow manipulation. Current research [17] identifies six predominant passive control methods: aerodynamic bumps [18,19,20], micro-vortex generators [21], backward-facing steps [22,23,24], boundary layer suction [25,26], secondary flow circulation [27,28,29], and passive cavities. Yan et al. [30] conducted a comprehensive investigation of synergistic effects between blended wing–body fairing and engine nacelle strake on transport aircraft with low-speed characteristics through wind tunnel testing. Experimental results revealed that the wing–body fairing’s curved profile exerts a dominant influence over low-speed performance, effectively suppressing wing-root flow separation while maintaining stability in optimized configurations. Wu et al. [31] performed high-fidelity large-eddy simulations to examine passive drag reduction using miniature cylinders near the shear layer of a D-shaped bluff body wake, achieving 17.7% and 21.4% drag reduction with smooth and grooved-surface cylinders, respectively. Zhang et al. [32] conducted parametric studies on slat gap width effects for a McDonnell Douglas triple-element airfoil, demonstrating a 4.61% reduction when an increasing gap from 2.95% c to 3.98% c. Naeini et al. [33] systematically evaluated the aerodynamic impact of a new 3D needle vortex generator on double delta wings, reporting 10 to 30% increases in maximum lift-to-drag ratios for an AOA of 30°. These investigations achieved remarkable aerodynamic performance at high AOAs while significantly delaying wing stall.
While passive control techniques continue to evolve, a novel flow control approach—the flow deflector [34,35]—has recently garnered significant research attention. Although categorized as a passive device due to its fixed geometry, the flow deflector achieves control effectiveness comparable to active methods without requiring external energy input. Compared to conventional active control techniques (e.g., plasma actuators and synthetic jets), this innovative approach offers distinct advantages: simplified implementation without complex actuation systems, elimination of energy supply requirements, and enhanced operational reliability. These characteristics make the flow deflector particularly suitable for aerospace applications where system simplicity and robustness are paramount.
The flow deflector represents a groundbreaking flow control methodology, the core mechanism of which centers on fluid streams redirection: when an incoming flow approaches at non-zero incidence angles, the deflector induces a forced realignment downstream, causing trajectories to align asymptotically toward the surface with normal orientation [6]. At high AOAs, this device tactically redirects leading-edge flow, generating centripetal acceleration that maintains attached flow over the suction surface while enhancing momentum transfer through freestream boundary mixing [5]. Such momentum reinforcement effectively mitigates adverse pressure gradient effects, thereby delaying flow separation and stall onset.
Although global research efforts have extensively addressed wing stall improvement, most studies have focused exclusively on either active or passive approaches. A critical research lacuna remains regarding parametric investigations, sensitivity analyses, and control mechanism optimization under dynamic stall conditions. The present work addresses this fundamental gap through a comprehensive geometric parameterization framework for flow deflectors, employing the Efficient Global Optimization (EGO) [36,37,38] algorithm to optimize configurations for NACA 0012 and F15 wing section airfoils from NASA and Boeing of USA. Leveraging Pareto-optimal solutions derived from global optimization, we conducted sensitivity analyses for eight critical design parameters, ultimately establishing rigorous design criteria through pre-stall AOA optimization. This research provides groundbreaking insights into deflector-based separation control while delivering practical design principles for aerospace applications requiring enhanced aerodynamic performance.
2. Methodology
2.1. Parametrization of Flow Deflector
The flow deflector investigated in this research consists of an array of thin, parallel vanes mounted near the airfoil leading edge (Figure 1). Its performance is determined by eight key geometric parameters:
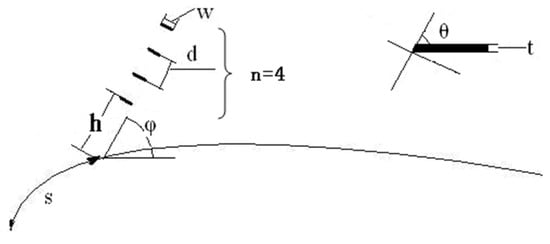
Figure 1.
Configuration of the flow deflector.
- (1)
- Chordwise position : The location of the flow deflector, , is the location along the airfoil upper surface, where is the airfoil geometry function of ; that is .
- (2)
- Vertical offset : The minimum distance between deflector base and airfoil contour.
- (3)
- Inter-vane spacing : The gap between adjacent vane centerlines.
- (4)
- Vane width : The streamwise chordwise length of individual vanes.
- (5)
- Vane thickness : Structural thickness perpendicular to the surface of vanes.
- (6)
- Deflector angle : Inclination relative to the local airfoil tangent.
- (7)
- Vane cant angle : Individual vane pitch relative to the deflector plane.
- (8)
- Vane count : The total number of vanes in the array.
The aerodynamic efficacy of the flow deflector exhibits strong parametric dependence, where strategic optimization of its geometric configuration substantially augments flow control authority—notably, this enhances boundary layer attachment, suppressing stall inception, and improving aerodynamic performance.
2.2. Optimization Method
Contemporary local optimization techniques like Genetic Algorithm (GAs), Particle Swarm Optimization (PSO), and Simulated Annealing (SA) exhibit convergence challenges and computational inefficiencies [39]. To address these limitations, surrogate model-based optimization frameworks [40] have emerged as promising alternatives. Depending on their adaptive capabilities during the optimization process, surrogate models are categorized as either static or dynamic formulations [30]. The Kriging model [41] is ideal for dynamic implementation due to its dual-output capacity, providing both predicted response values and associated uncertainty quantification.
Considering sampled points , function values are , where and denote the i-th sample point and its value, respectively.
where represents known regression models; represents their parameters; and is a stochastic process with mean zero and variance .
Building upon this foundation, the EGO was developed by Jones et al. [34], which incorporates the Expected Improvement (EI) acquisition function to strategically guide a strategy of sample space refinement. Assuming obeys normal distribution; where is the kriging predictor; is the mean squared error (MSE); and is the current minimum, the EI at location is as follows:
where and denote the normal cumulative distribution function (CDF) and probability density function (PDF). This “balanced exploration and exploitation” [42] provides high efficiency and accuracy. Therefore, the EGO algorithm is implemented for flow deflector optimization. The optimization principles applied in this study follow the established EGO methodology described in Figure 2:
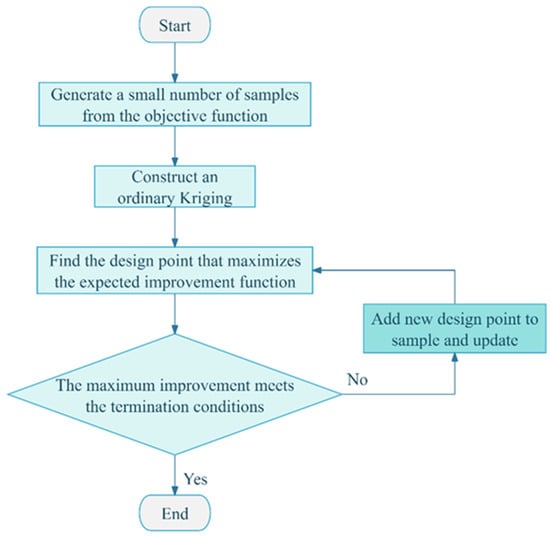
Figure 2.
Flow chart of the optimization principle of the EGO algorithm.
2.3. Numerical Setup and Validation
All CFD simulations were performed using the commercial solver ANSYS Fluent V12.0. The governing equations are the two-dimensional Reynolds-Averaged version of the software (RANS) equations. A pressure-based solver with the SIMPLE algorithm was used for pressure–velocity coupling. Second-order upwind schemes were employed for the spatial discretization of momentum and turbulence equations to ensure numerical accuracy.
The computational domain was constructed using a C-type topology, extending about 20 chord lengths (c) upstream and to the far-field boundaries, and 30 chord lengths downstream to minimize boundary condition effects. A velocity-inlet boundary condition was applied at the far-field, with a specified freestream velocity and low-turbulence conditions (a turbulence intensity of 0.1% and turbulent viscosity ratio of 1). A pressure-outlet condition was set at the downstream boundary. A no-slip wall condition was applied to the airfoil and deflector surfaces.
An unstructured T-Rex grid comprising approximately 62,500 cells, as shown in Figure 3, was generated with high refinement near the airfoil surface and in the wake region. The first cell height was set to ensure a dimensionless wall distance of y+ ≈ 1, which is required for proper resolution of the viscous sublayer.
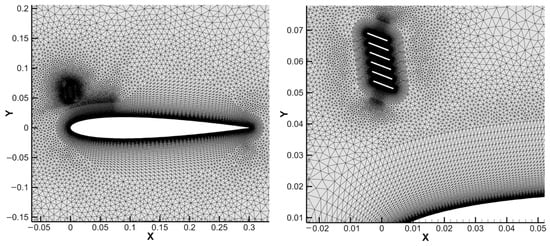
Figure 3.
C−meshes for airfoil with deflector.
3. Numerical Simulations and Discussions
3.1. Optimization Problem Definition
This study maximizes the lift coefficient at a fixed angle of attack (AOA) . The flow velocity and Reynolds number were used for 2D Navier–Stokes simulations. The simulations were performed using the commercial solver ANSYS Fluent. The Spalart–Allmaras (SA) one-equation turbulence model was selected for turbulence closure. This model is widely employed in aerodynamic optimization studies due to its computational efficiency, robustness, and demonstrated accuracy for attached and mildly separated flows, making it well-suited for the large number of simulations required by the EGO framework. With the deflector vane count fixed at , therefore, seven design parameters and seven geometric parameters optimize deflector configuration for maximum . The baseline airfoil is the fixed chord length . These invariant quantities are denoted as . Then, the optimization problem is formally defined:
3.2. Preliminary Optimization Results and Analysis
For validation purposes, the NACA0012 airfoil is selected as the baseline airfoil with a chord length of 300 mm. The objective is to maximize the lift coefficient at a fixed AoA . The freestream velocity yields a Reynolds number of 6.19 × 10⁵. The design parameter bounds are specified in Table 1.

Table 1.
Design parameters.
The optimized flow deflector parameters are presented in Table 2. The design parameter attains its lower bound when the and angles exhibit relatively large values. The vane thickness t reaches its upper bound, as illustrated in Figure 4 and Table 3. Compared to the clean airfoil, the optimized deflector configuration increases the lift coefficient by 58.37%, reduces the drag coefficient by 13.59%, and improves the lift-to-drag ratio by 83.29%, as summarized in Table 3.
Table 2.
Parameters after optimization.
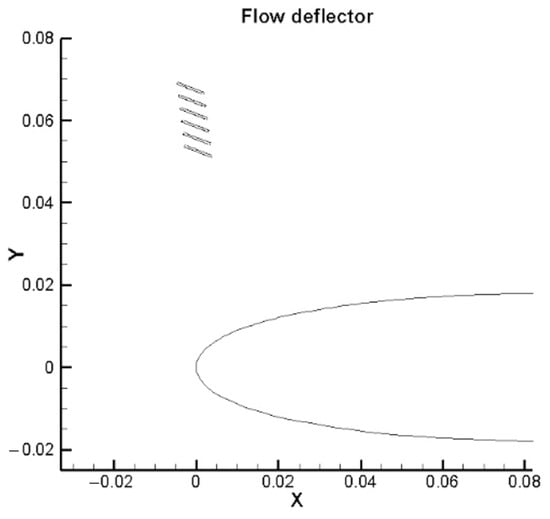
Figure 4.
Deflector after optimization.
Table 3.
Aerodynamic coefficient compared with clean airfoil.
Figure 5 and Figure 6 demonstrate that the optimized flow deflector enhances the suction peak near the airfoil’s leading edge. Figure 5 reveals a dominant vortex structure on the clean airfoil’s upper surface. In contrast, the optimized deflector configuration maintains its attached flow over the upper surface, effectively suppressing vortex formation while retaining only a minimal trailing-edge vortex, indicating controlled separation. The deflector redirects separated flow toward the upper surface, imparting centripetal acceleration to promote flow attachment. Additionally, it introduces high-momentum fluid into the boundary layer, augmenting kinetic energy to counteract adverse pressure gradients.
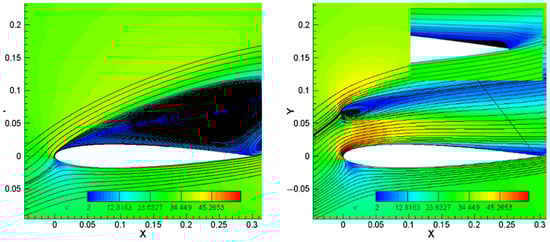
Figure 5.
Streamline comparison (left: clean airfoil; right: airfoil with flow deflector).
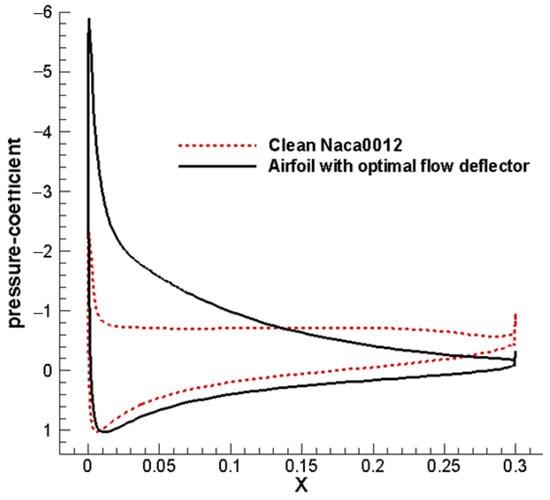
Figure 6.
Pressure distribution comparison.
Figure 7 illustrates the lift coefficient curve for the airfoil with the optimal flow deflector for post-stall conditions. Compared to the baseline airfoil, the stall’s AoA diverges by approximately , with the results exceeding those reported in open studies in the literature.
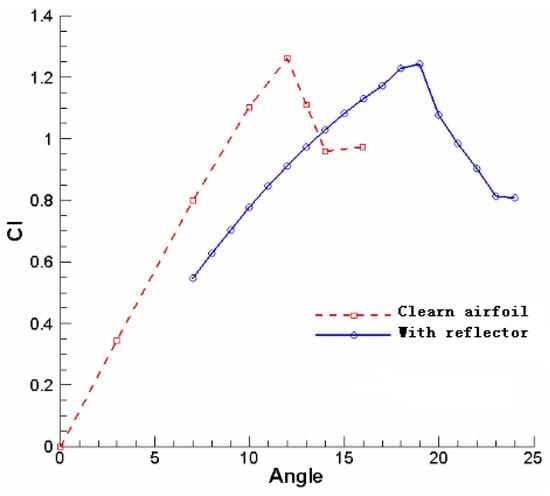
Figure 7.
Lift coefficient comparison.
3.3. Sensitivity Analysis of Design Parameters
A comprehensive sensitivity study was conducted to quantify the influence on aerodynamic performance. Considering computational efficiency, this numerical test focuses on 2D configurations, with the EGO-optimized solution serving as the baseline reference point.
Employing a one-factor-at-a-time methodology, each parameter was systematically varied while maintaining others at their optimal values. Table 4 details the test point distribution for each parameter, with 20 discrete positions evaluated per variable. Figure 8 presents the corresponding variations for the lift coefficient across the parameter ranges.
Table 4.
Parameter distribution for sensitivity analysis.
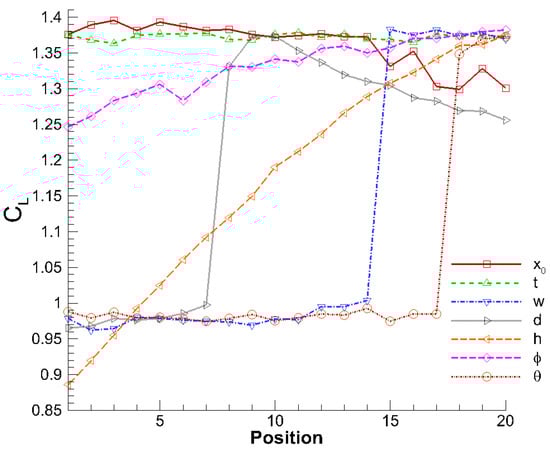
Figure 8.
Lift coefficient sensitivity to parameter variations.
The parameter demonstrated negligible sensitivity to parameter , justifying its exclusion from subsequent optimization phases. Notably, three parameters , and exhibited fundamentally different behavior: they maintained minimal impact on until reaching critical thresholds, beyond which abrupt performance transitions occurred. To elucidate these discontinuous transitions, flow features near the flow deflector, w, were examined for parameter values bracketing these critical points, as depicted in Figure 9.
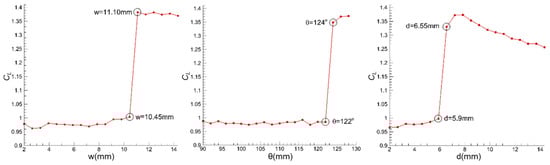
Figure 9.
Critical values near critical transition for (left), (middle), and (right).
The discontinuous flow behaviors associated with parameters , and were characterized by analyzing pressure contours, suction peaks, velocity contours, velocity fields, and streamline patterns. Parameter was selected for focused investigation. Table 5 enumerates 12 parameter values of near the critical transition zone, while Figure 10 documents the corresponding lift and pressure coefficient responses.
Table 5.
Parameter values near critical transition for (mm).
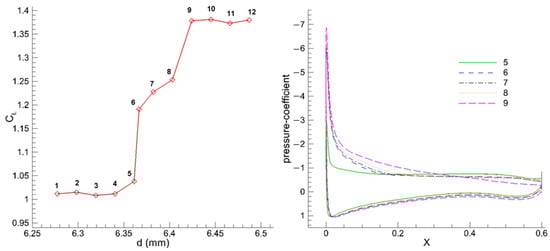
Figure 10.
Lift and pressure coefficient responses near critical transition.
The flow during the discontinuous transition for parameter is visualized in Figure 11 through velocity contour streamlines at incrementally varied values, revealing gradual changes in flow field modifications despite minor parametric adjustments.
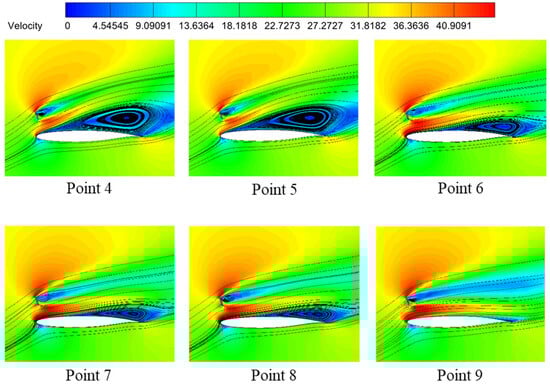
Figure 11.
Streamline evolution on velocity contours across transition zone.
3.4. Optimization with New Design Parameter n
3.4.1. Description of the Problem
Introducing n as an additional design variable yields the following optimization formulation:
Given that V∞ = 30 m/s, b = 600 mm, and
t = 0.2 mm
The bounds of the design parameter are specified in Table 6.
Table 6.
Design parameter bounds.
3.4.2. Results and Analysis
Table 7 presents the optimal parameter set for the 2D flow deflector alongside results from the fixed n = 6 case. Notably, the optimization yielded n = 8. The optimization of problem (2) was executed, with the convergence history depicted in Figure 12.
Table 7.
Optimization results.
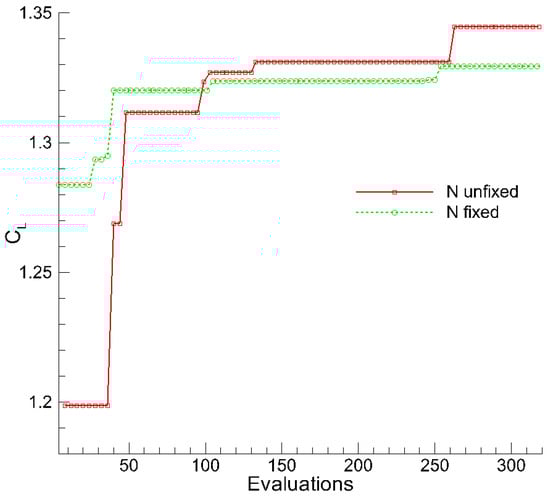
Figure 12.
Convergence history of .
The aerodynamic performance of both the clean airfoil and the airfoil equipped with optimal deflectors was evaluated. Pressure coefficient and lift curve comparisons relative to the clean airfoil are presented in Figure 13 and Figure 14, respectively. Corresponding numerical results are compared in Table 8. All aerodynamic coefficients listed in Table 8 exclude contributions from the flow deflector itself. Compared to the clean airfoil, the optimized deflector configuration exhibits the following: the lift coefficient of the airfoil with the optimal flow deflector increased by 35.28%; the drag coefficient decreased by 15.65%; and the lift–drag ratio increased by 60.39%. These results marginally surpassed the fixed n = 6 configuration. Flow field characteristics are further illustrated through streamline comparisons in Figure 15.
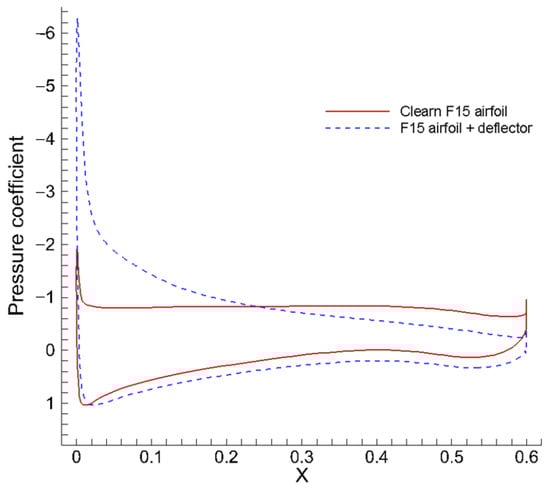
Figure 13.
Pressure coefficient comparison.
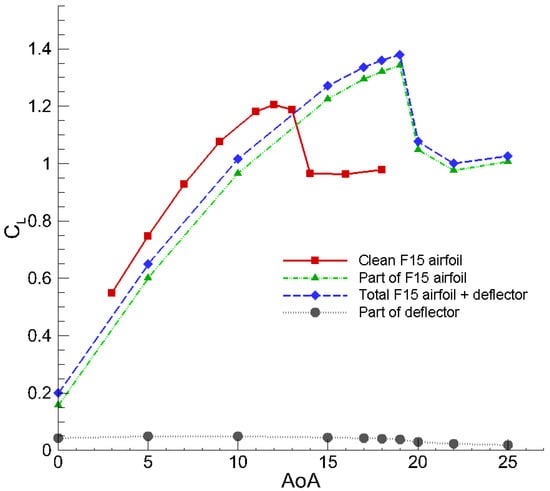
Figure 14.
Lift coefficient versus AoA.
Table 8.
Aerodynamic coefficients compared with clean airfoil.
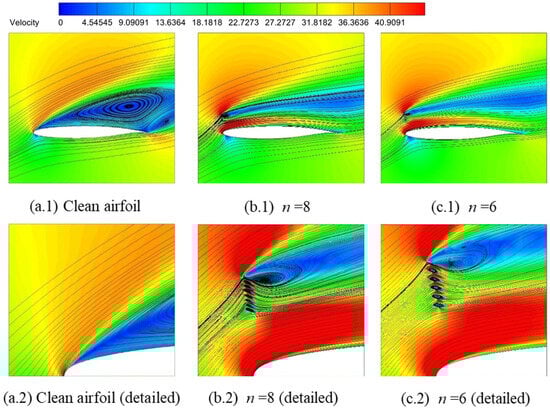
Figure 15.
Comparison of streamlines.
3.5. Pre-Stall AoA Optimization
To evaluate the robustness and general applicability of the deflector design principles, pre-stall optimization was validated on a different airfoil, F15, to demonstrate that the performance benefits were not unique to the NACA 0012 profile. Previous optimizations were conducted at , corresponding to deep stall conditions where flow deflectors primarily suppress separation. To evaluate the performance in pre-stall flight regimes, an optimization study was performed at sub-stall AoA.
3.5.1. Description of the Problem
The flow deflector provides minimal benefit at pre-stall angles (AoA < stall angle). Thus, this optimization aims to prevent performance degradation relative to the clean airfoil. The optimization framework is defined as follows:
Given: V∞ = 30 m/s, b = 600 mm, n = 6,
t = 0.2 mm.
Design parameter bounds, , are provided in Table 9.
Table 9.
Design parameters bounds.
3.5.2. Results and Analysis
The optimization of problem (3) was performed using the EGO algorithm, with the convergence history of shown in Figure 16. Table 10 details the optimal parameter set. Notably, four parameters reached their constraint bounds. The resulting optimal flow deflector configuration is displayed in Figure 17.
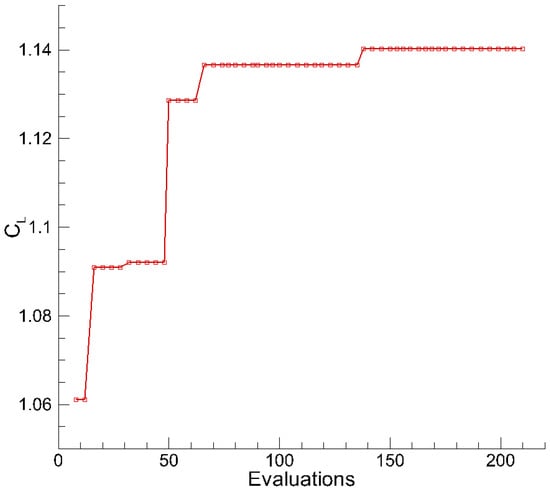
Figure 16.
Convergence history of .
Table 10.
Optimal parameter values.
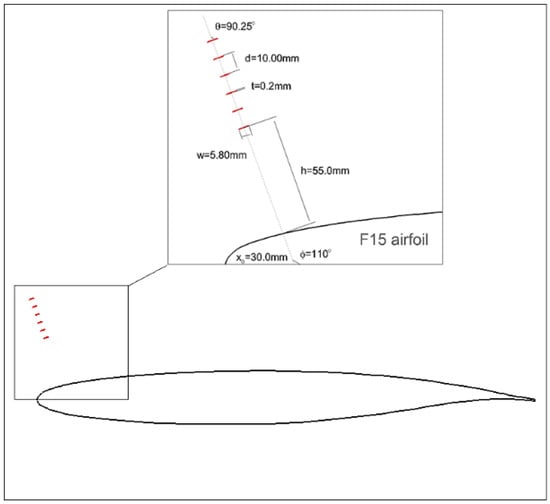
Figure 17.
Optimized deflector configuration for the F15 airfoil.
It can be noted that the optimal flow deflector configuration features = . For the sake of comparison, a reference deflector was constructed by modifying this parameter to = , as shown in Figure 18.
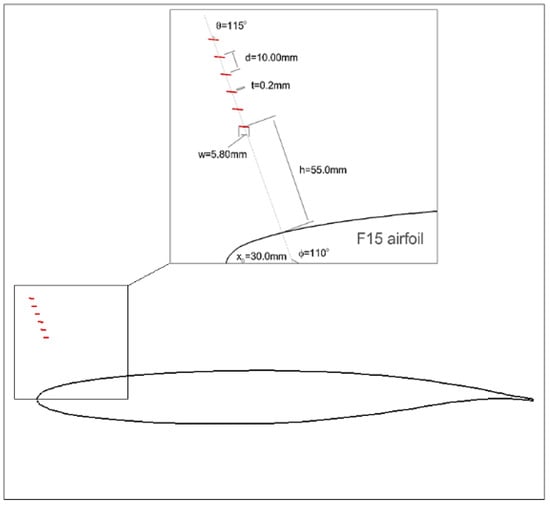
Figure 18.
Referenced configuration for the F15 airfoil.
The aerodynamic performances of a clean airfoil, airfoil with an optimal deflector, and airfoil with a reference deflector are calculated and compared in Table 11. All the aerodynamic coefficients listed in Table 11 were computed without considering the contribution of the flow deflector itself. Compared with the original clean airfoil, the lift coefficient of the airfoil with optimized flow deflector increased by 0.40%; the drag coefficient decreased by 1.53%; and the lift–drag ratio increased by 1.96%. The optimal flow deflector for pre-stall conditions was designed to achieve the goal of not reducing the performance of the clean airfoil. At the same time, the reference configuration’s lift coefficient decreased by 9.11%; the drag coefficient increased by 39.20%; and the lift–drag ratio decreased by 34.71%, with behaviors worse than the clean airfoil.
Table 11.
Comparison of aerodynamic coefficients of deflectors.
Figure 19, Figure 20 and Figure 21 present the pressure contour, velocity field, and streamline comparisons, respectively. It can be seen that the optimal flow deflector aligns with the local streamline, minimally perturbing the flow field. In contrast, the reference deflector configuration significantly disrupts flow patterns, reducing the lift coefficient as shown in Table 11 and Figure 22 and Figure 23, which further compare the flow distributions and lift curves.
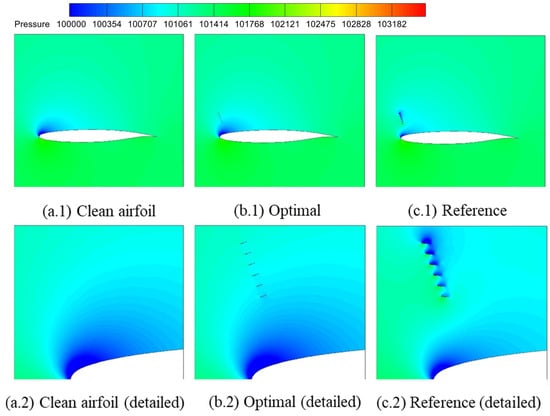
Figure 19.
Comparison of pressure contours.
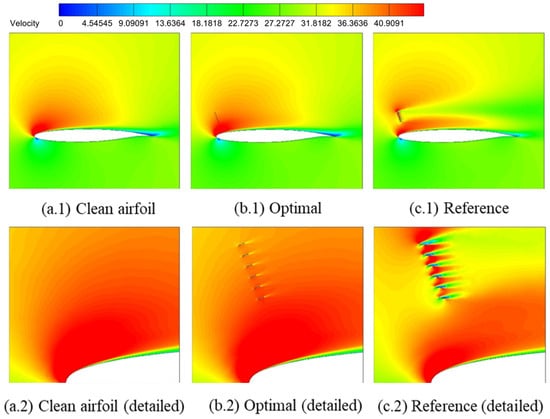
Figure 20.
Comparison of velocity contours.
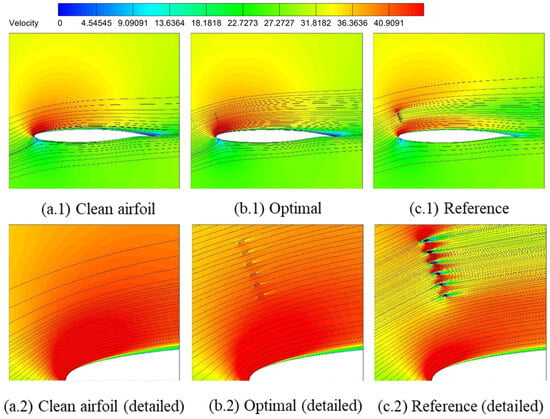
Figure 21.
Comparison of streamlines.
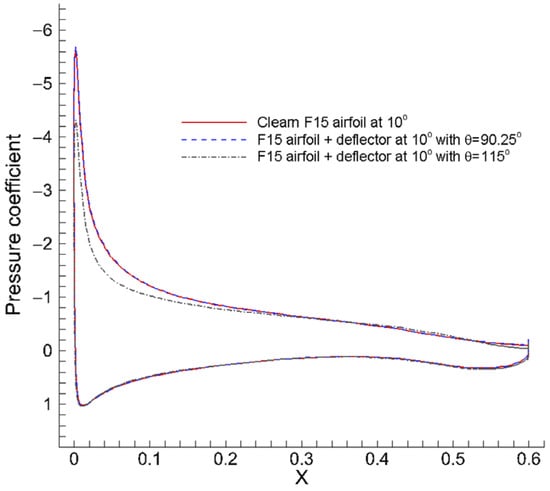
Figure 22.
Pressure coefficient comparison for the clean F15 airfoil, the airfoil with the optimal pre-stall deflector, and the airfoil with the reference deflector.
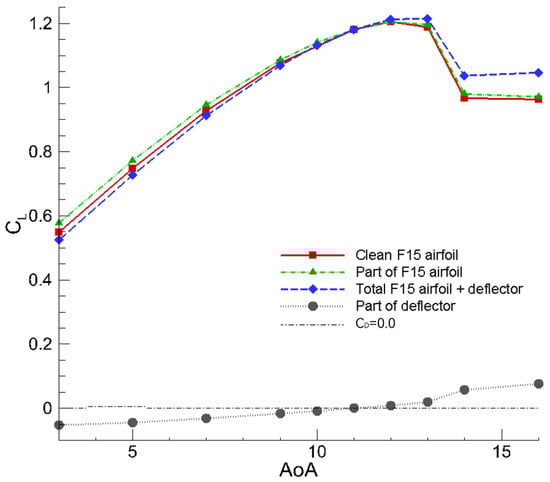
Figure 23.
AoA Comparison gray dashed line the clean F15 airfoil, the airfoil with the optimal pre-stall deflector, and the airfoil with the reference deflector.
4. Conclusions
This study effectively demonstrated the significant role of flow deflectors in enhancing aerodynamic performance and delaying flow separation at high angles of attack through systematic optimization of their geometric parameters. The research successfully identified optimal flow deflector configurations that resulted in a 58.4% increase in lift coefficient and an 83.3% improvement in lift-drag ratio for a NACA 0012 airfoil by effectively mitigating large-scale vortical structures. Sensitivity analyses revealed “sudden-jump” behaviors in lift coefficients for parameters like inter-vane spacing and deflector angle, while vane thickness showed minimal influence. Furthermore, pre-stall optimizations indicated that strategically aligned deflectors preserved baseline performance with a slight lift gain, whereas misaligned configurations degraded aerodynamic efficiency. These findings confirm a direct correlation between flow deflector-induced flow redirection and separation suppression. The optimizations reveal distinct optimal geometries for post-stall (on the NACA 0012) and pre-stall conditions (validated on the F15), providing valuable insights and practical guidelines for passive flow control in aerospace applications.
Author Contributions
Conceptualization, S.X. and J.T.; Data curation, S.X. and S.W.; Formal analysis, S.X. and S.W.; Funding acquisition, S.X.; Investigation, S.X., S.W. and S.Y.; Methodology, S.X.; Project administration, S.X.; Writing—original draft, S.X. and S.W.; Writing—review & editing, H.C., J.T., W.L. and S.Y. All authors have read and agreed to the published version of the manuscript.
Funding
This research was funded by the National Natural Science Foundation of China (Grant No. 12102185 and 12172165).
Data Availability Statement
The data that support the findings of this study are available in the article. The other data that support the findings of this study are available from the corresponding author upon reasonable request.
Conflicts of Interest
The authors declare no conflicts of interest.
References
- Zhang, D.P.; Xie, Y.F.; Zhang, Y.I.; Liang, Z.J.; Tian, Y. Experimental advances in airfoil dynamic stall and transition phenomena. Fluid Dyn. Mater. Process. 2025, 21, 697–739. [Google Scholar] [CrossRef]
- Hrynuk, J.T.; Bohl, D.G. The effects of leading-edge tubercles on dynamic stall. J. Fluid Mech. 2020, 893, A5. [Google Scholar] [CrossRef]
- Gong, J.Y.; Peng, W.Q.; Luo, Z.B.; Deng, X.; Zhou, Y.; Zhang, J.Y.; Zhao, Z.J. Comparison of aerodynamic characteristics of wing dynamic stall under three typical jets control. Chin. J. Aeronaut. 2025, 38, 103284. [Google Scholar] [CrossRef]
- Gardner, A.D.; Jones, A.R.; Mulleners, K.; Naughton, J.W.; Smith, M.J. Review of rotating wing dynamic stall: Experiments and flow control. Prog. Aerosp. Sci. 2023, 137, 100887. [Google Scholar] [CrossRef]
- Ren, J.H.; Wu, Z.L.; Tan, H.J.; Li, D.P.; Zhou, Y. Experimental investigation of the aerodynamics of a UAV inlet with double 90° bends. Aerosp. Sci. Technol. 2024, 154, 109502. [Google Scholar] [CrossRef]
- Zhou, L.; Ming, X.; Bai, Y.L. Wing stall control by flow deflector. Acta Aerodyn. Sin. 2011, 29, 16–21. (In Chinese) [Google Scholar]
- Donovan, J.; Kral, L.; Cary, A. Active flow control applied to an airfoil. In Proceedings of the 36th AIAA Aerospace Sciences Meeting and Exhibit, Reno, NV, USA, 12–15 January 1998; American Institute of Aeronautics and Astronautics: Reston, Virigina, 1998. [Google Scholar]
- Li, G.Q.; Yi, S.H.; Li, B.B.; Zhang, X. Numerical investigation on the evolution process of different vortex structures and distributed blowing control for dynamic stall suppression of rotor airfoils. Actuators 2024, 13, 30. [Google Scholar] [CrossRef]
- Yang, P.; Chen, S.; Chen, S.; Liu, G. Numerical investigation of boundary layer separation control on the low-pressure turbine blade by oscillatory blowing. Aerosp. Sci. Technol. 2024, 146, 108961. [Google Scholar] [CrossRef]
- Pan, J.X.; Wang, W.B.; Qin, C.; Wang, X.N.; Sun, Q.X.; Zhang, X. Experimental investigation on the combined blowing control of a hybrid wing body aircraft. Actuators 2023, 12, 237. [Google Scholar] [CrossRef]
- Zaccara, M.; Braganca, P.; Cuvier, C.; Paolillo, G.; Astarita, T.; Cardone, G.; Foucaut, J.; Greco, C.S. Far field behaviour of wingtip vortices under synthetic jet-based control. Aerosp. Sci. Technol. 2023, 143, 108755. [Google Scholar] [CrossRef]
- Karimi, M.S.; Oboodi, M.J. Investigation and recent developments in aerodynamic heating and drag reduction for hypersonic flows. Heat Mass Transf. 2019, 55, 547–569. [Google Scholar] [CrossRef]
- Li, G.Q.; Zhang, W.G.; Jiang, Y.B.; Yang, P.Y. Experimental investigation of dynamic stall flow control for wind turbine airfoils using a plasma actuator. Energy 2019, 185, 90–101. [Google Scholar] [CrossRef]
- Narayanaswamy, V.; Raja, L.L.; Clemens, N.T. Control of unsteadiness of a shock wave/turbulent boundary layer interaction by using a pulsed-plasma-jet actuator. Phys. Fluids 2012, 24, 76101. [Google Scholar] [CrossRef]
- Tang, M.X.; Wu, Y.; Zong, H.H.; Luo, Y.H.; Yang, H.S.; Guo, S.G. Experimental investigation of supersonic boundary-layer tripping with a spanwise pulsed spark discharge array. J. Fluid Mech. 2022, 931, A16. [Google Scholar] [CrossRef]
- Wang, H.Y.; Li, J.; Jin, D.; Tang, M.G.; Wu, Y.; Xiao, L.H. High-frequency counter-flow plasma synthetic jet actuator and its application in suppression of supersonic flow separation. Acta Astronaut. 2018, 142, 45–56. [Google Scholar] [CrossRef]
- Tian, S.S.; Jin, L.; Du, Z.B.; Zhong, X.Y.; Huang, W.; Liu, Y.Y. Research progress of shock wave/boundary layer interaction controls induced by bump. Acta Aeronaut. Et Astronaut. Sin. 2023, 44, 028411. (In Chinese) [Google Scholar]
- Schülein, E.; Schnepf, C.; Weiss, S. Concave bump for impinging-shock control in supersonic flows. AIAA J. 2022, 60, 2749–2766. [Google Scholar] [CrossRef]
- Zhang, Y.; Tan, H.J.; Sun, S.; Rao, C.Y. Control of cowl shock/boundary-Layer interaction in hypersonic inlets by bump. AIAA J. 2015, 53, 3492–3496. [Google Scholar] [CrossRef]
- Zhang, Y.; Tan, H.J.; Tian, F.C.; Zhuang, Y. Control of incident shock/boundary-layer interaction by a two-dimensional bump. AIAA J. 2014, 52, 767–776. [Google Scholar] [CrossRef]
- Lin, J.C. Review of research on low-profile vortex generators to control boundary-layer separation. Prog. Aerosp. Sci. 2002, 38, 389–420. [Google Scholar] [CrossRef]
- Li, W.P.; Liu, H. Large-eddy simulation of shock-wave/boundary-layer interaction control using a backward facing step. Aerosp. Sci. Technol. 2019, 84, 1011–1019. [Google Scholar] [CrossRef]
- Zhai, J.; Zhang, C.A.; Wang, F.M.; Zhang, W.W. Control of shock-wave/boundary-layer interaction using a backward-facing step. Aerosp. Sci. Technol. 2022, 126, 107665. [Google Scholar] [CrossRef]
- Montazer, E.; Yarmand, H.; Salami, E.; Muhamad, M.R.; Kazi, S.N.; Badarudin, A. A brief review study of flow phenomena over a backward-facing step and its optimization. Renew. Sustain. Energy Rev. 2018, 82, 994–1005. [Google Scholar] [CrossRef]
- Reza Maadi, S.; Sepahi-Younsi, J. Effects of bleed type on the performance of a supersonic intake. Exp. Therm. Fluid Sci. 2022, 132, 110568. [Google Scholar] [CrossRef]
- Zhang, B.H.; Zhao, Y.X.; Liu, J. Effects of bleed hole size on supersonic boundary layer bleed mass flow rate. J. Zhejiang Univ. Sci. A (Appl. Phys. Eng.) 2020, 21, 652–662. [Google Scholar] [CrossRef]
- Du, Z.B.; Shen, C.B.; Shen, Y.; Huang, W.; Yan, L. Design exploration on the shock wave/turbulence boundary layer control induced by the secondary recirculation jet. Acta Astronaut. 2021, 181, 468–481. [Google Scholar] [CrossRef]
- Kane, A.A.; Peetala, R.K.; Kulkarni, V. Investigation of pressure feedback technique to control ramp based SWBLI. Acta Astronaut. 2022, 201, 482–495. [Google Scholar] [CrossRef]
- Yan, L.; Wu, H.; Huang, W.; Li, S.B.; Liu, J. Shock wave/turbulence boundary layer interaction control with the secondary recirculation jet in a supersonic flow. Acta Astronaut. 2020, 173, 131–138. [Google Scholar] [CrossRef]
- Yan, W.; Wang, Q.; Li, J.Y.; Xu, H.W.; Zhao, K.L.; Bai, F.; Zhang, M.H.; Jiao, R.S.; Wang, F.; Zeng, W. Wind tunnel test research for influence of passive flow control technology onlow speed characteristics of civil transport aircraft. Adv. Aeronaut. Sci. Eng. 2025, 16, 93–100. (In Chinese) [Google Scholar]
- Wu, W.C.; Han, X.S.; Mao, J.K. Large eddy simulation of flow around a D-shaped bluff body for drag reduction based on passive control. J. Propuls. Technol. 2020, 41, 1692–1700. (In Chinese) [Google Scholar]
- Zhang, Z.H.; Li, D.; Yang, Y. Passive flow control of multi element airfoils using slat mini-trailing edge device. Acta Aeronaut. Et Astronaut. Sin. 2017, 38, 120650. (In Chinese) [Google Scholar]
- Naeini, H.K.; Nili-Ahmadabadi, M.; Park, Y.S.; Kim, K.C. Effect of nature-inspired needle-shaped vortex generators on the aerodynamic features of a double-delta wing. Int. J. Mech. Sci. 2021, 202–203, 106502. [Google Scholar] [CrossRef]
- Bai, Y.L.; Li, P. Researches of a finite-span wing stall control. Acta Aerodyn. Sin. 2013, 31, 10–14. (In Chinese) [Google Scholar]
- Bai, Y.L.; Ma, X.; Ming, X. Lift enhancement of the airfoil and trip flow control for wind turbine. Appl. Math. Mech. 2011, 32, 825–836. (In Chinese) [Google Scholar] [CrossRef]
- Xu, S.G.; Chen, H.Q. Nash game based efficient global optimization for large-scale design problems. J. Glob. Optim. 2018, 71, 361–381. [Google Scholar] [CrossRef]
- Xu, S.G.; Chen, H.Q.; Zhang, J.L. A study of Nash-EGO algorithm for aerodynamic shape design optimizations. Struct. Multidiscip. Optim. 2019, 59, 1241–1254. [Google Scholar] [CrossRef]
- Xu, S.G.; Tan, J.F.; Zhang, J.L.; Chen, H.Q.; Gao, Y.S. Adaptive nested Monte Carlo approach for multi-objective efficient global optimization. J. Glob. Optim. 2025, 91, 647–676. [Google Scholar] [CrossRef]
- Oyama, A.; Liou, M.; Obayashi, S. Transonic axial-flow blade optimization: Evolutionary algorithms/three-dimensional navier-stokes solver. J. Propuls. Power 2004, 20, 612–619. [Google Scholar] [CrossRef]
- Chen, S.K.; Xiong, Y.; Chen, W. Multi response and multi-stage meta modeling approach for design optimization. AIAA J. 2009, 47, 206–218. [Google Scholar] [CrossRef]
- Yao, W.X. A survey of surrogate models used in MDO. Chin. J. Comput. Mech. 2005, 22, 608–612. [Google Scholar]
- Donald, R. Jones. A Taxonomy of global optimization methods based on response surfaces. J. Glob. Optim. 2001, 21, 345–383. [Google Scholar]


Disclaimer/Publisher’s Note: The statements, opinions and data contained in all publications are solely those of the individual author(s) and contributor(s) and not of MDPI and/or the editor(s). MDPI and/or the editor(s) disclaim responsibility for any injury to people or property resulting from any ideas, methods, instructions or products referred to in the content. |
© 2025 by the authors. Licensee MDPI, Basel, Switzerland. This article is an open access article distributed under the terms and conditions of the Creative Commons Attribution (CC BY) license (https://creativecommons.org/licenses/by/4.0/).