Abstract
Flapping-wing micro-air vehicles (FWMAVs) exhibit unique aerodynamic characteristics that differ fundamentally from other aircraft, yet little is known about their dynamic stability derivatives. This study aims to identify pitch-rate stability derivatives of an in-house prototype, CKopter-1, to advance the modeling and control of bio-inspired flight. Experiments were conducted using a robotic-arm fan-array system that enabled prescribed pitching motions under controlled inflow. Aerodynamic forces and moments were measured with a six-axis load cell, while vehicle kinematics were captured using motion tracking and synchronized during post-processing. Tests consisted of quasi-static cycles and dynamic cycles at pitch rates of 35°/s, 58.8°/s, and 68.4°/s. The results revealed static instability below an angle of attack of 33°, a trim condition near 58.5°, and positive stability up to 72.5°. Dynamic cases showed clear pitch-rate effects in the longitudinal components, from which the derivatives were extracted. A comparison with previous studies confirmed comparable magnitudes, with systematic differences attributable to wing dihedral and tail length. This study demonstrates that the fan-array robotic-arm method enables stability derivative identification even beyond feasible flight regimes, providing valuable parameters for future flight dynamics modeling and control of FWMAVs.
1. Introduction
Flapping-wing micro-air vehicles (FWMAVs) represent a class of bio-inspired flying machines that combine lightweight construction with unsteady aerodynamic mechanisms to generate lift and thrust at very small scales. Unlike fixed-wing or rotary-wing vehicles, which rely on well-established aerodynamic theories, FWMAVs operate in low Reynolds number regimes where unsteady effects such as clap-and-fling, leading-edge vortices, and wake capture dominate [1,2,3,4]. These phenomena offer potential advantages in maneuverability and flight efficiency but also pose significant challenges for modeling, stability analysis, and control. Considerable efforts have led to successful FWMAV prototypes, and it is now possible to design vehicles that satisfy lift requirements using models such as unsteady blade-element theory [5]. However, it is still not possible to design FWMAVs based on stability and maneuverability requirements, primarily due to the limited understanding and characterization of their flight dynamics [6,7].
A deeper understanding of FWMAV flight dynamics is essential for both fundamental research and practical applications. While substantial progress has been made in characterizing aerodynamic performance, relatively little attention has been devoted to dynamic characterization through stability-derivative analysis. These derivatives, which quantify the damping contributions of angular rates to aerodynamic forces and moments, are central to developing accurate dynamic models and flight controllers, thereby enabling future designs to meet specified stability and maneuverability requirements.
Small-scale flapping-wing micro-air vehicles (FWMAVs) are mostly inspired by insect flight. Existing studies on insect flight dynamics have primarily relied on computational fluid dynamics (CFD). Prof. Mao Sun of Beihang University is recognized as one of the pioneers in this field, having comprehensively investigated the dynamics and stability of various insects since 2005 [8,9,10].
Direct measurement of dynamic stability derivatives on freely flying insects is nearly impossible. An experimental effort was nevertheless made on tethered locusts, where the wings were fixed in a mid-stroke posture without flapping, and the body was oscillated using rotary balance techniques [11,12]. This approach is essentially equivalent to the classical forced-oscillation method, in which a wind-tunnel model is driven sinusoidally about a given axis while aerodynamic forces and moments are measured [13]. The forced-oscillation technique has proven highly effective for extracting stability derivatives of fixed-wing aircraft and rotorcraft under rigid-body assumptions but is inherently restricted to a relatively narrow angular range around the reference condition.
While such studies have provided fundamental insights, a gap remains because FWMAVs are typically at least an order of magnitude larger than real insects. Consequently, their aerodynamic characteristics and dynamic behavior cannot be directly inferred from insect studies. With the advent of insect-inspired FWMAVs, it has now become feasible to address this gap by conducting flight dynamics investigations on the vehicles themselves.
As of now, flight dynamics studies on FWMAVs have relied largely on free-flight experiments, which are constrained to the statically stable regime and often suffer from limited repeatability due to environmental disturbances. Among the available literature, TU Delft’s MAVLab stands out as one of the few groups that has systematically investigated the dynamic characterization of FWMAVs through flight experiments on the DelFly family (e.g., DelFly II, DelFly Nimble) [14,15,16,17]. Their longitudinal models were established via system identification on free-flight data, thereby directly correlating mathematical models with prototype performance. However, this approach inherently restricts characterization to stable regimes near trimmed flight. In parallel, simulation-based approaches have been pursued, including computational fluid dynamics (CFD) analyses [18,19] and multibody dynamic models combined with a semi-empirical quasi-steady blade element theory [20]. While these frameworks provide valuable insights into FWMAV stability and control, their predictive capability remains limited in the absence of validation against actual flight data.
In related contexts, robotic arms and programmable motion rigs have been employed to study unsteady aerodynamics and dynamic stability. Examples include hybrid unmanned aerial vehicles (UAVs) and delta-wing models tested in wind tunnels using robotic manipulators [21,22]. These works demonstrate the potential of robotic-arm-based methods for prescribing precise motion profiles and capturing aerodynamic responses. Extending this methodology to FWMAVs opens the possibility of probing wide-angle-of-attack regimes, nonlinear dynamic effects, and unstable conditions that cannot be sustained in free flight. Thus, robotic-arm testing can be viewed as a complement to classical forced-oscillation methods: while the latter remains the gold standard for conventional aircraft, the former extends stability-derivative identification into the FWMAV domain.
The present study addresses this gap by identifying the pitch-rate stability derivatives of an in-house prototype, CKopter-1, using a fan-array robotic-arm experimental platform. Quasi-static and dynamic pitching motions were prescribed, and the corresponding aerodynamic forces and moments were measured and analyzed to extract stability derivatives over a broad range of angles of attack, thereby complementing flight-test-based approaches. The results are compared with available data from DelFly II to assess credibility and highlight geometric influences. This is the first study to experimentally extract pitch-rate stability derivatives of a flapping-wing MAV using a robotic arm. It demonstrates the feasibility of extending derivative identification beyond the stable flight regime, offering new insights for the modeling and control of FWMAVs.
The remainder of this paper is structured as follows. Section 2 introduces the FWMAV prototype, and Section 3 describes the experimental setup and design. Section 4 outlines the data processing procedure, followed by Section 5 on validation. Section 6 presents the results, and Section 7 concludes with the main findings.
2. The Flapping Wing Micro-Air Vehicle
The flapping-wing micro-air vehicle (FWMAV) used in this study is CKopter-1 (Figure 1), an in-house prototype developed at the Micro-Aerial Robotics and Satellite Systems Laboratory (MARSlab), National Cheng Kung University. The vehicle is an inherently stable platform featuring two pairs of wings and conventional horizontal and vertical tails for stabilization and control, with pitch and yaw maneuvering achieved through the elevator and rudder, respectively. Lift and thrust are generated by a modified clap-and-fling mechanism, executed both dorsally and laterally during each flapping cycle. The wings have a flap angle of 110° and a dihedral angle of 30°. CKopter-1 has a total mass of 17.25 gf and employs a lightweight wing structure composed of carbon rods and biaxially oriented polyethylene terephthalate (BoPET) membrane. The wings, with a span of 100 mm and a mean aerodynamic chord (MAC) of 89.48 mm, are driven by a double crank-rocker mechanism actuated by a compact brushless motor. Remote-controlled flight tests (Figure 2) demonstrated trimmed flight at high angle of attack (AoA), with forward speeds between 1 and 2 m/s depending on the slight variations in the center of gravity (CG) position. A detailed description of the design and performance characteristics can be found in [23].
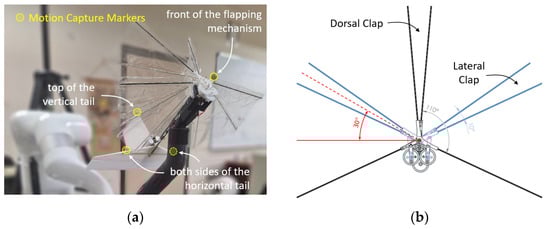
Figure 1.
The CKopter-1 FWMAV: (a) the test model with motion capture markers; (b) illustration of the designed flap angle and dihedral angle of the CKopter-1.
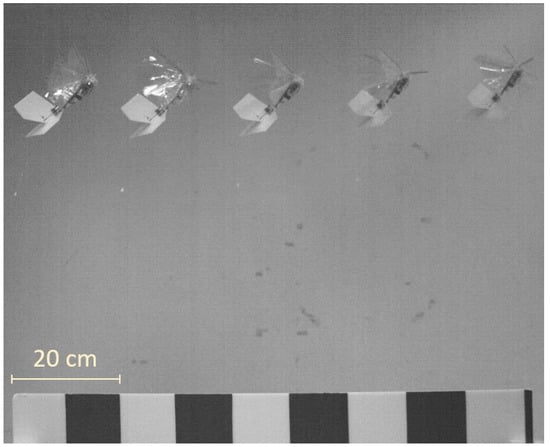
Figure 2.
Time-lapse composite of CKopter-1 in forward flight [23].
3. The Experimental Setup
3.1. Experimental Apparatus
The experimental setup was designed to capture coupled motion and force/moment data of the CKopter-1 test model under controlled flapping and airflow conditions. It consisted of five primary components: (i) a motion capture system to record model kinematics, (ii) an actuation system to induce prescribed motions, (iii) a force/moment measurement system, (iv) an airflow generation system to simulate forward flight, and (v) a flapping-frequency control system.
Figure 3 presents a photograph of the experimental setup in the laboratory. All of the aforementioned systems are visible in the figure, except for the flapping-frequency control system. The flapping frequency was controlled by an Arduino UNO microcontroller, which generated the required pulse-width-modulated (PWM) signals to drive the electronic speed controller (ESC) of the test model. In this experiment, the flapping frequency was maintained at approximately 13 to 14.4 Hz.
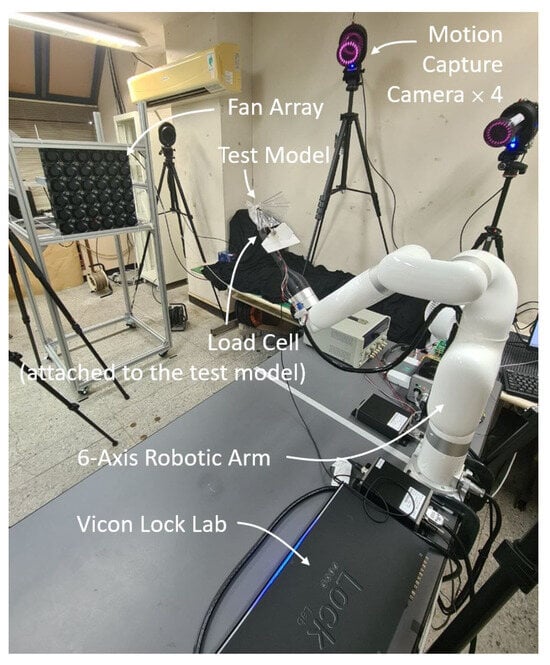
Figure 3.
The experimental setup incorporates a six-degree-of-freedom robotic arm, a fan array, a load cell, a motion capture system, and a motion capture control system that synchronizes the motion capture data and load cell measurement.
Forward flight conditions were simulated using a custom-built 6 × 6 fan array. Each fan in the array was a Delta GFC0812DW-SM0113Y counter-rotating high-performance cooling fan with a frontal area of 80 × 80 mm. Operating the fans at a 6% duty cycle generated an average incoming flow speed of approximately 2 m/s. The system architecture of the fan array is described in [23].
The fan-array inflow used in this study provides a practical approximation of forward-flight conditions for the FWMAV, but it does not produce the same level of spatial uniformity or turbulence control as a conventional low-turbulence wind tunnel. Since dedicated flow-field measurements were not conducted, the exact turbulence intensity and spatial variations in the inflow are not quantified here. Previous study on a similar system has shown that the turbulent intensity at the center region is less than 10% [24], and a similar system has been used for FWMAV flight test [25]. We acknowledge that future refinements could include detailed flow-field characterization or the use of a flow straightener to further improve inflow uniformity and repeatability.
The prescribed motions were induced using a UFACTORY XArm6, a six-degree-of-freedom robotic manipulator with a positioning repeatability of ±0.1 mm and a payload capacity of up to 5 kg. Motion capture was performed using a set of four Vicon VK8 cameras. These low-latency cameras provide 8-megapixel resolution, enabling accurate tracking of small reflective markers attached to the test model. The motion capture system operated at a sampling frequency of 300 Hz. Aerodynamic forces and moments were measured using an ATI Nano17 Titanium six-axis load cell, which has been used in prior FWMAV and ornithopter studies to measure aerodynamic loads of comparable magnitude [26,27,28,29,30,31]. It was mounted near the model’s CG to minimize parasitic effects. The load cell data were acquired at 3000 Hz, i.e., ten times the sampling rate of the motion capture system.
Among all the subsystems, the motion capture and force/moment measurement systems were the most critical, as they provided the scientific data for analysis. It was essential to ensure that these two independent data streams were synchronized in order to accurately identify aerodynamic loads with respect to the instantaneous motion states, namely the angle of incidence and pitch rate. The Vicon Lock Lab was utilized as the analog-to-digital converter for the load cell signals, with data acquisition performed through the Vicon Tracker software. Concurrently, kinematics data were recorded in MATLAB R2024a via the Vicon software development kit (SDK). The two datasets were subsequently synchronized in post-processing using the frame number information embedded in both recordings.
Figure 4 presents a close-up view of the load cell attachment. The load cell was mounted on a sting at the mounting side and connected to the test model on the sensing side. Due to space constraints, it was not possible to align the sensing coordinate frame with the body-fixed frame of the model. As shown in the figure, the CG was offset by 14.11 mm in the direction from the sensing frame. In addition, the body-fixed frame was flipped about the XZ-plane and rotated 45° relative to the sensing frame. Accordingly, the measured forces and moments in the sensing frame were transformed into the body-fixed frame using Equations (1)–(6). In the equations, an indicates force, and an indicates moment.
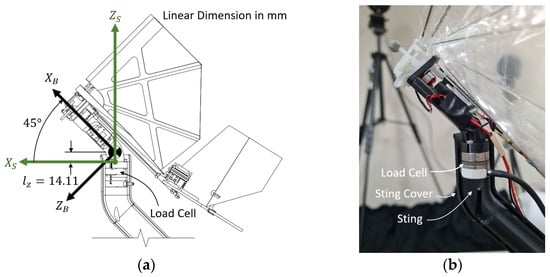
Figure 4.
Coordinate frames and the load cell attachment: (a) The load cell sensing coordinate frame () and the CKopter-1 body-fixed coordinate frame (); (b) Exposed view of the load cell attachment with one side of the sting cover removed.
Figure 4 also shows that the load cell and sting were encapsulated by a cover. This shielding prevented direct exposure of the load cell to the incoming flow, ensuring that the measured aerodynamic forces and moments originated solely from the interaction between the test model and the incoming airflow.
3.2. Experimental Design
To capture the dynamic damping characteristics of the pitching motion, the robotic arm was programmed to articulate a trajectory such that the test model rotated about its CG, as illustrated in Figure 5. The angle between the axis of the test model and the incoming flow was defined as the AoA (), while the rotational rate was defined as the pitch rate ().
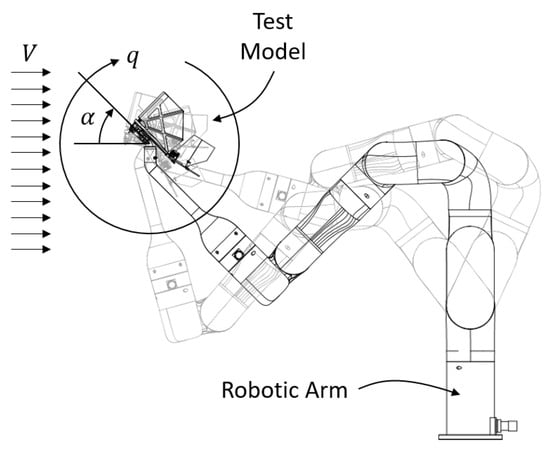
Figure 5.
The robotic arm motion to induce a pure rotational motion about the center of gravity with predefined AoA and pitch rate.
The motion range was set to . The experiment began with a very low pitch-rate cycle, which was regarded as the quasi-static case, followed by three successive cycles at increasingly higher pitch rates, considered as dynamic cases. Since the robotic arm could not be directly programmed to achieve a prescribed pitch rate, the motion was implemented as a sequence of linear movements. The actual pitch rate was then determined during post-processing using the motion capture data. In total, 5 tests were conducted. Figure 6 illustrates the pitch motion of Test 1: the robotic arm rotated the model back and forth about the pitch axis four times, with each segment executed at a constant pitch rate.
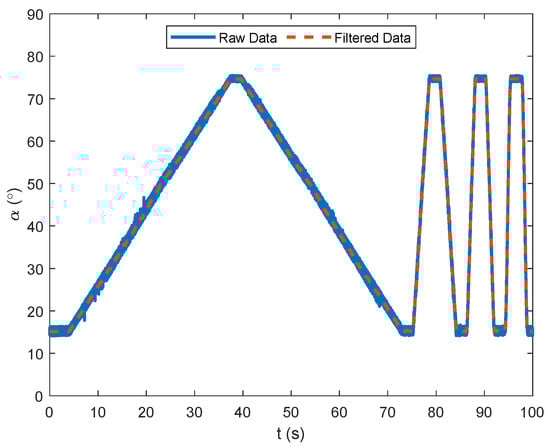
Figure 6.
The AoA induced by the robotic arm. One slow cycle for static measurement, followed by three significantly faster cycles for dynamic measurement. This dataset corresponds to Test 1.
More specifically, the objective of the experiment was to capture the dynamic effects of the pitching motion, which are conventionally characterized by the partial derivatives of the aerodynamic forces and moment with respect to the pitch rate. At every prescribed AoA, Equations (7)–(12) were applied to determine the dynamic damping terms for the aerodynamic forces and the moment about the body-fixed frame.
In conventional flight dynamics, these dynamic terms are derived under the quasi-steady assumption for rigid-body models. However, it is generally considered acceptable to apply the same formulation to flapping-wing models, provided that the flapping frequency is sufficiently high. In this case, the assumption effectively averages out the unsteady flapping effects over a cycle, allowing the quasi-steady model to approximate the net aerodynamic response. The quasi-steady model has been shown to provide a good approximation of the flight dynamics of flapping-wing vehicles of comparable size and flapping frequency, as demonstrated with the DelFly II [15].
4. Data Processing
As explained, each run starts with a slow cycle for quasi-static measurement followed by three fast cycles for dynamic measurement. Figure 7 shows the complete data processing flow for each run.
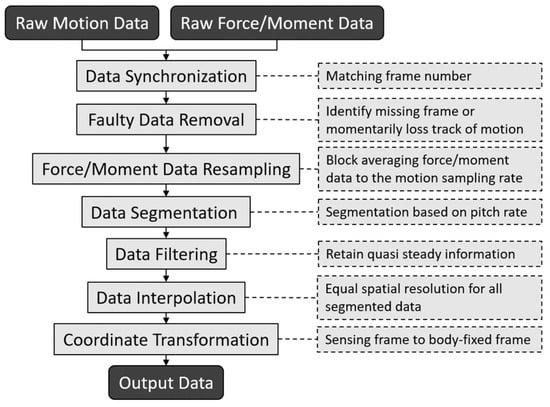
Figure 7.
Data processing flow for motion and force/moment measurements.
The advantage of using the Vicon Lock Lab lies in its ability to synchronize external analog sensor data with motion capture data. As described earlier, the kinematics data and the force/moment data were stored in separate files. The first step in the processing sequence was to synchronize the two datasets using the frame number information recorded in both files.
Following synchronization, faulty data were removed. The primary cause of faulty data was the limited number of motion capture cameras, which occasionally created blind spots for the reflective markers. These losses were momentary and did not significantly affect the overall determination of the motion.
The force/moment data were recorded at ten times the sampling frequency of the motion capture system. To facilitate subsequent processing, both datasets were resampled to the same rate by block averaging the force/moment data, i.e., averaging every ten consecutive data points.
The synchronized and resampled data were then segmented according to the pitch rate, followed by low-pass filtering to retain the quasi-steady information. This step may appear counterintuitive, as most flapping-wing studies select the cutoff frequency above the flapping frequency in order to preserve transient flapping effects. In contrast, since the aerodynamic damping considered here is represented by a quasi-steady model, the cutoff frequency was chosen below the flapping frequency—though not so low as to attenuate the quasi-steady contribution. It is also noteworthy that different cutoff frequencies were applied to different data segments, reflecting the variation in frequency resolution arising from differences in segment length.
Because the segmented data were sampled at a constant rate but with different pitch rates, they exhibited varying spatial resolutions. To enable comparison, the lengths of the segments were equalized by interpolation. Specifically, the data were interpolated over the range at intervals of interval. Finally, the data were transformed into the body-fixed coordinate system as defined in Equations (1)–(6). The conversion of voltage data to forces and moments using the manufacturer-provided calibration matrix was also completed in this step.
Figure 8 shows the Fast Fourier Transform (FFT) of the segmented raw data of the load cell for the quasi-static case and the dynamic cases. The frequency resolution is markedly higher in the quasi-static case than in the dynamic cases, allowing for a lower cutoff frequency to be applied in the low-pass filter. The observed spectral peaks correspond to the harmonics of the flapping frequency. Figure 9 presents the segmented load-cell data overlaid on the raw measurements, showing that the quasi-steady state characteristics of the signals were preserved.
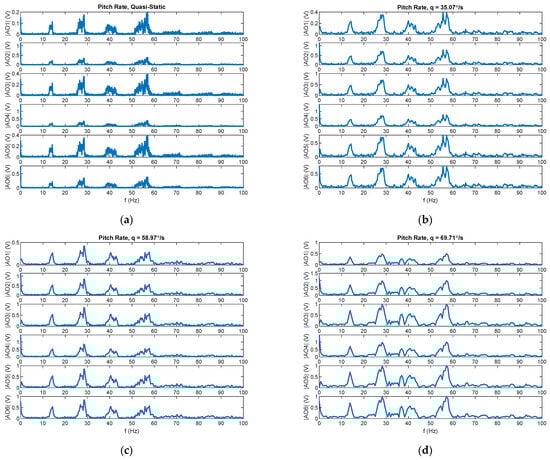
Figure 8.
FFT of segmented six-channel load cell raw data: (a) Segment 1: quasi-static; (b) Segment 2: pitch rate ; (c) Segment 3: pitch rate ; and (d) Segment 4: pitch rate . This dataset corresponds to Test 1.
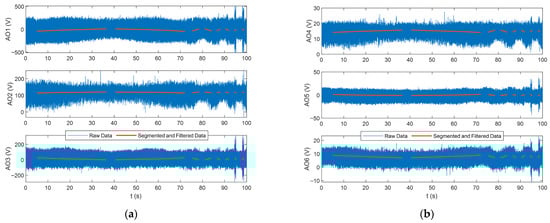
Figure 9.
Segmented and filtered six-channel load cell signals with raw data overlay: (a) Channel 1 to 3; (b) Channel 4 to 5. This dataset corresponds to Test 1.
5. Data Validation
Due to the scarcity of literature on pitch-rate stability derivatives for this class of MAV, direct validation of the results is challenging. A meaningful comparison requires similarity not only in flapping mode (i.e., high frequency clap-and-fling) and vehicle size, but also in the flight regime (i.e., high–AoA slow flight) and configuration (e.g., conventional tail for stabilization). The only available reference is the DelFly II [15], whose derivatives were obtained from actual flight tests. These data provide a useful benchmark to assess the credibility of our results.
It should be noted, however, that the CKopter-1 features a larger dihedral angle and flap amplitude, resulting in a greater wing stroke above the fuselage as illustrated in Figure 10.
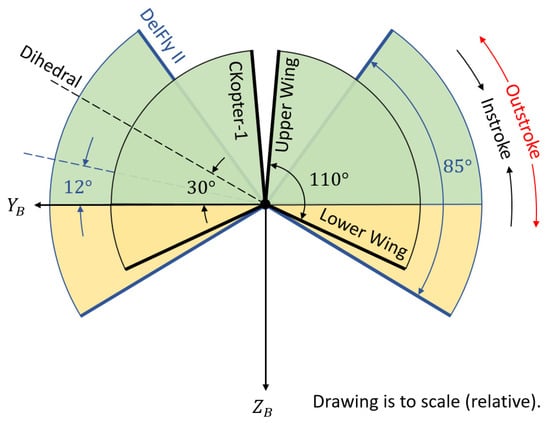
Figure 10.
Wing dihedral and flap angle comparison between DelFly II and CKopter-1. The green area indicates the leading-edge sweep above the fuselage centerline (dorsal), and the yellow area indicates the sweep below (ventral). The DelFly II is represented in blue.
The figure presents a frontal comparison of the wing stroke geometry of the DelFly II and CKopter-1. The DelFly II employs a flapping amplitude of 85°, whereas the CKopter-1 uses a larger 110° stroke. Their mean dihedral angles (mid-stroke angles) also differ substantially, at approximately 12° for the DelFly II and 30° for the CKopter-1. As a result, a greater portion of CKopter-1’s frontal wing projection lies above the fuselage centerline. This asymmetry in the dorsal–ventral projection means that a pitching motion produces a net incremental forward force. Consequently, the pitch-rate derivative of the forward force, , is expected to be larger than that of the DelFly II.
Conversely, the CKopter-1 is smaller in overall size and has a shorter tail as depicted in Figure 11, leading to reduced pitch-rate derivatives for the downward force (), and the pitching moment ().
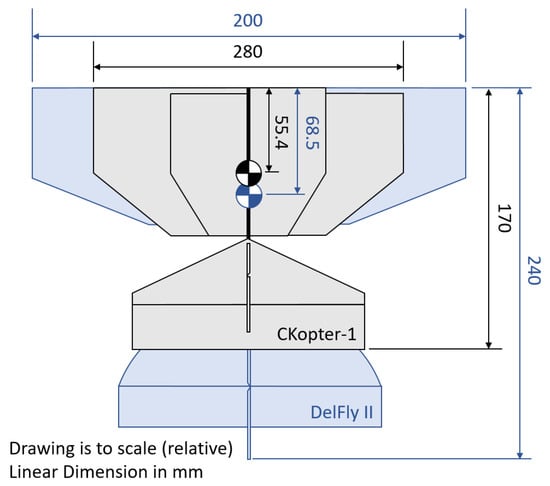
Figure 11.
Size comparison between DelFly II and CKopter-1. The DelFly II is scaled according to data from [32].
6. Results and Discussions
6.1. Static Case
Although the primary aim of this research was to identify the stability derivative, it is also worthwhile examining the quasi-static data. The results presented here are based on the average of five repeated tests. For intuitive interpretation at the FWMAV scale, the data are expressed in gram-force and gram-force-centimeter.
As shown in Figure 12, the lateral components are minimally influenced by changes in AoA. The rightward force () remains essentially zero across the full AoA range. The rolling moment () and yawing moment (), while not exactly zero, remain nearly constant. Ideally, both moments should vanish due to the inherent left–right symmetry of the test model; however, minor asymmetries introduced during fabrication resulted in small deviations. In contrast, the forward force () increases gradually with AoA, which can be attributed to the growing frontal projection of the flexible wing. The downward force () decreases sharply because the incoming flow exerts an upward load on the wing, producing a force in the opposite direction.
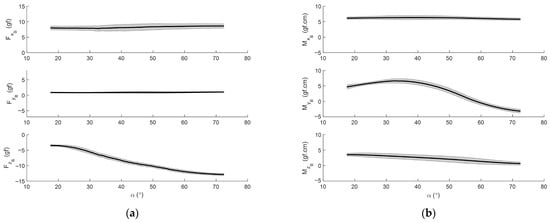
Figure 12.
Averaged quasi-static forces and moments: (a) forces along the body axes versus AoA; (b) moments along the body axes versus AoA. Shaded area indicates ±1 standard deviation.
The behavior of the pitching moment () offers insight into the static stability of the FWMAV. The slope of the curve is positive for AoA below 33°, indicating static instability at low AoA. This is a noteworthy result, as it contrasts with the typical behavior of fixed-wing aircraft, which are generally stable at low AoA regimes. The FWMAV reaches its trim condition at an AoA of 58.5°, where the pitching moment is zero. Static longitudinal stability is positive between AoA 33° and 72.5°, which was the maximum AoA attainable in this study.
The shaded regions in Figure 12 represent the standard deviation across the five quasi-static repetitions. To quantify repeatability, these standard-deviation curves were condensed by computing their average and maximum values over the full AoA range, as summarized in Table 1. The table also reports the repeatability ratio defined in Equation (13), where is the maximum standard deviation and is the maximum absolute value of the quantity. denotes the maximum absolute value of the corresponding quantity. Because the pitching moment crosses zero within the tested AoA range, rendering mean-based normalization inappropriate, the ratio of maxima was adopted to provide a consistent and meaningful measure of repeatability. The smaller the ratio, the better the repeatability.

Table 1.
Average and maximum standard deviation, and repeatability ratio of quasi-static forces and moments.
Among the six channels, the largest repeatability ratios occur in the lateral force (29%) and the yawing moment (27%). Both quantities remain close to zero throughout the entire AoA range due to the geometric left–right symmetry of the vehicle, which naturally inflates their repeatability ratios despite the small absolute scatter. By contrast, the primary longitudinal channels that influence the pitch-rate stability derivatives, , , and exhibit much lower ratios between 5% and 13%, demonstrating good repeatability and confirming the reliability of the quasi-static measurements.
There are two key takeaways from the quasi-static results. First, the FWMAV demonstrates stability characteristics that differ significantly from those of conventional fixed-wing aircraft. Although it flies in a forward configuration, its stable regime occurs over a very different range of angles of attack, highlighting the need for more detailed and rigorous investigation into the flight dynamics of this class of vehicles. Second, the results reinforce that the fan-array robotic-arm setup provides a clear advantage over flight testing for determining stability derivatives, as it enables identification of stability characteristics even in regions where sustained flight is not possible.
6.2. Dynamic Cases
The dynamic cases were conducted at pitch rates of , , and . Figure 13 illustrates the forces and moments measured when the CKopter-1 test model was pitched at . The arrows denote the direction of the pitching motion, while the shaded regions represent the standard deviation. It is evident that only the pitching moment exhibits a significant difference between the forward and backward cycles. The vertical shift in the pitching moment data indicates that the pitch rate introduces either an increment or a decrement, providing clear evidence of the stability derivative .
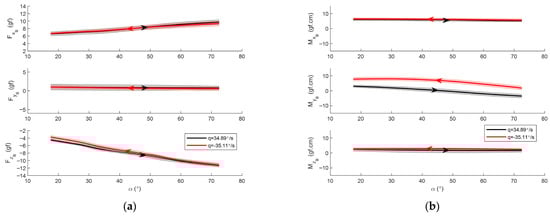
Figure 13.
Averaged dynamic forces and moments at : (a) forces along the body axes versus AoA; (b) moments along the body axes versus AoA. Shaded area indicates ±1 standard deviation. Arrows indicate direction of pitching motion.
In contrast to the case at 35°/s, clear vertical shifts in the forward force () and downward force () were observed at 58.76°/s and 68.39°/s, as shown in Figure 14 and Figure 15. The vertical displacement of the longitudinal components—namely, the forward force, downward force, and pitching moment—increases slightly with pitch rate. This indicates that a pitch rate of 35°/s is insufficient to induce measurable changes in the forces. Across all test cases, the lateral and directional components remained close to zero or constant and showed no significant differences between the forward and backward pitching cycles. Nevertheless, it is premature to conclude that the longitudinal and lateral dynamics are decoupled, as the effects of the sideslip angle were not examined in the present study.
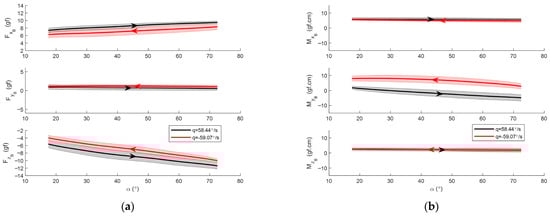
Figure 14.
Averaged dynamic forces and moments at : (a) forces along the body axes versus AoA; (b) moments along the body axes versus AoA. Shaded area indicates ±1 standard deviation. Arrows indicate direction of pitching motion.
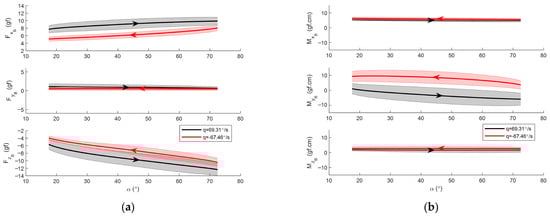
Figure 15.
Averaged dynamic forces and moments at : (a) forces along the body axes versus AoA; (b) moments along the body axes versus AoA. Shaded area indicates ±1 standard deviation. Arrows indicate direction of pitching motion.
The shaded regions in Figure 13, Figure 14 and Figure 15 represent the standard deviation across the five dynamic repetitions. Table 2, Table 3 and Table 4 summarize the repeatability metrics for the three dynamic pitch-rate conditions, separating the pitch-up and pitch-down segments. For the longitudinal force channels and , the repeatability ratios, computed using the same definition in Equation (13), remain modest, typically below 15%, indicating that the pitch-rate-induced changes in these forces are well above measurement scatter. For the pitching moment , however, the repeatability ratio becomes noticeably larger, particularly during pitch-up motion. This occurs because the maximum magnitude of is substantially smaller when the vehicle pitches up compared with when it pitches down, resulting in a larger ratio. The standard deviation itself also increases with pitch rate, reflecting the stronger unsteady aerodynamic response under higher dynamic excitation. As in the quasi-static case, the lateral force and yawing moment exhibit large repeatability ratios due to their near-zero physical magnitudes.
Table 2.
Average and maximum standard deviation, and repeatability ratio of dynamic forces and moments at . Unit: for forces and for moments.
Table 3.
Average and maximum standard deviation, and repeatability ratio of dynamic forces and moments at . Unit: for forces and for moments.
Table 4.
Average and maximum standard deviation, and repeatability ratio of dynamic forces and moments at . Unit: for forces and for moments.
At the highest pitch rate, repeatability ratios for reach 87% during pitch-up and 51% during pitch-down, clearly indicating that repeatability degrades under strong dynamic excitation. This increase in variability is not due to overlap between the flapping and pitching frequencies since the flapping frequency corresponds to an angular rate on the order of 3000°/s and is therefore much higher than the imposed pitch rates, but is more likely a consequence of the rapidly changing AoA within each flapping cycle, reduced frequency resolution in the segmented data, and increased sensitivity of the low-pass filtering process at higher pitch rates. In addition, the maximum magnitude of is smaller during pitch-up motion, which further inflates the repeatability ratio. Despite the elevated variability, the pitch-rate stability derivatives extracted at the highest pitch rate remain consistent with those obtained at a lower rate, as shown in the next subsection, indicating that the dominant aerodynamic trends are still captured reliably.
According to the ATI Nano17-Titanium specifications, the effective resolutions after dropping eight counts of noise are 1/682 N (≈0.15 gf) for the force channels and 3/364 to 5/728 N·mm (≈0.070–0.084 gf·cm) for the moment channels. These values represent the usable sensor resolution after removing low-level noise. Compared with the aerodynamic loads measured in this study, which are typically tens of gf and tens of gf·cm, the effective resolution is below 1% of the signal magnitude. Even the largest standard deviations across the repeated runs (Table 1, Table 2, Table 3 and Table 4) exceed this resolution by one to several orders of magnitude, indicating that the observed variability is dominated by aerodynamic and flow-induced effects rather than sensor quantization limits.
The load cell calibration report provided by the manufacturer specifies a force calibration uncertainty of 1% full scale (FS), corresponding to 8.16 gf for the 8 N range of the sensor. This FS-based value represents a conservative upper bound and does not directly indicate the uncertainty at the low load levels used in this study. Because the aerodynamic forces measured here are within 14 gf (≈1.7% FS), it is difficult to precisely quantify the actual uncertainty within this narrow operating range. Nevertheless, the ATI Nano17 Titanium has been widely used in flapping-wing MAV research to measure aerodynamic forces and moments of similar magnitude [26,27,28,29,30,31]. This extensive prior use supports the assumption that calibration-related uncertainties at these load levels are small relative to the measured variations. Moreover, the pitch-rate stability derivatives in this work are obtained from differences between quasi-static and dynamic measurements taken under identical calibration conditions, such that any small systematic bias is common to all cases and largely cancels in the derivative computation. Consequently, calibration-related effects have only a minor influence on the final stability derivatives.
The Vicon motion-capture system, using 3712 × 2176 pixel cameras and 6 mm markers located approximately 2 m from the test article, provides angular measurements with an accuracy better than 0.1°. Thus, the uncertainties in AoA and pitch angle are small compared with the AoA range explored in this work.
Combining the load-cell resolution and angular-measurement accuracy using a root-sum-square estimate yields a conservative instrumentation uncertainty of only a few percent for the forces and moments. This value is substantially smaller than the standard deviations reported in Table 1, Table 2, Table 3 and Table 4, confirming that the dominant source of measurement variability arises from aerodynamic effects and random noise, rather than from limitations in sensor resolution.
6.3. Pitch Rate Stability Derivatives
Using the data presented in Figure 12, Figure 13, Figure 14 and Figure 15, the pitch-rate derivatives across the range of AoA were determined from Equations (7)–(12), and the results are shown in Figure 16. The derivatives obtained from the three pitch-rate cases generally overlap, except for (). This discrepancy arises because a pitch rate of 35°/s is insufficient to induce measurable changes in the forces, as noted earlier. The standard deviation for the 35°/s case is also larger than that of the other two cases. These observations suggest that, under the present experimental setup, the pitch rate must be sufficiently high to elicit a consistent aerodynamic response.
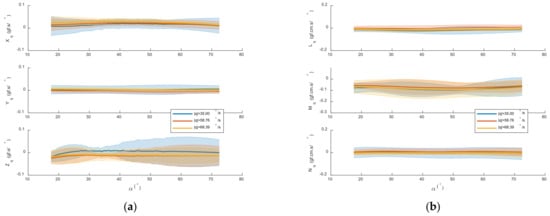
Figure 16.
Dynamic derivatives versus AoA (a) forces along the body axes versus AoA; (b) moments along the body axes versus AoA. Shaded area indicates ±1 standard deviation.
Table 5 summarizes the pitch-rate derivatives of both FWMAVs. The DelFly II values were extracted from published figures [15], converted to the unit system and coordinate frame adopted in this study. For a fair comparison, the CKopter-1 values were averaged from the 58.76°/s and 68.39°/s cases within a statically stable AoA range (), consistent with the fact that the DelFly II averages were derived from flight data. Including the statically unstable range would not be appropriate, as flight is not feasible there.
Table 5.
Average dynamic derivatives of the CKopter-1 at different pitch rates within statically stable α range, with comparison with the average data of DelFly II extracted from [15] and converted to the same coordinate frame and units.
Overall, the averaged derivatives of both FWMAVs are of the same order of magnitude. As predicted, the CKopter-1 exhibits a larger and smaller magnitudes of and , in agreement with the expected aerodynamic trends. Importantly, this study demonstrates a clear advantage by enabling the identification of stability derivatives beyond the stable flight regime, thus providing a powerful complement to conventional flight-test-based methods.
Beyond these comparative results, it is also instructive to consider the role of first-principles aerodynamic modeling in the context of the present methodology. Traditional first-principles aerodynamic models for flapping wings, such as unsteady blade-element formulations, added-mass representations, and Theodorsen-type unsteady formulations are, in principle, capable of predicting aerodynamic damping terms from wing geometry, kinematics, and flow parameters. However, applying such models to FWMAVs remains challenging because the dominant mechanisms, such as leading-edge vortex dynamics, clap-and-fling interactions, and wing deformation, are highly nonlinear and difficult to parameterize, particularly at the high-AoA and low-Reynolds-number regime characteristic of slow flapping flight. The empirically obtained derivatives presented in this work, therefore, serve as valuable reference data for constraining, validating, or refining future first-principle or semi-empirical aerodynamic models.
7. Conclusions
This work demonstrated a laboratory methodology to identify pitch-rate stability derivatives of an FWMAV (CKopter-1) using a fan-array robotic-arm setup with synchronized motion capture and six-axis force/moment measurements. By segmenting the data with pitch rate, applying low-pass filtering below the flapping frequency to retain quasi-steady content, and transforming loads into the body-fixed frame, we extracted the aerodynamic damping terms, namely the pitch-rate stability derivatives , , and across . The quasi-static results established an atypical longitudinal stability landscape: static instability below , a trim point near , and positive static stability up to the tested maximum . In dynamic tests, a clear pitch-rate effect was observed primarily in the longitudinal channels, with an evident shift in pitching moment for all dynamic cases and in axial/normal forces once exceeded .
The identified derivatives were consistent across the two higher-rate cases with the same order as values extracted for the DelFly II from flight data. As anticipated from geometric differences, CKopter-1 showed a larger and smaller magnitudes of , and , reflecting its greater dihedral/flap stroke above the fuselage and shorter tail arm. Importantly, the proposed approach enabled derivative identification in AoA regions where sustained free flight is not feasible, highlighting its value as a complement to flight-test-only methods.
The study is subject to several limitations: the inflow provided by the fan array is turbulent and only approximately accurate for forward flight; only pitch motion was prescribed (no sideslip or coupled lateral–directional excitation); and the robotic arm executed piecewise-linear segments rather than a precisely commanded , requiring ex-post estimation of the pitch rate. Despite these constraints, repeatability across tests and the coherence of trends with geometry lent confidence to the results.
A further limitation arises from the fact that the fan-array inflow does not reproduce the periodic velocity and positional fluctuations generated by the flapping wings in free flight. These fluctuations introduce additional unsteady aerodynamic components that are not captured in the present setup. However, the influence of this omission depends strongly on the relationship between the flapping frequency and the natural frequency of the vehicle’s body motion. When these two frequencies are thoroughly separated, as is the case for CKopter-1, whose rigid-body dynamics evolve much more slowly than the wingbeat cycle, the rigid-body assumption remains valid, and the quasi-steady aerodynamic response can be treated as the dominant contribution. This rationale is consistent with the findings reported for the DelFly II in [15], where a linear rigid-body model was shown to adequately describe the longitudinal dynamics despite the inherently unsteady flapping aerodynamics. Therefore, while the present inflow does not reconstruct the instantaneous wake structures, it remains sufficient for capturing the effective aerodynamic damping relevant to pitch-rate stability derivative identification.
Finally, we note that the traditional rigid-body formulation of pitch-rate derivatives, although widely used in flight-dynamics analysis, does not fully capture the rich unsteady aerodynamics of flapping-wing vehicles. Effects such as vortex shedding, wake capture, wing flexibility, and the clap-and-fling mechanism contribute to the aerodynamic moment in ways that extend beyond the classical linearized description. In the present work, the conventional derivative framework was employed primarily as an organizing structure for interpreting the measured dynamic response. A more complete theoretical description would require incorporating unsteady aerodynamic models or reduced-order representations of the flow physics, which represents an important direction for future extension of this work.
Future work will extend the method to lateral–directional derivatives with sideslip excitation. The identified , , and provide actionable parameters for control-oriented modeling and preliminary controller synthesis of FWMAVs operating in high AoA, low-speed regimes.
Author Contributions
Conceptualization, W.-L.C.; methodology, W.-L.C.; software, W.-L.C., D.-J.L. and C.-L.C.; validation, W.-L.C.; formal analysis, W.-L.C., H.-Y.C. and D.-J.L.; investigation, W.-L.C., H.-Y.C., D.-J.L. and C.-L.C.; resources, W.-L.C.; data curation, W.-L.C., H.-Y.C. and D.-J.L.; writing—original draft preparation, W.-L.C.; writing—review and editing, W.-L.C.; visualization, W.-L.C.; supervision, W.-L.C.; project administration, W.-L.C.; funding acquisition, W.-L.C. All authors have read and agreed to the published version of the manuscript.
Funding
This research was funded by the National Science and Technology Council of Taiwan, grant number 112-2222-E-006-001-MY3.
Data Availability Statement
The data presented in this study are available on request from the corresponding author. The data are not publicly available at this time as they are part of an ongoing project.
Acknowledgments
The authors thank Daniel Aláez for his assistance in developing the user interface of the fan array. During the preparation of this manuscript/study, the authors used ChatGPT 5 for the purposes of language refinement. The authors have reviewed and edited the output and take full responsibility for the content of this publication.
Conflicts of Interest
The authors declare no conflicts of interest.
Abbreviations
The following abbreviations are used in this manuscript:
| AoA | Angle of Attack |
| CG | Center of Gravity |
| FFT | Fast Fourier Transform |
| FWMAV | Flapping Wing Micro-Air Vehicle |
References
- Dickinson, M.H.; Lehmann, F.O.; Sane, S.P. Wing Rotation and the Aerodynamic Basis of Insect Flight. Science 1999, 284, 1954–1960. [Google Scholar] [CrossRef]
- Sane, S.P. The Aerodynamics of Insect Flight. J. Exp. Biol. 2003, 206, 4191–4208. [Google Scholar] [CrossRef]
- Shyy, W.; Berg, M.; Ljungqvist, D. Flapping and Flexible Wings for Biological and Micro Air Vehicles. Prog. Aerosp. Sci. 1999, 35, 455–505. [Google Scholar] [CrossRef]
- Birch, J.M.; Dickinson, M.H. Spanwise Flow and the Attachment of the Leading-Edge Vortex on Insect Wings. Nature 2001, 412, 729–733. [Google Scholar] [CrossRef]
- Truong, Q.T.; Nguyen, Q.V.; Truong, V.T.; Park, H.C.; Byun, D.Y.; Goo, N.S. A Modified Blade Element Theory for Estimation of Forces Generated by a Beetle-Mimicking Flapping Wing System. Bioinsp. Biomim. 2011, 6, 036008. [Google Scholar] [CrossRef] [PubMed]
- Taha, H.E.; Hajj, M.R.; Nayfeh, A.H. Flight Dynamics and Control of Flapping Wing MAVs: A Review. Nonlinear Dyn. 2012, 70, 907–939. [Google Scholar] [CrossRef]
- Khan, Q.; Akmeliawati, R. Review on System Identification and Mathematical Modeling of Flapping-Wing Micro Aerial Vehicles. Appl. Sci. 2021, 11, 1546. [Google Scholar] [CrossRef]
- Sun, M.; Xiong, Y. Dynamic Flight Stability of a Hovering Bumblebee. J. Exp. Biol. 2005, 208, 447–459. [Google Scholar] [CrossRef]
- Sun, M.; Wang, J.; Xiong, Y. Dynamic Flight Stability of Hovering Insects. Acta Mech. Sin. 2007, 23, 231–246. [Google Scholar] [CrossRef]
- Lyu, Y.Z.; Sun, M. Dynamic Stability in Hovering Flight of Insects with Different Sizes. Phys. Rev. E 2022, 105, 054403. [Google Scholar] [CrossRef]
- Taylor, G.K.; Thomas, A.L.R. Dynamic Flight Stability in the Desert Locust Schistocerca gregaria. J. Exp. Biol. 2003, 206, 2803–2829. [Google Scholar] [CrossRef]
- Taylor, G.K.; Żbikowski, R. Nonlinear Time-Periodic Models of the Longitudinal Flight Dynamics of Desert Locusts Schistocerca gregaria. J. R. Soc. Interface 2005, 2, 197–221. [Google Scholar] [CrossRef]
- Vicroy, D.D. A Guide to Forced Oscillation Data Processing and Analysis. NASA/TP–20210023569; 2023. Available online: https://ntrs.nasa.gov/api/citations/20210023569/downloads/NASA-TP-20210023569.pdf (accessed on 12 September 2025).
- Caetano, J.V.; de Visser, C.C.; de Croon, G.C.H.E.; Remes, B.; de Wagter, C.; Verboom, J.; Mulder, M. Linear Aerodynamic Model Identification of a Flapping Wing MAV Based on Flight Test Data. Int. J. Micro Air Veh. 2013, 5, 273–286. [Google Scholar] [CrossRef]
- Armanini, S.F.; Karásek, M.; de Visser, C.C. Global Linear Parameter-Varying Modeling of Flapping-Wing Dynamics Using Flight Data. J. Guid. Control Dyn. 2018, 41, 2338–2360. [Google Scholar] [CrossRef]
- Kajak, K.M.; Karásek, M.; Chu, Q.P.; de Croon, G.C.H.E. A Minimal Longitudinal Dynamic Model of a Tailless Flapping Wing Robot for Control Design. Bioinspir. Biomim. 2019, 14, 046008. [Google Scholar] [CrossRef]
- Bains, K. System Identification of the DelFly Nimble: Modeling of the Lateral Body Dynamics. Master’s Thesis, Delft University of Technology, Delft, The Netherlands, 2020. [Google Scholar]
- Nguyen, K.; Au, L.T.K.; Phan, H.-V.; Park, H.C. Comparative Dynamic Flight Stability of Insect-Inspired Flapping-Wing Micro Air Vehicles in Hover: Longitudinal and Lateral Motions. Aerosp. Sci. Technol. 2021, 119, 107085. [Google Scholar] [CrossRef]
- Cheng, C.; Wu, J.; Zhang, Y.; Zhou, C.; Li, H. Aerodynamics and Dynamic Stability of Micro-Air-Vehicle with Four Flapping Wings in Hovering Flight. Adv. Aerodyn. 2020, 2, 5. [Google Scholar] [CrossRef]
- Bhatti, M.Y.; Lee, S.-G.; Han, J.-H. Dynamic Stability and Flight Control of Biomimetic Flapping-Wing Micro Air Vehicle. Aerospace 2021, 8, 362. [Google Scholar] [CrossRef]
- Vourtsis, C.; Rochel, V.C.; Müller, N.S.; Stewart, W.; Floreano, D. Wind-Defiant Morphing Drones. Adv. Intell. Syst. 2023, 5, 2200297. [Google Scholar] [CrossRef]
- Asai, K.; Konno, A.; Jiang, X.; Numata, D.; Abe, H.; Nakata, N.; Hara, T. Multi-Degree-of-Freedom Dynamic Wind-Tunnel Testing of a Delta Wing Using a Robotic Manipulator. In Proceedings of the 28th Congress of the International Council of the Aeronautical Sciences, Brisbane, Australia, 23–28 September 2012; Available online: https://icas.org/icas_archive/ICAS2012/PAPERS/927.PDF (accessed on 13 September 2025).
- Chan, W.-L.; Chen, H.-Y.; Chin, C.-L.; Huang, C.-H. A Bio-Inspired Micro Air Vehicle and the Experimental Setup for Aerodynamic Testing. In Proceedings of the 15th International Micro Air Vehicle (IMAV) Conference and Competition, Bristol, UK, 16–20 September 2024. [Google Scholar]
- Percin, M.; van Oudheusden, B.W.; de Croon, G.C.H.E.; Remes, B. Force Generation and Wing Deformation Characteristics of a Flapping-Wing Micro Air Vehicle ‘DelFly II’ in Hovering Flight. Bioinspir. Biomim. 2016, 11, 036014. [Google Scholar] [CrossRef]
- Li, S.; Liu, Y.; Jiang, Z.; Hu, G.; Noack, B.R.; Raps, F. Aerodynamic Characterization of a Fan-Array Wind Generator. AIAA J. 2024, 62, 291–301. [Google Scholar] [CrossRef]
- Wang, S.; Olejnik, D.; de Wagter, C.; van Oudheusden, B.; de Croon, G.; Hamaza, S. Battle the Wind: Improving Flight Stability of a Flapping-Wing Micro Air Vehicle under Wind Disturbance with Onboard Thermistor-Based Airflow Sensing. IEEE Robot. Autom. Lett. 2022, 7, 9605–9612. [Google Scholar] [CrossRef]
- Chin, Y.-W.; Kok, J.M.; Zhu, Y.Q.; Chan, W.L.; Chahl, J.S.; Khoo, B.C.; Lau, G.K. Efficient Flapping-Wing Drone Arrests High-Speed Flight Using Post-Stall Soaring. Sci. Robot. 2020, 5, eaba2386. [Google Scholar] [CrossRef] [PubMed]
- Truong, T.V.; Nguyen, Q.-V.; Au, L.T.K.; Luong, H.-T. The Effects of Bio-Inspired Wing Vein Morphology on Thrust Generation in Double-Clap Flapping-Wing Robots. Defence Technol. 2025; in press. [Google Scholar] [CrossRef]
- Phan, H.V.; Aurecianus, S.; Kang, T.; Park, H.C. KUBeetle-S: An Insect-Like, Tailless, Hover-Capable Robot That Can Fly with a Low-Torque Control Mechanism. Int. J. Micro Air Veh. 2019, 11, 1756829319861371. [Google Scholar] [CrossRef]
- Nguyen, Q.-V.; Chan, W.L. Development and Flight Performance of a Biologically Inspired Tailless Flapping-Wing Micro Air Vehicle with Wing Stroke Plane Modulation. Bioinspir. Biomim. 2019, 14, 016015. [Google Scholar] [CrossRef] [PubMed]
- Yang, X.; Song, B.; Yang, W.; Xue, D.; Pei, Y.; Lang, X. Study of Aerodynamic and Inertial Forces of a Dovelike Flapping-Wing MAV by Combining Experimental and Numerical Methods. Chin. J. Aeronaut. 2022, 35, 63–76. [Google Scholar] [CrossRef]
- Bruggeman, B. Improving Flight Performance of DelFly II in Hover by Improving Wing Design and Driving Mechanism. Master’s Thesis, Delft University of Technology, Delft, The Netherlands, 2010. [Google Scholar]
Disclaimer/Publisher’s Note: The statements, opinions and data contained in all publications are solely those of the individual author(s) and contributor(s) and not of MDPI and/or the editor(s). MDPI and/or the editor(s) disclaim responsibility for any injury to people or property resulting from any ideas, methods, instructions or products referred to in the content. |
© 2025 by the authors. Licensee MDPI, Basel, Switzerland. This article is an open access article distributed under the terms and conditions of the Creative Commons Attribution (CC BY) license (https://creativecommons.org/licenses/by/4.0/).