Abstract
The electrification of non-road mobile machinery is advancing to enhance sustainability and reduce emissions. This study investigates how to maximize the efficiency of the retrofitting of a material handler from an internal combustion engine to a battery-powered electric motor, while keeping the hydraulic system unchanged. Using a previously validated model, this study proposes three control strategies for the electric motor and hydraulic pump to enhance efficiency and performance. The first control strategy optimizes hydraulic pump performance within its most efficient displacement range. The second strategy maximizes powertrain efficiency by considering both efficiencies of the electric motor and hydraulic pump. The third strategy uses a servo-actuated valve to adjust the load-sensing margin and exhibits energy savings up to 14.2% and an 11.5% increase in efficiency. The proposed strategies avoid complex optimization algorithms, ensuring practical applicability for small- and medium-sized enterprises, which often face cost constraints and limited scalability.
1. Introduction
The increasing demand for environmental sustainability, emissions reduction, and air pollution control has driven the electrification of on-road and non-road mobile machinery (NRMM). Stricter government emissions regulations [1] and energy-saving requirements have further accelerated this shift; at the same time, initiatives like Italy’s Transizione 5.0 [2] support NRMM electrification through incentives for the acquisition of more sustainable machines.
Following the automotive industry [3], NRMM powertrain electrification has begun [4,5], though key differences remain. For instance, NRMM features greater architectural variety [6] and relies heavily on small- and medium-sized enterprises (SMEs) rather than large corporations [7,8]. Despite these challenges, SMEs must embrace electrification as an enabling technology. Indeed, efficiency has become a priority, ensuring that machines maximize resource utilization while justifying higher upfront costs through lower total cost of ownership or additional functionalities.
As a matter of fact, both industry and academia are exploring NRMM electrification solutions, though selecting the best approach remains challenging, particularly for hydraulics [9]. Hydraulics indeed offer the highest power-to-weight ratio, making replacement difficult, yet it is also a major inefficiency source after internal combustion engines (ICEs) [10]; based on a report on fluid power components and systems by the Oak Ridge national lab [11], mobile hydraulics have an average energy efficiency of just 21%. To improve NRMM efficiency, research focuses on both disruptive and incremental innovations.
Disruptive innovations in NRMM hydraulics range from full replacement with electro-mechanical actuators [12] to modernized hydraulic architectures, including individual metering control [13], digital hydraulics [14], multi-chamber actuators [15], and direct-driven hydraulics [16]. Incremental improvements focus on electro-hydraulics to enhance actuation control and minimize idle losses [17]. In both cases, the shift from internal combustion engines to electric machines offers major efficiency gains and enables energy recovery.
Nonetheless, most electrification initiatives fail to meet SMEs’ needs due to high costs and a lack of economies of scale. Innovative components are expensive, and some require extensive machine redesign. SMEs, working with small volumes and custom machines, prioritize quick investment recovery and cannot rely on high sales volumes with low margins. However, two approaches can help mitigate costs: optimizing development via modeling and simulation; lowering costs through retrofitting and component sharing.
In this context, by modeling and simulation of a material handler, this paper investigates how to maximize the efficiency of a retrofit from ICE to battery-powered. The hydraulics, originally designed for ICE operation, remain unchanged in the battery-powered variant, making it challenging to implement advantageous enhancements made possible by electrification. Replacing an ICE with an electric motor (EM) provides major benefits [17], including increased efficiency and controllability, but the traditional control strategy fails to leverage this advantage.
“Variable-speed” control, which adjusts EM rotational speed with fixed displacement pumps, eliminates relief valves for flow control, improving energy efficiency. This approach is well established for small excavators and machines [18,19,20] and serves as a foundation for direct-driven hydraulics [21].
However, with the scheme where the pump adjusts displacement via a load-sensing (LS) signal, changing the EM speed significantly impacts machine operation [22]. More precisely, flow rate is affected by both rotational speed and displacement, but the latter is controlled by the LS system through non-adjustable hydraulic feedback that depends on both flow rate and pressure. Thus, varying the EM rotational speed represents a recursive control problem. “Variable-speed and variable-displacement” control strategies address this issue [23,24,25,26], yet they have not been applied to NRMM, multi-actuator systems, or traditional open-hydraulic circuits. Existing studies use electric LS with digital feedback and/or relief valves rather than hydraulic cylinders, making them suitable for analyzing instantaneous power consumption but less effective in evaluating total energy use per duty cycle [23,24,25,26].
Therefore, this paper investigates and assesses progressively advanced control strategies, revealing the untapped potential of retrofitted battery-powered machinery. Specifically, these strategies are built on previous work which mainly focused on model validation [27,28,29], leverage look-up tables, model-based control principles, and engineering insights to facilitate understanding and implementation.
This paper is structured as follows: after introducing the case study, key components, and modeling, this study evaluates three control strategies while keeping the hydraulic system unchanged. The first strategy, called maximum displacement strategy (MDS), aims to operate the hydraulic pump (HP) at its maximum efficiency range, which happens at higher displacement. The optimal point strategy (OPS) enhances overall powertrain efficiency by considering both the EM and HP efficiencies. The variable load-sensing strategy (VLSS) introduces a third control variable, utilizing a servo-actuated valve to adjust the LS margin. Each strategy is compared against the existing standard to assess machine performance in terms of energy efficiency and cycle time. The study concludes with a critical discussion on the benefits and challenges of each approach, along with recommendations for future research.
2. Case Study
This study is based on the M15/M15e material handler by Officine Minelli s.r.l (Cazzago San Martino, Italy) shown in Figure 1 and the work was previously conducted by the authors in [27,28,29]. The M15e is a retrofitted variant of the original 75 kW ICE-powered M15, sharing most components except for the ICE and fuel tank.
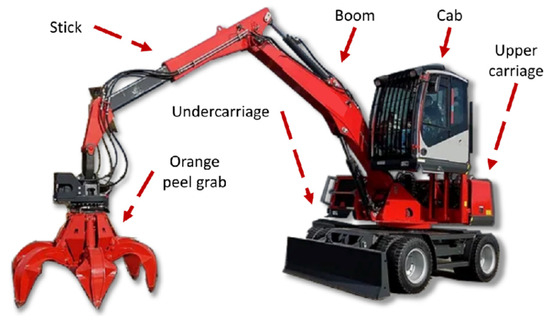
Figure 1.
Illustration of the M15/M15e hydraulic material handler and main mechanical substructures.
As shown in Figure 1, the machine’s overall structure, upper carriage rotation, and boom and stick actuation define its typical duty cycle, which resembles a pick-and-place operation. Notably, driving and longitudinal undercarriage movements have minimal impact on its typical use. The EM and HP are mounted in the upper carriage, and the hydraulic system is installed to transmit power throughout the machine. The upper carriage also hosts the energy storage system (ESS), which fully replaces the counterweight of the original ICE-powered variant, thereby minimizing differences in weight distribution between the two machines.
A simplified schematic of the hydraulic system is shown in Figure 2. The HP and EM rotate at the same speed. Hydraulic flow is directed to actuators via directional control valves (DCVs), which are operated by joystick and pedal pilot signals. The system features an LS pump. The boom and stick DCVs are post-compensated, while the turret DCV is pre-compensated with a priority valve. The LS system displacement varies based on a hydraulic control signal from the DCV. The pump outlet pressure and LS signal are compared to determine the LS margin , which remains constant in a traditional LS system. However, in this machine, a servo-actuated hydraulic valve allows LS margin adjustment.
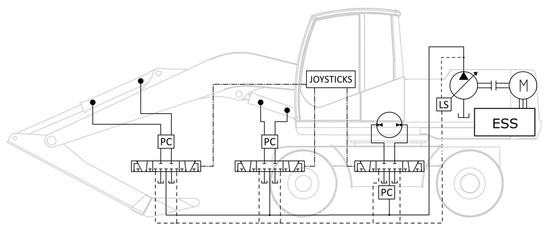
Figure 2.
Simplified representation of the M15/M15e powertrain system.
2.1. Modeling and Simulation
The case study is modeled using MATLAB, Simulink, and Simscape 2023b [30]: using a variable-step-ode23t solver with a maximum step size of 1 × 10⁻³ s, the model is able to complete the simulation in 86 s (average) per cycle. However, more information on modeling and validation is available in [27,28,29]. The model is organized into four main subsystems: the mechanical architecture and mechanics, the hydraulics, the EM, and the ESS. The mechanical subsystem is based on Simscape Multibody and includes the mechanical structure and data of the machine. The ESS is modeled as a zeroth-order equivalent circuit model (ECM) based on the datasheet provided by the supplier. Coulomb counting (1) is used to compute the state of charge (SoC) at any time step: is the nominal capacity of the battery in Ah and is the output current.
The EM is an asynchronous machine, with specifications listed in Table 1. Its energy model utilizes look-up tables, while Simscape’s internal solver accounts for its dynamic behavior. The efficiency map generated by means of these look-up tables is shown in Figure 3. A PID controller, tuned with experimental data, ensures accurate representation of EM dynamics [28].

Table 1.
Main technical data of the electric motor (EM) and load-sensing (LS) hydraulic pump (HP).
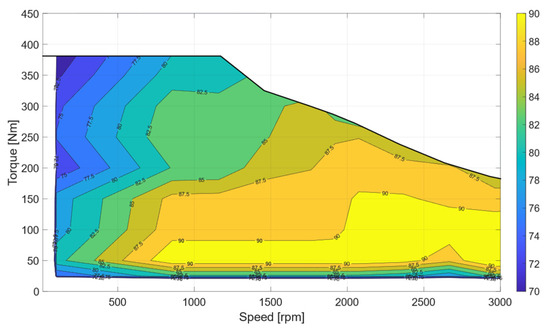
Figure 3.
Efficiency map of the EM controlled by means of an FOC inverter.
The main component of the hydraulic system is the LS pump, whose specifications are in Table 1. The Simscape pump model incorporates volumetric and hydromechanical efficiency and Figure 4 reports the efficiency map in relation to rotational speed, pressure, and displacement.
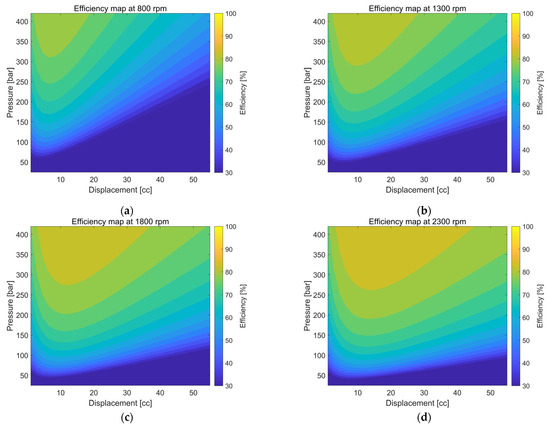
Figure 4.
Efficiency maps of the load-sensing (LS) hydraulic pump (HP) at four different rotational speeds: (a) 800 rpm; (b) 1300 rpm; (c) 1800 rpm; (d) 2300 rpm.
The modeled hydraulic components include the upper carriage motor, DCVs, pre- and post-compensation valves, tubes, and load-holding valves. Special attention is given to the LS system, as it regulates pump displacement and directly influences machine behavior.
2.2. Duty Cycles
This study evaluates machine performance using the two duty cycles reported in Figure 5. The first, the manufacturer duty cycle (MDC), was designed with the manufacturer to reflect real-world usage of the M15/M15e [28,29]. However, it exhibits flow saturation, which is a key limitation for engineering analysis, as most movements involve synchronous actuation of the boom, stick, and turret, exceeding the pump’s ideal maximum flow of 148.5 lpm.
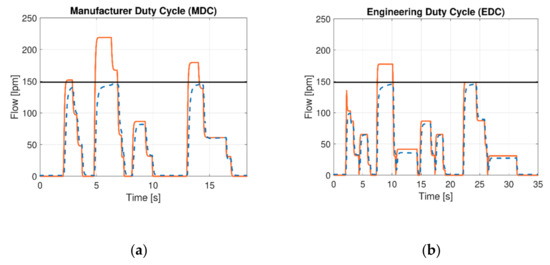
Figure 5.
Comparison between the flow requested by the joysticks (solid orange line), the actual flow (dashed blue line), and the ideal maximum available flow of 148.5 lpm provided by the HP (solid black line) for the two cycles: (a) MDC and (b) EDC.
To better analyze system performance and behavior, a simplified duty cycle called engineering duty cycle (EDC) is introduced. While still replicating the movements, it converts the synchronous flow-intensive operations into sequential operations, reducing flow demand and preventing saturation.
Figure 5a,b show the difference between the flow requested by the joysticks (dashed blue line), the actual flow (solid red line), and the ideal maximum available flow of 148.5 lpm provided by the HP (solid black line) for the two cycles MDC and EDC.
3. Control Strategies
To evaluate the potential of electrification without altering the original LS system, this section introduces and assesses a series of control strategies to enhance energy efficiency:
- The standard strategy (Std) (Section 3.1), which is the baseline and is inherited from the ICE variant;
- The maximum displacement strategy (MDS) (Section 3.2), which aims to operate the HP at its maximum efficiency range, which happens at higher displacement;
- The optimal point strategy (OPS) (Section 3.3), which enhances overall powertrain efficiency by considering the combined efficiency map of both the EM and HP;
- The variable load-sensing strategy (VLSS) (Section 3.4), which introduces a third control variable, utilizing a servo-actuated valve to adjust the LS margin.
As synthesized in Figure 6, from the original baseline to three increasingly sophisticated control strategies, the operator controls the machine through the joystick commands, while the strategies modify the response of the machine. Consequently, before looking at the results, each control strategy must be validated by verifying that the model can follow the reference inputs of EM speed ω and HP flow Q.
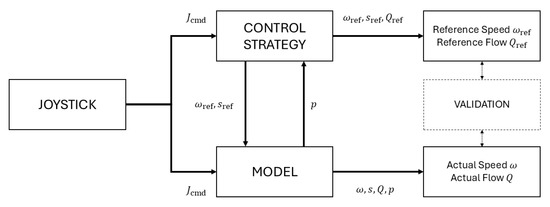
Figure 6.
Block diagram of the interaction between the control strategies and the model.
3.1. Standard Strategy (Std)
Traditionally, on the M15, the ICE runs at constant target speeds (idling, slow, and fast modes), while the operator controls the machine functions via joysticks and pedals, which act as velocity controllers. For instance, in the boom mechanism, greater movement of the joystick increases hydraulic flow to the cylinder, resulting in higher arm velocity. In the meantime, the LS system aims to maintain a constant pressure drop across the DCV, known as the LS margin s, set at 22 bar for the present case. Pump flow Q depends on displacement and motor speed ω (2). While the motor controller keeps ω as constant as possible, the LS system continuously adjusts via hydraulic feedback to sustain the LS margin, following (3): is the volumetric efficiency, is the flow coefficient, is the equivalent passage area function of the joystick request, and is the fluid density. This adjustment increases and, consequently, pump flow Q. The operator can only adjust machine behavior through the three motor speed targets ω.
On the M15e, this standard control strategy remains unchanged, thus the machine operates as if it were still using an ICE (constant rotational speed , constant LS margin value ), limiting possible electrification improvements.
3.2. Maximum Displacement Strategy (MDS)
As shown in Figure 3 and Figure 4, the HP efficiency increases with displacement, while the EM maintains a consistently higher efficiency range. Thereby, as advised also in [31], the first control strategy aims to adjust EM speed to maximize pump displacement.
Using (3), look-up tables are created to correlate joystick commands with the required actuator flow. The EM speed set-point ω is then varied using (2).
As demonstrated by the authors in [28,29], this strategy enables the displacement control even without a direct control input: the operator controls the flow Q through the joysticks, while the MDS regulates ω to keep the pump to its maximum feasible displacement. The LS margin remains constant at .
3.3. Optimal Point Strategy (OPS)
As shown in (2), the pump flow Q depends on both motor speed and pump displacement . Thus, from an energy perspective, an alternative control strategy can be explored to optimize overall efficiency (4), integrating the efficiency maps of both the EM and the pump into a single look-up table.
To create the look-up table displayed in Figure 7a, this study follows the steady-state approach used in [32], mapping different combinations of pressure p and flow Q to various speed ω and displacement settings.
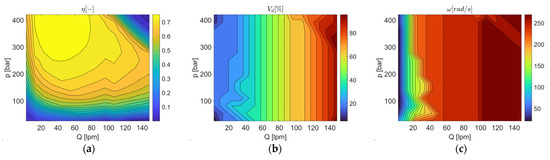
Figure 7.
Maps generated by means of the look-up tables of the combination of the EM and HP: (a) overall efficiency; (b) feasible displacement; and (c) feasible rotational speed.
By estimating flow (as in the MDS) and reading pressure p at each sample time, the strategy determines optimal operational points for machine control by means of a parallel Simulink model. As before, the LS margin remains unchanged.
The feasibility of this new strategy is validated using sets of movements to test every actuator in different conditions. Results for the validation are shown in Figure 8, where the reference is set by look-up tables based on (3) and already validated for the MDS.
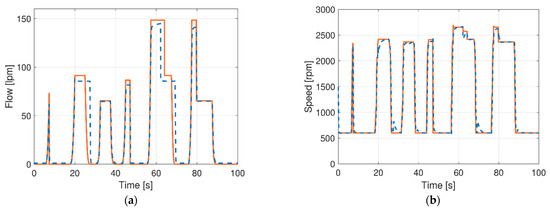
Figure 8.
Validation results for the OPS: reference (solid orange line) and simulation (dashed blue line): (a) flow and (b) speed.
Inside the model of the machine, as synthesized in Figure 6, the efficiency maps of the combination of EM and HP are applied in series to the joystick signals, thus influencing the input of the EM.
3.4. Variable Load-Sensing Strategy (VLSS)
The third control strategy utilizes the servo-actuated valve already integrated into the pump (valve “2” in Figure 9). In the ICE variant, this valve prevents engine stalling under high torque demand, while in the battery-powered variant, it mitigates extreme power peaks. As shown in Figure 9, this protection mechanism overrides the LS spring force (valve “1”) by actuating the solenoid (valve “2”), creating an additional flow passage. Assuming that this valve’s performance is suitable for real-time control, it introduces a third feasible input variable for machine control without altering the hydraulic system. By adjusting the LS pressure drop s, the flow and pressure shift can achieve a higher overall efficiency . The resulting actuator speed variation is considered negligible from an operator’s perspective, as observed in [33] through dedicated hydraulic bench tests.
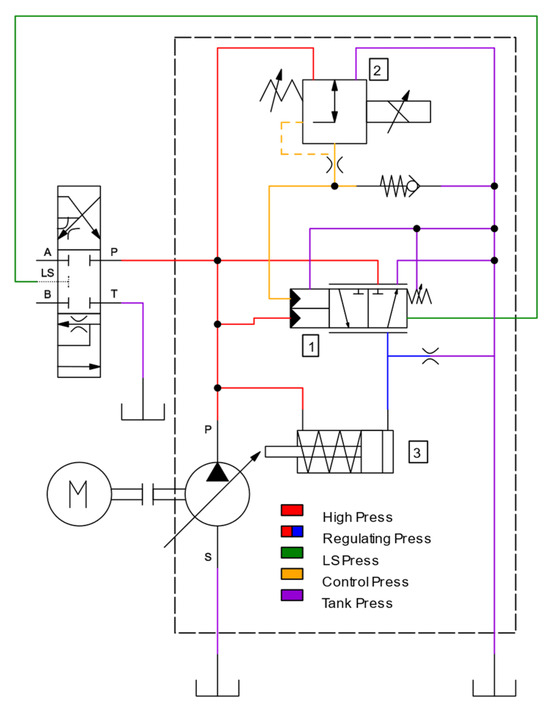
Figure 9.
Simplified schematic of the internal hydraulic system of the pump for adjusting the displacement: (1) main LS valve; (2) variable LS margin valve; (3) LS displacement actuator [29].
In simple terms, three main processes determine the VLSS control strategy:
- Compute the expected flow Q using the same look-up table as MDS and OPS.
- Read the pressure at each time step.
- Evaluate how pressure and flow vary under different LS margins.
The system estimates efficiency for four LS margin values (s = 22, 18, 14, 12 bar) mapping them to look-up tables to identify best efficiency operating points. The most efficient setting is then selected to control EM speed ω and LS margin s. The first two margin values of 18 and 14 bar are selected due to their equidistance from the reference of 22 bar, while the additional value of s = 12 bar is used to assess the impact of a smaller deviation.
3.4.1. Flow Estimation
As discussed in (3), reducing the LS margin s decreases the pump flow Q from the baseline scenario to the new scenario , creating a flow deficit (5). However, as visible in (6), is computed by means of a correction coefficient , which varies the estimated by considering the effects given by the DCV “V” and DCV compensators PC.
To ensure simultaneous actuation of multiple functions, flow estimation accounts for all possible flow paths and potential flow saturation. For instance, in the case of the boom, when flow saturation occurs, the saturated flow is computed using (7).
Figure 10 compares the results of the flow estimation methodology using three LS margin values on two different sets of movements: the first evaluates single movements, the second assesses synchronous movements.
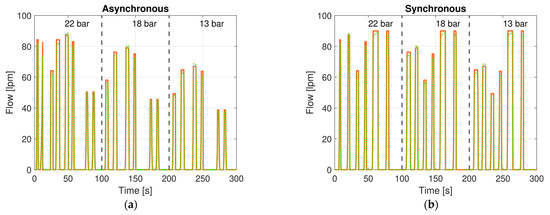
Figure 10.
Flow estimation of (a) the single movement and (b) the synchronous movement with three different LS settings: reference flow (solid orange line) and estimated flow (dotted green line) [29].
The flow estimation is also evaluated using the mean absolute error (MAE), the root mean squared error (RMSE), and the coefficient of determination R2 (Table 2). The performance of the estimation is particularly highlighted by the R2 value of 0.98.
Table 2.
Performance evaluation indexes for the flow estimation.
3.4.2. Pressure Estimation
To estimate pressure variation between two time-instants, three key pressure drops must be considered: DCV supply orifice, DCV return orifice, and load-holding valve (excluding the turret). Starting from the pressure drop across the DCV supply orifice, when flow saturation does not occur, it is determined by the difference between the previous LS margin and the current LS margin (8).
However, when flow saturation occurs, the LS margin decreases to . This results in a different LS margin variation (9).
As visible in (10), to estimate the pressure drop caused by the DCV return orifice , it is necessary to also compute the return flow . The return flow is related to by the cylinder ratio τ; thus, is different when the cylinder is retracting or extending.
The third contribution is the pressure drop of the load-holding valve , which has a significant effect only when the arm is lowering. Its contribution is as follows in (11).
To validate pressure estimation, the model is first tested with the LS margin s = 22 bar, then re-simulated at lower values while keeping flow rate and load pressure constant. The quality of the estimation is assessed by comparing simulation results at different LS margins: the reference pressure (s = 22 bar) is used to compute the estimated pressure by means of (9), (10), and (11); the measured pressure signals are obtained from the simulation.
Results for the boom, stick, and turret with two lower margins (taking, for instance, s = 18 bar and s = 15 bar) are reported in Figure 11, Figure 12, and Figure 13, respectively.

Figure 11.
Pressure estimation for the boom at s = 18 bar (a) and s = 15 bar (b) reference pressure (solid orange line), estimated pressure (dashed blue line), and measured pressure (dotted green line).
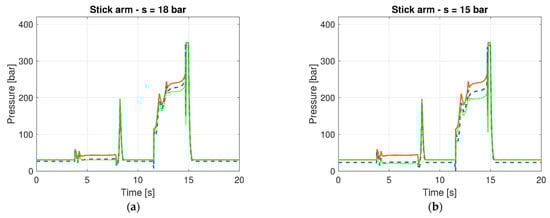
Figure 12.
Pressure estimation for the stick at s = 18 bar (a) and s = 15 bar (b) reference pressure (solid orange line), estimated pressure (dashed blue line), and measured pressure (dotted green line).
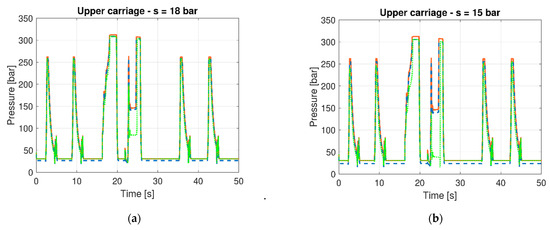
Figure 13.
Pressure estimation for the upper carriage at s = 18 bar (a) and s = 15 bar (b) reference pressure (solid orange line), estimated pressure (dashed blue line), and measured pressure (dotted green line).
In Figure 11, Figure 12 and Figure 13, as visible near the end of the two movements, the green line lags behind the other two because of the flow reduction from the lower LS margin, slightly reducing machine velocity. This phenomenon is caused by the flow reduction imposed by the lower value of the LS margin, which slightly reduces the velocity of the machine. Nonetheless, this lag has no effects on the usage of the estimator during the simulation and/or usage of the machine, since the estimator computation is updated at every sample time.
4. Results
The case study model is utilized to simulate the proposed control strategies and assess their effect on energy consumption. The simulations incorporate both the aforementioned duty cycles (MDC and EDC) and are conducted under four different load conditions at the far end of the stick: 300 kg, 600 kg, 900 kg, and 1200 kg. Figure 14 provides a graphical representation of the results for the engineering duty cycle (EDC) at 1200 kg, displaying the energy consumptions within the powertrain, considering the outputs at the mechanical actuators, hydraulic pump, electric motor, and battery outlet. All loads have similar behavior for both the duty cycles.
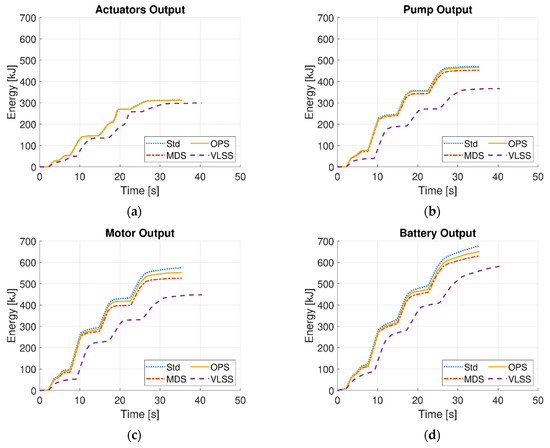
Figure 14.
Energy outputs using the EDC at 1200 kg for all the control strategies: standard control strategy (Std), maximum displacement strategy (MDS), optimal point strategy (OPS), and variable load-sensing strategy (VLSS); (a) actuators output (b) pump output (c) motor output (d) battery output.
Complementing Figure 14, Table 3 presents the efficiency of key powertrain components, the total energy consumption, and the global machine efficiency. Overall, the energy plots at the battery outlet (Figure 14d) confirm that the standard control strategy is the most energy-intensive, whereas the VLSS consistently achieves the highest efficiency, up to a maximum overall efficiency of 51.4%.
Table 3.
Results obtained with EDC considering the pump efficiency , EM efficiency , pump and EM assembly efficiency , hydraulic system efficiency , overall efficiency , and overall energy consumption. Energy saving of each strategy (MDS, OPS, and VLSS) is consistently computed with respect to the standard control strategy (Std).
A closer examination reveals that the mechanical output energy remains largely unaffected by the control strategy (Figure 14a), but a small deviation is observed in the VLSS, where pressure and flow variations slightly reduce the acceleration, and consequently, the inertia contribution. Despite this negligible contribution, the major enhancement of the VLSS over the other strategies is measured at the HP (Figure 14c), which is explained by the lower LS margins, and consequently, lower hydraulic losses.
Remarkably, MDS constantly outperforms OPS, establishing itself as the second most efficient strategy. This is largely attributed to MDS improving both HP efficiency and hydraulic system efficiency, while minimally impacting the efficiency of the EM. Indeed, as reported in Table 3, the MDS achieves an average HP efficiency of 86.2%, while the OPS limits to 84.3%. As expected, the OPS has a greater electric motor efficiency , but the combined efficiency confirms the superiority of the MDS over the OPS. This unexpected outcome is linked to frequent variation in OPS in working points in both the pump and EM, while the MDS promotes smoother driveline operation. A similar pattern is observed in VLSS, where continuous working point adjustments resemble those of OPS, slightly reducing the combined efficiency of the pump and EM. In this regard, it is worth noting that the HP efficiency is more sensitive to the displacement than the EM efficiency is to rotational speed (Figure 3 and Figure 4). This outcome demonstrates that the displacement variation has a greater impact on the combined efficiency than rotational speed.
Beyond energy efficiency, the impact of the control strategies on operational time is also examined; indeed, as clearly visible for the VLSS in Figure 14, the strategies affect the acceleration and thus the time required to complete the duty cycles. The results indicate that the Std strategy and OPS are the fastest, while MDS is only negligibly slower. Indeed, the higher hydraulic losses in the Std and OPS strategies suggest that they provide more flow to the hydraulic system, allowing for quicker execution of movements. As clearly visible in the plots of Figure 14, the VLSS, despite its energy efficiency, slows the machine by up to 14%, as the lower LS margins decrease the available hydraulic flow. Overall, the VLSS guarantees the best energy-to-load ratio, ensuring that the machine can complete a greater number of cycles with the same energy. Consequently, this reduction in speed does not necessarily hinder performance in all applications and may be viewed as an acceptable compromise in favor of improved energy efficiency. Nonetheless, lower speed may become a critical limitation in scenarios where minimizing cycle time takes precedence over energy consumption minimization.
5. Discussion
Overall, the simulation results demonstrate that VLSS is the most energy-efficient strategy, providing the highest energy savings. Meanwhile, MDS emerges as the best compromise, balancing energy efficiency and operational speed effectively. Notably, the fact that MDS consistently outperforms OPS suggests that increased control complexity does not always yield better results.
Most importantly, these improvements are achieved by leveraging fundamental hydraulic principles, preserving the existing hydraulic system, and avoiding complex optimization algorithms, which could hinder real-world implementation due to higher up-front costs of innovative components, excessive redesign, or computing limitations of on-board electronics. Another key advantage lies in the fact that, if implemented in real-world applications, operators may dynamically choose between VLSS and MDS depending on their immediate requirements, favoring VLSS for maximum efficiency or MDS for an optimal balance of speed and energy savings.
Nonetheless, despite the positive outcomes of this study, it also highlights the significance of hydraulic losses and the necessity of exploring more advanced or disruptive solutions to achieve greater energy efficiency gains.
6. Conclusions
Building on modeling and simulation, the following section presents the key findings and reflections derived from the study and its results.
After introducing the machine’s mechanical and hydraulic architectures, providing an overview of the model, and presenting the two duty cycles used in simulations, this study outlines the standard control strategy (Std) to establish a baseline understanding before detailing the increasingly sophisticated novel control strategies. The first strategy, maximum displacement strategy (MDS), capitalizes on the higher efficiency of the hydraulic pump at greater displacement levels. The second, optimal point strategy (OPS), seeks to optimize the combined efficiency of the EM and hydraulic pump. The final strategy, variable load-sensing strategy (VLSS), introduces adjustable LS margins using a servo-actuated valve, which is already installed on the machine but previously underutilized.
Overall, across all tested load conditions, the standard control strategy consistently exhibits the highest energy consumption, while the new strategies achieve energy savings between 4.0% and 14.2%, averaging around 8.5%. Meanwhile, the efficiency improvement between the worst and the best strategy is about 11.5%. These improvements originate primarily from reduced hydraulic losses, particularly through lower LS margins. However, a trade-off emerges between the enhanced efficiency of the hydraulic system and the reduced efficiency of the EM and hydraulic pump. The results indicate that traditional hydraulics, when coupled with an electric powertrain, still offer untapped efficiency potential.
Despite these findings, further analysis is required to validate the effectiveness of these control strategies through real-world testing. Additionally, on a broader scale, the total cost of ownership may play a crucial role in driving wider adoption of electrified NRMM and should therefore be carefully evaluated in future studies.
Author Contributions
Conceptualization, M.F., D.B. and S.U.; methodology, M.F., D.B., T.M. and S.U.; software, M.F., D.B. and V.P.S.; validation, S.U.; formal analysis, M.F. and D.B.; investigation, M.F., D.B. and V.P.S.; resources, T.M. and S.U.; data curation, M.F. and D.B.; writing—original draft preparation, M.F. and D.B.; writing—review and editing, T.M. and S.U.; visualization, V.P.S.; supervision, T.M. and S.U.; project administration, S.U.; funding acquisition, T.M. and S.U. All authors have read and agreed to the published version of the manuscript.
Funding
This research was funded by the Italian Government, grant number PON DM1061 of “Ministero dell’Università e della Ricerca”, and internal funds of IHA–Innovative Hydraulics and Automation lab of the Tampere University, Finland.
Data Availability Statement
Data presented in this study are available upon request to the corresponding author. The data are not publicly available due to the privacy policy of the University of Brescia, Italy.
Acknowledgments
The authors sincerely thank Officine Minelli s.r.l., namely Graziano Bodei, Marcello Galperti, and Roberto Fiorini for their ongoing assistance. During the preparation of this work the authors used ChatGPT and Claude to correct grammar and improve clearness, readability, and conciseness. After using this tool/service, the authors reviewed and edited the content as needed and take full responsibility for the content of the published article.
Conflicts of Interest
The authors declare that they have no known competing financial interests or personal relationships that could have appeared to influence the work reported in this paper.
Abbreviations
The following abbreviations are used in this manuscript:
| DCV | Directional Control Valve |
| ECM | Equivalent Circuit Model |
| EDC | Engineering Duty Cycle |
| EM | Electric Motor |
| ESS | Energy Storage System |
| HP | Hydraulic Pump |
| ICE | Internal Combustion Engine |
| LS | Load-Sensing |
| MAE | Mean Absolute Error |
| MDC | Manufacturer Duty Cycle |
| MDS | Maximum Displacement Strategy |
| NRMM | Non-Road Mobile Machinery |
| OPS | Optimal Point Strategy |
| PC | Pressure Compensator |
| RMSE | Root Mean Squared Error |
| Std | Standard Strategy |
| SoC | State of Charge |
| SME | Small- and Medium-sized Enterprise |
| VLSS | Variable Load-Sensing Strategy |
References
- Dornoff, F.; Rodriguez, F. Euro 7: The new emission standard for light- and heavy-duty vehicles in the European Union. In Summarizes Regulatory and Other Developments Related to Clean Transportation Worldwide; International Council on Clean Transportation: Berlin, Germany, 2024; Available online: https://theicct.org/wp-content/uploads/2024/03/ID-116-%E2%80%93-Euro-7-standard_final.pdf (accessed on 29 April 2024).
- Presidenza del Consiglio dei Ministri Decreto-Legge 2 Marzo 2024 n. 19. Gazzetta Ufficiale della Repubblica Italiana. Available online: https://www.gazzettaufficiale.it/eli/id/2024/03/02/24G00035/sg (accessed on 29 April 2024).
- González Palencia, J.C.; Sakamaki, T.; Araki, M.; Shiga, S. Impact of powertrain electrification, vehicle size reduction and lightweight materials substitution on energy use, CO2 emissions and cost of a passenger light-duty vehicle fleet. Energy 2015, 93, 1489–1504. [Google Scholar] [CrossRef]
- Beltrami, D.; Iora, P.; Tribioli, L.; Uberti, S. Electrification of Compact Off-Highway Vehicles—Overview of the Current State of the Art and Trends. Energies 2021, 14, 5565. [Google Scholar] [CrossRef]
- Casoli, P.; Scolari, F.; Minav, T.; Rundo, M. Comparative Energy Analysis of a Load Sensing System and a Zonal Hydraulics for a 9-Tonne Excavator. Actuators 2020, 9, 39. [Google Scholar] [CrossRef]
- Malavatu, J.; Kandke, S.R.; Gupta, S.; Agrawal, B. Design Challenges in Electrification of Off-highway Applications. In Proceedings of the 2019 IEEE Transportation Electrification Conference, Bengaluru, India, 17–19 December 2019; pp. 1–5. [Google Scholar] [CrossRef]
- Global Agriculture Equipment Market Share by Company. Statista. 2021. Available online: https://www.statista.com/statistics/1365903/global-agriculture-equipment-market-share-by-company/ (accessed on 29 April 2024).
- Global Construction and Mining Equipment Market Share by Company. Statista. 2023. Available online: https://www.statista.com/statistics/1365901/global-construction-and-mining-equipment-market-share-by-company/ (accessed on 29 April 2024).
- Fassbender, D. Towards Energy-Efficient Electrified Mobile Hydraulics: Considering Varying Application Conditions. Ph.D. Thesis, Tampere University, Tampere, Finland, 2023. [Google Scholar]
- An, K.; Kang, H.; An, Y.; Park, J.; Lee, J. Methodology of Excavator System Energy Flow-Down. Energies 2020, 13, 951. [Google Scholar] [CrossRef]
- Love, L.J.; Eric, L.; Pete, A. Estimating the Impact (Energy, Emissions and Economics) of the US Fluid Power Industry; Office of Scientific and Technical Information: Oak Ridge, TN, USA, 2012. [CrossRef]
- Wang, L.; Zhao, D.; Wang, Y.; Wang, L.; Li, Y.; Du, M.; Chen, H. Energy management strategy development of a forklift with electric lifting device. Energy 2017, 133, 435–446. [Google Scholar] [CrossRef]
- Mahato, A.C.; Ghoshal, S.K. Energy-saving strategies on power hydraulic system: An overview. Proc. Inst. Mech. Eng. Part I J. Syst. Control Eng. 2021, 235, 147–169. [Google Scholar] [CrossRef]
- Pellegri, M.; Green, M.; Macpherson, J.; McKay, C.; Caldwell, N. Applying a multi-service digital displacement® pump to an excavator to reduce valve losses. In Proceedings of the 12th International Fluid Power Conference, Dresden, Germany, 12–14 October 2020; pp. 59–68. [Google Scholar] [CrossRef]
- Habibi, S.; Goldenberg, A. Design of a new high-performance electrohydraulic actuator. IEEE/ASME Trans. Mechatron. 2000, 5, 158–164. [Google Scholar] [CrossRef]
- Zhang, S.; Minav, T.; Pietola, M.; Kauranne, H.; Kajaste, J. The effects of control methods on energy efficiency and position tracking of an electro-hydraulic excavator equipped with zonal hydraulics. Autom. Constr. 2019, 100, 129–144. [Google Scholar] [CrossRef]
- Fassbender, D.; Zakharov, V.; Minav, T. Utilization of electric prime movers in hydraulic heavy-duty-mobile-machine implement systems. Autom. Constr. 2021, 132, 103964. [Google Scholar] [CrossRef]
- Lin, T.; Lin, Y.; Ren, H.; Chen, H.; Chen, Q.; Li, Z. Development and key technologies of pure electric construction machinery. Renew. Sustain. Energy Rev. 2020, 132, 110080. [Google Scholar] [CrossRef]
- Qu, S.; Fassbender, D.; Vacca, A.; Busquets, E. A high-efficient solution for electro-hydraulic actuators with energy regeneration capability. Energy 2021, 216, 119291. [Google Scholar] [CrossRef]
- Fu, S.; Wang, L.; Lin, T. Control of electric drive powertrain based on variable speed control in construction machinery. Autom. Constr. 2020, 119, 103281. [Google Scholar] [CrossRef]
- Bonato, C.; Minav, T.A.; Sainio, P.; Pietola, M. Position Control of Direct Driven Hydraulic Drive. In Proceedings of the 8th FPNI Ph.D Symposium on Fluid Power, Lappeenranta, Finland, 11–13 June 2014. [Google Scholar] [CrossRef]
- Mu, H.; Cheng, M.; Tang, X.; Ding, R.; Ma, W. A hybrid distributed-centralized load sensing system for efficiency improvement of electrified construction machinery. Energy 2025, 314, 134123. [Google Scholar] [CrossRef]
- Jin, R.; Huang, H.; Li, L.; Zhu, L.; Liu, Z. Energy Saving Strategy of the Variable-Speed Variable-Displacement Pump Unit Based on Neural Network. Procedia CIRP 2019, 80, 84–88. [Google Scholar] [CrossRef]
- Reichert, W.; Leonhard, A.; Päßler, T.; Kurth, R.; Ihlenfeldt, S. Implementation of an Electro-Hydraulic Drive Unit with Two Control Variables in a Drawing Cushion Application. Eng. Proc. 2022, 26, 18. [Google Scholar] [CrossRef]
- Yan, Z.; Ge, L.; Quan, L. Energy-Efficient Electro-Hydraulic Power Source Driven by Variable-Speed Motor. Energies 2022, 15, 4804. [Google Scholar] [CrossRef]
- Huang, H.; Jin, R.; Li, L.; Liu, Z. Improving the energy efficiency of a hydraulic press via variable-speed variable-displacement pump unit. J. Dyn. Syst. Meas. Control 2018, 140, 111006. [Google Scholar] [CrossRef]
- Beltrami, D.; Ferrari, M.; Iora, P.G.; Uberti, S. Application of Physics-Based Modeling Techniques as a Tool to Help the Development of More Electrified Off-Highway Machinery. In Design Tools and Methods in Industrial Engineering III; Lecture Notes in Mechanical Engineering; Springer: Cham, Switzerland, 2024; pp. 497–504. [Google Scholar] [CrossRef]
- Ferrari, M.; Beltrami, D.; Uberti, S. Retrofitting Battery Electric Machinery with Unchanged Hydraulic System and Enhanced Control Strategies. Actuators 2024, 13, 191. [Google Scholar] [CrossRef]
- Ferrari, M. Reduction of the Consumption of Hydraulics Material Handlers with the Improvement of On-Board Devices and Control Logic; University of Brescia: Brescia, Italy, 2025. [Google Scholar]
- The MathWorks Inc. Simscape–MATLAB. Available online: https://www.mathworks.com/products/simscape.html (accessed on 23 August 2023).
- Lin, T.; Lin, Y.; Ren, H.; Chen, H.; Li, Z.; Chen, Q. A double variable control load sensing system for electric hydraulic excavator. Energy 2021, 223, 119999. [Google Scholar] [CrossRef]
- Roshandel, E.; Mahmoudi, A.; Kahourzade, S.; Soong, W.L. Efficiency Maps of Electrical Machines: A Tutorial Review. IEEE Trans. Ind. Appl. 2023, 59, 1263–1272. [Google Scholar] [CrossRef]
- Rose, S.; Hoffmann, D.; Wiedmer, F.; Rill, V. Solutions for Energy-Efficient and Easy Implementable Electrified Variable-Speed Pump Drives in Mobile Applications. In Proceedings of the 14th International Fluid Power Conference, Dresden, Germany, 19–21 March 2024; River Publishers: Gistrup, Denmark, 2024; pp. 785–796. [Google Scholar]
Disclaimer/Publisher’s Note: The statements, opinions and data contained in all publications are solely those of the individual author(s) and contributor(s) and not of MDPI and/or the editor(s). MDPI and/or the editor(s) disclaim responsibility for any injury to people or property resulting from any ideas, methods, instructions or products referred to in the content. |
© 2025 by the authors. Licensee MDPI, Basel, Switzerland. This article is an open access article distributed under the terms and conditions of the Creative Commons Attribution (CC BY) license (https://creativecommons.org/licenses/by/4.0/).