Abstract
Planetary gearbox serves as a key transmission component in planetary ball screw actuator systems. Under the action of alternating loads, the stress concentration locations of the planet carrier in actuators with planetary gear trains are prone to fatigue cracks, which can lead to catastrophic system breakdowns. However, due to the complex vibration transmission path and the interference of uninterested vibration components, the characteristic modulation signal is ambiguous, so it is challenging to diagnose this fault. Therefore, this paper proposes a new fault diagnosis method. Firstly, a vibration signal model is established to accurately characterize the amplitude and phase modulation effects caused by cracked carriers, providing theoretical guidance for fault feature identification. Subsequently, three novel sideband evaluators of the modulation signal bispectrum (MSB) and their parameter selection ranges are proposed to efficiently locate the optimal fault-related bifrequency signatures and reduce computational cost, leveraging the effects identified by the model. Finally, a novel health indicator, the mean absolute root value (MARV), is used to monitor the state of the planet carrier. The effectiveness of this method is verified by experiments on the planetary gearbox test rig. The results show that the robustness of the amplitude and phase modulation effect of the cracked carrier in the low-frequency band is significantly higher than that in the high-frequency band, and the initial carrier crack can be accurately identified using this phenomenon under different operating conditions. This study provides a reliable solution for the condition monitoring and health management of the actuation system, which is helpful to improve the safety and reliability of operation.
1. Introduction
From industrial robots to transportation vehicles, the reliable operation of actuators is crucial in a wide range of industrial applications. As shown in Figure 1, the planetary ball screw actuator system is mainly composed of actuator control and drive units, motor, gearbox, and ball screw pair [1]. As a core power-transmitting component in the planetary ball screw actuator, the health of planetary gearboxes directly determines overall performance and safety. In addition to the much-watched gears and planet gear bearings in the gearbox, the planetary carrier is subject to cyclic loads and is prone to fatigue cracks. Undetected cracks can spread quickly, resulting in complete failure and costly downtime. In 2002, fatigue cracks were discovered at the root of planet gear mounting posts in helicopter main gearboxes, leading to the immediate grounding and inspection of hundreds of Black Hawk helicopters [2]. Due to concealed location within the main gearbox housing, early-stage fatigue cracks in planetary carriers of actuation systems are particularly challenging to detect effectively and promptly using existing inspection methods [3]. To ensure the high reliability and operational readiness of actuators, developing advanced early crack diagnosis technology is of great practical significance.
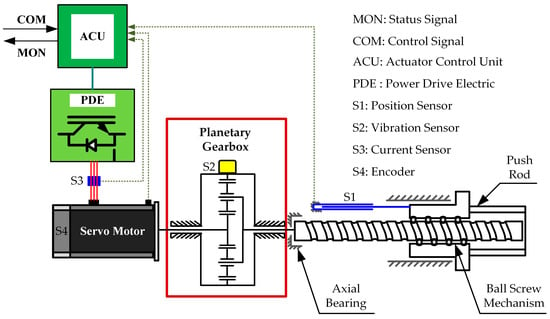
Figure 1.
Schematic diagram of planetary ball screw actuator.
Fatigue crack detection in critical components traditionally relies on physical techniques such as ultrasonic testing [4,5], vibration analysis [6,7], and acoustic emission [8,9]. While effective, these model-driven approaches can be limited by complex signal interpretation. Recently, data-driven methods powered by artificial intelligence, such as transferable deep reinforcement learning for fatigue life prognosis [10], have emerged as powerful alternatives. Nevertheless, their dependence on labeled data and limited physical interpretability poses challenges for practical applications.
To realize the healthy management of the planetary carrier, Keller et al. [11] developed sideband indices from time-synchronous averaged vibration signals to detect planetary carrier cracks in lab conditions but noted their ineffectiveness in noisy operational environments. Sparis et al. [12] proposed an energy-based E-feature for crack characterization using TSA-processed signals, while Hines et al. [13] introduced an energy ratio feature, though its accuracy suffers under acceleration variations. Blunt et al. [2] demonstrated that torque fluctuations significantly alter spectral amplitude and phase, enabling crack detection through Fourier analysis of TSA-separated planet gear vibrations. Patrick et al. [14,15] developed a signal model incorporating gear meshing dynamics and transmission path modulation, establishing diagnostic indicators based on sideband amplitude variations at meshing frequencies. Hecke et al. [16] formulated the Cis index from TSA signals, whereas Wang et al. [17] integrated TSA, vibration separation, and narrowband demodulation for amplitude-phase feature extraction.
Frequency components, amplitudes, and phases in vibration spectra provide critical features for planetary carrier crack detection. However, the complex structure of actuator-integrated gearboxes and internal or external excitations result in highly intricate spectral components, while amplitude and phase variations are susceptible to speed fluctuations. Consequently, robust condition indicators capable of distinguishing cracked from healthy carriers remain lacking. Existing spectral analysis methods primarily focus on gear meshing frequencies and their modulation sidebands. Yet, these sidebands often overlap with those from normal gear excitations, complicating fatigue crack diagnosis. The absence of fundamental studies on vibration excitation and response mechanisms for planetary carrier cracks further limits detection reliability. More accurate and robust diagnostic approaches are still needed.
Beyond characteristic frequency extraction, McFadden demonstrated that phase information in vibration signals provides superior early warning for fatigue cracks in gear systems, employing amplitude-phase demodulation of meshing vibrations for crack detection [18]. Unlike conventional spectra that only reveal frequency and amplitude, bispectrum analysis extracts phase information and characterizes system nonlinearity, effectively identifying non-Gaussian features while suppressing Gaussian noise [19]. Modulation signal bispectrum (MSB) extends conventional bispectral analysis by incorporating sideband information, utilizing phase relationships between frequency components to resolve quadratic phase coupling and demodulate intrinsic modulation frequencies [20].
Xu et al. [21] developed an MSB-enhanced squared envelope spectrum method for detecting compound faults in sun gears and planet gears. Guo et al. [22] employed AR filters and MSB to suppress non-Gaussian and Gaussian noise, respectively, for rolling bearing fault feature extraction. Xu et al. [23] proposed an MSB sideband evaluator-based method for ball bearing condition monitoring. Zhang et al. [24] introduced an MSB-SE approach for gear wear monitoring through complex modulation signal analysis. Tian et al. [25] established an MSB sideband evaluator-based method enabling sparse representation and weak feature extraction in compound fault diagnosis for planetary gearboxes. Guo et al. [26] developed localized MSB to demodulate fault features from different components. Han et al. [27] demonstrated MSB effectiveness in capturing subtle modulation features for gear health monitoring and degradation assessment. Yang et al. [28] advanced harmonic MSB by accounting for carrier-modulation frequency coupling relationships to identify characteristic frequency bands. These studies collectively demonstrate MSB’s superior capability in gear and bearing vibration analysis, suggesting its potential for solving planetary carrier fatigue crack detection challenges.
The key challenge lies in the fact that the vibration signals from a cracked carrier exhibit complex cross-term modulation components that are buried in interference components. Moreover, crack-induced frequency components and their amplitude and phase information are susceptible to noise interference and speed fluctuations, posing significant difficulties in robust feature extraction. Most existing methods lack a precise physical model to describe this phenomenon and a powerful signal processing tool to isolate it.
To bridge this gap, this paper proposes a novel framework that integrates a vibration signal model with modulation signal bispectrum analysis. The primary contributions of this work are threefold:
Firstly, a novel vibration signal model that explicitly incorporates the modulation effects of frequency and phase caused by the time-varying positional relationship between the cracked carrier and the fixed sensors is developed, providing a more accurate theoretical foundation for fault feature generation.
Secondly, the modulation signal bispectrum is introduced to design three novel sideband evaluators and their parameter selection strategy, which enable efficient identification of optimal fault signatures while significantly reducing computational cost.
Finally, the proposed novel health indicator (MARV) shows high accuracy and strong robustness in diagnosing early-stage planetary gear carrier cracks, demonstrating its potential for integration into prognostic and health management (PHM) systems for smart actuation.
The remainder of this paper is organized as follows: Section 2 details the vibration signal model of a planetary gearbox with a cracked carrier. Section 3 introduces the principle of three novel sideband evaluators and their parameter selection strategy, and presents the experimental results and discussion of the proposed methods. Section 4 describes the novel detection indicator and demonstrates its effectiveness and robustness through experiments. Finally, Section 5 concludes the paper.
2. Vibration Signal Model to Characterize Fault Features
In the planetary gear system of an actuator, with the sun gear as input and the carrier as output, the tooth numbers of the sun gear, planet gear, and ring gear are denoted as Zs, Zp, and Zr, respectively. When the sun gear rotation frequency is finput, the carrier rotation frequency, meshing frequency, and planet gear spin frequency relative to the carrier are computed as follows [18,29]:
As shown in Figure 2, fatigue cracks reduce the stiffness of the planetary carrier, causing the planetary gears to deviate from their ideal rotational centers. This results in two periodic excitations: displacement errors and stiffness variations. The induced linear excitation forces in the planet–ring gear pair consist of displacement error excitation forces with a fundamental frequency equal to the planet gear rotation frequency relative to the carrier and mesh stiffness excitation forces with a fundamental frequency equal to the gear mesh frequency.
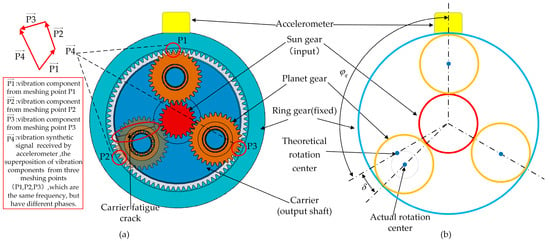
Figure 2.
Planetary gear set with three planetary gears: (a) planetary gear carrier crack and the signal superposition diagram; (b) the actual rotation center of the planetary gear deviates from the ideal center position.
The displacement error excitation force induced by fatigue cracks between the q-th planet gear and ring gear contains fundamental and harmonic components of the planet gear rotation frequency, which can be expressed in Fourier series form [29]:
where dl represents the amplitude of the l-th order excitation force, with Dl being the corresponding Fourier coefficient; fp denotes the planet gear rotation frequency relative to the carrier; Zᵣ and Zₚ are the tooth numbers for the ring gear and planet gear, respectively. As shown in Equation (6), represents the superposition of the installation angle of the q-th planet gear and the relative angular displacement caused by fatigue cracks.
where Q represents the total number of planetary gears in the planetary gear train.
The meshing stiffness excitation force between the q-th planet gear and ring gear, induced by planetary carrier fatigue cracks, contains meshing frequency components and their harmonics, which can be expressed in Fourier series form as follows [29]:
where am is the amplitude of the m-th order excitation force, Am represents the corresponding Fourier coefficient, and fm denotes the meshing frequency. The displacement error excitation and mesh stiffness excitation terms follow conventional modeling practices using Fourier decomposition and linear superposition [14,29,30]. The distinguishing feature of the present work is the application of these relations to carrier cracks, a failure mode less frequently modeled compared to tooth defects or bearing faults.
As shown in Figure 2a, the vibration transmission path from the q-th planet gear to the ring gear exhibits periodic variation with the carrier rotation, which can be modeled as a time-varying transfer function [29].
where wk is the amplitude of the k-th frequency component, Wk represents the corresponding Fourier coefficient, and fc denotes the rotational frequency of the carrier.
The planetary gear train is treated as a linear system, where the vibration measured by the sensor is the linear superposition of the vibrational responses generated by individual planet gears. Accounting for the amplitude modulation induced by time-varying transmission paths, the total vibration response can be expressed as follows:
According to Equation (9) and the Fourier transform principle, the characteristic frequency components generated by displacement error excitation and meshing stiffness excitation can be expressed as follows:
From Equation (10), the frequency components of the displacement error excitation induced by a carrier crack are characterized by the planet gear rotation frequency and its harmonics as carrier frequencies, modulated by the carrier rotation frequency. From Equation (11), the frequency components generated by meshing stiffness excitation take the meshing frequency and its harmonics as carrier frequencies, with carrier rotation frequency acting as the modulation frequency. The behavior of frequency components lfp + kfc and mfmesh + kfc can be utilized for characterizing carrier fatigue cracks.
From Equation (9), the phase corresponding to the frequency components lfp + kfc can be quantified as follows:
where ∆θl,k represents the inherent phase variation in lfp + kfc, which depends on the sideband orders l and k, the number of planet gear teeth Zp, the number of ring gear teeth Zr, and the planet gear mounting angle φq. ∆θl,k denotes the phase variation induced by the angular displacement δ of the planet gear due to fatigue crack, while l(Zr/Zp) + k is the amplification factor of angular displacement δ. When both the planetary gear structural parameters and frequency component lfp + kfc are determined, l(Zr/Zp) + k becomes a constant.
Similarly, the phase of the frequency components mfmesh + kfc, the inherent phase , and the phase variation induced by angular displacement δ can be quantified as follows:
where depends on the harmonic orders m and k of the frequency components mfmesh + kfc, the number of ring gear teeth Zr, and the planet gear mounting angle φq. Here, mZr + k represents the amplification factor of angular displacement δ in the phase variation term , which becomes constant when both the planetary gear structural parameters and frequency components mfmesh + kfc are determined. Additionally, in Equation (17), introduce λ = Zr/(2π) and β = k/(2π). When λ and β are large enough and variable coefficients , the phase variation may be an integer multiple of 2π and be periodic, as shown in Equation (17).
Figure 3 illustrates the schematic variation in the phase shift ∆θl,k of frequency component lfp + kfc with increasing planet gear angular displacement δ. To identify the phase variation pattern, the dependent variable ∆θl,k is constrained within −π to π via radian-based equivalence. As shown in Figure 3a, for frequency components fp + kfc, Zr/Zp + k is the amplification factor of δ. When δ increases from 0 to 0.1 rad, ∆θl,k varies linearly with a maximum value not exceeding 0.2·π. In contrast, Figure 3d shows that for frequency component 4fp + kfc, the amplification factor becomes 4(Zr/Zp) + k. Although ∆θl,k still exhibits linear variation, its maximum value exceeds 0.4·π, indicating an accelerated phase change rate. As δ increases from 0 to 0.1 rad, the phase shift ∆θl,k of frequency component lfp + kfc varies linearly. Notably, higher harmonic order l further accelerates this variation.
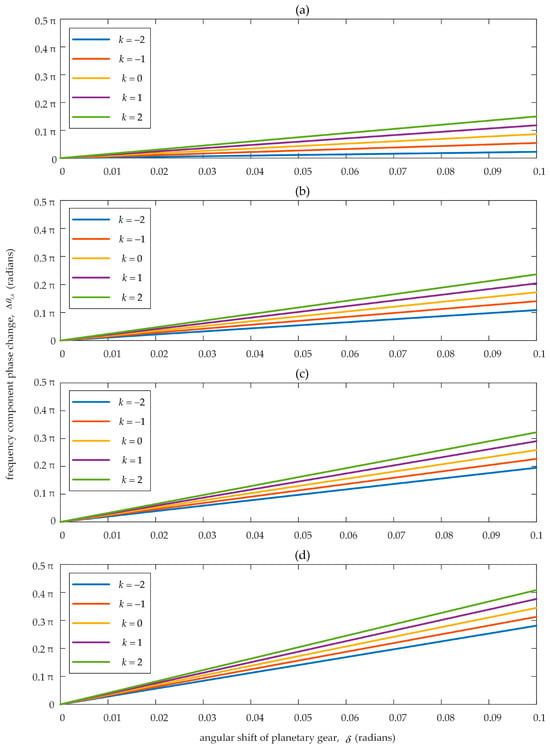
Figure 3.
Phase change ∆θl,k of lfp + kfc under the angular shift δ of the q-th planet gear, where Zp = 31 and Zr = 84: (a) phase change of fp + kfc; (b) phase change of 2fp + kfc; (c) phase change of 3fp + kfc; (d) phase change of 4fp + kfc.
Figure 4 illustrates the phase variation ∆ϕm,k of frequency components mfmesh + kfc as a function of the planetary gear angular displacement δ. When −2 ≤ k ≤ 2, the large number of ring gear teeth (Zr = 84) relative to the harmonic order k causes the change rate of ∆ϕm,k to increase sharply with the order m of the frequency components due to the amplification factor mZr + k. As shown in Figure 4d, for the frequency component 4fmesh + kfc, when δ increases from 0 to 0.1 rad, the amplification factor of δ becomes 4 Zr + k. The phase variation ∆ϕm,k exhibits periodic oscillations between its maximum π and minimum −π. A comparison of Figure 4a–c reveals that higher values of m accelerate this periodic variation.
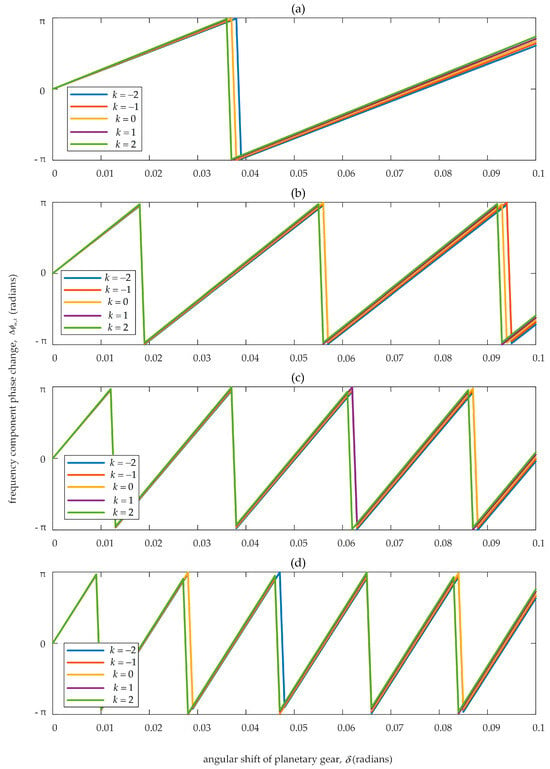
Figure 4.
Phase change ∆ϕm,k of mfmesh + kfc under the angular shift δ of the q-th planet gear, where Zp = 31 and Zr = 84: (a) phase change of fmesh + kfc; (b) phase change of 2fmesh + kfc; (c) phase change of 3fmesh + kfc; (d) phase change of 4fmesh + kfc.
As analyzed above, the breathing effect of a planet carrier fatigue crack may exert complex influences on the frequency components of vibration signals through the coupled effects of angular displacement and amplification factors. The opening and closing of the crack induce periodic stiffness variations in the planet carrier, leading to fluctuations in angular displacement δ. The variation in δ directly modulates the meshing dynamics of the planetary gears, manifesting as periodic phase shifts in the vibration signal, as illustrated in Figure 3 and Figure 4. The change in δ alters the relative positioning between the planetary gears and the ring gears, thereby affecting the load transmission path and resulting in periodic variations in the vibration signal’s phase. Due to the amplification factor mZr + k is large, rapid changes in δ significantly alter the instantaneous phase of frequency component mfmesh + kfc, causing severe amplitude fluctuations. Conversely, as the amplification factor l(Zr/Zp) + k is small, the phase variation ∆θl,k of frequency component lfp + kfc remains relatively smooth despite rapid δ changes, leading to a weaker impact on its amplitude.
As shown in Figure 2a, the vibration synthetic signal acquired by the fixed sensor represents a superposition of vibration components from three meshing points of all planetary gears in the system. As expressed in Equations (18) and (19), the linear superposition of vibration components from the three meshing points can be represented in vector summation form.
Table 1 and Table 2 present the calculated phase values of frequency components corresponding to planetary gears at different positions shown in Figure 2b. Figure 5a,b illustrate the linear superposition of vibration signal components for frequency components fp and fp − fc, respectively. Due to angular displacement induced by fatigue cracks in the second planetary gear, the phases of fp and fp − fc exhibit shifts of ∆θ10 and ∆θ1-1. As demonstrated in Figure 3, the maximum values of ∆θ10 and ∆θ1-1 remain below 0.2π, resulting in minor variations in amplitude and phase (denoted by blue dashed lines) after linear superposition, as shown in Figure 5a,b. Figure 5c,d display the linear superposition results for frequency components fmesh and fmesh + fc. Under the combined influence of amplification factor mZr + k and rapidly varying angular displacement δ, the amplitude and phase of fmesh + fc exhibit substantial fluctuations (blue dashed lines). Similarly, fmesh + fc demonstrates pronounced amplitude and phase variability. To summarize, high-frequency components in mfmesh + kfc exhibit heightened sensitivity to angular displacement variations due to a larger amplification factor, leading to significant phase and amplitude modulation. Low-frequency components in lfp + kfc show attenuated phase shifts owing to longer cyclic periods. The distinct amplitude modulation ranges of different frequency components can serve as diagnostic indicators for crack detection.

Table 1.
Phases of the frequency components lfp + kfc.

Table 2.
Phases of the frequency components mfmesh + kfc.
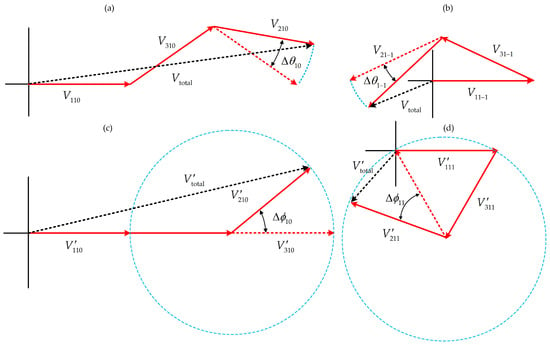
Figure 5.
Effect of planetary gear angular displacement induced by fatigue crack on the phase of vibration frequency components: (a) fp; (b) fp − fc; (c) fmesh; (d) fmesh + fc.
This section establishes the mapping relationship between planet carrier fatigue cracks and frequency components lfp + kfc and mfmesh + kfc through excitation–vibration response analysis. Furthermore, the derivation of frequency components and their associated phase shifts highlights the amplification factor of phase variation and explicitly links it to the gear geometry (number of teeth) and harmonic order. It reveals how the fatigue cracks influence planetary gear vibration signatures via the coupled effects of angular displacement and amplification factors: high-frequency components exhibit greater sensitivity to phase variations, resulting in significant amplitude modulation, while low-frequency components demonstrate minimal amplitude variations due to their longer periodic characteristics. These findings provide a theoretical foundation for subsequent fatigue crack detection.
3. Modulation Signal Bispectrum to Extract Optimal Features
Among the characteristic frequency components derived in Section 2, certain components may equal the sum (or difference) of two other characteristic frequencies. If the phase of such a component also equals the sum (or difference) of the corresponding phases, these three frequencies exhibit quadratic phase coupling (QPC). However, the phase information of the vibration signal cannot be derived from the frequency spectrum. To assess phase-coupling correlations among characteristic frequency components, this section proposes three sideband evaluators of the modulation signal bispectrum for effective characterization of planet carrier fatigue cracks. The robustness of these evaluators is validated under varying loads and speeds.
3.1. Modulation Signal Bispectrum Sidebands Evaluation Principle
Based on the standard theory of bispectral analysis and quadratic phase coupling [19,20,31], the modulation signal bispectrum of vibration signals x(t) acquired by a fixed accelerometer is defined as follows:
where is the Fourier transform of x(t); denotes the complex conjugate of ; E[·] represents the (statistical) expected value; f1 is the center frequency; f2 is the modulation frequency. f1 − f2 and f1 + f2 are the low-frequency and high-frequency components generated by nonlinear coupling between f1 and f2, respectively. When frequency components f1 and f2 exhibit nonlinear coupling, their phases simultaneously satisfy the following [31]:
Substituting Equations (21) and (22) into (20) yields the following [31]:
In this case, the total phase of the modulation signal bispectrum in Equation (20) becomes zero, with its magnitude being the product of the four component amplitudes. The modulation signal bispectrum exhibits peaks at bifrequency (f1, f2) Hz. For four frequency components without significant phase coupling, each component’s phase follows a random distribution. When computing their statistical expectation via Equation (20), the modulation signal bispectrum ultimately converges to zero. This characteristic enables the detection of phase-coupling phenomena among different characteristic frequency components induced by planet carrier fatigue cracks, thereby facilitating effective feature extraction for crack characterization.
To accurately quantify the effective amplitude characterization of planetary carrier fatigue cracks, we first define a modulation signal bispectrum-based sideband evaluator (MSB-SE):
To extract robust optimal features, the parameters of the MSB sideband evaluator require redefinition with physical interpretation. The MSB sideband evaluator should primarily incorporate characteristic frequency components induced by planet carrier fatigue cracks while suppressing interference components. As derived in Section 2, the vibration response frequencies caused by fatigue cracks can be expressed as lfp + kfc and mfmesh + kfc. Given that the phase variation rate of fundamental frequency components exhibits relatively smooth transitions, as shown in Figure 3a and Figure 4a, we extract two sets of characteristic frequency components: (1) fp, fp + fc, fp − fc corresponding to displacement error excitation, and (2) fmesh, fmedsh + fc, fm − fc representing mesh stiffness excitation, which serve as center frequencies in the modulation signal bispectrum. Based on these component characteristics, we propose three MSB slice evaluators:
where fα1 ∈ {fp − fc, fmesh − fc}; fα2 ∈ {fp, fmesh}; fα3 ∈ {fp + fc, fmesh + fc}; f2 is the modulation frequency, serving as the variable in the MSB slice evaluator.
As illustrated in Figure 6, the procedure for optimal fault feature extraction using the three novel MSB sideband evaluators is summarized below, with the parameter selection strategy specifically designed to locate definitive fault signatures while minimizing computational cost.
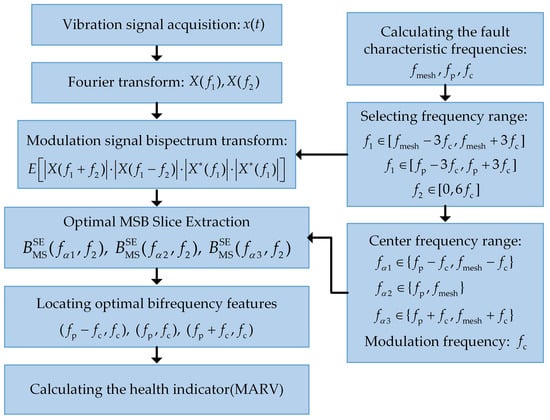
Figure 6.
The procedure for optimal fault feature extraction using the three novel MSB sideband evaluators.
Step 1: Vertical vibration signals were collected using a single-axis accelerometer mounted on the planetary gearbox housing. The data were sampled at 10,240 Hz, and each time-domain segment x(t) had a duration of 10 s to ensure sufficient frequency resolution.
Step 2: The acquired time-domain signal x(t) was transformed into the frequency domain via the fast Fourier transform (FFT).
Step 3: The fundamental fault characteristic frequencies, including the meshing frequency fmesh, planet spin frequency fp, and carrier rotation frequency fc, were computed based on gear geometry and rotational speed. Based on the vibration signal model, which predicts that carrier cracks induce specific sidebands, to target high-frequency modulation effects, the MSB analysis was first performed with the central frequency f1 selected within the range of a dominant meshing harmonic: [fmesh − 3fc, fmesh + 3fc]. To target low-frequency modulation effects, a parallel analysis was conducted with the central frequency f1 selected within the range of the planet pass harmonic: [fp − 3fc, fp + 3fc]. For both strategies, the modulation frequency f2 was investigated over a range of [0, 6fc] to encompass the significant sideband families. The MSB was computed within these initial bifrequency (f1, f2) domains according to Equation (23).
Step 4: The center frequency f1 was locked to the specific spectral line (within the predefined high or low-frequency band by Step 3) that exhibited the strongest and most consistent modulation effect. The modulation frequency f2 was then locked to the integer multiples of fc that yield the most prominent bispectral peaks. From the refined MSB map, the three optimal sideband slices were extracted for the most diagnostic fp and fc combination.
Step 5: The three targeted slices significantly reduced the data dimensionality. The definitive bifrequency fault features, namely the peaks at (fp − fc, fc), (fp, fc), and (fp + fc, fc), were precisely identified, and their magnitudes were recorded.
Step 6: The mean absolute root value (MARV) was calculated from the magnitudes of these three optimal bifrequency peaks to form a robust health indicator for monitoring the state of the planet carrier and diagnosing the presence of a crack.
Furthermore, owing to the sufficient sequence length and the inherent denoising capability of the bispectrum, anti-aliasing filters, window functions, overlapping, or ensemble averaging were not applied during the signal acquisition and processing stages. This simplified approach ensures minimal distortion of the modulation structure while maintaining computational efficiency.
3.2. Experimental Verification
As illustrated in Figure 7, we simulated planetary carrier fatigue crack damage of the planetary roller screw actuator system and established an experimental platform with an artificially implanted crack. In this study, the crack implanted in the planet carrier was a fatigue-type crack that simulated an actual engineering failure, which was located at the connection between the root of the installation column and the plate surface of the planetary gear carrier (a typical stress concentration area) [2,11]. The crack was 36 mm in length and 0.2 mm in width, implanted by the wire electrical discharge machining technique. Key structural parameters of the planetary gear set are detailed in Table 3. As illustrated in Figure 7g, the uniaxial IEPE-type accelerometer with the sensitivity of 1.05 mV/ms−2 was mounted on the gearbox housing using a magnetic base at the position closest to the planet carrier bearing to collect the effective vibration signals in the vertical direction. The sampling frequency of the data acquisition system was set to 10.24 kHz, and the duration for each test was 10 s.
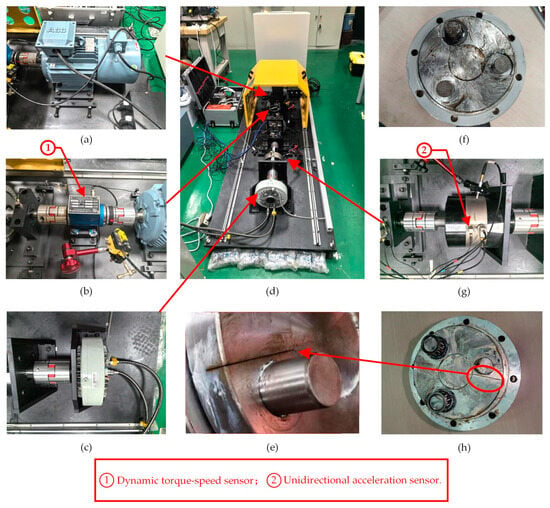
Figure 7.
The test rig: (a) drive motor; (b) motor output end; (c) loading System; (d) overall diagram of the experimental platform; (e) magnified view of the planetary carrier crack; (f) healthy planetary carrier; (g) planetary gearbox; (h) cracked planetary carrier.

Table 3.
Key structure parameters of the planetary gear set.
The actuation system was driven by a variable frequency drive motor coupled with a precision controller to ensure rotational speed stability. Through closed-loop feedback control, the actual speed fluctuations were suppressed below 0.05%. The torque and rotational speed were measured using a dynamic torque-speed sensor. The load was applied by a magnetic powder brake to simulate the operational loading conditions of the actuator.
The test rig was placed in a laboratory approaching 25 °C; the gearbox was lubricated with SKF Bearing grease. To avoid the interference of individual differences between different gearboxes on the experimental results, this study adopted the “before and after crack implantation” scheme on the same planetary gearbox. Specifically, first, the healthy state experiment of the gearbox was completed (all components were in good condition, and no cracks or other faults existed); then, the crack was implanted in the planet carrier of the same gearbox (other components remained unchanged); finally, the fault state experiment was carried out. Comparative experiments were conducted under three sun gear input speeds (15 Hz, 25 Hz, and 35 Hz). Vibration signals from both healthy and cracked planetary carriers were acquired to validate the effectiveness of the proposed method.
Figure 8a–c present the time-domain waveforms of vibration signals under input rotational speeds of 15 Hz, 25 Hz, and 35 Hz, respectively. The results demonstrate that the healthy carrier exhibits significantly lower vibration amplitude (on average) than the cracked planet carrier, and the vibration signals of the cracked carrier show distinct periodic impulses across all three operating conditions, in contrast to the healthy counterpart. An interesting observation is that the amplitude increase ratio (faulty/healthy) at 25 Hz input frequency is lower than at 15 Hz and 35 Hz. This phenomenon might be attributed to the dynamic characteristics of the test rig. The frequency of 25 Hz (1500 RPM) could be proximate to a structural resonance mode of the actuation system, leading to altered vibration transmission and damping properties that non-uniformly affect the modulation signals under healthy and faulty conditions.
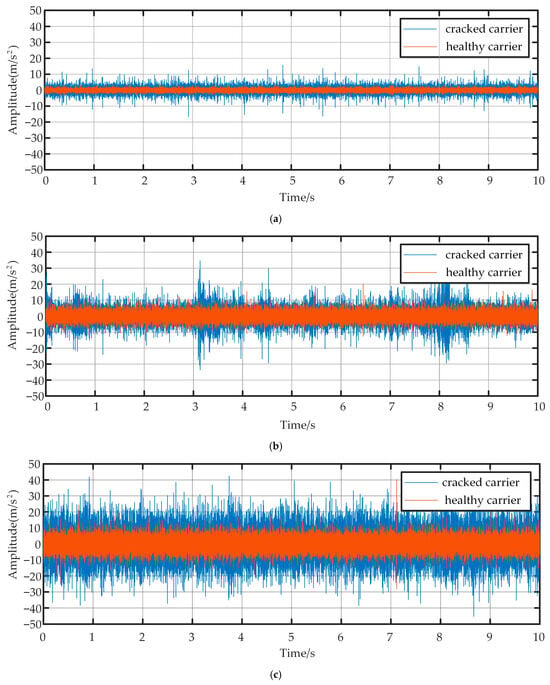
Figure 8.
The time domain of vibration signal: (a) finput = 15 Hz; (b) finput = 25 Hz; (c) finput = 35 Hz.
Furthermore, traditional vibration amplitude in the time domain is susceptible to operational changes and noise. In contrast, the MSB-based method specifically targets the weak modulation effects caused by incipient cracks. Based on the vibration modulation mechanism induced by the planetary carrier crack, the three MSB sideband evaluators isolate and highlight these specific nonlinear components while suppressing irrelevant signals. This also makes MSB far more sensitive to early faults than amplitude-based measures, as it amplifies weak phase coupling indicative of modulation. Consequently, the health indicator derived from the enhanced MSB spectrum provides a quantitative and reliable metric for tracking fault progression, a capability lacking in simple amplitude averaging.
As presented in Table 4, Table 5 and Table 6, the calculated values include the planetary carrier rotational frequency, meshing frequency, and associated modulation sidebands under input speeds of 15 Hz, 25 Hz, and 35 Hz. Based on these identified features, Figure 9, Figure 10, Figure 11, Figure 12, Figure 13 and Figure 14 present a comparative analysis of the modulation signal bispectrum between healthy and cracked planetary carriers under these three speed conditions. Figure 9a–e display the modulation signal bispectrum for cracked and healthy carriers at 15 Hz, respectively. Distinct peaks emerge in the cracked carrier’s bispectrum at bifrequencies (fp, fc) Hz, (fp − fc, fc) Hz, (fp + fc, fc) Hz, (fp − 2fc, fc) Hz and (fp + 2fc, fc) Hz. Notably, Figure 9a reveals pronounced peaks at bifrequencies (fp + βfc, ηfc) Hz, precisely matching the theoretical displacement-error-excited frequency components satisfying fp + kfc = fp + (β + η)fc, where β = −2, −1, 0, 1, 2 and η = 1, 2, 3, 4, 5, 6. Consistent phenomena are observed at 25 Hz (Figure 11) and 35 Hz (Figure 13), where peaks occur at the same characteristic bifrequencies (fp + βfc, ηfc) Hz. This systematic correspondence demonstrates that displacement-error-related bifrequencies and their bispectral peaks effectively characterize planetary carrier fatigue cracks.

Table 4.
Key vibration modulation sideband in finput = 15 Hz.

Table 5.
Key vibration modulation sideband in finput = 25 Hz.

Table 6.
Key vibration modulation sideband in finput = 35 Hz.
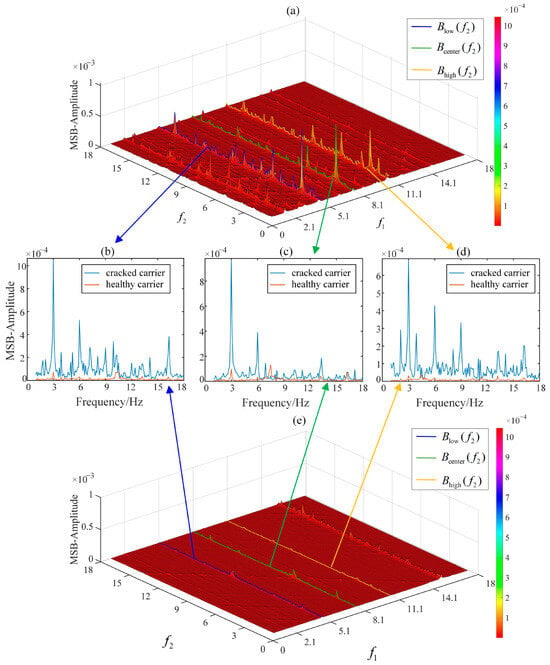
Figure 9.
MSB-SE analysis of frequency components lfp + kfc in finput = 15 Hz: (a) MSB of cracked carrier; (b) MSB slice of Blow(f2); (c) MSB slice of Bcenter(f2); (d) MSB slice of Bhigh(f2); (e) MSB of healthy carrier.
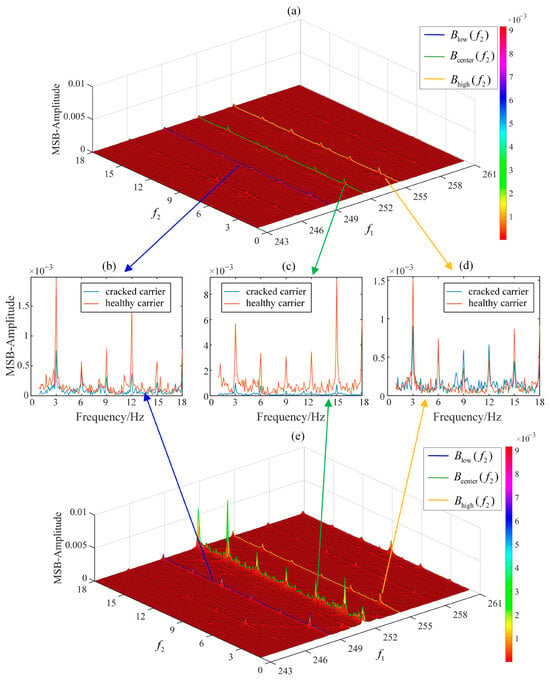
Figure 10.
MSB-SE analysis of frequency components mfmesh + kfc in finput = 15 Hz: (a) MSB of cracked carrier; (b) MSB slice of Blow(f2); (c) MSB slice of Bcenter(f2); (d) MSB slice of Bhigh(f2); (e) MSB of healthy carrier.
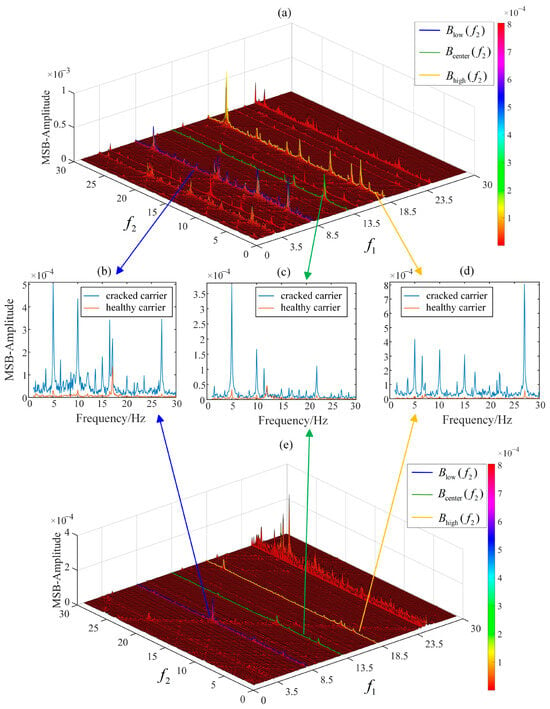
Figure 11.
MSB-SE analysis of frequency components lfp + kfc in finput = 25 Hz: (a) MSB of cracked carrier; (b) MSB slice of Blow(f2); (c) MSB slice of Bcenter(f2); (d) MSB slice of Bhigh(f2); (e) MSB of healthy carrier.
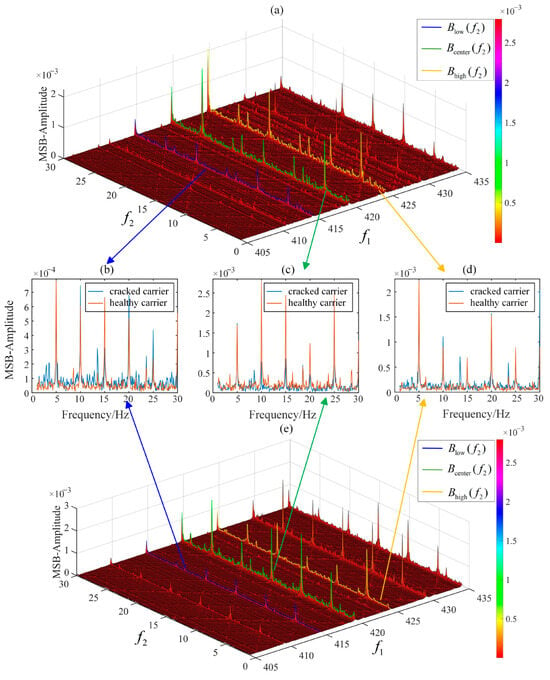
Figure 12.
MSB-SE analysis of frequency components mfmesh + kfc in finput = 25 Hz: (a) MSB of cracked carrier; (b) MSB slice of Blow(f2); (c) MSB slice of Bcenter(f2); (d) MSB slice of Bhigh(f2); (e) MSB of healthy carrier.
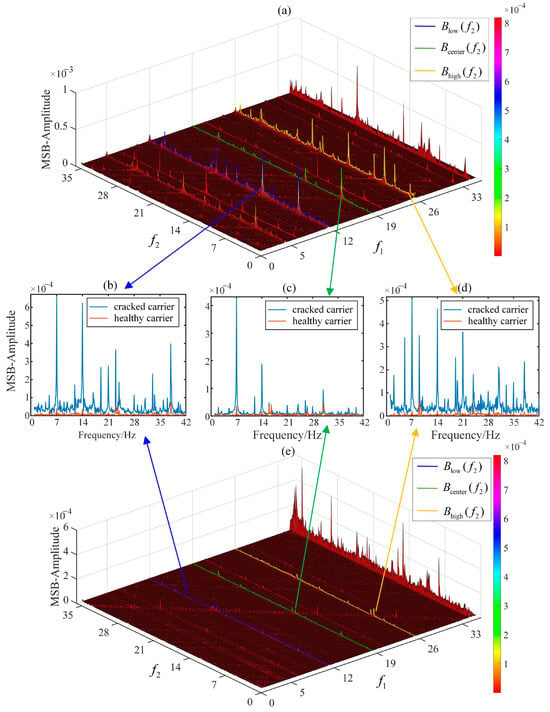
Figure 13.
MSB-SE analysis of frequency components lfp + kfc in finput = 35 Hz: (a) MSB of cracked carrier; (b) MSB slice of Blow(f2); (c) MSB slice of Bcenter(f2); (d) MSB slice of Bhigh(f2); (e) MSB of healthy carrier.
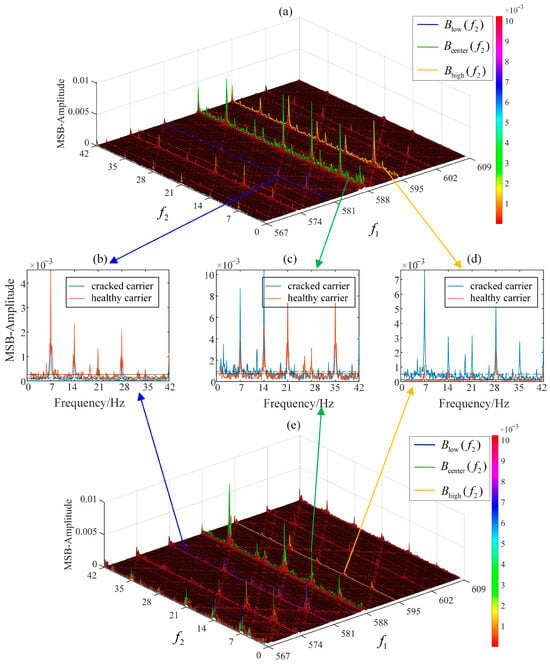
Figure 14.
MSB-SE analysis of frequency components mfmesh + kfc in finput = 35 Hz: (a) MSB of cracked carrier; (b) MSB slice of Blow(f2); (c) MSB slice of Bcenter(f2); (d) MSB slice of Bhigh(f2); (e) MSB of healthy carrier.
A similar phenomenon is observed in the modulation signal bispectrum associated with meshing stiffness excitation, as shown in Figure 10a–e, Figure 12a–e and Figure 14a–e, which display the bispectra under input speeds of 15 Hz, 25 Hz, and 35 Hz, respectively. Distinct peaks appear at the bifrequencies (fmesh + βfc, ηfc) Hz. The bispectral peak magnitudes in the healthy carrier (Figure 10a–e) exceed those of the cracked counterpart. Conversely, certain bifrequency peaks in the cracked carrier (Figure 12a–e and Figure 14a–e) exhibit higher magnitudes than those in the healthy carrier. The modulation signal bispectrum of meshing frequency and its sidebands shows insufficient consistency in distinguishing cracked and healthy carriers, indicating randomness in fatigue crack characterization. The observed phenomenon may result from the coupling between planetary gear angular displacement and amplification factors, rendering the high-frequency components more sensitive to phase variations with fluctuating amplitudes. In contrast, the low-frequency components exhibit greater stability in the modulation signal bispectrum due to their reduced susceptibility to phase-induced amplitude variations.
In the modulation signal bispectrum, the amplitude curves of three MSB sideband evaluators corresponding to Equations (25)–(27) are plotted in blue, green, and orange in Figure 9b–d, respectively. At 15 Hz, the average MSB slice amplitudes of the cracked planet carrier exceed those of the healthy one. Distinct peaks appear at bifrequencies (fp, fc) Hz in Figure 9c, (fp − fc, fc) Hz in Figure 9b, and (fp + fc, fc) Hz in Figure 9d, with similar patterns observed at 25 Hz and 35 Hz (Figure 11 and Figure 13). These results demonstrate the effectiveness and robustness of the identified bifrequencies ((fp, fc) Hz, (fp − fc, fc) Hz, and (fp + fc, fc) Hz) for fatigue crack characterization.
In Figure 10, Figure 12 and Figure 14, compared to additional lines of f1 = fmesh − 3fc, f1 = fmesh − 2fc, f1 = fmesh + 2fc and f1 = fmesh + 3fc, the amplitude curves of the three MSB sideband estimators corresponding to Equations (25)–(27) (plotted in blue, green, and orange, respectively) are more energy-intensive, robust and readable. Therefore, for the carrier frequency range [fmesh − 3fc, fmesh + 3fc], this study mainly uses these three sideband evaluators to evaluate the health status of the planetary carrier. Exceeding this carrier frequency range, the energy is divergent, and the phase coupling between frequencies is not easy to observe. Similarly, this phenomenon is more pronounced in the low carrier frequency range of [fp − 3fc, fp + 3fc]. The three MSB sideband estimators corresponding to Equations (25)–(27) (plotted in blue, green, and orange, respectively) are more energy-intensive than the additional lines of f1 = fp − 3fc, f1 = fp − 2fc, f1 = fp + 2fc and f1 = fp + 3fc, as shown in Figure 9, Figure 11 and Figure 13.
Experimental results demonstrate that the frequency components of the vibration response model established in Section 2 show excellent agreement with the bifrequencies ((fp + βfc, ηfc) Hz and (fmesh + βfc, ηfc) Hz corresponding to the peaks in the modulation signal bispectrum. Compared to the three sideband estimators of characteristic frequency components fmesh + kfc, the three MSB sideband estimators of frequency component fp + kfc exhibit more distinct and stable amplitudes for characterizing cracked planet carrier faults. Among the three MSB estimators, prominent bispectral peaks are observed at bifrequencies (fp, fc) Hz, (fp − fc, fc) Hz, and (fp + fc, fc) Hz, with exceptionally stable phase coupling in their corresponding frequency components. These phenomena suggest that planetary gear fatigue cracks significantly influence the phase-coupling effects of displacement-error-induced frequency components. Consequently, the bispectral peaks at (fp, fc) Hz, (fp − fc, fc) Hz, and (fp + fc, fc) Hz can serve as effective indicators for planet carrier crack characterization.
It should be noted that the current signal model assumes linear superposition of vibration components from individual planet gears. While this simplification enables analytical tractability and clear interpretation of modulation mechanisms, it does not fully capture nonlinear behaviors such as crack breathing, local contact loss, or friction-induced hysteresis. These effects may introduce higher-order harmonics and intermodulation components. However, as demonstrated in the experimental results, the dominant modulation patterns caused by carrier cracks are still well captured by the proposed model, particularly in the low-frequency band where the phase modulation effect is robust. Future work will investigate hybrid modeling approaches that integrate empirical signal features with physics-informed machine learning to better account for such nonlinearities.
3.3. Robustness of Optimal MSB-Slice Under Different Working Conditions
Section 3.2 proved that for planet carrier crack characterization, the three MSB sideband evaluators of displacement error frequency components show more distinct and stable amplitudes than those from meshing error. This section further validates their robustness under varying speeds and loads.
Figure 15 demonstrates the differences in amplitude of the bispectrum when three modulation signal bispectrum sideband estimators characterize cracked and healthy planet carriers under no-load conditions (0 N·m) across eight input rotational speeds. Notably, all three sideband estimators exhibit higher peak magnitudes for the fatigued planet carrier than for its healthy counterpart. In particular, the characteristic peaks at (fp − fc, fc) Hz in Figure 15a, (fp, fc) Hz in Figure 15b, and (fp + fc, fc) Hz in Figure 15c show remarkable robustness in identifying planet carrier fatigue cracks across all tested speeds. As further evidenced in Figure 16 and Figure 17, the three sideband estimators maintain robust crack detection capability under loads of 2 N·m and 4 N·m. The consistent prominence of peaks at (fp − fc, fc) Hz, (fp, fc) Hz, and (fp + fc, fc) Hz across all estimators confirms their strong adaptability to varying load and speed conditions.
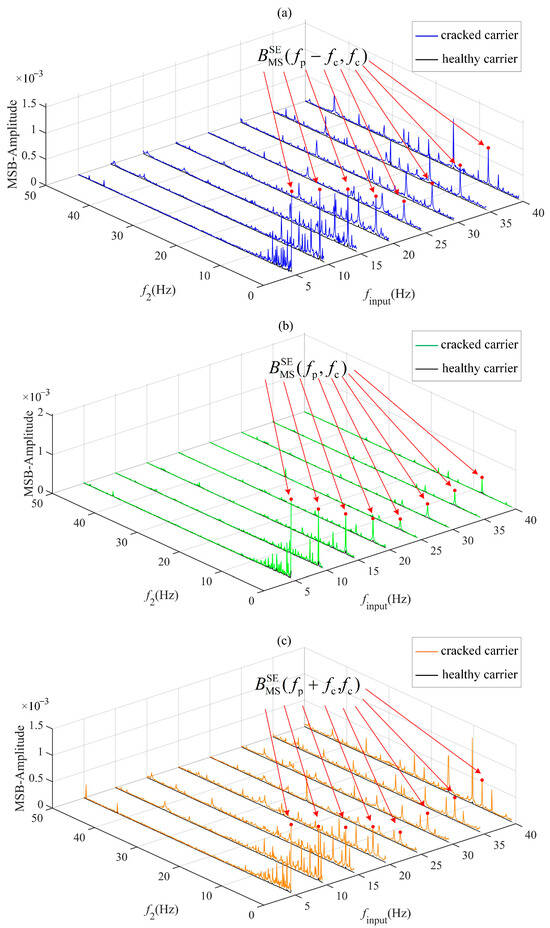
Figure 15.
MSB-SE optimal slice under 0 N·m load and different input speeds: (a) MSB slice of Blow(f2); (b) MSB slice of Bcenter(f2); (c) MSB slice of Bhigh(f2).
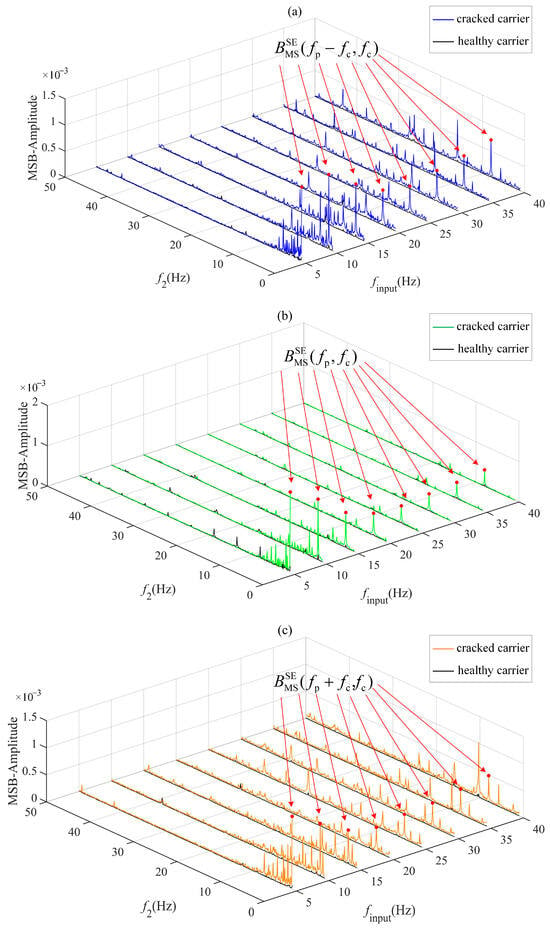
Figure 16.
MSB-SE optimal slice under 2 N·m load and different input speeds: (a) MSB slice of Blow(f2); (b) MSB slice of Bcenter(f2); (c) MSB slice of Bhigh(f2).
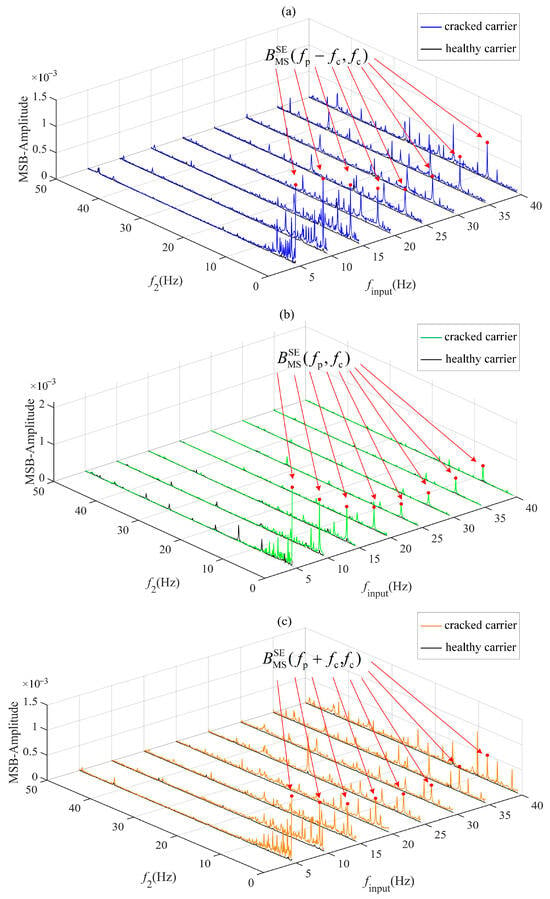
Figure 17.
MSB-SE optimal slice under 4 N·m load and different input speeds: (a) MSB slice of Blow(f2); (b) MSB slice of Bcenter(f2); (c) MSB slice of Bhigh(f2).
The characteristic bifrequencies observed at (fp, fc) Hz, (fp − fc, fc) Hz, and (fp + fc, fc) Hz indicate quadratic phase coupling among the planet gear spin frequency fp, carrier rotation frequency fc, and their harmonics. In a healthy system, such coupling is minimal. However, a cracked carrier introduces periodic displacement errors that modulate both amplitude and phase, generating persistent nonlinear interactions detectable via MSB. Importantly, the bispectrum inherently suppresses Gaussian noise due to its random-phase nature, enabling robust detection of early-stage cracks.
The results demonstrate that all three sideband estimators, particularly the dual-frequency peaks at (fp, fc) Hz, (fp − fc, fc) Hz, and (fp + fc, fc) Hz, exhibit strong robustness in characterizing planetary carrier fatigue cracks across varying loads and speeds. These features effectively discriminate between cracked and healthy carriers, showing significant potential for fatigue crack detection of actuators.
4. Sideband Assessment Indicators for Planetary Carrier Crack Detection
This section further extracts peak values of the modulation signal bispectrum at dual frequencies ((fp, fc) Hz, (fp − fc, fc) Hz, (fp + fc, fc) Hz) to construct a health indicator characterizing planet carrier fatigue cracks, with its robustness validated under varying load and speed conditions.
4.1. The Definition Sideband Evaluation Indicator
Based on the three frequency pairs ((fp, fc) Hz, (fp − fc, fc) Hz, (fp + fc, fc) Hz) exhibiting distinct peaks in the modulation signal bispectrum (MSB) from the aforementioned experiments, we define the detection index for planetary carrier fatigue cracks as the mean-absolute-root value (MARV) of MSB.
4.2. Experiments Verification of MARV to Detect Carrier Crack
To validate the effectiveness of the state indicator, experiments were conducted using 10 sets of vibration signals under 0 N·m, 2 N·m, and 4 N·m load conditions to calculate the mean and standard deviation of MARV. The mean MARV values were plotted against the sun gear rotation frequency to evaluate the effectiveness of the indicator in detecting planet carrier fatigue cracks under varying speeds and loads. Additionally, error bars derived from the standard deviations were generated to assess the dispersion characteristics of this state indicator.
As shown in Figure 18a–c, the MARV indicator demonstrates significant discriminative capability between cracked and healthy planet carriers across three loading conditions, with all 10 datasets exhibiting minimal error margins, confirming its robustness. Notably, the indicator shows rotation speed sensitivity: optimal classification occurs at low speeds, while its effectiveness gradually diminishes with increasing rotational speed before stabilizing within the 25–40 Hz range. Despite this trend, it maintains satisfactory performance in characterizing fatigue cracks under high-speed conditions. This rotation speed-related characteristic suggests potential for further optimization targeting high-speed scenarios. To further validate the effectiveness of the proposed MARV, a comparison with traditional health indicators such as root mean square (RMS) is provided in Figure 19. The results confirm that MARV offers improved sensitivity and robustness in tracking the progression of carrier cracks under variable operating conditions. Collectively, the indicator exhibits strong practical value for diverse operational conditions.
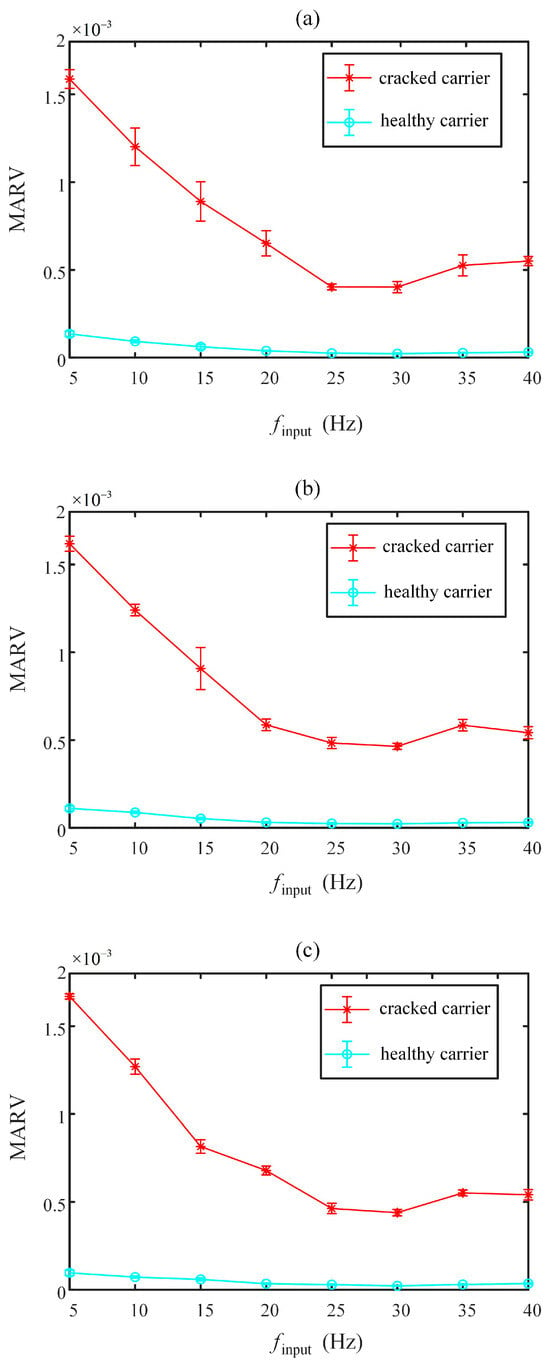
Figure 18.
The MARV value under different load and input speeds: (a) the load with 0 N·m; (b) the load with 2 N·m; (c) the load with 4 N·m.
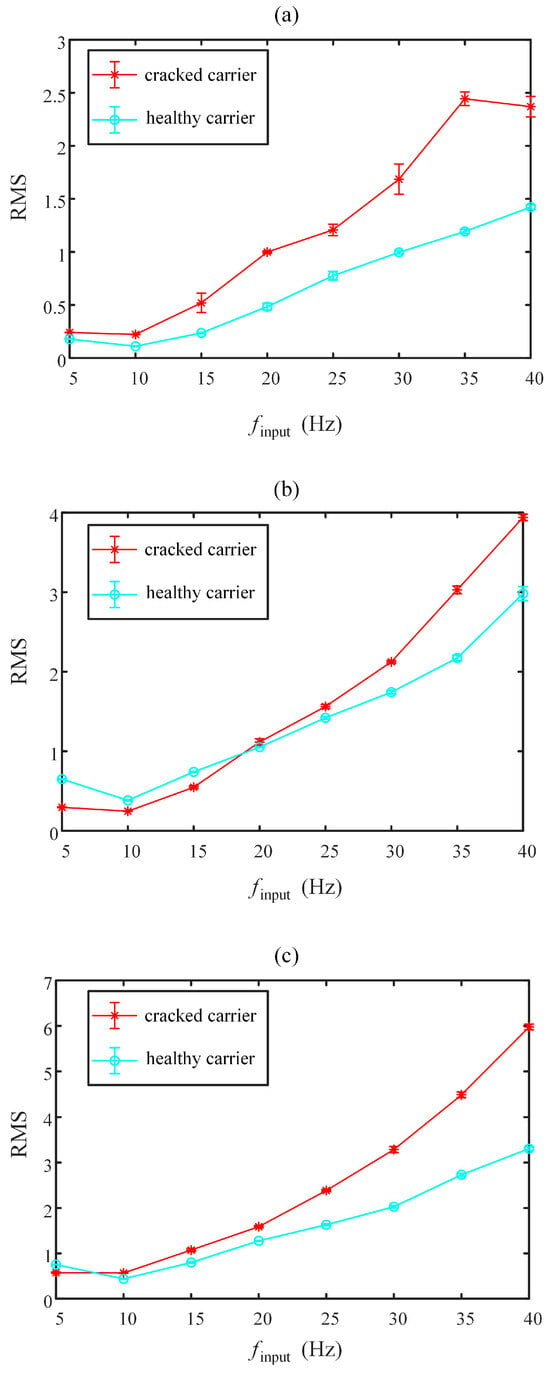
Figure 19.
The RMS value under different loads and input speeds: (a) the load with 0 N·m; (b) the load with 2 N·m; (c) the load with 4 N·m.
5. Conclusions
In this research, a novel methodology for diagnosing planetary gear carrier cracks in actuator systems with a gearbox by synergistically combining a vibration signal model with modulation signal bispectrum analysis is presented. The developed model successfully captures the essential modulation mechanics induced by a cracked carrier as it rotates, providing a clear theoretical explanation for the sideband patterns observed in the bifrequency domain.
The experimental results unequivocally demonstrate that the proposed method can achieve high diagnostic accuracy and robustness in identifying incipient carrier cracks, even under different working conditions. This directly contributes to the field of actuation system reliability by offering a more dependable tool for condition-based monitoring and predictive maintenance, thereby helping to prevent unexpected failures. While the current experimental validation is based on a single test rig and a specific fault type, the proposed method is grounded in a general signal modeling framework that is applicable to a wide range of actuation systems. Future work will involve testing under more varied operating conditions and fault scenarios to further verify its practical versatility and sensitivity.
While this study focuses on model-based feature extraction and was conducted on a laboratory test rig under relatively steady loads and speeds, emerging transferable deep learning technology offers promising avenues for adaptive prognosis. Future work could fuse our physics-guided MSB features with such AI frameworks to enable self-optimizing health management for actuation systems. Future work will focus on the following aspects:
- (a)
- Combining the time–frequency domain to improve the method under more complex operational conditions, such as variable speeds and loads, which are common in real-world actuation systems.
- (b)
- Integrating the proposed method with deep learning algorithms for automated fault identification and severity assessment, moving towards a more intelligent PHM system.
- (c)
- Modeling by structural dynamics, vibration response behaviors at a wider range of input velocities should be studied, especially around potential resonant frequencies.
Author Contributions
Conceptualization, X.L. and N.H.; methodology, X.L.; validation, X.L., N.H. and Z.Y.; investigation, X.L. and Z.Y.; data curation, Z.D. and Z.Z.; writing—original draft preparation, X.L.; writing—review and editing, X.L. and Z.Y.; funding acquisition, Y.Y. All authors have read and agreed to the published version of the manuscript.
Funding
This research was funded by the Young Elite Scientists Sponsorship Program by CAST (grant number: No. YESS20240414), the Natural Science Foundation of Hunan Province of China (grant number: No. 2024JJ5408), and the National Key Laboratory Fund Project (grant number: No. 614XXXX2203).
Data Availability Statement
The data are unavailable due to privacy restrictions.
Conflicts of Interest
The authors declare no conflicts of interest.
Abbreviations
The following abbreviations are used in this manuscript:
| MSB | Modulation signal bispectrum |
| EMA | Electro-mechanical actuator |
| MSB-SE | Modulation signal bispectrum-based sideband evaluator |
| QPC | Quadratic phase coupling |
| MARV | Mean absolute root value |
| RMS | Root mean square |
References
- Qiao, G.; Liu, G.; Shi, Z.; Wang, Y.; Ma, S.; Lim, T.C. A review of electromechanical actuators for More/All Electric aircraft systems. Proc. Inst. Mech. Eng. Part C J. Mech. Eng. Sci. 2017, 232, 4128–4151. [Google Scholar] [CrossRef]
- Blunt, D.M.; Keller, J.A. Detection of a fatigue crack in a UH-60A planet gear carrier using vibration analysis. Mech. Syst. Signal Process. 2006, 20, 2095–2111. [Google Scholar] [CrossRef]
- Fan, L.; Wang, S.; Zhang, C.; Kong, D.; Mao, Y. Life prediction of helicopter planetary carrier plate fatigue crack propagation. J. Beijing Univ. Aeronaut. Astronaut. 2016, 42, 1927–1935. [Google Scholar]
- Sampath, S.; Jang, J.; Sohn, H. Ultrasonic Lamb wave mixing based fatigue crack detection using a deep learning model and higher-order spectral analysis. Int. J. Fatigue 2022, 163, 107028. [Google Scholar] [CrossRef]
- Yang, D.; Wang, K.; Zhang, J.; Yuan, Y.; Liu, Y.; Au, F.T.K. Micro-crack localization for steel strands using nonlinear vibro-acoustic modulation based on modified signal bispectrum analysis. Measurement 2024, 233, 114746. [Google Scholar] [CrossRef]
- Carr, G.E.; Chapetti, M.D. On the detection threshold for fatigue cracks in welded steel beams using vibration analysis. Int. J. Fatigue 2011, 33, 642–648. [Google Scholar] [CrossRef]
- Ma, Z.; Zhao, X.; Wu, Y.; Ma, H.; Cao, P.; Guan, H.; Liu, Z.; Fan, C.; Zhu, J.; Yan, P.; et al. Two novel indicators for gear crack diagnosis based on vibration responses: Experiment and simulation. Mech. Mach. Theory 2025, 205, 105905. [Google Scholar] [CrossRef]
- Seleznev, M.; Weidner, A.; Biermann, H. Detection of early fatigue damage during ultrasonic fatigue testing of steel by acoustic emission monitoring. Int. J. Fatigue 2024, 185, 108367. [Google Scholar] [CrossRef]
- Bjørheim, F.; Siriwardane, S.C.; Pavlou, D. A review of fatigue damage detection and measurement techniques. Int. J. Fatigue 2022, 154, 106556. [Google Scholar] [CrossRef]
- Liu, C.; Chen, Y.; Xu, X. Fatigue life prognosis of composite structures using a transferable deep reinforcement learning-based approach. Compos. Struct. 2025, 353, 118727. [Google Scholar] [CrossRef]
- Keller, J.A.; Grabill, P. Vibration monitoring of UH-60A main transmission planetary carrier fault. In Proceedings of the American Helicopter Society 59th Annual Forum, Phoenix, AZ, USA, 6–8 May 2003. [Google Scholar]
- Sparis, P.; Vachtsevanos, G. A Helicopter Planetary Gear Carrier Plate Crack Analysis and Feature Extraction based on Ground and Aircraft Tests. In Proceedings of the 2005 IEEE International Symposium on Intelligent Control, Limassol, Cyprus, 27–29 June 2005. [Google Scholar]
- Hines, J.A.; Muench, D.S.; Keller, J.A.; Garga, A.K. Effects of time-synchronous averaging implementations on HUMS features for UH-60A planetary carrier cracking. In Proceedings of the The American Helicoper Society 61st Annual Forum, Grapevine, TX, USA, 1–3 June 2005. [Google Scholar]
- Patrick, R. A Model Based Framework for Fault Diagnosis and Prognosis of Dynamical Systems with an Application to Helicopter Transmissions. Ph.D. Thesis, Georgia Institute of Technology, Atlanta, GA, USA, 2007. [Google Scholar]
- Patrick, R.; Ferri, A.; Vachtsevanos, G. Effect of planetary gear carrier-plate cracks on vibration spectrum. J. Vib. Acoust. 2012, 134, 061001–061012. [Google Scholar] [CrossRef]
- Hecke, B.V.; Yoon, J.; He, D. Detection of on-aircraft fatigue cracks in a UH-60A planet carrier using spectral averaging. Insight -Non-Destr. Test. Cond. Monit. 2015, 57, 643–649. [Google Scholar]
- Danfeng, W.; Yu, G.; Xing, W. Fault feature extraction of planetary carrier crack by amplitude and phase demodulation. J. Vib. Eng. 2021, 34, 1085–1091. [Google Scholar]
- McFadden, P.D. Detecting Fatigue Cracks in Gears by Amplitude and Phase Demodulation of the Meshing Vibration. J. Vib. Acoust. 1986, 108, 165–170. [Google Scholar] [CrossRef]
- Wu, Y.; Sun, Y.; Naiyan, L.; Zhongfang, T. The Analysis of Amplitude Modulated Signal by Bispectrum. J. Vib. Meas. Diagn. 1993, 13, 26–30. [Google Scholar]
- Zhang, R.; Gu, F.; Mansaf, H.; Wang, T.; Ball, A.D. Gear wear monitoring by modulation signal bispectrum based on motor current signal analysis. Mech. Syst. Signal Process. 2017, 94, 202–213. [Google Scholar] [CrossRef]
- Xu, Y.; Feng, G.; Tang, X.; Yang, S.; Gu, F.; Ball, A.D. A Modulation Signal Bispectrum Enhanced Squared Envelope for the detection and diagnosis of compound epicyclic gear faults. Struct. Health Monit. 2022, 22, 562–580. [Google Scholar] [CrossRef]
- Guo, J.; Zhang, H.; Zhen, D.; Shi, Z.; Gu, F.; Ball, A.D. An enhanced modulation signal bispectrum analysis for bearing fault detection based on non-Gaussian noise suppression. Measurement 2020, 151, 107240. [Google Scholar] [CrossRef]
- Xu, M.; Han, Y.; Sun, X.; Shao, Y.; Gu, F.; Ball, A.D. Vibration characteristics and condition monitoring of internal radial clearance within a ball bearing in a gear-shaft-bearing system. Mech. Syst. Signal Process. 2022, 165, 108280. [Google Scholar] [CrossRef]
- Zhang, R.; Gu, X.; Gu, F.; Wang, T.; Ball, A. Gear Wear Process Monitoring Using a Sideband Estimator Based on Modulation Signal Bispectrum. Appl. Sci. 2017, 7, 274. [Google Scholar] [CrossRef]
- Tian, X.; Abdallaa, G.M.; Rehab, I.; Gu, F.; Ball, A.D.; Wang, T. Diagnosis of Combination Faults in a Planetary Gearbox using a Modulation Signal Bispectrum based Sideband Estimator. In Proceedings of the 21st International Conference on Automation & Computing, Glasgow, UK, 11–12 September 2015. [Google Scholar]
- Guo, J.; He, Q.; Yang, Y.; Zhen, D.; Gu, F.; Ball, A.D. A local modulation signal bispectrum for multiple amplitude and frequency modulation demodulation in gearbox fault diagnosis. Struct. Health Monit. 2023, 22, 3189–3205. [Google Scholar] [CrossRef]
- Han, Y.; Xu, M.; Sun, X.; Ding, X.; Chen, X.; Gu, F. Gear Health Monitoring and RUL Prediction Based on MSB Analysis. IEEE Sens. J. 2022, 22, 4400–4409. [Google Scholar] [CrossRef]
- Yang, M.; Zhang, K.; Xu, Y.; Hu, A.; Gu, F. The harmonic modulation bispectrum: A modulated vibration signal analysis method for compound fault diagnosis of gearboxes. Struct. Health Monit. 2024, 1–22. [Google Scholar] [CrossRef]
- Yang, X.; Ding, K.; He, G.; Du, C.; Yu, W. Improved vibration AM-FM sideband phenomenon models of planetary gear set with distributed faults and fault-induced speed fluctuation. Mech. Mach. Theory 2023, 179, 105093. [Google Scholar] [CrossRef]
- Belsak, A.; Flasker, J. Method for detecting fatigue crack in gears. Theor. Appl. Fract. Mech. 2006, 46, 105–113. [Google Scholar] [CrossRef]
- Zou, X.; Zhang, H.; Jiang, Z.; Zhang, K.; Xu, Y. Toward accurate extraction of bearing fault modulation characteristics with novel time–frequency modulation bispectrum and modulation Gini index analysis. Mech. Syst. Signal Process. 2024, 219, 111629. [Google Scholar] [CrossRef]
Disclaimer/Publisher’s Note: The statements, opinions and data contained in all publications are solely those of the individual author(s) and contributor(s) and not of MDPI and/or the editor(s). MDPI and/or the editor(s) disclaim responsibility for any injury to people or property resulting from any ideas, methods, instructions or products referred to in the content. |
© 2025 by the authors. Licensee MDPI, Basel, Switzerland. This article is an open access article distributed under the terms and conditions of the Creative Commons Attribution (CC BY) license (https://creativecommons.org/licenses/by/4.0/).