
An Understanding of the Global Status of Major Bacterial Pathogens of Milk Concerning Bovine Mastitis: A Systematic Review and Meta-Analysis (Scientometrics)

 ,
, 

Abstract
1. Introduction
2. Results
2.1. Staphylococcus (S) Species, Streptococcus (St) Species, and Escherichia coli (Ec) Prevalence Studies
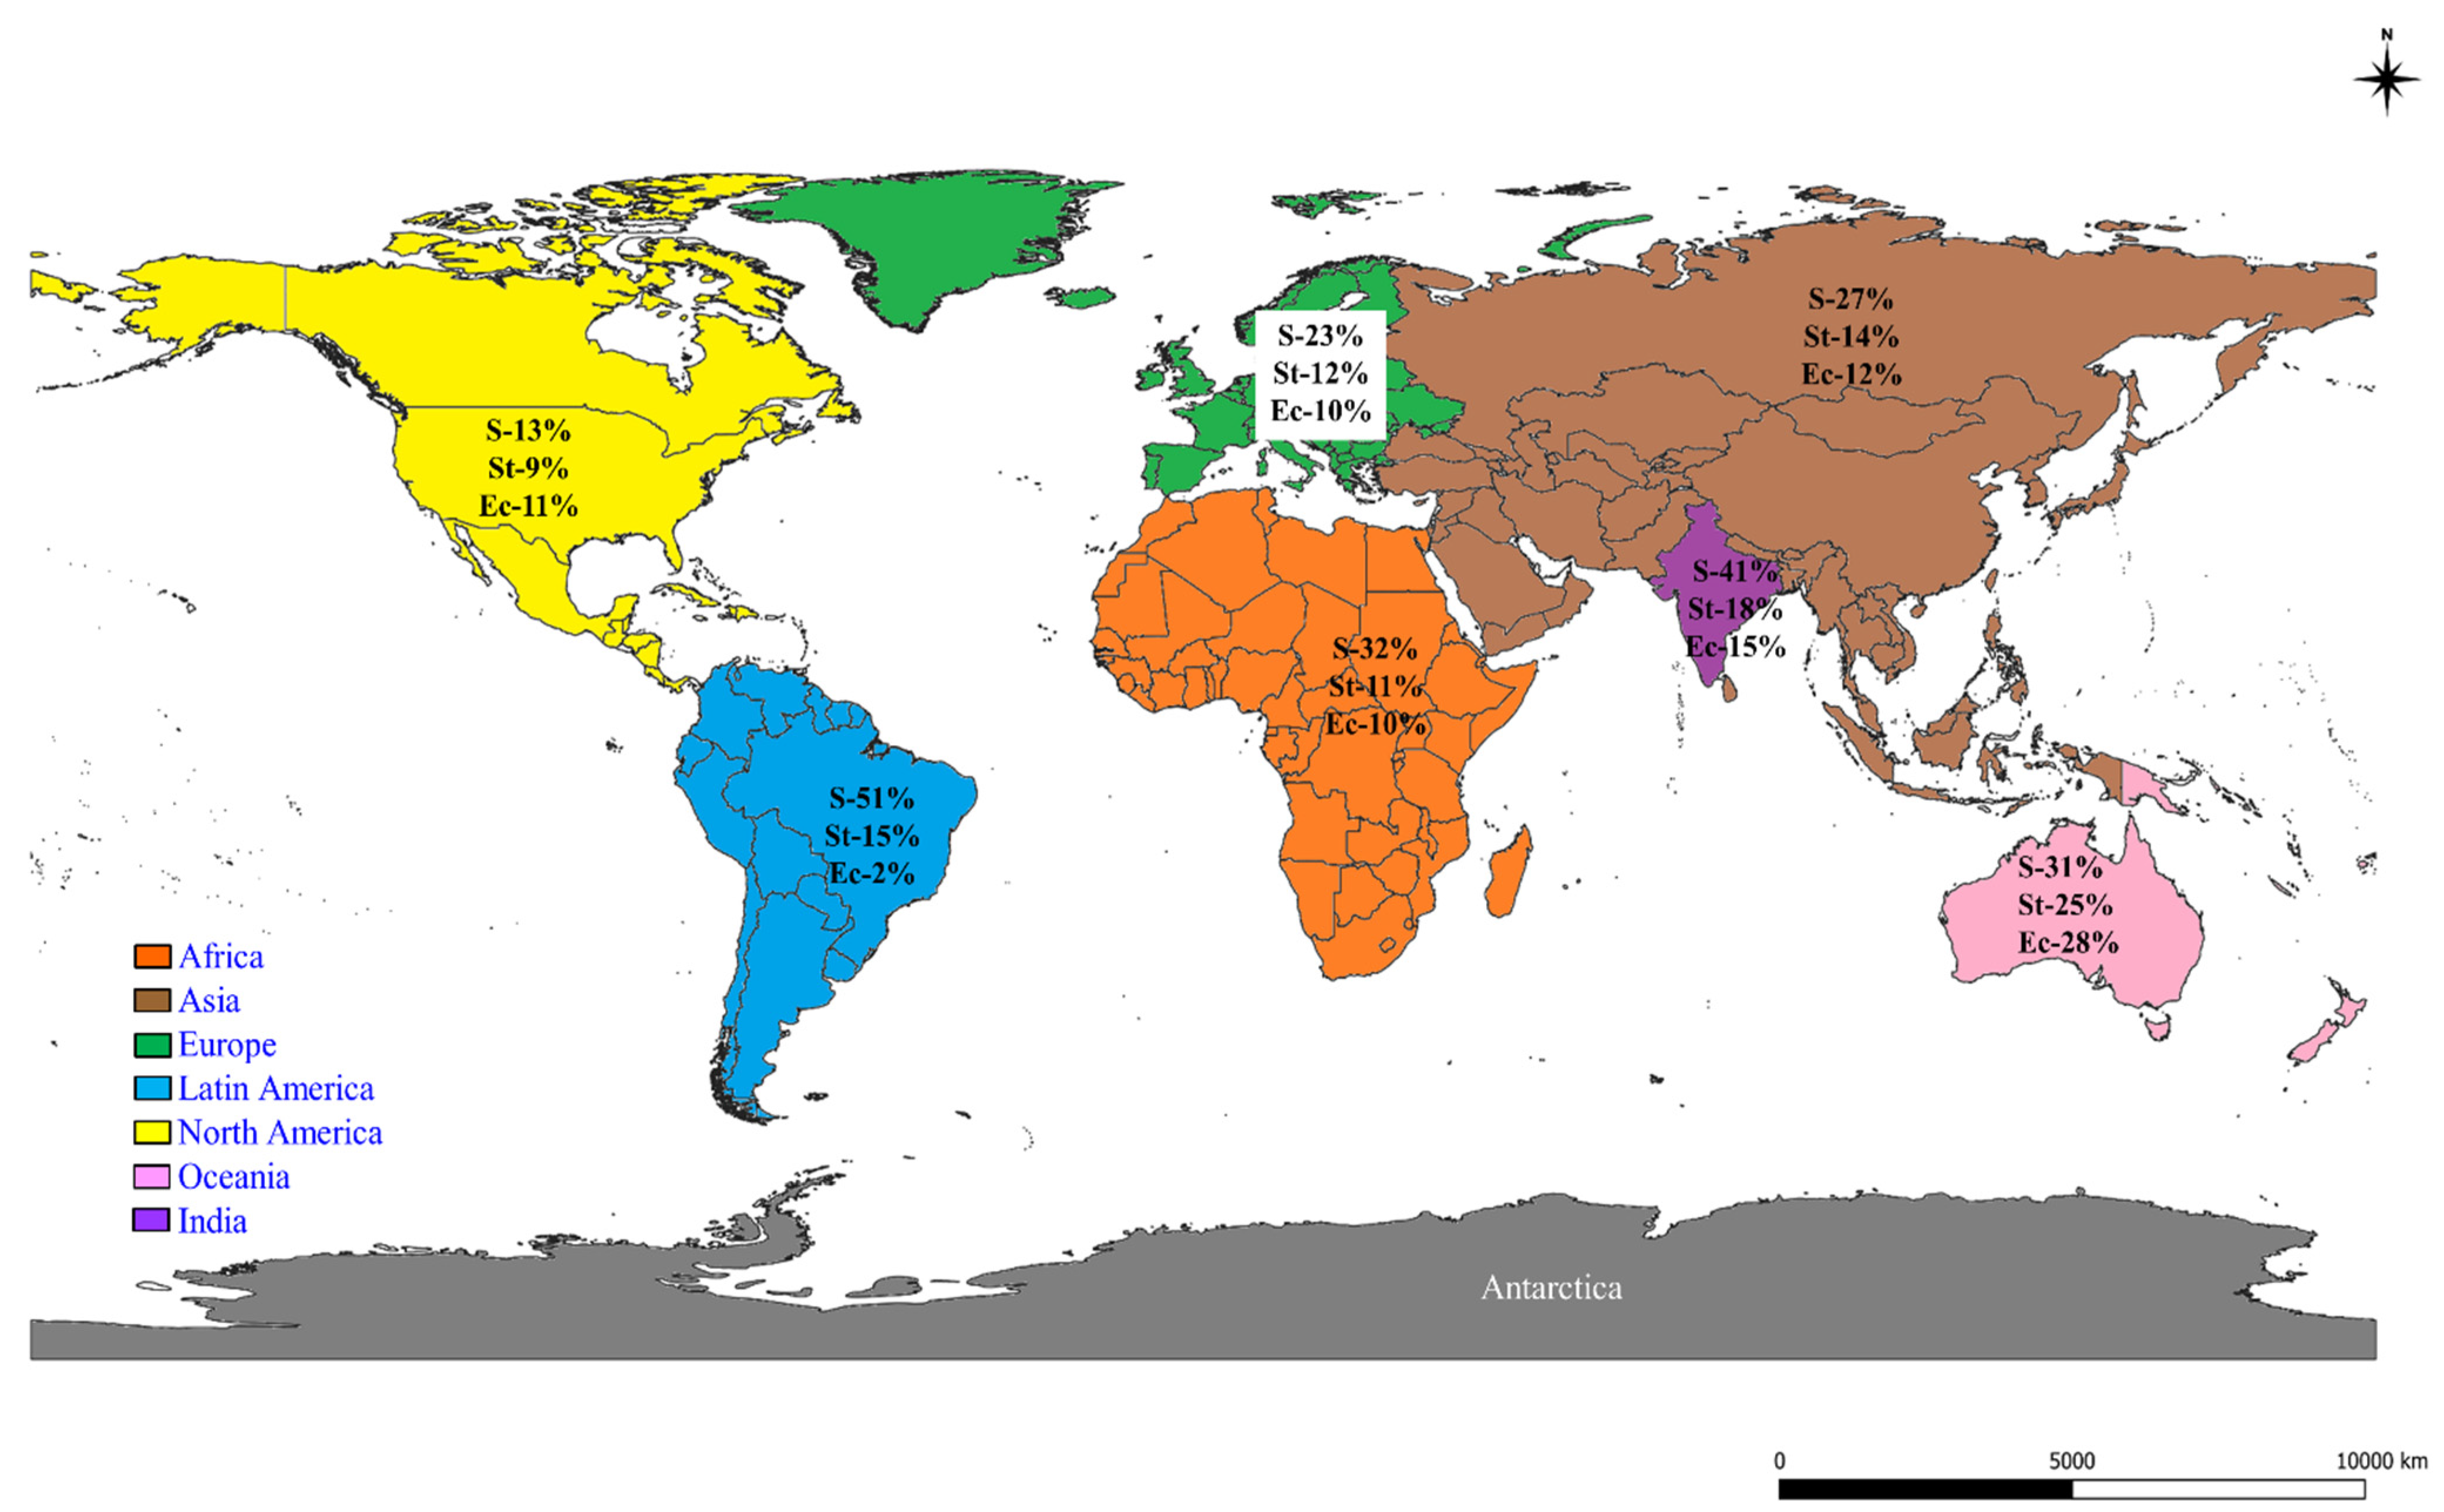
2.2. Prevalence of S, St, and Ec in the World
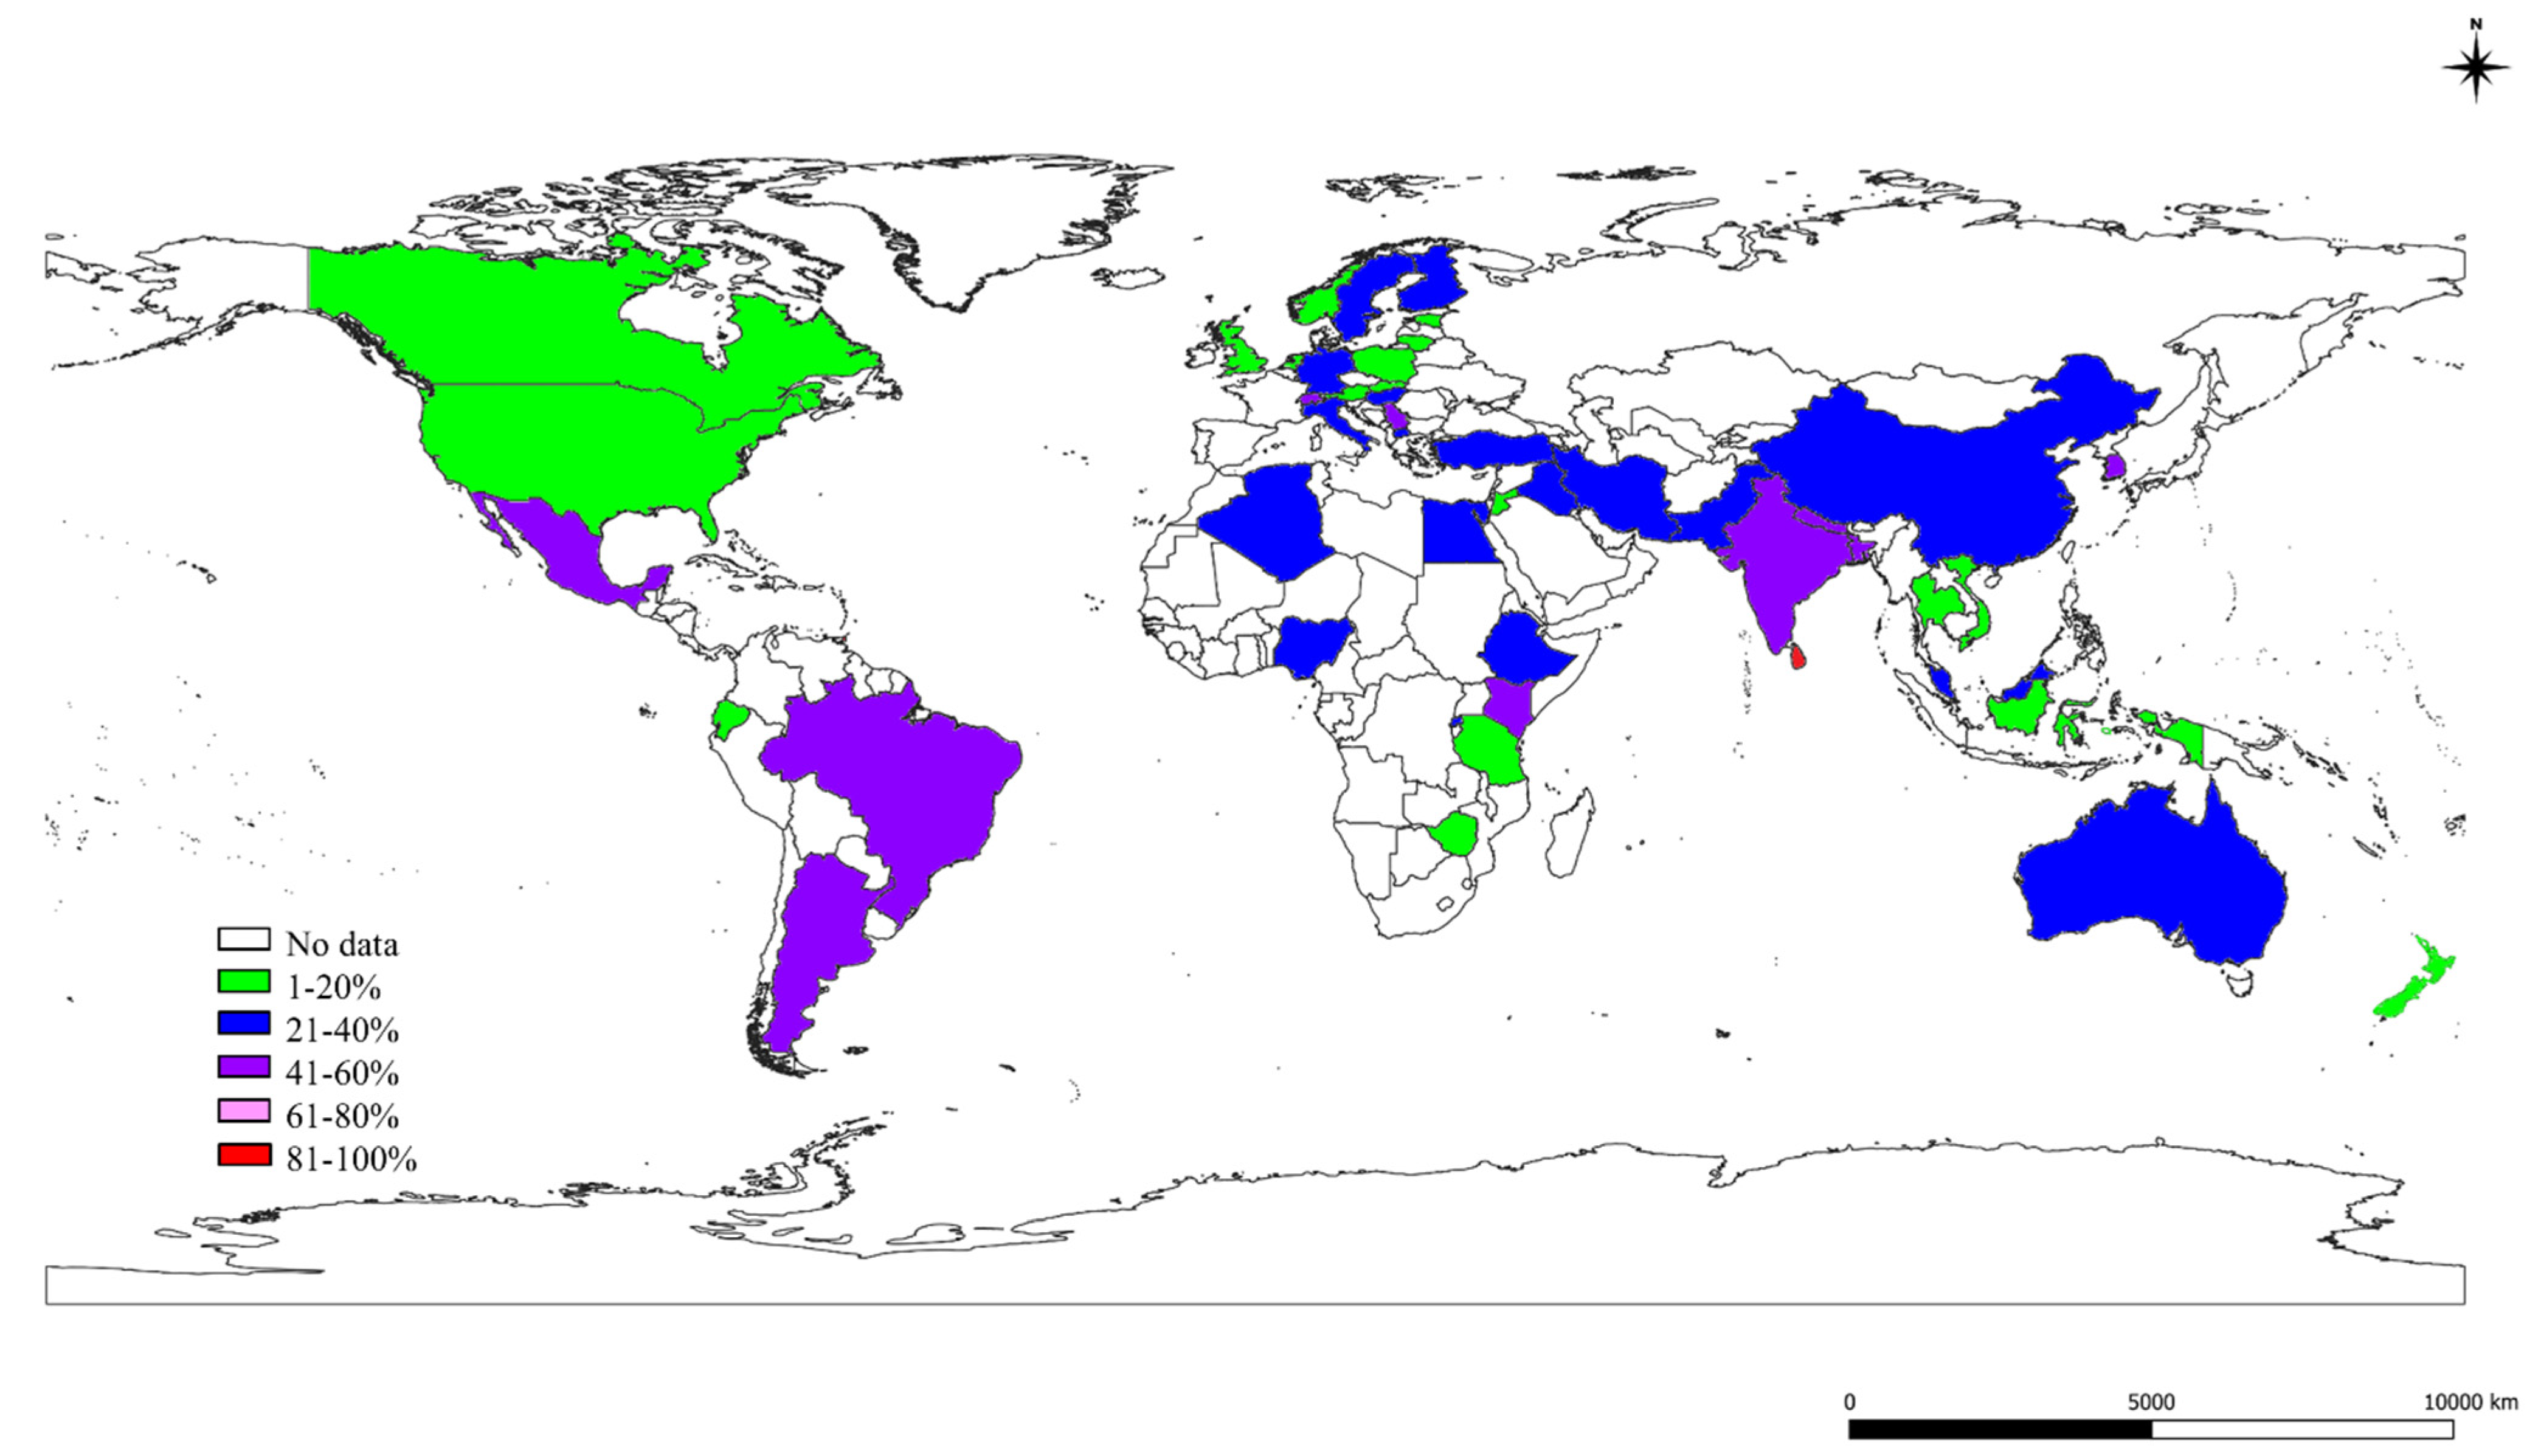
2.3. The S, St, and Ec Prevalence in Various Countries
3. Discussion
4. Materials and Methods
4.1. Literature Search
4.2. Extraction of Data
4.3. Quality Assessment of Studies
4.4. Statistical Analysis
5. Conclusions
Supplementary Materials
Author Contributions
Funding
Institutional Review Board Statement
Informed Consent Statement
Data Availability Statement
Acknowledgments
Conflicts of Interest
References
- Ruegg, P. A 100-year review: Mastitis detection, management, and prevention. J. Dairy Sci. 2017, 100, 10381–10397. [Google Scholar] [CrossRef] [PubMed]
- FAO. Impact of Mastitis in the Small-Scale Dairy Production System; Working Paper No.13; FAO: Rome, Italy, 2014; pp. 1–34. [Google Scholar]
- Costello, S. Consultant Guide to the Economics of Mastitis. 2004. Available online: https://www.smartstock-usa.com (accessed on 10 June 2020).
- Bansal, B.K.; Gupta, D.K. Economic analysis of bovine mastitis in India and Punjab—A review. Indian J. Dairy Sci. 2009, 62, 337–345. [Google Scholar]
- Krishnamoorthy, P.; Suresh, K.P.; Roy, P. Meta-analysis: An innovative tool for estimating the prevalence of livestock diseases. Res. Rev. J. Vet. Sci. Technol. 2020, 9, 4–7. [Google Scholar]
- Krishnamoorthy, P.; Suresh, K.P.; Saha, S.; Govindaraj, G.; Shome, B.R.; Roy, P. Meta-analysis of prevalence of subclinical and clinical mastitis, major mastitis pathogens in dairy cattle in India. Int. J. Cur. Microbiol. Appl. Sci. 2017, 6, 1214–1234. [Google Scholar] [CrossRef]
- Krishnamoorthy, P.; Ashwini, M.; Suresh, K.P.; Siju, S.J.; Roy, P. Prevalence of Anaplasma species in India and the World in dairy animals: A systematic review and meta-analysis. Res. Vet. Sci. 2019, 123, 159–170. [Google Scholar] [CrossRef]
- Krishnamoorthy, P.; Hamsapriya, S.; Ashwini, M.; Patil, S.S.; Roy, P.; Suresh, K.P. Systematic review and meta-analysis of livestock associated-methicillin resistant Staphylococcus aureus (LA-MRSA) prevalence in animals in India. Int. J. Livestock Res. 2019, 9, 179–191. [Google Scholar] [CrossRef]
- Walker, E.; Hernandez, A.V.; Kattan, M.W. Meta-analysis: Its strengths and limitations. Clevel. Clin. J. Med. 2008, 75, 431–439. [Google Scholar] [CrossRef] [PubMed]
- FAOSTAT. Population of Live Animals in the World—Visualization Tool. 2020. Available online: http://www.fao.org/faostat/en/#data/QA/visualize (accessed on 25 August 2020).
- STATISTA. Milk Production and Consumption Statistics. 2020. Available online: https://www.statista.com/statistics/535806/consumption-of-fluid-milk-per-capita-worldwide-country/ (accessed on 25 August 2020).
- BAHS. Basic Animal Husbandry Statistics, Ministry of Fisheries, Animal Husbandry and Dairying; Department of Animal Husbandry and Dairying, Krishi Bhawan: New Delhi, India, 2019; pp. 1–132.
- Erskine, R.J.; Bartlett, P.C.; VanLente, J.L.; Phipps, C.R. Efficacy of systemic ceftiofur as a therapy for severe clinical mastitis in dairy cattle. J. Dairy Sci. 2002, 85, 2571–2575. [Google Scholar] [CrossRef]
- Quinn, P.J.; Carter, M.E.; Markey, B.K.; Carter, G.R. Clinical Veterinary Microbiology; Harcourt Publishers: Richmond, VA, USA, 2002; pp. 331–344. [Google Scholar]
- Hosseinzadeh, S.; Saei, H.D. Staphylococcal species associated with bovine mastitis in the North West of Iran: Emerging of coagulase-negative staphylococci. Int. J. Vet. Sci. Med. 2014, 2, 27–34. [Google Scholar] [CrossRef]
- Bakken, G. Subclinical mastitis in Norwegian dairy cows: Prevalence rates and epidemiological assessments. Acta. Agri. Scand. 1981, 31, 273–286. [Google Scholar] [CrossRef]
- Daniel, R.C.W.; O’boyle, D.; Marek, M.S.; Frost, A.J. A survey of clinical mastitis in south-east Queensland dairy herds. Aust. Vet. J. 1982, 58, 143–147. [Google Scholar] [CrossRef]
- Anderson, K.L.; Lyman, R.; Moury, K.; Ray, D.; Watson, D.W.; Correa, M.T. Molecular epidemiology of Staphylococcus aureus mastitis in dairy heifers. J. Dairy Sci. 2011, 95, 4921–4930. [Google Scholar] [CrossRef] [PubMed]
- Bortolami, A.; Gianesella, M.; Fiore, E.; Corro, M.; Catania, S.; Morgante, M. Evaluation of the udder health status in subclinical mastitis affected dairy cows through bacteriological culture, somatic cell count and thermographic imaging. Pol. J. Vet. Sci. 2015, 18, 799–805. [Google Scholar] [CrossRef]
- Suleiman, T.S.; Karimuribo, E.D.; Mdegela, R.H. Prevalence of bovine subclinical mastitis and antibiotic susceptibility patterns of major mastitis pathogens isolated in Unguja island of Zanzibar, Tanzania. Trop. Anim. Health Prod. 2018, 50, 259–266. [Google Scholar] [CrossRef] [PubMed]
- Vakkamäki, J.; Taponen, S.; Heikkilä, A.M.; Pyörälä, S. Bacteriological etiology and treatment of mastitis in finnish dairy herds. Acta Vet. Scand. 2017, 59, 1–9. [Google Scholar] [CrossRef] [PubMed]
- Krishnamoorthy, P.; Satyanarayana, M.L.; Shome, B.R. Coagulase negative staphylococcal species mastitis: Overview. Res. J. Vet. Sci. 2016, 9, 1–10. [Google Scholar]
- Bradley, A.J.; Green, M.J. Aetiology of clinical mastitis in six Somerset dairy herds. Vet. Rec. 2001, 148, 683–686. [Google Scholar] [CrossRef] [PubMed]
- Dieser, S.A.; Vissio, C.; Lasagno, M.C.; Bogni, C.I.; Larriestra, A.J.; Odierno, L.M. Prevalence of pathogens causing subclinical mastitis in Argentinean dairy herds. Pak. Vet. J. 2014, 34, 124–126. [Google Scholar] [CrossRef]
- Petrovski, K.R.; Heuer, C.; Parkinson, T.J.; Williamson, N.B. The incidence and aetiology of clinical bovine mastitis on 14 farms in Northland, New Zealand. N. Z. Vet. J. 2009, 57, 109–115. [Google Scholar] [CrossRef]
- Baloch, H.; Rind, T.; Shah, G.; Kalhoro, D.H.; Kalhora, A.B. Study of clinical mastitis in buffaloes caused by Staphylococcal species. Pak. J. Agri. Engg. Vet. Sci. 2013, 29, 88–95. [Google Scholar]
- Amosun, E.A.; Ajuwape, A.T.P.; Adetosoye, A.I. Bovine streptococcal mastitis in southwest and northern states of Nigeria. Afr. J. Biomed. Res. 2010, 13, 33–37. [Google Scholar]
- Zhang, S.; Piepers, S.; Shan, R.; Cai, L.; Mao, S.; Zou, J.; Ali, T.; De Vliegher, S.; Han, B. Phenotypic and genotypic characterization of antimicrobial resistance profiles in Streptococcus dysgalactiae isolated from bovine clinical mastitis in 5 provinces of China. J. Dairy Sci. 2018, 101, 3344–3355. [Google Scholar] [CrossRef]
- Abera, B.; Lemma, D.; Iticha, I. Study of bovine mastitis in Asella government dairy farm of Oromia Regional state, South Eastern Ethiopia. Int. J. Curr. Res. Acad. Rev. 2013, 1, 134–145. [Google Scholar]
- Gao, J.; Barkema, H.W.; Zhang, L.; Liu, G.; Deng, Z.; Cai, L.; Shan, R.; Zhang, S.; Zou, J.; Kastelic, J.P.; et al. Incidence of clinical mastitis and distribution of pathogens on large Chinese dairy farms. J. Dairy Sci. 2017, 100, 4797–4806. [Google Scholar] [CrossRef]
- Bhanot, V.; Chaudhri, S.S.; Bisla, R.S.; Singh, H. Retrospective study on prevalence and antibiogram of mastitis in cows and buffaloes of eastern Haryana. Indian J. Anim. Res. 2012, 46, 160–163. [Google Scholar]
- Tripathi, S.; Arora, N.; Shekhar, S.; Rajora, V.S. Etio-prevalence of subclinical mastitis in crossbred cattle. J. Entomol. Zool. Stud. 2018, 6, 778–780. [Google Scholar]
- Islam, N.N.; Farzana, Z.; Chowdhury, A.M.M.A.; Mannan, A.; Kamaruddin, K.M.; Siddiki, A.M.A.M.Z.; Uddin, I. Characterization of bovine subclinical mastitis caused by Staphylococcus aureus in southern Bangladesh by bacteriological and molecular approaches. Asian J. Biol. Sci. 2014, 7, 1–12. [Google Scholar] [CrossRef][Green Version]
- Lakshmi, R.; Jayavardhanan, K. Isolation and identification of major causing bacteria from bovine mastitis. Int. J. Appl. Pure Sci. Agric. 2016, 2, 45–48. [Google Scholar]
- Ranjan, R.; Gupta, M.K.; Singh, K.K. Study of bovine mastitis in different climatic conditions in Jharkhand, India. Vet. World 2011, 4, 205–208. [Google Scholar] [CrossRef]
- Charaya, G.; Sharma, A.; Kumar, A.; Singh, M.; Goel, P. Pathogens isolated from clinical mastitis in Murrah buffaloes and their antibiogram. Vet. World 2014, 7, 980–985. [Google Scholar] [CrossRef]
- Wilson, D.J.; Gonzalez, R.N.; Das, H.H. Bovine mastitis pathogens in New York and Pennsylvania: Prevalence and effects on somatic cell count and milk production. J. Dairy Sci. 1997, 80, 2592–2598. [Google Scholar] [CrossRef]
- Breen, J.E.; Green, M.J.; Bradley, A.J. Quarter and cow risk factors associated with the occurrence of clinical mastitis in dairy cows in the United Kingdom. J. Dairy Sci. 2009, 92, 2551–2561. [Google Scholar] [CrossRef]
- Kurjogi, M.M.; Kaliwal, B.B. Prevalence and antimicrobial susceptibility of bacteria isolated from bovine mastitis. Adv. Appl. Sci. Res. 2011, 2, 229–235. [Google Scholar]
- Harini, H.; Sumathi, B.R. Screening of bovine milk samples for sub-clinical mastitis and antibiogram of bacterial isolates. Vet. World 2011, 4, 358–359. [Google Scholar] [CrossRef]
- Jeykumar, M.; Vinodkumar, G.; Bashir, B.P.; Krovvidi, S. Antibiogram of mastitis pathogens in the milk of crossbred cows in Namakkal district, Tamil Nadu. Vet. World 2013, 6, 354–356. [Google Scholar] [CrossRef]
- Joshi, S.; Gokhale, S. Status of mastitis as an emerging disease in improved and periurban dairy farms in India. Ann. N. Y. Acad. Sci. 2006, 1081, 74–83. [Google Scholar] [CrossRef]
- Moher, D.; Shamseer, L.; Clarke, M.; Ghersi, D.; Liberati, A.; Petticrew, M.; Shekelle, P.; Stewart, L.A.; Group, P.P. Preferred reporting items for systematic review and meta-analysis protocols (PRISMA-P) 2015 statement. Syst. Rev. 2015, 4, 1–9. [Google Scholar] [CrossRef] [PubMed]
- Suresh, K.P.; Patil, S.S.; Hamsapriya, S.; Shinduja, R.; Roy, P.; Amachavadi, R.G. Prevalence of extended-spectrum beta-lactamase-producing bacteria from animal origin: A systematic review and meta-analysis report from India. PLoS ONE 2019, 14, e0221771. [Google Scholar] [CrossRef]
- Schwarzer, G. Meta: An R package for meta-analysis. R. News 2007, 7, 40–45. [Google Scholar]


| No. | Continents | Countries | Studies (Author and Year) | SCM-1, CM-2, M-3 | S.-1, St.-2, Ec-3 | Quality Assessment of the Studies # | |||||
|---|---|---|---|---|---|---|---|---|---|---|---|
| Sample Representation (Maximum Score = 2) | Size of Sample (Maximum Score = 2) | Methods Employed (Maximum Score = 2) | Prevalence Values (Maximum Score = 2) | Assessment of Outcome (Maximum Score = 2) | Total Score (Maximum Score = 10) | ||||||
| 1. | Africa | Algeria | Akkou et al., 2018 | 3 | 1 | ** | ** | * | ** | * | 8 |
| 2. | Bakir et al., 2011 | 1 | 1, 2, 3 | * | * | * | * | * | 5 | ||
| 3. | Benhamed et al., 2011 | 3 | 1, 2, 3 | ** | * | * | ** | * | 7 | ||
| 4. | Saidi et al., 2013 | 3 | 1, 2, 3 | ** | ** | * | ** | * | 8 | ||
| 5. | Egypt | Abdel-Rady and Sayed, 2009 | 1 | 1, 2, 3 | ** | ** | * | ** | * | 8 | |
| 6. | Abd-Elrahman, 2013 | 3 | 1, 2, 3 | * | * | * | ** | * | 6 | ||
| 7. | Abo-Shama, 2014 | 3 | 1 | ** | ** | ** | ** | * | 9 | ||
| 8. | Ahmed et al., 2018 | 1 | 3 | ** | ** | ** | ** | * | 9 | ||
| 9. | Amin et al., 2011 | 3 | 1, 2, 3 | ** | ** | ** | ** | * | 9 | ||
| 10. | El-Jakee et al., 2013 | 3 | 1 | ** | ** | ** | ** | * | 9 | ||
| 11. | Elbably et al., 2013 | 3 | 1, 3 | ** | ** | * | ** | * | 8 | ||
| 12. | Elhaig and Selim, 2014 | 1 | 1, 2 | ** | ** | ** | ** | * | 9 | ||
| 13. | Elsayed et al., 2015 | 3 | 1 | ** | ** | ** | ** | * | 9 | ||
| 14. | Hamed and Zaitoun,2014 | 1 | 1, 2, 3 | ** | ** | ** | ** | * | 9 | ||
| 15. | Lamey et al., 2013 | 3 | 3 | * | * | * | ** | * | 6 | ||
| 16. | Sayed et al., 2014 | 3 | 1, 2, 3 | * | * | * | ** | * | 6 | ||
| 17. | Zaki et al., 2010 | 1 | 1, 2, 3 | ** | ** | * | ** | * | 8 | ||
| 18. | Ethiopia | Abebe et al., 2012 | 3 | 1, 2, 3 | ** | ** | * | ** | * | 8 | |
| 19. | Abebe et al., 2016 | 3 | 1 | ** | ** | * | ** | * | 8 | ||
| 20. | Abera et al., 2013 | 3 | 1, 2, 3 | ** | ** | * | ** | * | 8 | ||
| 21. | Abunna et al., 2013 | 3 | 1, 2, 3 | ** | ** | * | ** | * | 8 | ||
| 22. | Adane et al., 2012 | 3 | 1, 2, 3 | ** | ** | * | ** | * | 8 | ||
| 23. | Amin et al., 2017 | 3 | 2 | ** | ** | * | ** | * | 8 | ||
| 24. | Ayano et al., 2013 | 1 | 1, 2, 3 | ** | ** | * | ** | * | 8 | ||
| 25. | Belayneh et al., 2013 | 3 | 1, 2, 3 | ** | ** | * | ** | * | 8 | ||
| 26. | Birhanu et al., 2017 | 1 | 1, 2, 3 | ** | ** | * | ** | * | 8 | ||
| 27. | Dego and Tareke, 2003 | 3 | 1, 2 | ** | * | * | ** | * | 7 | ||
| 28. | Demme and Abegaz, 2015 | 2 | 1, 2, 3 | * | * | * | ** | * | 6 | ||
| 29. | Duguma et al., 2014 | 3 | 1, 2 | ** | * | * | ** | * | 7 | ||
| 30. | Elemo et al., 2017 | 3 | 1 | ** | ** | * | ** | * | 8 | ||
| 31. | Getahun et al., 2008 | 3 | 1, 2 | ** | ** | * | ** | * | 8 | ||
| 32. | Haftu et al., 2012 | 3 | 1, 2, 3 | ** | ** | * | ** | * | 8 | ||
| 33. | Hailemeskel et al., 2014 | 3 | 1, 2, 3 | ** | ** | * | ** | * | 8 | ||
| 34. | Kedir et al., 2016 | 3 | 1 | ** | ** | * | ** | * | 8 | ||
| 35. | Lakew et al., 2009 | 3 | 1, 2 | ** | ** | * | ** | * | 8 | ||
| 36. | Megersa et al., 2012 | 3 | 1, 2, 3 | ** | ** | * | ** | * | 8 | ||
| 37. | Mekibib et al., 2010 | 3 | 1, 2, 3 | ** | ** | * | ** | * | 8 | ||
| 38. | Mekonnen and Tesfaye, 2010 | 3 | 1, 2 | ** | ** | * | ** | * | 8 | ||
| 39. | Michael et al., 2013 | 3 | 1, 2 | ** | ** | * | ** | * | 8 | ||
| 40. | Mulate et al., 2017 | 1 | 1, 2, 3 | ** | ** | * | ** | * | 8 | ||
| 41. | Pal et al., 2017 | 1 | 1, 2, 3 | ** | * | * | ** | * | 7 | ||
| 42. | Seid et al., 2015 | 3 | 1, 2, 3 | ** | ** | * | ** | * | 8 | ||
| 43. | Shiferaw and Telila, 2016 | 3 | 1, 2 | ** | ** | * | ** | * | 8 | ||
| 44. | Sori et al., 2005 | 3 | 1, 2, 3 | * | * | * | ** | * | 6 | ||
| 45. | Tadesse and Chanie, 2012 | 3 | 1, 2, 3 | ** | ** | * | ** | * | 8 | ||
| 46. | Tekle and Berihe, 2015 | 3 | 1, 3 | ** | ** | * | ** | * | 8 | ||
| 47. | Tesfaye and Albera, 2018 | 3 | 1, 2, 3 | ** | ** | * | ** | * | 8 | ||
| 48. | Tesfaye, 2017 | 3 | 1, 2, 3 | ** | ** | * | ** | * | 8 | ||
| 49. | Wubishet et al., 2013 | 3 | 1, 2 | ** | * | * | ** | * | 7 | ||
| 50. | Yohannes and Alemu, 2018 | 3 | 1, 2, 3 | ** | ** | * | ** | * | 8 | ||
| 51. | Yohannis and Molla, 2013 | 3 | 1, 2, 3 | ** | ** | * | ** | * | 8 | ||
| 52. | Zenebe et al., 2014 | 3 | 1, 2, 3 | ** | ** | * | ** | * | 8 | ||
| 53. | Zeryehun and Abera, 2017 | 3 | 1, 2 | ** | ** | * | ** | * | 8 | ||
| 54. | Zeryehun et al., 2013 | 3 | 1, 2, 3 | ** | ** | * | ** | * | 8 | ||
| 55. | Kenya | Mureithi et al., 2017 | 1 | 1, 2, 3 | ** | * | * | ** | * | 7 | |
| 56. | Ondiek et al., 2013 | 1 | 1, 2, 3 | ** | * | * | ** | * | 7 | ||
| 57. | Nigeria | Amosun et al., 2010 | 2 | 2 | * | * | * | ** | * | 6 | |
| 58. | Junaidu et al., 2011 | 3 | 1, 2, 3 | ** | * | * | ** | * | 7 | ||
| 59. | Marimuthu et al., 2014 | 2 | 1 | ** | ** | * | ** | * | 8 | ||
| 60. | Umaru et al., 2017 | 3 | 1 | ** | ** | * | ** | * | 8 | ||
| 61. | Rwanda | Iraguha et al., 2015 | 1 | 1 | ** | ** | * | ** | * | 8 | |
| 62. | Mpatswenumugabo et al., 2017 | 1 | 1, 2, 3 | ** | ** | * | ** | * | 8 | ||
| 63. | Ndahetuye et al., 2019 | 1 | 1, 2 | ** | ** | * | ** | * | 8 | ||
| 64. | Seychelles | Watson et al., 1996 | 3 | 1, 2 | ** | * | * | ** | * | 7 | |
| 65. | Tanzania | Kivaria et al., 2006 | 3 | 1, 2, 3 | ** | ** | * | ** | * | 8 | |
| 66. | Mdegela et al., 2004 | 3 | 1, 2 | ** | ** | * | ** | * | 8 | ||
| 67. | Mdegela et al., 2009 | 3 | 1, 2, 3 | ** | * | * | ** | * | 7 | ||
| 68. | Motto et al., 2017 | 3 | 1 | * | * | * | ** | * | 6 | ||
| 69. | Suleiman et al., 2013 | 1 | 1, 2, 3 | ** | ** | * | ** | * | 8 | ||
| 70. | Suleiman et al., 2018 | 1 | 1, 3 | ** | ** | * | ** | * | 8 | ||
| 71. | Zimbabwe | Kudinhaa and Simango, 2002 | 3 | 1 | * | * | * | ** | * | 6 | |
| 72. | Perry et al., 1987 | 2 | 1, 2 | ** | ** | * | ** | * | 8 | ||
| 73. | Asia | Bangladesh | Kayesh et al., 2014 | 1 | 1, 2, 3 | ** | ** | * | ** | * | 8 |
| 74. | Islam et al., 2014 | 1 | 1 | ** | * | ** | ** | * | 8 | ||
| 75. | China | Bi et al., 2016 | 3 | 1, 2, 3 | ** | ** | ** | ** | * | 9 | |
| 76. | Cao et al., 2007 | 2 | 1, 2 | * | * | * | ** | * | 6 | ||
| 77. | Cheng et al., 2019 | 2 | 1, 2, 3 | ** | ** | * | ** | * | 8 | ||
| 78. | Gao et al., 2016 | 2 | 1, 2, 3 | ** | * | * | ** | * | 7 | ||
| 79. | Li et al., 2009 | 1 | 1 | ** | ** | * | ** | * | 8 | ||
| 80. | Memon et al., 2012 | 3 | 1, 2 | ** | ** | ** | ** | * | 9 | ||
| 81. | Zhang et al., 2017 | 2 | 2 | * | ** | * | ** | * | 7 | ||
| 82. | Indonesia | Harjanti et al., 2018 | 1 | 1, 2 | * | * | * | ** | * | 6 | |
| 83. | Lucia et al., 2017 | 1 | 1, 2 | * | * | * | ** | * | 6 | ||
| 84. | Iran | Atyabi et al., 2006 | 3 | 1, 2, 3 | ** | * | * | ** | * | 7 | |
| 85. | Haghkhah et al., 2009 | 3 | 1, 2 | * | ** | * | ** | * | 7 | ||
| 86. | Haghkhah et al., 2011 | 1 | 1, 2, 3 | ** | ** | * | ** | * | 8 | ||
| 87. | Hashemi et al., 2011 | 3 | 2, 3 | ** | ** | * | ** | * | 8 | ||
| 88. | Jamali et al., 2014 | 2 | 1 | * | * | * | ** | * | 6 | ||
| 89. | Kalantari et al., 2013 | 1 | 1, 2, 3 | ** | ** | * | ** | * | 8 | ||
| 90. | Marashifard et al., 2019 | 1 | 3 | ** | * | * | ** | * | 7 | ||
| 91. | Moatamedi et al., 2007 | 1 | 2 | * | * | ** | ** | * | 7 | ||
| 92. | Momtaz, 2010 | 3 | 3 | ** | ** | * | ** | * | 8 | ||
| 93. | Panahi and Saei, 2019 | 3 | 1 | * | ** | * | ** | * | 7 | ||
| 94. | Reza et al., 2011 | 3 | 1, 2 | ** | ** | * | ** | * | 8 | ||
| 95. | Iraq | Abdulkadhim et al., 2012 | 1 | 1 | ** | ** | * | ** | * | 8 | |
| 96. | Hussein, 2012 | 1 | 1, 2, 3 | ** | ** | * | ** | * | 8 | ||
| 97. | Jordan | Alekish, 2015 | 1 | 1, 2, 3 | ** | ** | * | ** | * | 8 | |
| 98. | Lafi et al., 1994 | 3 | 1, 2 | ** | ** | * | ** | * | 8 | ||
| 99. | Malaysia | Othman and Bahaman, 2005 | 1 | 1, 2, 3 | ** | * | * | ** | * | 7 | |
| 100. | Nepal | Shrestha and Bindari, 2012 | 1 | 1, 2, 3 | ** | ** | * | ** | * | 8 | |
| 101. | Pakistan | Ali et al., 2011 | 1 | 1, 2, 3 | ** | ** | * | ** | * | 8 | |
| 102. | Baloch et al., 2013 | 2 | 1 | * | * | * | ** | * | 6 | ||
| 103. | Farooq et al., 2008 | 3 | 1, 2, 3 | * | * | * | ** | * | 6 | ||
| 104. | Rafiullah et al., 2017 | 3 | 1, 3 | * | ** | * | ** | * | 7 | ||
| 105. | Umar et al., 2013 | 3 | 1, 2, 3 | ** | ** | * | ** | * | 8 | ||
| 106. | South Korea | Nam et al., 2010 | 3 | 1, 2, 3 | ** | ** | * | ** | * | 8 | |
| 107. | Sri Lanka | Sanotharan et al., 2016 | 1 | 1, 2, 3 | ** | ** | * | ** | * | 8 | |
| 108. | Thailand | Suriyasathaporn, 2011 | 1 | 1, 2 | * | ** | * | ** | * | 7 | |
| 109. | Turkey | Bal et al., 2010 | 1 | 1, 2 | * | ** | * | ** | * | 7 | |
| 110. | Boynukara et al., 2008 | 1 | 1 | * | ** | * | ** | * | 7 | ||
| 111. | Kirkan et al., 2003 | 3 | 1 | * | * | * | ** | * | 6 | ||
| 112. | Turutoglu et al., 2002 | 3 | 1, 2, 3 | * | ** | * | ** | * | 7 | ||
| 113. | Vietnam | Ostensson et al., 2013 | 1 | 1, 2 | ** | ** | * | ** | * | 8 | |
| 114. | Europe | Croatia | Macesic et al., 2012 | 3 | 1, 3 | ** | ** | * | ** | * | 8 |
| 115. | Macesic et al., 2016 | 1 | 1, 2 | ** | ** | * | ** | * | 8 | ||
| 116. | Czech Republic | Cervinkova et al., 2013 | 3 | 1, 2 | ** | ** | ** | ** | * | 9 | |
| 117. | Vikova et al., 2017 | 2 | 1, 2 | ** | ** | ** | ** | * | 9 | ||
| 118. | Estonia | Kalmus et al., 2006 | 2 | 1, 2, 3 | ** | ** | * | ** | * | 8 | |
| 119. | Finland | Pyorala et al., 2011 | 3 | 1, 2, 3 | * | ** | * | ** | * | 7 | |
| 120. | Vakkamaki et al., 2017 | 3 | 1, 2, 3 | * | * | ** | ** | * | 7 | ||
| 121. | Germany | Edinger et al., 2000 | 2 | 1, 2, 3 | * | * | * | ** | * | 6 | |
| 122. | Soltau et al., 2016 | 2 | 1, 2 | ** | ** | * | ** | * | 8 | ||
| 123. | Italy | Bortolami et al., 2015 | 1 | 1, 2 | * | * | * | ** | * | 6 | |
| 124. | Ceniti et al., 2017 | 2 | 1, 2 | * | * | * | ** | * | 6 | ||
| 125. | Kosovo | Sylejmani et al., 2016 | 1 | 1, 2, 3 | ** | ** | * | ** | * | 8 | |
| 126. | Lithuania | Klimiene et al., 2011 | 3 | 1, 2 | ** | ** | * | ** | * | 8 | |
| 127. | Netherlands | Doofer et al., 1998 | 2 | 3 | ** | ** | ** | ** | * | 9 | |
| 128. | Miltenburg et al., 1996 | 2 | 1, 2 | ** | ** | * | ** | * | 8 | ||
| 129. | Swinkels et al., 2013 | 2 | 1 | * | * | * | ** | * | 6 | ||
| 130. | Norway | Bakken,1981 | 1 | 1 | ** | ** | * | ** | * | 8 | |
| 131. | Poland | Hameed et al., 2006 | 3 | 1, 2, 3 | * | * | * | ** | * | 6 | |
| 132. | Krukowski et al., 2000 | 3 | 1, 2, 3 | * | ** | * | ** | * | 7 | ||
| 133. | Szczubial et al., 2012 | 1 | 1, 2 | * | * | * | ** | * | 6 | ||
| 134. | Serbia | Marija et al., 2016 | 3 | 1 | ** | * | * | ** | * | 7 | |
| 135. | Zutic et al., 2012 | 1 | 1 | ** | ** | * | ** | * | 8 | ||
| 136. | Slovakia | Idriss et al., 2013 | 2 | 1, 2, 3 | ** | * | * | ** | * | 7 | |
| 137. | Sweden | Bengtsson et al., 2009 | 2 | 1, 2, 3 | ** | ** | * | ** | * | 8 | |
| 138. | Hangnestam et al., 2007 | 2 | 1, 2, 3 | ** | ** | * | ** | * | 8 | ||
| 139. | Shitandi and Kihumbu, 2004 | 1 | 1, 2, 3 | ** | ** | * | ** | * | 8 | ||
| 140. | Switzerland | Graber et al., 2009 | 1 | 1 | ** | * | * | ** | * | 7 | |
| 141. | United Kingdom | Bradley and Green, 2001 | 2 | 3 | ** | * | * | ** | * | 7 | |
| 142. | Breen et al., 2009 | 2 | 2, 3 | ** | ** | * | ** | * | 8 | ||
| 143. | Davies et al., 2015 | 2 | 2 | ** | ** | * | ** | * | 8 | ||
| 144. | Milne et al., 2002 | 2 | 1, 2 | ** | ** | * | ** | * | 8 | ||
| 145. | Latin America | Argentina | Dieser et al., 2013 | 1 | 1, 2, 3 | ** | ** | * | ** | * | 8 |
| 146. | Gonzalez et al., 1980 | 1 | 1 | ** | ** | * | ** | * | 8 | ||
| 147. | Lasango et al., 2011 | 1 | 2 | ** | ** | * | ** | * | 8 | ||
| 148. | Brazil | Budri et al., 2015 | 1 | 1 | * | * | * | ** | * | 6 | |
| 149. | Freitas et al., 2008 | 1 | 1 | ** | * | * | ** | * | 7 | ||
| 150. | Mesquita et al., 2018, | 3 | 1, 2 | ** | ** | * | ** | * | 8 | ||
| 151. | Pardo et al., 2007 | 3 | 1 | ** | ** | * | ** | * | 8 | ||
| 152. | Silva et al., 2013 | 3 | 1 | ** | ** | * | ** | * | 8 | ||
| 153. | Ecuador | Amer et al., 2018 | 3 | 1, 2 | ** | ** | * | ** | * | 8 | |
| 154. | Trinidad and Tobago | Adesiyun et al., 1998 | 2 | 1 | ** | ** | * | ** | * | 8 | |
| 155. | North America | Canada | Brooks et al., 1982 | 3 | 1, 2 | ** | ** | * | ** | * | 8 |
| 156. | Condas et al., 2016 | 3 | 1 | ** | ** | ** | ** | * | 9 | ||
| 157. | Lago et al., 2010 | 2 | 1, 3 | ** | * | * | ** | * | 7 | ||
| 158. | Saini et al., 2013 | 3 | 3 | ** | ** | * | ** | * | 8 | ||
| 159. | Mexico | Leon-Galvan et al., 2015 | 3 | 1, 2, 3 | ** | * | ** | ** | * | 8 | |
| 160. | United States of America | Anderson et al., 2011 | 3 | 1 | ** | ** | * | ** | * | 8 | |
| 161. | Erskine et al., 2002 | 2 | 1, 2, 3 | ** | * | * | ** | * | 7 | ||
| 162. | Ganda et al., 2016 | 2 | 1, 2, 3 | * | * | ** | ** | * | 7 | ||
| 163. | Gillespie et al., 2009 | 2 | 1 | ** | ** | * | ** | * | 8 | ||
| 164. | Green et al., 2002 | 2 | 2, 3 | ** | ** | * | ** | * | 8 | ||
| 165. | Morse et al., 1986 | 2 | 1 | * | * | * | ** | * | 6 | ||
| 166. | Pankey et al., 1991 | 3 | 1, 2 | ** | ** | * | ** | * | 8 | ||
| 167. | Sargeant et al., 1998 | 2 | 1, 2 | ** | ** | * | ** | * | 8 | ||
| 168. | Schrick et al., 2001 | 1 | 1, 2, 3 | * | * | * | ** | * | 6 | ||
| 169. | Wilson et al., 1997 | 3 | 1, 2, 3 | ** | ** | * | ** | * | 8 | ||
| 170. | Oceania | Australia | Daniel et al., 1982 | 2 | 1, 2 | * | * | * | ** | * | 6 |
| 171. | Phuektes et al., 2001 | 2 | 2 | * | * | * | ** | * | 6 | ||
| 172. | Plozza et al., 2011 | 1 | 1, 2, 3 | ** | ** | * | ** | * | 8 | ||
| 173. | Wanasinghe and Frost, 1979 | 1 | 1, 2 | ** | ** | * | ** | * | 8 | ||
| 174. | New Zealand | Petrovski et al., 2009 | 2 | 1, 2 | ** | ** | * | ** | * | 8 | |
| No. | Predictors | Model Results | Mixed-Effects Model Results | Test of Moderators | ||||||
|---|---|---|---|---|---|---|---|---|---|---|
| Estimate | Standard Error | Z Value (Test Statistic) | Tau2 (Estimated Residual Heterogeneity) | I2 (%) (Residual Heterogeneity) | H2 (Sampling Variability) | R2 (%) (Amount of Heterogeneity) | QM (Cochran Q Value for Moderators) | p-Value | ||
| Staphylococcus species | ||||||||||
| 1. | Year | −4.5307 | 3.7787 | −1.1990 | 0.0558 | 99.65 | 286.24 | 0.24 | 1.7404 | 0.1871 NS |
| 2. | Continents | 0.5320 | 0.2323 | 2.2907 | 0.0530 | 99.61 | 256.72 | 5.25 | 21.5992 | 0.0014 ** |
| 3. | Sample size | 0.4544 | 0.0141 | 32.3310 | 0.0562 | 99.70 | 333.93 | 0.00 | 0.0028 | 0.9575 NS |
| 4. | Methods | 0.4565 | 0.0149 | 30.3480 | 0.0508 | 99.60 | 249.05 | 9.23 | 31.6856 | <0.0001 ** |
| 5. | Species | 0.4911 | 0.0483 | 10.1651 | 0.0404 | 99.29 | 140.98 | 27.77 | 133.8008 | <0.0001 ** |
| 6. | Host | 0.4889 | 0.0538 | 9.0841 | 0.0560 | 99.72 | 352.49 | 0.00 | 0.4434 | 0.5055 NS |
| 7. | Countries | 0.2778 | 0.0690 | 4.0253 | 0.0380 | 99.47 | 186.93 | 32.18 | 182.9442 | <0.0001 ** |
| Streptococcus species | ||||||||||
| 1. | Year | −5.7737 | 2.6655 | −2.1661 | 0.0287 | 99.36 | 155.48 | 1.60 | 5.2140 | 0.0224 * |
| 2. | Continents | 0.3118 | 0.0172 | 18.1804 | 0.0294 | 99.32 | 147.40 | 0.00 | 3.2641 | 0.6593 NS |
| 3. | Sample size | 0.3130 | 0.0108 | 28.9534 | 0.0293 | 99.46 | 185.72 | 0.00 | 0.0422 | 0.8372 NS |
| 4. | Methods | 0.3071 | 0.0109 | 28.0433 | 0.0278 | 99.32 | 147.74 | 4.74 | 14.4731 | 0.0007 ** |
| 5. | Species | 0.1201 | 0.1705 | 0.7043 | 0.0285 | 98.74 | 79.37 | 2.36 | 24.9063 | 0.1636 NS |
| 6. | Host | 0.3174 | 0.0540 | 5.8828 | 0.0293 | 99.49 | 195.63 | 0.00 | 0.0080 | 0.9286 NS |
| 7. | Countries | 0.2389 | 0.0680 | 3.5142 | 0.0258 | 99.26 | 134.96 | 11.41 | 75.6491 | 0.0015 ** |
| Escherichia coli | ||||||||||
| 1. | Year | −7.502 | 7.3876 | −1.0179 | 0.0338 | 98.80 | 83.01 | 0.10 | 1.1417 | 0.2853 NS |
| 2. | Continents | 0.3747 | 0.0276 | 13.5921 | 0.0347 | 98.52 | 67.60 | 0.00 | 2.9948 | 0.7008 NS |
| 3. | Sample size | 0.3790 | 0.0192 | 19.6934 | 0.0331 | 99.49 | 195.72 | 2.41 | 3.0627 | 0.0801 NS |
| 4. | Methods | 0.3495 | 0.0192 | 18.2048 | 0.0298 | 98.75 | 80.19 | 12.01 | 13.3268 | 0.0003 ** |
| 5. | Host | 0.5549 | 0.0765 | 7.2487 | 0.0322 | 99.54 | 215.90 | 4.95 | 5.9864 | 0.0144 * |
| 6. | Countries | 0.4664 | 0.0929 | 5.0216 | 0.0283 | 97.10 | 34.45 | 16.33 | 50.2262 | 0.0212 * |
| No. | Categories | Period | Number of Studies | Total Samples | Pooled Estimates | Tests of Heterogeneity | |||||
|---|---|---|---|---|---|---|---|---|---|---|---|
| Prevalence (%) [CI at 95% Level) | PI (%) at 95% Level | I2 Value (%) | Tau Square Value | H Value | Degrees of Freedom | Cochran Q Value | |||||
| 1. | World | 1979–2019 | 156 | 283,685 | 28 (24–31) | 4–77 | 99.6 | 1.165 | 14.98 | 155 | 38,800.6 ** |
| Year-wise | |||||||||||
| 1. | World-I | 1979–2000 | 16 | 117,197 | 23 (12–24) | 1–92 | 99.8 | 2.797 | 24.30 | 15 | 2432.7 ** |
| 2. | World-II | 2001–2010 | 37 | 14,592 | 25 (18–32) | 3–77 | 98.7 | 1.296 | 8.79 | 36 | 1813.9 ** |
| 3. | World-III | 2011–2019 | 103 | 151,896 | 30 (26–34) | 6–73 | 98.8 | 0.852 | 9.28 | 102 | 8720.9 ** |
| Continent-wise | |||||||||||
| 1. | Africa | 1987–2019 | 67 | 13,702 | 32 (27–37) | 6–76 | 97.3 | 0.934 | 6.06 | 66 | 2701.3 ** |
| 2. | Asia | 1994–2019 | 36 | 13,396 | 27 (21–34) | 5–74 | 98.2 | 0.964 | 7.49 | 35 | 1578.1 ** |
| 3. | Europe | 1981–2017 | 27 | 131,152 | 23 (17–29) | 4–67 | 99.2 | 0.836 | 11.12 | 26 | 4228.9 ** |
| 4. | Latin America | 1980–2018 | 9 | 2587 | 51 (27–75) | 2–98 | 98.9 | 2.491 | 9.69 | 8 | 805.5 ** |
| 5. | North America | 1982–2016 | 13 | 116,927 | 13 (8–20) | 2–57 | 99.5 | 0.876 | 13.79 | 12 | 568.0 ** |
| 6. | Oceania | 1979–2011 | 4 | 5921 | 31 (16–50) | 1–96 | 98.6 | 0.657 | 8.54 | 3 | 151.9 ** |
| Period-wise | |||||||||||
| 1. | Africa-I | 1987–2010 | 14 | 3108 | 24 (12–43) | 1–92 | 98.6 | 2.588 | 8.42 | 13 | 856.6 ** |
| 2. | Africa-II | 2011–2019 | 53 | 10,594 | 34 (30–38) | 11–68 | 95.3 | 0.501 | 4.63 | 52 | 1018.6 ** |
| 3. | Asia-I | 1994–2010 | 12 | 5410 | 28 (21–36) | 8–62 | 96.4 | 0.395 | 5.26 | 11 | 192.7 ** |
| 4. | Asia-II | 2011–2019 | 24 | 7986 | 27 (19–37) | 3–80 | 98.2 | 1.282 | 7.50 | 23 | 1269.7 ** |
| 5. | Europe-I | 1981–2009 | 11 | 6438 | 23 (14–36) | 2–78 | 98.9 | 1.115 | 9.41 | 10 | 708.0 ** |
| 6. | Europe-II | 2011–2017 | 16 | 124,714 | 22 (16–30) | 5–63 | 98.9 | 0.655 | 9.58 | 15 | 2219.0 ** |
| 7. | Latin America-I | 1980–2008 | 4 | 615 | 62 (19–92) | 0–100 | 98.5 | 3.959 | 8.11 | 3 | 373.8 ** |
| 8. | Latin America-II | 2013–2018 | 5 | 1972 | 43 (22–66) | 2–97 | 98.3 | 1.143 | 7.69 | 4 | 369.1 ** |
| 9. | North America-I | 1982–2009 | 9 | 110,401 | 12 (7–21) | 1–59 | 99.3 | 0.857 | 11.82 | 8 | 487.5 ** |
| 10. | North America-II | 2011–2016 | 4 | 6526 | 16 (7–32) | 0–95 | 98.6 | 0.887 | 8.46 | 3 | 70.1 ** |
| 11. | Oceania-I | 1979–2009 | 3 | 5817 | 23 (14–35) | 0–100 | 97.5 | 0.266 | 6.27 | 2 | 74.7 ** |
| 12. | Oceania-II | 2011 | 1 | 104 | 60 | - | - | - | - | - | - |
| Host species-wise | |||||||||||
| 1. | Cattle | 1979–2019 | 147 | 281,390 | 28 (24–31) | 4–76 | 99.6 | 1.163 | 15.27 | 146 | 38,517.2 ** |
| 2. | Buffalo | 2008–2019 | 13 | 2255 | 31 (20–46) | 4–84 | 96.9 | 1.131 | 5.71 | 12 | 291.7 ** |
| Method-wise | |||||||||||
| 1. | Cultural Examination | 1979–2019 | 132 | 154,085 | 27 (23–31) | 4–77 | 99.1 | 1.210 | 10.70 | 131 | 11,559.6 ** |
| 2. | Molecular methods | 2008–2019 | 19 | 124,004 | 35 (26–45) | 7–80 | 99.0 | 0.874 | 10.11 | 18 | 1769.9 ** |
| 3. | Other methods | 1980–2019 | 13 | 7989 | 22 (16–29) | 5–58 | 96.6 | 0.478 | 5.39 | 12 | 363.4 ** |
| Bacterial species-wise | |||||||||||
| 1. | S. aureus | 1979–2019 | 137 | 273,336 | 25 (21–29) | 3–76 | 99.5 | 1.287 | 14.62 | 136 | 15,898.9 ** |
| 2. | CNS | 1996–2017 | 18 | 123,118 | 20 (14–28) | 3–65 | 98.8 | 0.842 | 8.97 | 17 | 2022.0 ** |
| 3. | S. auricularis | 2010 | 1 | 100 | 14 | - | - | - | - | - | - |
| 4. | S. captis | 2010 and 2019 | 2 | 268 | 7 (4–10) | - | 0.0 | 0.0 | 1.00 | 1 | 0.13 NS |
| 5. | S. caseolyticus | 2002 | 1 | 131 | 1.5 | - | - | - | - | - | - |
| 6. | S. chromogenes | 2002–2019 | 9 | 6453 | 11 (6–19) | 1–56 | 97.1 | 0.866 | 5.82 | 8 | 170.7 ** |
| 7. | S. cohnii | 2010 and 2015 | 2 | 136 | 4 (2–9) | - | 0.0 | 0.0 | 1.00 | 1 | 0.45 NS |
| 8. | S. devriesei | 2019 | 1 | 168 | 1.6 | - | - | - | - | - | - |
| 9. | S. epidermidis | 1980–2019 | 27 | 11,337 | 9 (6–13) | 1–46 | 95.8 | 1.005 | 4.89 | 26 | 1047.1 ** |
| 10. | S. haemolyticus | 2010–2019 | 3 | 5417 | 8 (3–23) | 0–100 | 96.5 | 1.047 | 5.32 | 2 | 77.4 ** |
| 11. | S. hominis | ||||||||||
| 12. | S. hyicus | 2002–2016 | 8 | 1991 | 6 (3–12) | 1–39 | 93.0 | 0.732 | 3.78 | 7 | 65.1 ** |
| 13. | S. intermidius | 2004–2015 | 8 | 2808 | 4 (2–8) | 1–26 | 85.8 | 0.599 | 2.65 | 7 | 52.3 ** |
| 14. | S. kloosii | 2002 and 2019 | 2 | 299 | 1 (0–3) | - | 0.0 | 0.0 | 1.00 | 1 | 0.03 NS |
| 15. | S. lentus | 2002 and 2011 | 3 | 254 | 4 (2–7) | 0–71 | 0.0 | 0.0 | 1.00 | 2 | 0.98 NS |
| 16. | S. lugdunensis | 2019 | 1 | 168 | 0.6 | - | - | - | - | - | - |
| 17. | S. muscae | 2019 | 1 | 131 | 0.8 | - | - | - | - | - | - |
| 18. | S. pasteuri | 2019 | 1 | 168 | 2.4 | - | - | - | - | - | - |
| 19. | S. saprophyticus | 2002–2019 | 5 | 1314 | 3 (1–9) | 0–72 | 86.3 | 1.586 | 2.70 | 4 | 39.6 ** |
| 20. | S. sciuri | 2002–2019 | 4 | 608 | 4 (1–14) | 0–94 | 90.8 | 1.453 | 3.29 | 3 | 45.6 ** |
| 21. | S. simulans | 2002–2018 | 7 | 6083 | 5 (2–10) | 0–41 | 92.5 | 0.882 | 3.65 | 6 | 55.1 ** |
| 22. | S. warneri | 2010–2019 | 4 | 383 | 2 (1–7) | 0–71 | 56.9 | 0.826 | 1.52 | 3 | 11.65 * |
| 23. | S. xylosus | 2002–2019 | 7 | 5896 | 5 (3–10) | 1–30 | 87.0 | 0.505 | 2.77 | 6 | 71.3 ** |
| 24. | S. species | 1991–2018 | 34 | 119,139 | 25 (18–35) | 2–83 | 99.5 | 1.651 | 14.13 | 33 | 3280.5 ** |
| Type of mastitis | |||||||||||
| 1. | Subclinical mastitis | 1979–2019 | 50 | 15,165 | 30 (24–36) | 4–79 | 98.3 | 1.176 | 7.69 | 49 | 20.2.3 ** |
| 2. | Clinical mastitis | 1982–2019 | 27 | 17,344 | 22 (15–32) | 2–84 | 99.3 | 1.878 | 12.15 | 26 | 2115.3 ** |
| 3. | Mastitis | 1982–2019 | 79 | 251,176 | 29 (25–33) | 6–73 | 99.6 | 0.882 | 16.07 | 78 | 33,759.1 ** |
| No. | Categories | Period | Number of Studies | Total Samples | Pooled Estimates | Tests of Heterogeneity | ||||||
|---|---|---|---|---|---|---|---|---|---|---|---|---|
| Prevalence (%) [CI at 95% Level] | PI (%) at 95% Level | I2 Value (%) | Tau Square Value | H Value | Degrees of Freedom | Cochran Q Value | ||||||
| 1. | World | 1979–2019 | 129 | 272,539 | 12 (10–14) | 2–54 | 99.3 | 1.151 | 11.96 | 128 | 10,173.8 ** | |
| Year-wise | ||||||||||||
| 1. | World-I | 1979–2000 | 13 | 116,643 | 7 (5–11) | 1–34 | 99.2 | 0.661 | 10.85 | 12 | 463.9 ** | |
| 2. | World-II | 2001–2010 | 34 | 13,505 | 11 (8–16) | 1–55 | 98.2 | 1.213 | 7.47 | 33 | 1571.2 ** | |
| 3. | World-III | 2011–2019 | 82 | 142,391 | 14 (11–17) | 2–57 | 98.4 | 1.114 | 8.00 | 81 | 6570.4 ** | |
| Continent-wise | ||||||||||||
| 1. | Africa | 1987–2019 | 56 | 11,217 | 11 (9–13) | 2–41 | 93.9 | 0.768 | 4.04 | 55 | 876.7 ** | |
| 2. | Asia | 1994–2019 | 31 | 12,993 | 14 (9–21) | 1–71 | 98.6 | 1.656 | 8.35 | 30 | 3048.0 ** | |
| 3. | Europe | 1996–2017 | 23 | 130,131 | 12 (8–18) | 1–62 | 99.4 | 1.359 | 13.12 | 22 | 3034.1 ** | |
| 4. | Latin America | 1980–2018 | 5 | 2147 | 15 (5–36) | 0–95 | 98.3 | 1.794 | 7.69 | 4 | 587.8 ** | |
| 5. | North America | 1982–2016 | 9 | 109,992 | 9 (8–11) | 5–16 | 85.3 | 0.056 | 2.61 | 8 | 64.1 ** | |
| 6. | Oceania | 1979–2011 | 5 | 6059 | 25 (12–44) | 1–91 | 98.6 | 0.929 | 8.39 | 4 | 199.1 ** | |
| Period-wise | ||||||||||||
| 1. | Africa-I | 1987–2010 | 15 | 3247 | 8 (5–14) | 1–56 | 95.4 | 1.398 | 4.65 | 14 | 315.3 ** | |
| 2. | Africa-II | 2011–2019 | 41 | 7970 | 12 (9–14) | 3–37 | 91.9 | 0.527 | 3.52 | 40 | 493.1 ** | |
| 3. | Asia-I | 1994–2010 | 10 | 4655 | 11 (6–19) | 1–62 | 96.8 | 1.159 | 5.63 | 9 | 282.1 ** | |
| 4. | Asia-II | 2011–2019 | 21 | 8338 | 17 (10–27) | 1–78 | 98.5 | 1.780 | 8.03 | 20 | 2735.8 ** | |
| 5. | Europe-I | 1996–2009 | 10 | 6782 | 9 (5–17) | 1–59 | 98.8 | 1.213 | 9.22 | 9 | 847.9 ** | |
| 6. | Europe-II | 2011–2017 | 13 | 123,349 | 15 (8–25) | 1–71 | 99.2 | 1.340 | 10.93 | 12 | 1548.5 ** | |
| 7. | Latin America-I | 1980 | 1 | 100 | 12 | - | - | - | - | - | - | |
| 8. | Latin America-II | 2011–2018 | 4 | 2047 | 16 (4–44) | 0–100 | 98.9 | 2.207 | 9.33 | 3 | 587.0 ** | |
| 9. | North America-I | 1982–2002 | 7 | 109,409 | 9 (7–11) | 5–17 | 89.0 | 0.067 | 3.02 | 6 | 57.6 ** | |
| 10. | North America-II | 2015 and 2016 | 2 | 583 | 10 (8–13) | - | 0.0 | 0.0 | 1.00 | 1 | 0.11 NS | |
| 11. | Oceania-I | 1982–2009 | 4 | 5955 | 23 (10–46) | 0–98 | 99.0 | 1.113 | 9.90 | 3 | 180.2 ** | |
| 12. | Oceania-II | 2011 | 1 | 104 | 34 | - | - | - | - | - | - | |
| Host species-wise | ||||||||||||
| 1. | Cattle | 1979–2019 | 123 | 271,307 | 12 (10–15) | 2–55 | 99.3 | 1.175 | 12.33 | 122 | 10,122.8 ** | |
| 2. | Buffalo | 2008–2017 | 7 | 1232 | 10 (6–17) | 2–45 | 85.8 | 0.501 | 2.66 | 6 | 49.2 ** | |
| Method-wise | ||||||||||||
| 1. | Cultural Examination | 1979–2019 | 119 | 150,988 | 12 (10–14) | 2–49 | 98.5 | 0.939 | 8.13 | 118 | 6571.5 ** | |
| 2. | Molecular methods | 2007–2018 | 10 | 121,977 | 17 (8–33) | 1–87 | 99.4 | 2.060 | 12.90 | 9 | 3525.2 ** | |
| 3. | Other methods | 1980 and 1994 | 2 | 347 | 3 (0–21) | - | 86.2 | 1.874 | 2.69 | 1 | 20.7 ** | |
| Bacterial species-wise | ||||||||||||
| 1. | St. acidominimus | 2010 and 2013 | 2 | 1151 | 2 (1–3) | - | 0.0 | 0.0 | 1.00 | 1 | 4.47 * | |
| 2. | St. agalactiae | 1979–2018 | 83 | 138,904 | 9 (7–12) | 1–57 | 99.0 | 1.662 | 10.07 | 82 | 6296.6 ** | |
| 3. | St. anginosus | 1994 and 2010 | 2 | 281 | 1 (0–3) | - | 0.0 | 0.0 | 1.00 | 1 | 1.73 NS | |
| 4. | St. bovis | 2010 and 2011 | 4 | 321 | 3 (1–5) | 1–11 | 0.0 | 0.0 | 1.00 | 3 | 1.66 NS | |
| 5. | St. constellatus | 2010 | 1 | 34 | 3 | - | - | - | - | - | - | |
| 6. | St. dysgalactiae | 1980–2018 | 55 | 141,844 | 6 (5–8) | 1–36 | 98.5 | 1.152 | 8.28 | 54 | 3131.1 ** | |
| 7. | St. equinus | 2001–2011 | 4 | 1571 | 2 (1–5) | 0–40 | 75.4 | 0.436 | 2.02 | 3 | 23.8 ** | |
| 8. | St. equisimilis | 2017 | 1 | 65 | 3 | - | - | - | - | - | - | |
| 9. | St. faecalis | 2002–2017 | 4 | 385 | 4 (2–8) | 0–46 | 50.2 | 0.339 | 1.42 | 3 | 8.15 * | |
| 10. | St. intermedius | 2017 | 2 | 319 | 6 (4–10) | - | 0.0 | 0.0 | 1.00 | 1 | 0.27 NS | |
| 11. | St. mitis | 2011 and 2018 | 2 | 104 | 2 (0–7) | - | 0.0 | 0.0 | 1.00 | 1 | 1.45 NS | |
| 12. | St. plurianimalium | 2017 | 1 | 65 | 1.5 | - | - | - | - | - | - | |
| 13. | St. pneumonia | 2009 | 1 | 71 | 1.4 | - | - | - | - | - | - | |
| 14. | St. pyogenes | 2014 | 1 | 47 | 10.6 | - | - | - | - | - | - | |
| 15. | St. salivaris | 2010 | 1 | 34 | 2 | - | - | - | - | - | - | |
| 16. | St. sanguinis | 2011–2018 | 2 | 104 | 8 (0–63) | - | 86.6 | 4.151 | 2.73 | 1 | 20.1 ** | |
| 17. | St. uberis | 1980–2018 | 52 | 139,050 | 9 (7–12) | 1–53 | 99.0 | 1.429 | 9.96 | 51 | 4000.7 ** | |
| 18. | St. zooepidemicus | 2010 | 1 | 130 | 3.9 | - | - | - | - | - | - | |
| 19. | St. species | 1982–2019 | 48 | 120,504 | 10 (8–12) | 2–37 | 97.5 | 0.687 | 6.30 | 47 | 959.9 ** | |
| Type of mastitis | ||||||||||||
| 1. | Subclinical mastitis | 1979–2019 | 40 | 12,853 | 13 (10–16) | 3–44 | 95.1 | 0.691 | 4.52 | 39 | 543.7 ** | |
| 2. | Clinical mastitis | 1982–2019 | 26 | 16,848 | 13 (8–20) | 1–72 | 99.2 | 1.811 | 11.13 | 25 | 2556.0 ** | |
| 3. | Mastitis | 1982–2018 | 63 | 242,838 | 11 (9–15) | 1–53 | 99.5 | 1.138 | 14.49 | 62 | 5973.1 ** | |
| No. | Categories | Period | Number of Studies | Total Samples | Pooled Estimates | Tests of Heterogeneity | |||||
|---|---|---|---|---|---|---|---|---|---|---|---|
| Prevalence (%) [CI at 95% Level] | PI (%) at 95% Level | I2 Value (%) | Tau Square Value | H Value | Degrees of Freedom | Cochran Q Value | |||||
| 1. | World | 1996–2019 | 92 | 257,473 | 11 (9–13) | 1–50 | 98.9 | 1.154 | 9.68 | 91 | 17,511.1 ** |
| Year-wise | |||||||||||
| 1. | World-I | 1996–2000 | 5 | 113,108 | 5 (1–20) | 0–95 | 99.8 | 2.685 | 24.61 | 4 | 10,139.0 ** |
| 2. | World-II | 2001–2010 | 23 | 8918 | 11 (7–16) | 1–52 | 97.7 | 1.088 | 6.59 | 22 | 540.3 ** |
| 3. | World-III | 2011–2019 | 64 | 135,447 | 11 (40–47) | 12–80 | 98.2 | 0.962 | 7.39 | 63 | 3439.4 ** |
| Continent-wise | |||||||||||
| 1. | Africa | 2006–2018 | 45 | 8142 | 10 (8–14) | 1–50 | 95.6 | 1.093 | 4.77 | 44 | 792.0 ** |
| 2. | Asia | 2002–2019 | 21 | 11,561 | 12 (9–17) | 3–42 | 97.0 | 0.579 | 5.80 | 20 | 394.7 ** |
| 3. | Europe | 1996–2017 | 16 | 129,580 | 10 (6–15) | 1–53 | 99.6 | 1.128 | 15.67 | 15 | 5117.3 ** |
| 4. | Latin America | 2013 | 1 | 1117 | 2 | - | - | - | - | - | - |
| 5. | North America | 1997–2016 | 8 | 106,969 | 11 (4–27) | 0–87 | 99.1 | 2.396 | 10.74 | 7 | 1399.0 ** |
| 6. | Oceania | 2011 | 1 | 104 | 28 | - | - | - | - | - | - |
| Period-wise | |||||||||||
| 1. | Africa-I | 2006–2010 | 6 | 636 | 5 (2–12) | 0–49 | 83.1 | 0.860 | 2.43 | 5 | 30.1 ** |
| 2. | Africa-II | 2011–2018 | 39 | 7506 | 11 (8–15) | 2–51 | 95.8 | 1.038 | 4.88 | 38 | 714.9 ** |
| 3. | Asia-I | 2002–2010 | 6 | 4309 | 9 (6–12) | 2–27 | 87.6 | 0.199 | 2.85 | 5 | 28.6 ** |
| 4. | Asia-II | 2011–2019 | 15 | 7252 | 15 (10–21) | 3–48 | 96.8 | 0.578 | 5.63 | 15 | 249.9 ** |
| 5. | Europe-I | 1996–2009 | 11 | 11,089 | 12 (6–20) | 1–61 | 99.1 | 1.103 | 10.61 | 10 | 679.6 ** |
| 6. | Europe-II | 2011–2017 | 5 | 118,491 | 6 (3–14) | 0–62 | 97.0 | 0.810 | 5.73 | 4 | 75.2 ** |
| 8. | Latin America-II | 2013 | 1 | 1117 | 2 | - | - | - | - | - | - |
| 9. | North America-I | 1997–2010 | 5 | 105,992 | 12 (3–44) | 0–99 | 99.5 | 3.742 | 14.16 | 4 | 1062.1 ** |
| 10. | North America-II | 2013–2016 | 3 | 977 | 9 (8–11) | 2–29 | 0.0 | 0.0 | 1.00 | 2 | 0.09 NS |
| 12. | Oceania-II | 2011 | 1 | 104 | 28 | - | - | - | - | - | - |
| Host species-wise | |||||||||||
| 1. | Cattle | 1996–2019 | 89 | 256,295 | 10 (8–13) | 1–51 | 99.0 | 1.187 | 9.82 | 88 | 16,809.4 ** |
| 2. | Buffalo | 2011–2018 | 6 | 1178 | 25 (9–52) | 0–96 | 97.9 | 2.070 | 6.84 | 5 | 167.2 ** |
| Method-wise | |||||||||||
| 1. | Cultural Examination | 1996–2019 | 87 | 131,774 | 10 (8–12) | 1–47 | 97.5 | 1.056 | 6.29 | 86 | 10,463.3 ** |
| 2. | Molecular methods | 1998–2018 | 8 | 125,838 | 23 (11–42) | 1–89 | 99.8 | 1.662 | 25.41 | 7 | 5387.8 ** |
| Type of mastitis | |||||||||||
| 1. | Subclinical mastitis | 2001–2019 | 29 | 6125 | 10 (7–14) | 1–47 | 94.6 | 1.002 | 4.29 | 28 | 671.7 ** |
| 2. | Clinical mastitis | 1996–2019 | 16 | 15,337 | 19 (14–25) | 5–52 | 98.4 | 0.494 | 7.79 | 15 | 687.8 ** |
| 3. | Mastitis | 1997–2018 | 47 | 236,011 | 9 (6–12) | 1–50 | 98.9 | 1.312 | 9.59 | 46 | 8384.4 ** |
Publisher’s Note: MDPI stays neutral with regard to jurisdictional claims in published maps and institutional affiliations. |
© 2021 by the authors. Licensee MDPI, Basel, Switzerland. This article is an open access article distributed under the terms and conditions of the Creative Commons Attribution (CC BY) license (https://creativecommons.org/licenses/by/4.0/).
Share and Cite
Krishnamoorthy, P.; Suresh, K.P.; Jayamma, K.S.; Shome, B.R.; Patil, S.S.; Amachawadi, R.G. An Understanding of the Global Status of Major Bacterial Pathogens of Milk Concerning Bovine Mastitis: A Systematic Review and Meta-Analysis (Scientometrics). Pathogens 2021, 10, 545. https://doi.org/10.3390/pathogens10050545
Krishnamoorthy P, Suresh KP, Jayamma KS, Shome BR, Patil SS, Amachawadi RG. An Understanding of the Global Status of Major Bacterial Pathogens of Milk Concerning Bovine Mastitis: A Systematic Review and Meta-Analysis (Scientometrics). Pathogens. 2021; 10(5):545. https://doi.org/10.3390/pathogens10050545
Chicago/Turabian StyleKrishnamoorthy, Paramanandham, Kuralayanapalya P. Suresh, Kavitha S. Jayamma, Bibek R. Shome, Sharanagouda S. Patil, and Raghavendra G. Amachawadi. 2021. "An Understanding of the Global Status of Major Bacterial Pathogens of Milk Concerning Bovine Mastitis: A Systematic Review and Meta-Analysis (Scientometrics)" Pathogens 10, no. 5: 545. https://doi.org/10.3390/pathogens10050545
APA StyleKrishnamoorthy, P., Suresh, K. P., Jayamma, K. S., Shome, B. R., Patil, S. S., & Amachawadi, R. G. (2021). An Understanding of the Global Status of Major Bacterial Pathogens of Milk Concerning Bovine Mastitis: A Systematic Review and Meta-Analysis (Scientometrics). Pathogens, 10(5), 545. https://doi.org/10.3390/pathogens10050545