1. Introduction
In the past decades, private vehicle use has vastly increased in cities, causing traffic jams and the misuse of time and resources. There is no current indication of any imminent reversal to this trend. Public transport is one of the main solutions to this problem (
Beirão and Cabral 2007), but there is no one-size-fits-all solution for all societies. Therefore, how can public transport in different locations address this situation and provide efficient options?
The approach toward a transport system is specific to a certain community (
Levine et al. 1980)—herein lies the need for comparative research. By understanding the specific needs and perceptions toward transport in a location, policies and infrastructure projects can be justified through the quantification of the generalized benefits to society (
Antoniou et al. 2007). Analyses have been carried out without restricting the results to the specific population for which the solution was proposed, and in some cases, models suitable to one population have misled planners dealing with another (
Shiftan et al. 2008). The particular concept of time and punctuality from each specific community can only be understood by knowing the environment of each community (
Levine et al. 1980).
Studies tell us that user preferences for public transport depend on several variables such as the time of day, trip purpose, and the age of the user (
Stradling et al. 2007). User perception of transport performance, and improvements in transport policy, are essential to transportation studies (
Tyrinopoulos and Antoniou 2008). Making commuters change their travel mode is not an easy task. It is necessary to determine which variables influence the individual’s initial decision, and how these variables might act in facilitating their decision to shift from private vehicles to public transportation. Once those factors have been identified, they can be improved to make public transportation more desirable and attractive to more passengers.
The most important variables taken into account by commuters are the cost and travel time of the trip. When the estimation of the desirable arrival time is not accurate, then travel time is a random variable, and when this variability exists, travel time is considered to not be reliable (
Carrion and Levinson 2012).
When choosing public transport, reliability is one of the most important factors (
Chen et al. 2009), since, in modern day societies, travel time is essential. If one cannot be sure of arriving on time when using a particular form of public transportation, that mode cannot be considered as a desirable option (
König and Axhausen 2002). By having a reliable bus transport system, commuters know that their time can be used more efficiently, which is why transit agencies have tried to improve reliability and attract new passengers (
Diab et al. 2015).
Bus transportation is a commonly available mode of transportation, given that it is cost effective, and its implementation is easier than other transportation systems like train or metro (
Hensher 2007). This study used disaggregate models to measure the impact of different variables that affect mode choice. The cost of trip and travel time are known to be the main components to be studied when analyzing mode choice using the utilitarian approach. The variability of travel time, which translates into reliability, is another major factor in the travelers’ mode choice, but its importance may vary by location, culture, and other circumstances. This study estimated the importance of the reliability of bus services in the decisions of travelers’ mode choice in three locations: Haifa in Israel, Quito in Ecuador, and Valencia in Spain. As these locations differ in bus context situation and culture, to isolate the effects of each one of them was not an easy task, so we focused specifically on waiting time reliability in this study.
Reliability
Reliability has been studied for the last 30 years. These studies tell us that reliability is an important factor whenever and wherever individuals need to make decisions regarding their mode of travel (
Nocera 2010), however, the actual services are often not perceived as reliable (
van Oort 2014). In order to quantify the importance given by the user toward reliability, we need to understand how commuters perceive reliability. Travel time is defined as “the period of time needed to traverse a route between origin and destination.” A service is considered to be reliable by a customer if it can deliver a satisfactory arrival to the expectations of the customer. Some public transportation modes such as trains, light rail, and Bus Rapid Transit systems (BRT), are generally highly reliable. Conventional bus systems are cheaper and often more convenient in cities, but due to the fact that they share the same infrastructure with private vehicles, buses are considered less reliable than other public transport modes.
Today’s populations are more demanding than previous ones due to the relatively low costs of car usage and their frequent use. Transit services in Zurich, as an example of a city addressing these contemporary demands, are generally considered to be reliable, punctual, comfortable, and in general, of high quality and are user oriented. Visitors to the city admire its efficiency, cleanliness, and safety (
Carrasco 2011). The usefulness of the service to the passenger is a function of travel cost and travel time, which is highly related to reliability. Other factors contributing to satisfaction are the availability of information regarding timetables, cleanliness of the vehicles and related facilities, and passenger security. Nevertheless, of all these variables, the most important is the travel time spent from the origin to destination.
“Travel time” can be divided into two components: average travel time and the variability (or irregularity) of travel time (
Carrion and Levinson 2012). Variability and reliability are inversely proportional. As the variability of travel time increases, so reliability decreases. Therefore, reliable travel time should not vary significantly from the average travel time, otherwise it is no longer reliable.
Attitudes can be explained by cultural factors (
Xu et al. 2007), in this paper, we decided to explore their attitude regarding the reliability of the busses between three countries from different continents in order to understand behaviors under diverse cultural and transport context conditions.
Based on the research addressed so far, the following assumption is described.
The importance of missing a scheduled bus will be different from country to country given their network characteristics and cultural background. Therefore, it is not expected that people from the three different countries compared in this study would have the same attitude.
2. Methodology
Reliability studies have been based on the mean variance and scheduling approach. Mean variance uses the measure of dispersion to evaluate reliability. The scheduling approach refers to different types of reliability when late or early; this method is preferred to modeling travel time reliability (
Carrion and Levinson 2012).
In our study, we used the scheduling approach for the values for earliness or lateness for travelers using bus transportation systems. The statistical methods are introduced, and then we describe and analyze the available survey
2.1. Statistical Methods on Value of Time and Reliability
The main methodologies to determine a user’s valuations of different travel characteristics on their choice of travel are revealed preference (RP) analysis and stated preference (SP) analysis. RP data represent the actual behavior of travelers and can be collected through travel surveys, diaries, and field experiments. SP data represent the behavior of the travelers in hypothetical situations (or scenarios); such data can be obtained through SP surveys and simulators. The SP method can overcome most of the weaknesses of the RP method. Therefore, in our study, we chose to use SP, where the respondents are presented with two alternatives with different attributes. These attributes are the values of travel time, cost, and reliability. By varying the travel time, cost, and reliability, the alternative that the respondent chooses is used to determine evaluations of the relative importance of these variables by estimating discrete choice models using the Logit model.
2.2. Survey
In this study, we wanted to focus on university students as the margin of error is smaller when the sample population is more segmented.
The reasons for choosing students and not the general population were:
Distribution of the survey. Social networks and the direct communication between professors and students.
Transportation system users. Students are more likely to use public transportation than average workers because of their socio-economic situation.
Given the sample group (university students) and their easy access to computers, we decided to use the SP design and web based application.
2.2.1. Distribution of the Survey
The distribution of the survey was through social networks and was distributed directly from the Professors to their students. The questionnaire was distributed online using Qualtrics (Qualtrics LLC, 2016), and this tool also allowed us to use the answers to previous questions as input in following questions in the same questionnaire. For example, if one question is “What is the duration of your trip from A to B?” then, the answers to this question can be used to develop scenarios regarding the duration of the same trip and present the desired variability of it. The same method was used to configure the hypothetical situations. Therefore, by using Qualtrics, the situations were familiar to each person and the questions were personalized.
2.2.2. Survey Design
The questionnaire contained 25 questions detailed on
Table 1, it was designed in five sections:
- (1)
Demographic and travel mode questions. In these questions, we confirmed that the sample was from students who were actually taking a bus to the university. Through these questions, we assured the homogeneity of the sample group and disregarded users who did not match the required profile.
- (2)
Socio-economic characteristics of the individual and household.
- (3)
Preferences and attitudinal response when taking the bus for this trip. This gave us an understanding of their travel behavior, which was compared with the behavior revealed from the mode choice model estimation results.
- (4)
Perceptions and attitudes towards reliability and travel time.
- (5)
The last part was the SP design questions, composed of binary questions where the respondents were asked to indicate their choice from two alternatives. The attributes of the alternatives were changed according to efficient design.
The distribution of questions was made to avoid fatigue in specific sections, and the final questionnaire design was as follows:
2.2.3. Representing Reliability on SP Questionnaires
The presented hypothetical situations aimed to show what the decisions would be of the travelers. The presentation of the scenarios can influence the travelers’ responses to the reliability of the transport system.
In order to show the scenarios for the SP design, we included the following example before the SP questionnaire section:
“Pretend that your current bus service for your usual home–university trip will be replaced with services A or B.
Both services run with the same characteristics, except for 3: Certainty of pick up times, Travel time, and Cost.
When we say that 1/10 (1 out of 10) will be 5 min early, we mean that over a period of time, this will be your average experience. You will not be able to predict when the early arrival will occur, but you will find that if you always arrive at the bus station on time, you will miss the service on 10% of occasions and have to wait for the next bus.
When we say that (5/10) will be late 5 min, we mean that over a period of time, this will be your average experience. You will not be able to predict when the early arrival will occur, but you will find that if you always arrive at the bus station on time, you will have to wait for the service on 50% of occasions. This may cause you to arrive late to your destination, and inconvenience you.
Note: We considered that a service “on time” was when the bus was ±2 min from the usual departure time, at the bus stop.”
Scenarios for reliability in the SP design are usually presented under one of these forms:
A set of representative trips.
A maximum level of delays.
Probability of delay.
Predetermined levels or earliness/lateness.
We used the schedule approach to focus on the earliness/lateness of bus arrivals at the bus stop.
3. Data Analysis
3.1. Data Compilation
The purpose of the data was to serve as input to the model. The data analysis detected whether there were differences between the populations.
Demographic and Travel Mode Questions
Using these questions, we confirmed that the sample was taken from students who actually used a bus on their way to university. We also confirmed the homogeneity of the sample group, while disregarding users who did not match the required profile.
Table 2 shows the general population and those areas in the cities from where the study was undertaken and these characteristics can be used to gain a general idea of the sample going to be tested.
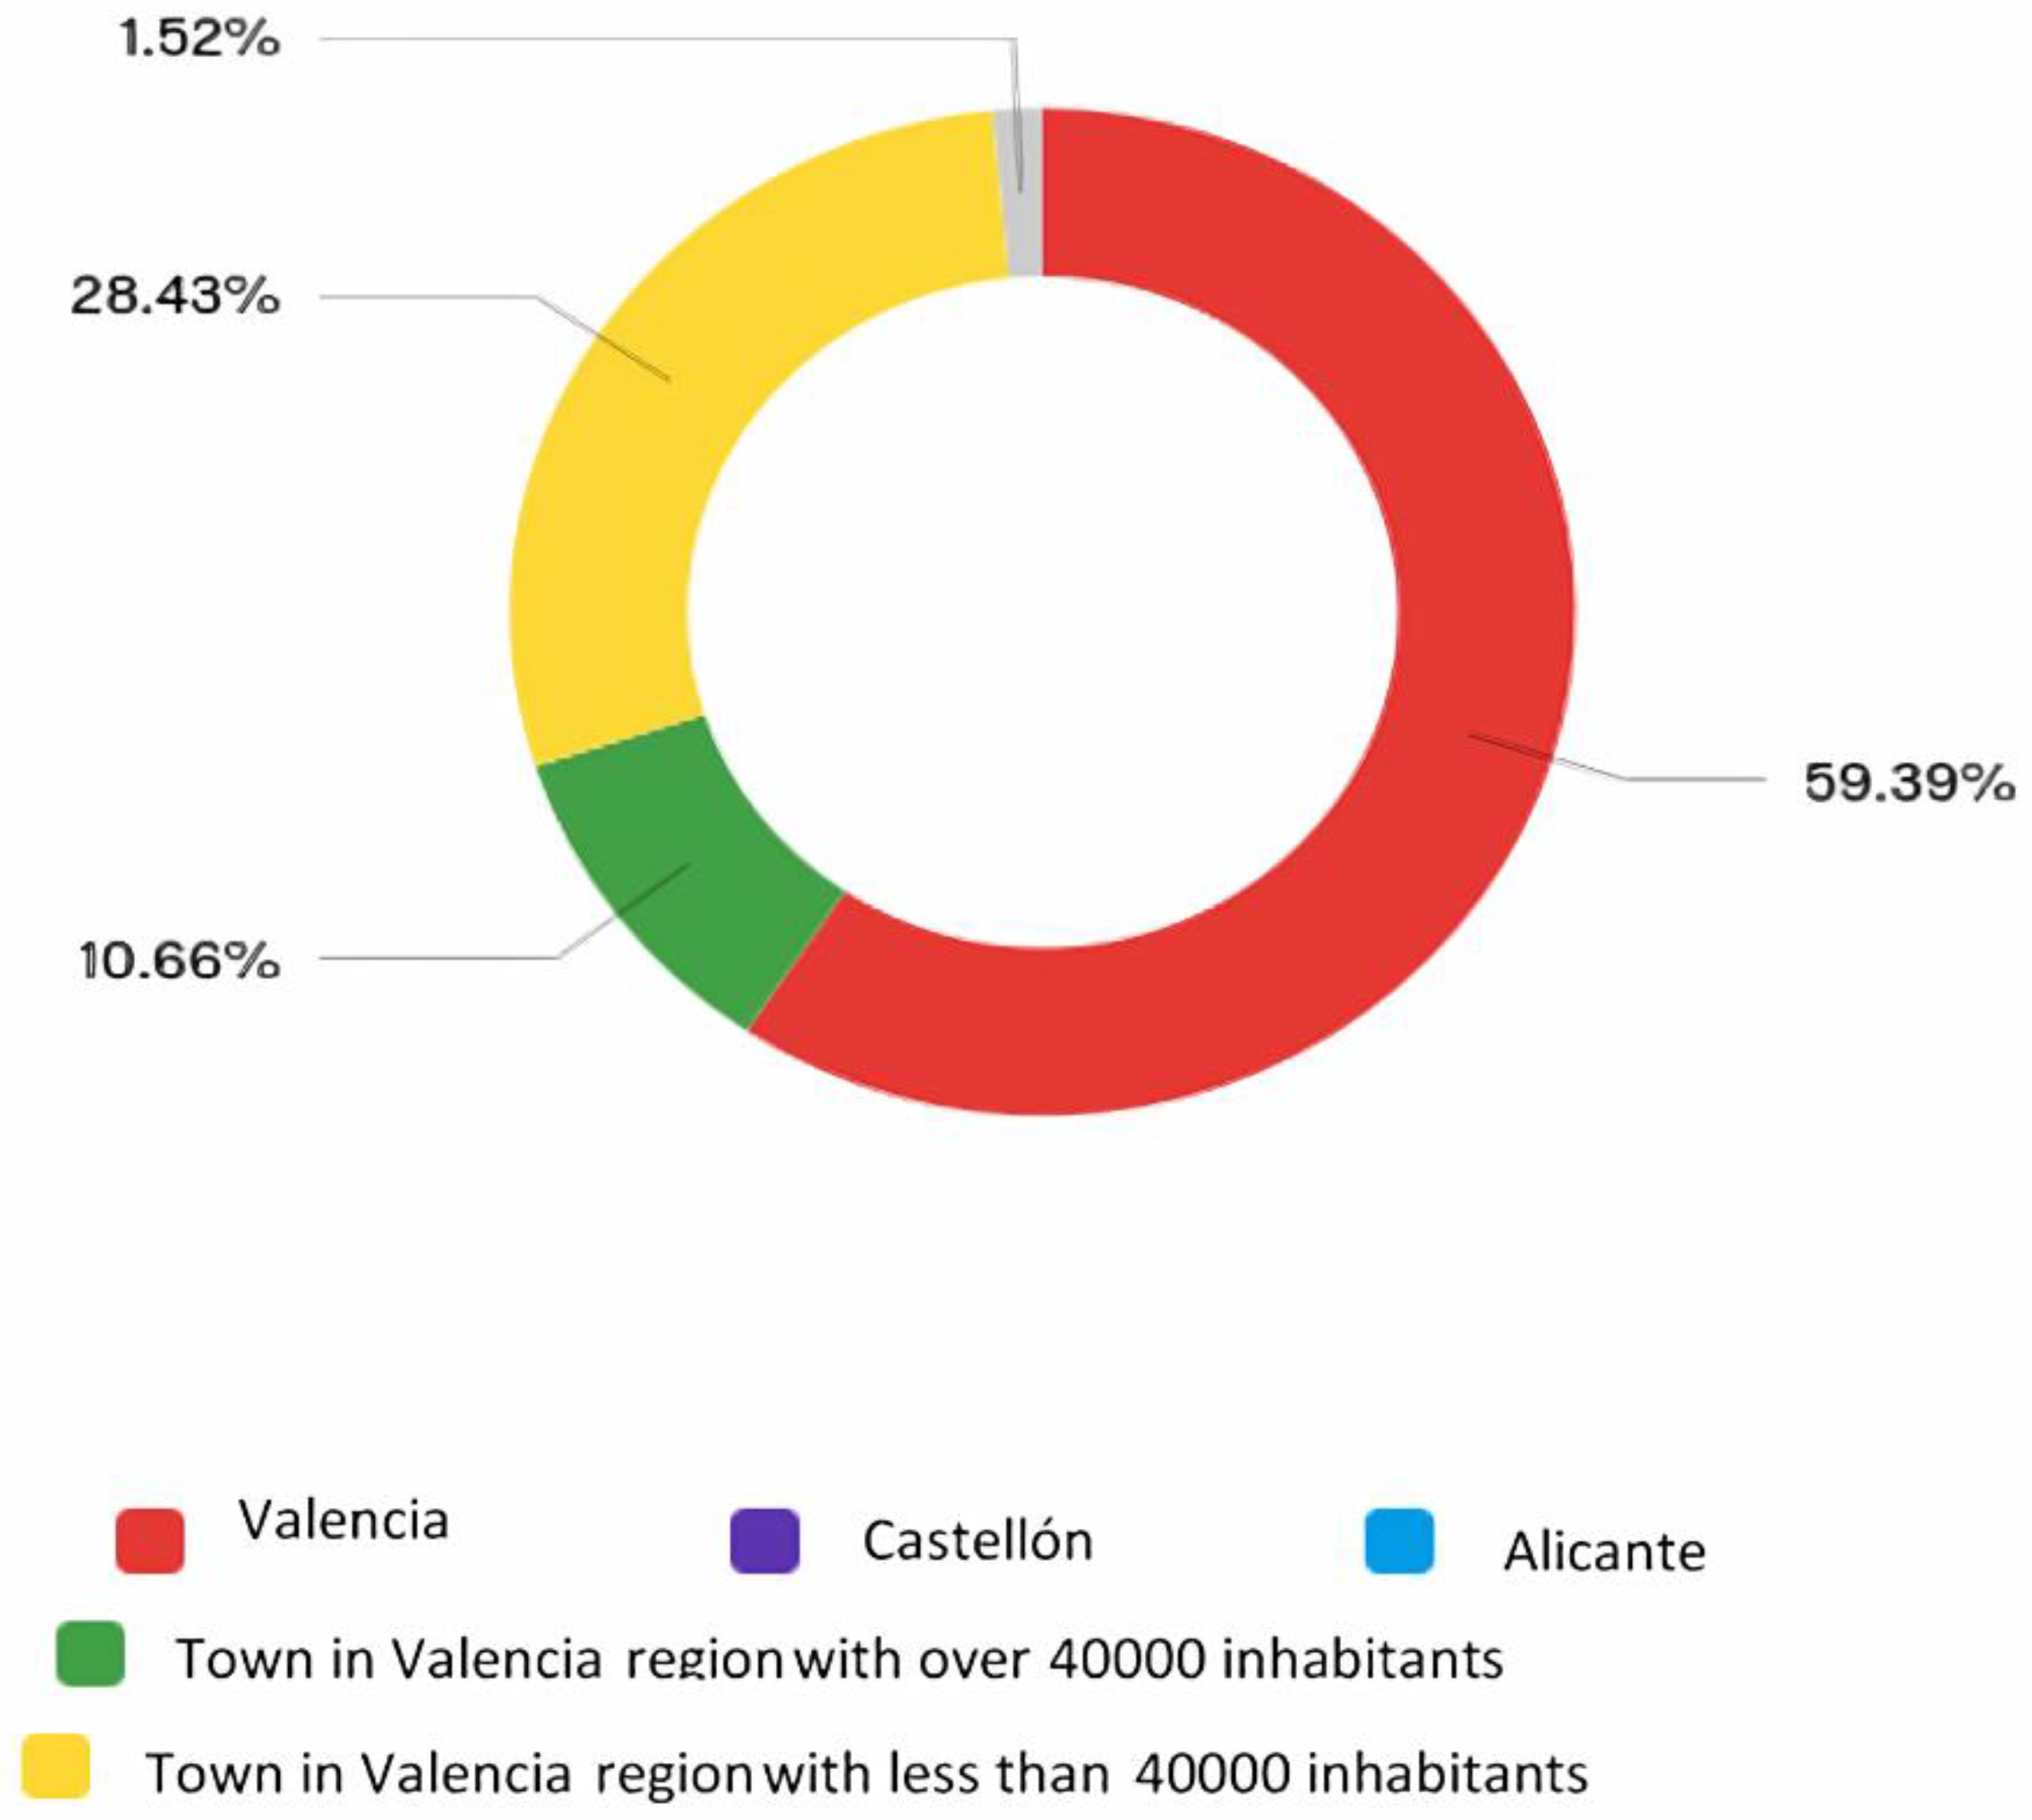
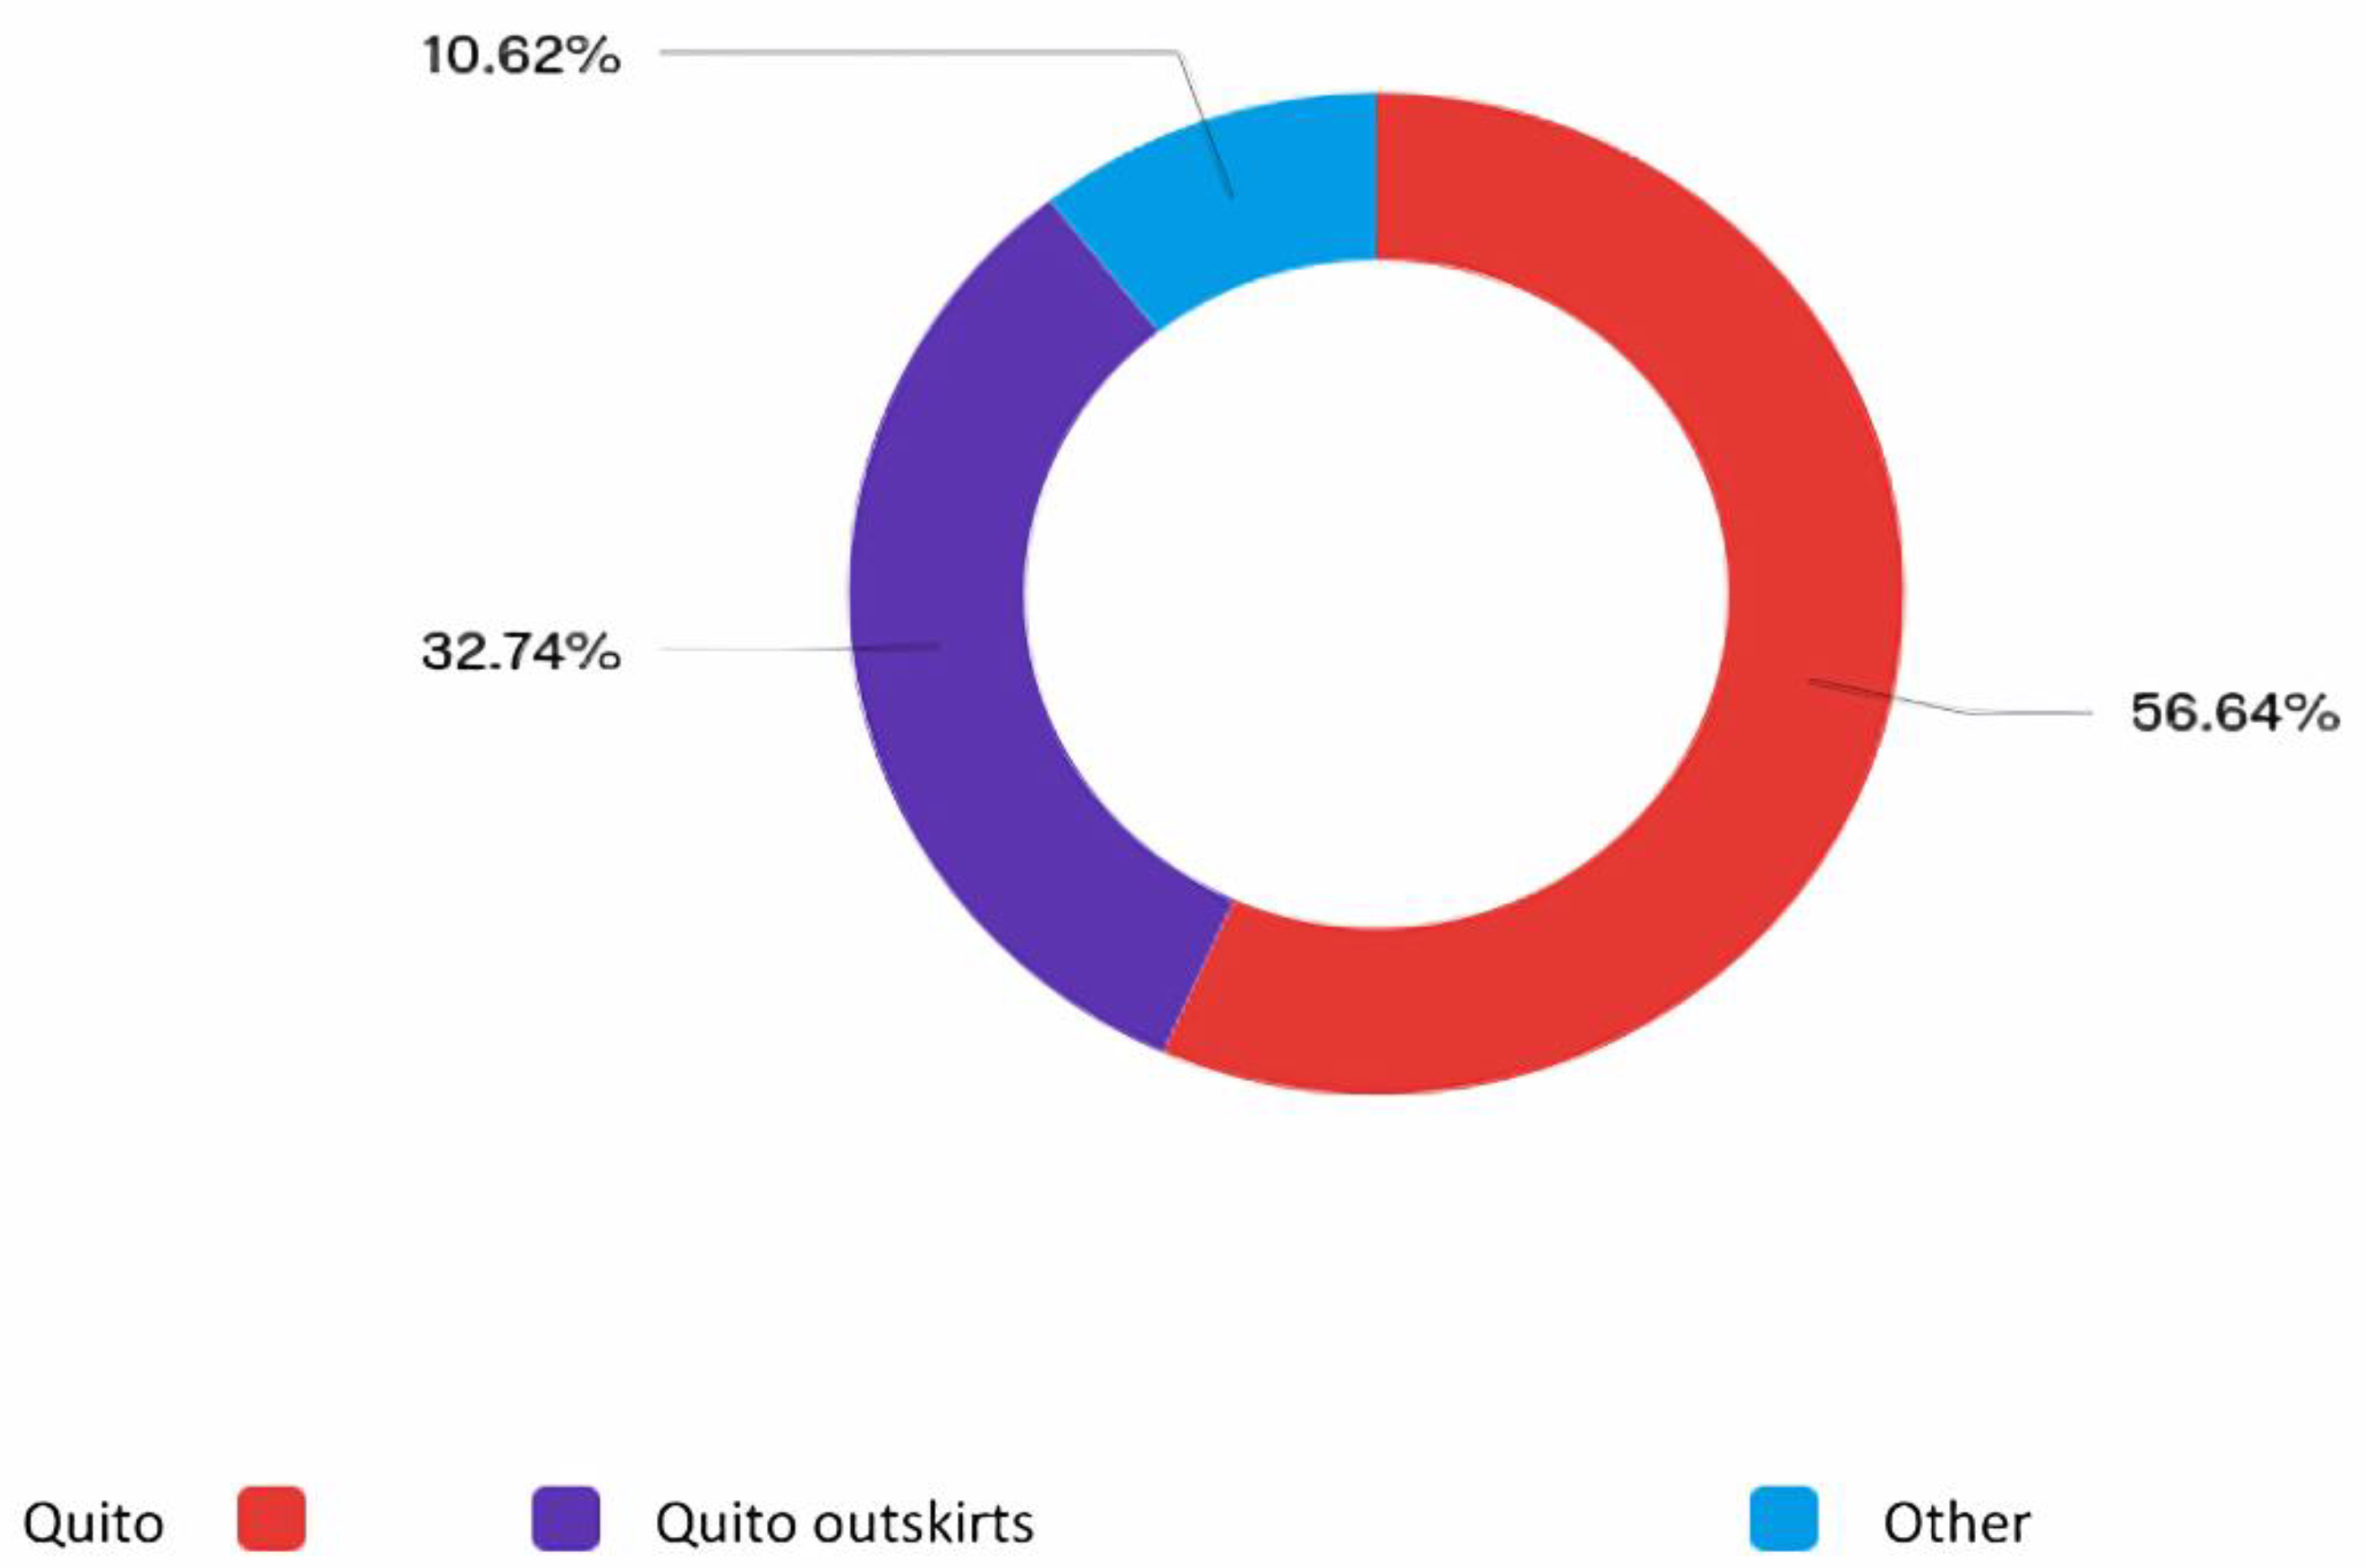
3.2. Geographical Location
From
Figure 1,
Figure 2 and
Figure 3, we can see that in the three communities, most of the respondents (more than 50%) lived in the city where the survey was conducted. This result was beneficial for our research as we changed the demographic variable “location” corresponding to the three locations.
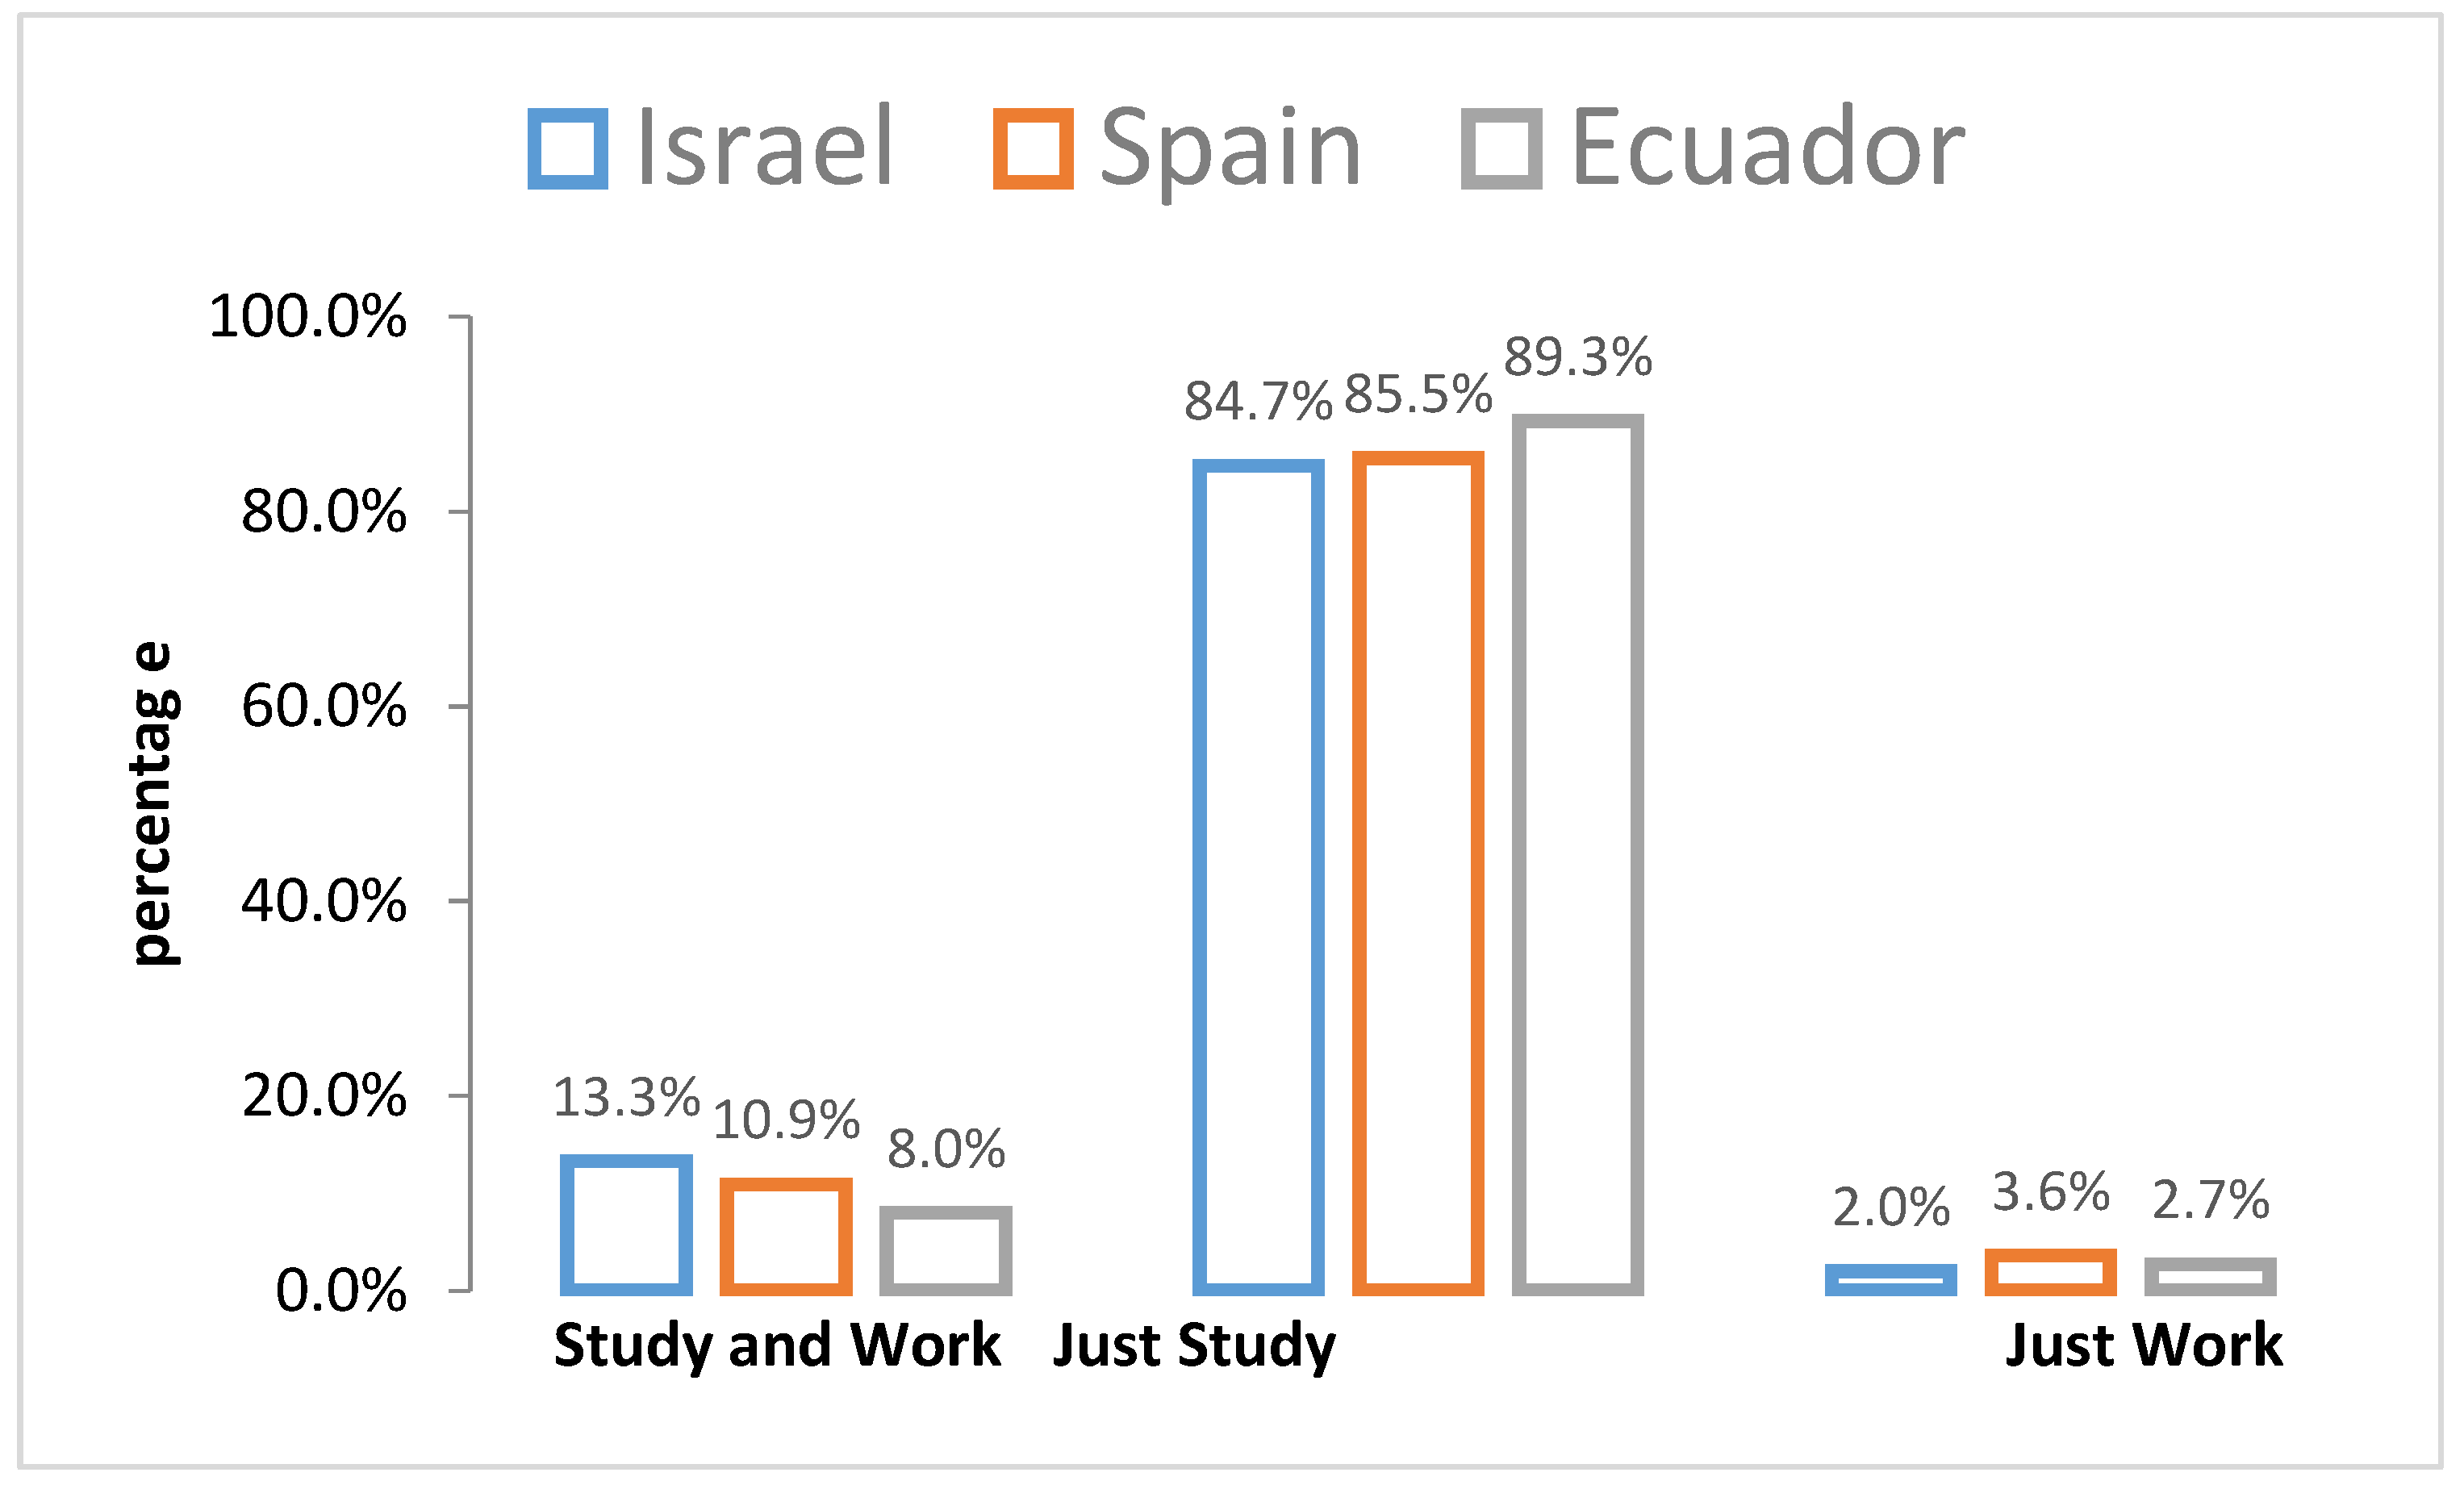
3.3. Study and Work
The occupation of the respondents were basically the same across all locations. From the whole sample, there was a total of 86.5% of students, and 10.73% of students who also worked, and the characteristics from each location are described in
Figure 4.
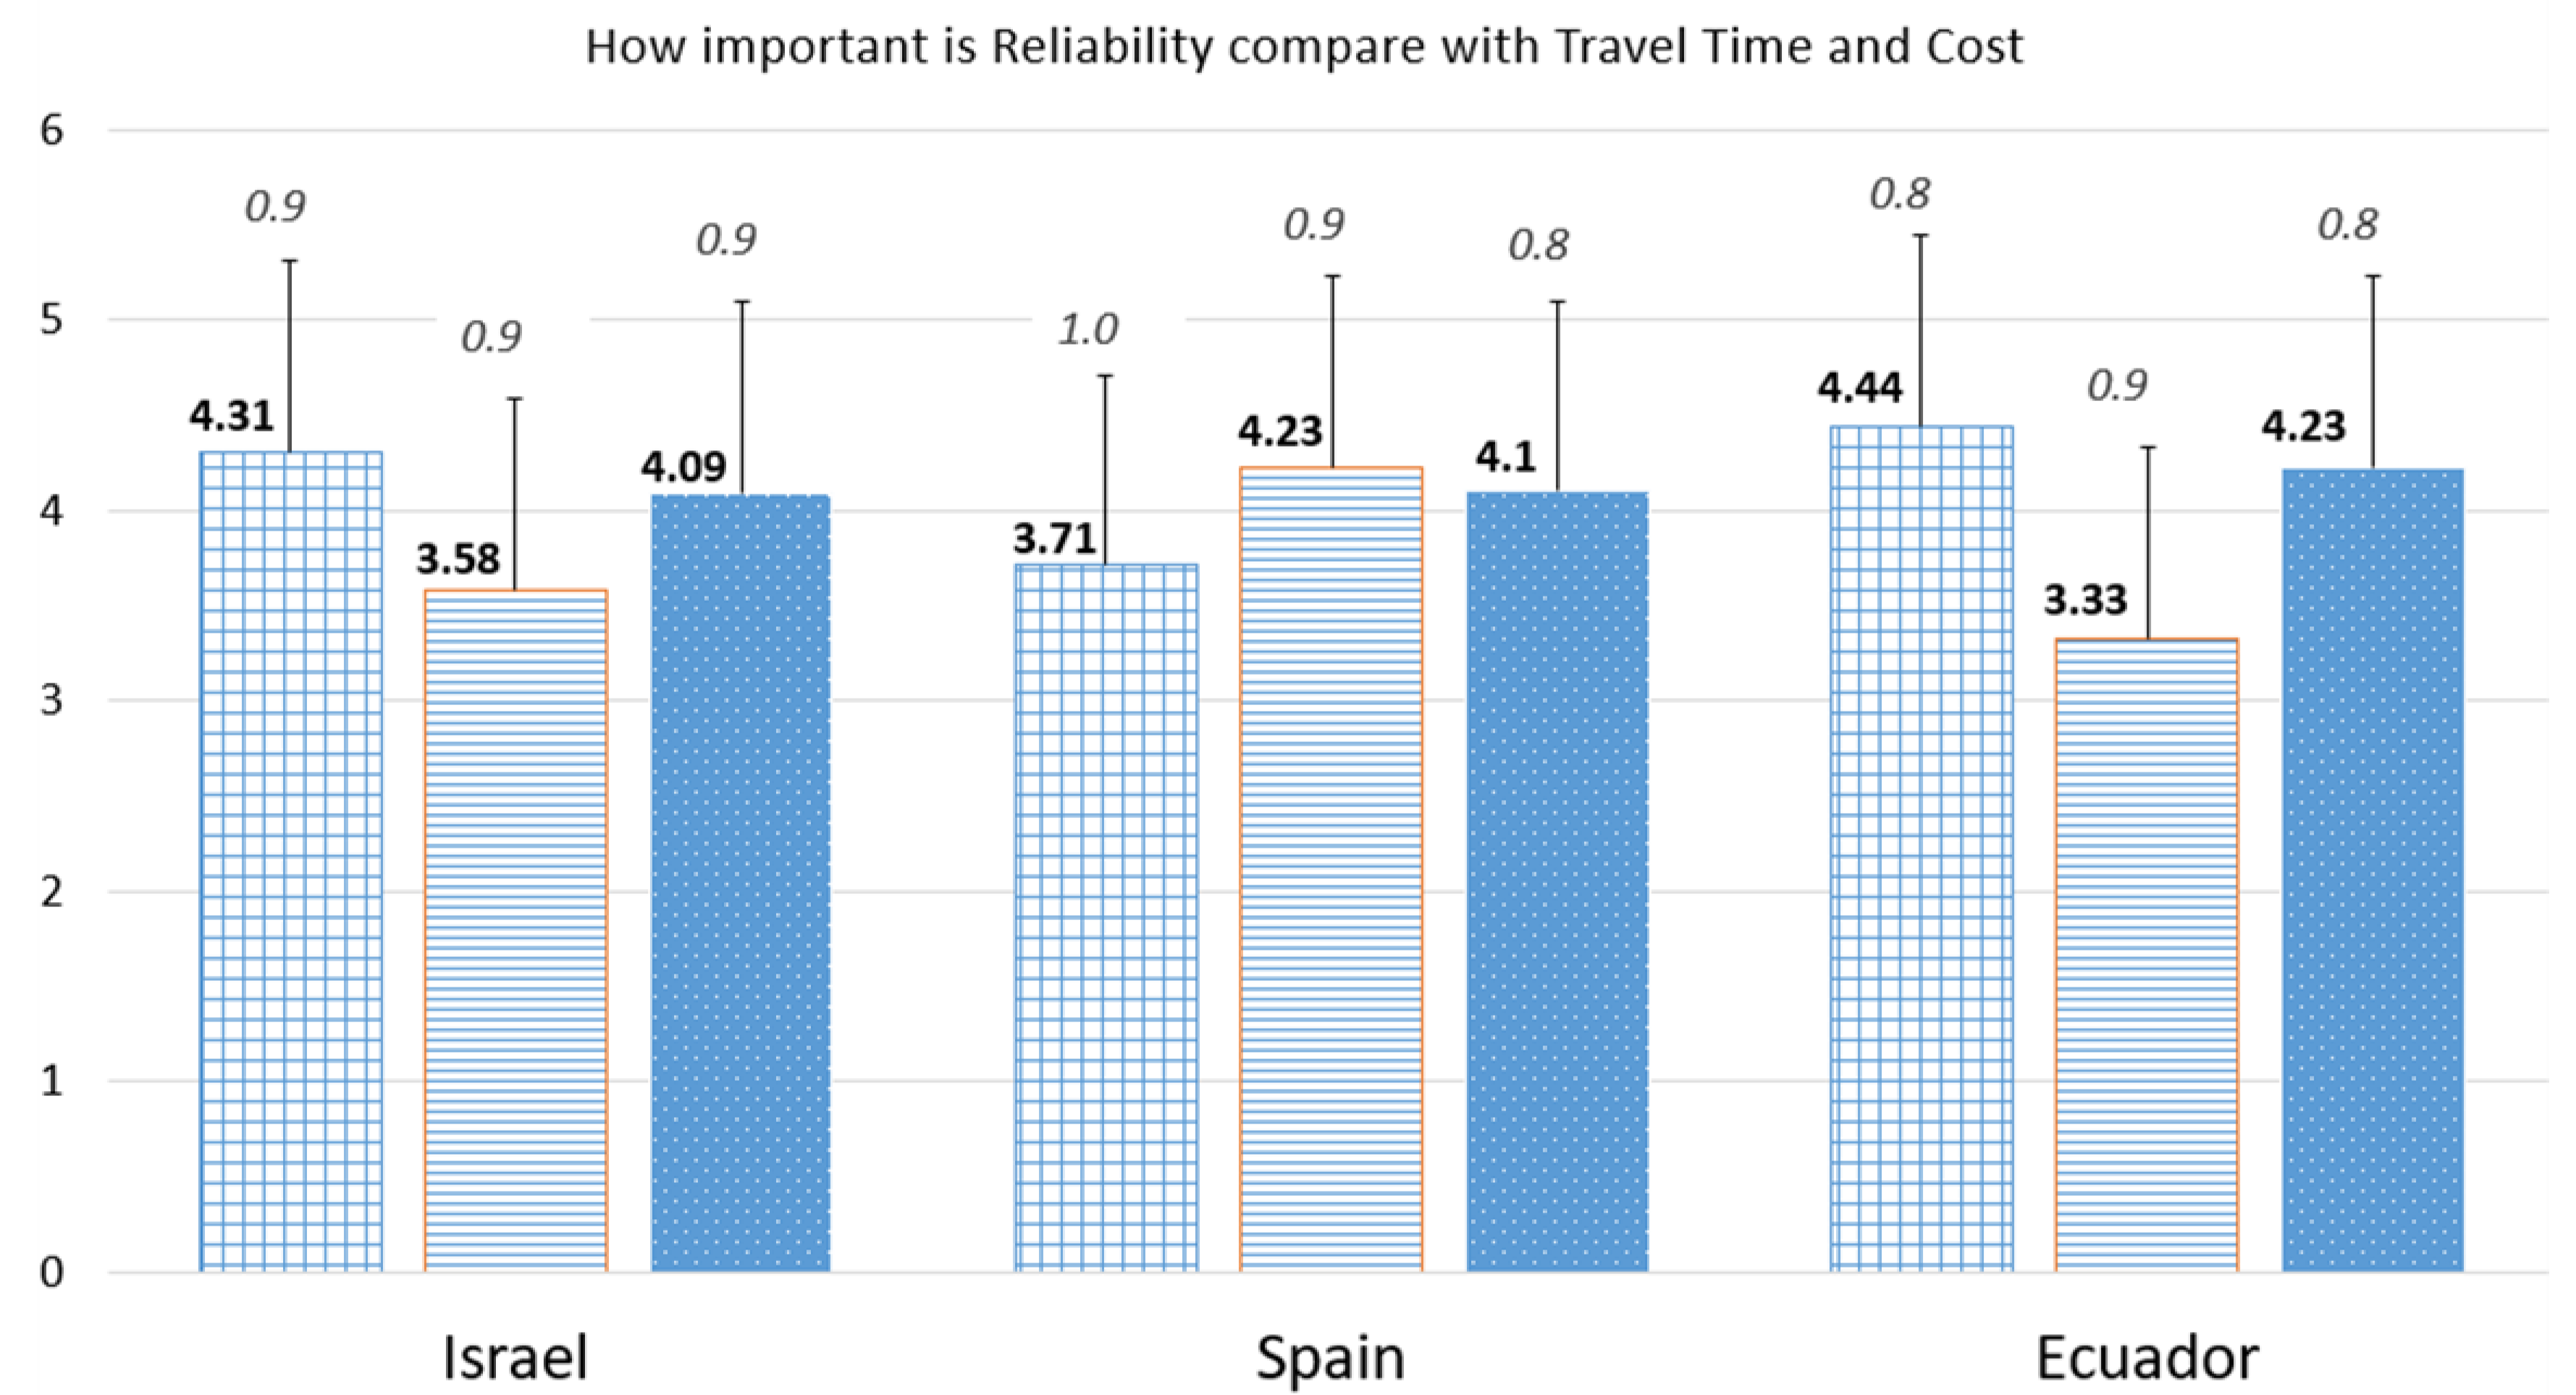
3.3.1. Perception toward Reliability and Travel Time
This section provides a clear understanding of how important Reliability is when compared with Travel Time and Cost. This question was divided into three parts and comprised in
Figure 5, we asked the level of importance for each of these attributes.
The main finding in this section showed how for all locations, a high and similar importance was given to Reliability when compared to Travel time and Cost. Other results showed that:
Ecuadorian and Israeli students cared less about the cost than Spanish students.
On the other hand, Spanish students’ valued cost as a more important aspect to consider when traveling.
3.3.2. Reliability According to SP Scenarios
The relative importance of reliability versus travel time and travel cost was studied by estimating binary logit models between two bus options using different levels of these three variables. Various combinations using efficient design on the alternative “Reliability” were tested in order to determine the discrete model that best fit the data.
The results of the model estimation are presented in
Table 3.
Standard
t-tests provide a significance level of rejecting the null hypothesis, the null hypotheses being that the coefficients estimated are statistically different from zero. The
p-values are placed in parenthesis next to each estimated coefficient in this thesis. In one of the models (Ecuador), we received the variable Reliability Early with a
p-value of 0.44, making it impossible to reject the null hypothesis. The results of the models are summarized in
Table 4, with the
t-test for the significance of each parameter presented in parentheses.
3.4. Relative Importance of Reliability
In order to evaluate the variable Reliability in different locations, we calculated the Value of Time (VOT) and Value of Reliability (VOR).
3.4.1. Value of Time
Value of time (VOT) measures are valuable in a wide range of public transport policy and planning applications. Besides the importance of VOT on transportation planning and infrastructure, it is necessary to point out that valuing time is not an easy task. Different variables should be taken into account to determine VOT, and might change from individual to individual, or at the time of the day, or with the activity to perform.
In our case, we can only determine the Value of Time for students that are going to study (activity). Time of the day is dependent on each traveler and their classes, without considering the individual perceptions and characteristics.
Once we obtained the results from the model on BIOGEME, we determined the VOT with the formula:
The units for VOT are
$/min, so we calculated *60, in order to have the value in units of
$/hour. From the results in
Table 4, we obtained the following results:
Ecuador: 102.73 USD/hour
Spain: 34.79 EURO/hour
Israel: 62.56 NIS/hour
Here, the values of reliability varied widely between each country and the value in Ecuador did not fit or make sense with the other monetary indicators.
Table 4 shows the GDP per capita in the locations of this study. These values are not to be compared with the Value of Time, but they can give us a general idea of an economic indicator.
3.4.2. Value of Reliability
The VOR connects the monetary values that travelers place on improving the predictability (i.e., reducing the variability) of their travel time.
Reliability is defined in modeling as the mean expected unscheduled delay. The probability of a late arrival is multiplied by the average delay on those journeys that are delayed. If more than one delay occurs and the probability of that happening occurs in the SP experiments, then the average of those is taken.
Ehreke et al. (
2015) explains that the VOR is the arithmetic population weighted mean of all calculated mean unexpected delay values. For example, a 5 min delay in 15% of trips and a 10 min delay in 5% of all trips leads to a delay of 1.25 min and this method can be used for scheduled transport modes (public transport and flights).
We considered reliability in different measures as reliability late (when the bus arrives late to the bus station where the trip starts) and reliability early (where the bus is early, meaning the user will miss the bus and have to wait for the next one).
The formula and the units resemble the VOT:
The results are presented in
Table 5The reason for not having a VOR early in Ecuador is that the coefficient xRearly had a p-value that did not allow us to reject the null hypothesis.
We can see that the results show a variability on the VOR early and VOR late in all locations.
3.5. Cross Cultural Comparison
The basic difference found in this research is the concept that each community has of “public transport”. In Ecuador, the bus schedule was not taken into account as the basic hope of the traveler is that the bus will arrive; usually they do not know when the bus is coming. Respondents can react on the reliability in different ways: they can adjust their departure time, their route, or change their mode of transport (
Ehreke et al. 2015). In Israel and Spain, travelers usually know the time of departure, so their perception of waiting time is different. We found that the socio-economic characteristics of the sample were different in the three countries. This point led us to consider that a different approach on the perception of reliability only belonged to certain segments of the population. The comparison between the terms of reliability and time were based on a theoretical approach in
Section 1 of the survey and in a practical way in
Section 3 through the use of SP design questions.
On
Table 6 all respondents considered Reliability as one of the most important characteristics when they made decisions regarding taking a bus. This data can be used to analyze the cases outlined in the real world scenarios presented.
An ANOVA test among the three groups indicated that significant differences existed. The level of significance was 5%.
4. Conclusions and Future Research
The objective of this study was to gain an understanding of the travel behavior of university students, particularly on the trips Home—University, using the Value of Time and Value of Reliability as indicators. The study focused on students from Spain, Israel, and Ecuador.
A multinomial logit model was used to model the responses from the questionnaires. The results showed that in all of the samples, the Value of Reliability (VOR) late was much higher than the Value of Reliability (VOR) early.
The different components in the transportation system networks made the service hard to estimate, like in Ecuador, where the frequency was higher and no scheduling was available for the urban traveler. Partial cultural differences were detected in this study, given the characteristics of each bus transportation system. Each transportation system was peculiar to its location and the approach from the students toward bus arrivals, which requires an in-depth study.
While Ecuador was the country with the higher VOT according to the responses to the survey and the model, the variability of answers on the SP approach may indicate the existence of a different concept of public transportation at each location. The overall finding in this study was that students from all countries considered that being on time was very important. In addition to the calibration of the logit model for the three countries, a direct t-test between pairs was carried out. In this comparison, we could not only check whether the countries were different from each other, but we could also detect which country was different.
This test was conducted to check the relative importance of reliability among the three countries. The statistical analysis used the method of the “t-test”. This analysis considered that if the expected values of grades in one country differed from the values in another country, then the probability of both expected values being the same was low. To detect such a difference between countries, we needed this probability (same expected values) to be lower than 5%. This probability is called the “p-value”.
Ecuador versus Spain:
Ecuador versus Israel:
Israel versus Spain:
According to the p-value, these countries were similar in the importance they gave to reliability.
This study leaves an open window for future research. The Value of Time and the Value of Reliability remain the main components in decision making. Due to the fact that the transportation systems in the three countries are not similar to each other, there is a need for a broader study. Our study strongly suggests detailed research on the importance that each location gives to travel time, and the values of reliability can be taken into account to produce accurate models by transportation specialists, and consequently by policy makers. New models including several influencing factors impacting the perceived reliability, for example, car ownership, socio-economic issues, or current travel time and frequency of use, could have a significant impact on perception. Future exploration on the differences and similarities of the transportation systems at various locations may give us a better understanding of cultural differences.
Author Contributions
The research was done under the supervision of H.A. and Y.S. at the Technion, and the collaboration of H.M.-i-B. at University of Valencia, Spain. Details: “conceptualization, M.L. and Y.S.; methodology, Y.S.; software, Y.S.; validation, H.A., H.M.-i-B. and Y.S.; formal analysis, Y.S.; investigation, M.L.; resources, M.L.; data curation, H.A., H.M.-i-B. and Y.S.; writing—original draft preparation, M.L.; writing—review and editing, H.A.; visualization, Y.S.; supervision, Y.S.; project administration, M.L.”
Funding
This research received no external funding.
Acknowledgments
The generous financial help of the Technion—Israel Institute of Technology is gratefully acknowledged.
Conflicts of Interest
The funders had no role in the design of the study; in the collection, analyses, or interpretation of data; in the writing of the manuscript, or in the decision to publish the results.
References
- Antoniou, Constantinos, Evangelos Matsoukis, and Penelope Roussi. 2007. A Methodology for the Estimation of Value-of-Time. Journal of Public Transportation 10: 1. [Google Scholar] [CrossRef]
- Beirão, Gabriela, and J. A. Sarsfield Cabral. 2007. Understanding attitudes towards public transport and private car: A qualitative study. Transport Policy 14: 478–89. [Google Scholar] [CrossRef]
- Carrasco, Nelson. 2011. Reliability Improvement Potential of High Quality Bus Transit Service in Zurich, Switzerland. Paper presented at Transportation Research Board 90th Annual Meeting, Washington, DC, USA, April 1–4; p. 18. [Google Scholar]
- Carrion, Carlos, and David Levinson. 2012. Value of travel time reliability: A review of current evidence. Transportation Research Part A: Policy and Practice 46: 720–41. [Google Scholar] [CrossRef]
- Chen, Xumei, Lei Yu, and Jifu Guo. 2009. Analyzing urban bus service reliability at the stop, route, and network levels. Transportations Research Part A 43: 722–34. [Google Scholar] [CrossRef]
- Diab, Ehab, Madhav Badami, and Ahmed El-Geneidy. 2015. Bus Transit Service Reliability and Improvement Strategies: Integrating the. Transport Reviews 35: 292–328. [Google Scholar] [CrossRef]
- Ehreke, Ilka, Stephane Hess, Claude Weis, and Kay W. Axhausen. 2015. Reliability in the German Value of Time Study. Zurich: ETH Research Collection. [Google Scholar]
- Hensher, David. 2007. Bus Transport: Economics, Policy and Planning. New York: Elsevier. [Google Scholar]
- König, Arnd, and Kay W. Axhausen. 2002. The Reliability of the Transportation System and its Influence on the Choice Behaviour. Paper presented at 2nd Swiss Transport Research Conference, Monte Verità, Ascona, March 20–22. [Google Scholar]
- Levine, Robert V., Laurie J. West, and Harry T. Reis. 1980. Perceptions of time and punctuality in the United States and Brazil. Journal of Personality and Social Psychology 38: 541. [Google Scholar] [CrossRef] [PubMed]
- Nocera, Silvio. 2010. An Operational approach for the evaluationof public transport services. Ingegneria Ferroviaria 65: 363–83. [Google Scholar]
- Shiftan, Yoram, Maren L. Outwater, and Yushuang Zhou. 2008. Transit market research using structural equation modeling and attitudinal market segmentation. Transport Policy 15: 186–95. [Google Scholar] [CrossRef]
- Stradling, Stephen, Michael Carreno, Tom Rye, and Allyson Noble. 2007. Passenger perceptions and the ideal urban bus journey experience. Transport Policy 14: 283–92. [Google Scholar] [CrossRef]
- Tyrinopoulos, Yannis, and Constantinos Antoniou. 2008. Public transit user satisfaction: Variability and policy implications. Transport Policy 15: 260–72. [Google Scholar] [CrossRef]
- van Oort, Niels. 2014. Incorporating service reliability in public transport design and performance requirements: International survey results and recommendations. Research in Transportation Economics 48: 92–100. [Google Scholar] [CrossRef]
- Xu, Feifei, Michael Morgan, and Ping Song. 2007. Students’ travel behaviour: A cross-cultural comparison of UK and China. International Journal of Tourism Research 11: 255–68. [Google Scholar] [CrossRef]
© 2019 by the authors. Licensee MDPI, Basel, Switzerland. This article is an open access article distributed under the terms and conditions of the Creative Commons Attribution (CC BY) license (http://creativecommons.org/licenses/by/4.0/).


