Abstract
Lightweight concrete incorporating expanded polystyrene (EPS) remains an active area of research due to its potential to produce more sustainable resource-efficient construction materials. However, identifying the optimal mix design for EPS-infused concrete typically requires extensive experimental trials, resulting in significant time, cost, and material consumption. To address this challenge, this study proposes an artificial neural network (ANN) predictive model with 5-fold cross-validation to estimate compressive strength performance and to develop mix design recommendations based on actual and predicted results. A total of 55 experimental samples were prepared and grouped into 11 batches, with the EPS volume replacement levels ranging from 0% to 50% at 5% increments. Model performance was evaluated using mean squared error (MSE), root mean squared error (RMSE), mean absolute error (MAE), mean absolute percentage error (MAPE), coefficient of determination (R2), and scatter index (SI), with graphical representations like predicted vs. actual plots, response plots, and residual plots, and the results were benchmarked against a multiple linear regression (MLR) model. Among the tested configurations, the 4-5-1 ANN model demonstrated the highest predictive accuracy. Furthermore, a Shapley (SHAP) analysis was conducted to interpret the model behavior and determine the relative importance of the input variables. The findings reveal that EPS content had the greatest influence on compressive strength prediction, followed by slump value, then gravel content, and finally concrete density.
1. Introduction
Concrete is one of the most widely used building materials in the world. Its demand spans many countries with rapidly developing infrastructure. For instance, the Philippine construction industry recorded a 9.2% annual growth rate in 2022 [1], highlighting the critical role of concrete in national development. However, its widespread use requires a tremendous amount of raw materials, raising environmental and resource concerns. Consequently, there is growing interest in exploring alternative materials to partially or fully replace traditional concrete components. In this context, this study examines the use of expanded polystyrene, a commonly used insulation material, as a component in concrete mixtures. The goal is to produce lightweight concrete and assess its compressive strength.
Concrete has become a vital necessity in modern construction as it is an essential component for ensuring structural stability. Its popularity stems from its ability to meet structural demands across various applications. However, the production of concrete has significant environmental consequences that are increasingly concerning in this era. According to Babor et al. [2], concrete manufacturing consumes approximately 1758 kWh per ton of output. From the collection of raw materials to transportation and manufacturing, all these phases require some form of energy. Typical concrete production requires several raw materials, like sand, gravel, water, stones, and manufactured Portland cement. However, obtaining these materials requires substantial additional resources. Mehta [3] noted in their research that the extraction of large quantities of raw materials and coal can lead to deforestation and even landslides if not properly managed.
With that, researchers are always searching for sustainable alternatives, such as expanded polystyrene. Sulong et al. [4] noted that expanded polystyrene lightweight concrete is an environmentally friendly alternative to traditional concrete. Using recycled plastic as aggregate helps to conserve natural resources by reducing the need for natural aggregates, promoting resource conservation, and contributing to energy savings [5]. EPS-infused concrete is also considered to be lighter, reducing the structural dead load and enabling more efficient structural design. The use of lightweight concrete enables smaller cross-sectional dimensions of structural elements [4]. In addition, the reduced weight of lightweight concrete structures helps to minimize the effects of seismic forces. Aside from the economic advantages of expanded polystyrene, recycling its waste products has also become an option. According to Assaad et al. [6], after experimenting with recycled expanded polystyrene-infused concrete, the test results indicated that substituting raw EPS beads with recycled ones at up to 2 kg/m3 does not significantly affect the density or mechanical properties of the lightweight concrete.
Expanded polystyrene beads are produced at very low densities, typically 12–50 kg/m3. In manufacturing, expanded polystyrene is known for its durability, compactness, and thermal insulation. It is considered to be non-toxic and chemically stable. Although expanded polystyrene beads are lightweight, they can still exhibit significant compressive strength, allowing them to withstand heavy loads while maintaining their shape. Because of that, it is ideal for load-bearing applications, such as underfloor insulation, and as components in lightweight concrete mixtures [7].
According to MATWEB [8], shown in Table 1, expanded polystyrene has a density of 0.00310–3.50 g/cc, indicating that it is lightweight. It has a low to moderate water absorption of 0.03–9.0%. Its size ranges from 100 to 3150 μm, and its water vapor transmission ranges from 50 to 200 g/m2/day, indicating that it has limited moisture intake.

Table 1.
Physical properties of expanded polystyrene [8].
Mechanically, shown in Table 2, expanded polystyrene (EPS) is relatively weak and flexible, with an ultimate tensile strength around 0.08–1.10 MPa, a creep strength of 0.06–0.30 MPa, and very low stiffness, as shown by a modulus of elasticity of about 0.0065–2.65 GPa and compressive and flexural moduli of roughly 0.005–0.040 GPa and 0.00628–0.0342 GPa, respectively. The material can undergo significant deformation, with elongations of 5–13.4% and flexural strains of 6.9–14.1%. Meanwhile, the compressive yield strength ranges from 0.039 to 10.9 MPa, the shear strength from 0.2 to 0.3 MPa, and the adhesive bond strength from 0.1 to 0.4 MPa.
Table 2.
Mechanical properties of expanded polystyrene [8].
On the electrical side, shown in Table 3, expanded polystyrene (EPS) behaves as a very good insulator, with surface resistance on the order of 1010–1012 ohms. Finally, in terms of its thermal properties, the EPS has a relatively high coefficient of thermal expansion, about 63–80 µm/m·°C, meaning it expands and contracts noticeably with temperature changes. The material can generally be used in air up to about 70–118 °C, with a Vicat softening point around 99–104 °C, a specific softening point of about 70 °C, and decomposition starting near 220 °C.
Table 3.
Thermal/electrical properties of expanded polystyrene [8].
Therefore, expanded polystyrene, which is usually a waste product, has been utilized by many researchers as an alternative sustainable lightweight concrete material. Expanded polystyrene (EPS) has various effects when mixed with concrete. Ousji et al. [9] reported that, as the EPS volume fraction increases, the density and compressive strength of the samples increase. Moreover, Maghfouri et al. [10] noted that EPS had a tendency to float and integrate poorly during mixing and pouring of the concrete mixture into the cylinder molders due to its lighter hydrophobic properties. Wang and Zhuang [11] noted that EPS segregation is due to the lower density of expanded polystyrene compared to other cement materials, leading to the use of binders, such as epoxy resins, to mitigate this issue. Zhao et al. [12] also noted that EPS is suitable for lightweight construction but is limited by the weak bond between EPS particles and the cement paste, which can lead to separation and crack formation, ultimately reducing the concrete’s strength. In a study by Silva et al. [13], the researchers conducted microscopic inspections wherein it was observed that an interfacial transition zone (ITZ) was found between EPS and the mortar, and, with the hydrophobic properties of EPS, there is a tendency to have a weakened and porous ITZ, resulting in decreased compressive strength of concrete. Meanwhile, Ubi et al. [14] reported that expanded polystyrene exhibits effective sound insulation and high thermal conductivity, making it a valuable component for concrete mixtures.
Research has shown that concrete containing polystyrene aggregates continues to gain strength even up to 90 days, which differs from the behavior typically reported for conventional concrete mixtures [15]. Researchers like Perry et al. [16] investigated concrete mixtures incorporating EPS beads at volume replacements of 40%, 50%, and 60%. The researchers adjusted the mix proportions of concrete into specific parameters to be able to control the compressive strength and density of the concrete. Their findings indicated a linear relationship between compressive strength and density. Meanwhile, Kan and Demirboga [17] replaced aggregates with EPS beads at varying volume levels of 0%, 25%, 50%, 75%, and 100%, resulting in concrete densities ranging from 980 kg/m3 to 2025 kg/m3. It was observed that EPS beads typically separate from the fresh concrete; however, the study demonstrated that minimal consolidation was sufficient to maintain uniformity in the mixture. The results revealed that the relationship between the concrete’s density and its compressive strength followed a logarithmic trend. Saradhi Babu et al. [18] utilized the mix proportions of 0%, 20%, 35%, and 50% volume of expanded polystyrene in total. Based on the results, at 28 and 90 days, the compressive strength of expanded polystyrene (EPS)-infused concrete increased by 27% and 39% for a density of 1050 kg/m3, 14% and 9% for 1430 kg/m3, and 11% and 5% for 1820 kg/m3 when smaller-size EPS was used instead of larger-sized EPS. It suggests that the strength gain from using smaller EPS aggregates was more observable in lower-density concrete. Topacio and Marcos [19] replaced coarse aggregates with pulverized EPS at 10%, 15%, and 20% by volume, with a plain mix serving as the control for comparison. Their test results showed that the 15% EPS mix achieved the best results, with a density of 1855 kg/m3 and a compressive strength of 14.03 MPa.
Lightweight concrete has been shown to offer an alternative to traditional concrete thanks to its lower density and improved performance. According to Ibrahim et al. [20], the research interest in lightweight concrete is growing due to its advantages, particularly its sound- and insulation-related properties, as well as its potential to reduce building weight, transportation, and installation costs. Further, Meena et al. [21] noted that lightweight concrete’s primary advantage is its applicability in seismic design. It can also be produced with various lightweight aggregates, such as clay, pumice, and expanded polystyrene, which are considered to be sustainable. As a result, lightweight concrete is commonly used in infrastructure for cladding panels, curtain walls, composite flooring systems, load-bearing blocks, road barriers, and insulated panels [21]. However, Vives et al. [22] cautioned that using lightweight concrete with a density below 1600 kg/m3 in structural elements like columns, beams, and frames is not ideal. Because of these limitations, several studies have focused on its use in horizontal structural components, such as beams and floor slabs.
When using lightweight concrete, the concrete should have a density below 2000 kg/m3 [23]. Values between 2000 and 2200 kg/m3 are considered to be semi-lightweight concrete, and values above 2200 kg/m3 are categorized as normal-weight concrete. The density and performance of lightweight concrete largely depend on the type of aggregate used and the mix proportions. According to Islam et al. [24], it was evident that different percentages of lightweight aggregate added to the mixture affected its 28-day compressive strength differently. At 10%, with up to a 50% increase in lightweight aggregate, the compressive strength is 38 MPa, 39 MPa, 48 MPa, 40 MPa, and 37 MPa, respectively.
The existing studies on the use of predictive models to estimate the mechanical properties of traditional concrete mixtures have primarily focused on conventional components, such as cement, sand, gravel, and water. Current research has not yet explored the development of predictive models tailored to the compressive strength of lightweight concrete mixtures incorporating expanded polystyrene (EPS). The inclusion of EPS introduces a new variable that influences the overall performance characteristics of the concrete, highlighting the need for a study to develop a predictive model tailored to EPS-infused lightweight concrete mixtures.
When determining the accurate compressive strength of lightweight concrete containing polystyrene at various mixing ratios, several factors must be considered. Le Roy et al. [25] highlighted that the risk of segregation is influenced by the density of the expanded polystyrene (EPS) aggregates. Their research revealed that the size of the EPS beads significantly influences compressive strength. Smaller beads were observed to improve density, thereby enhancing the overall performance of the infused concrete.
As researchers continue to explore other alternatives, many studies have examined the use of predictive models to estimate the mechanical properties of various cement mixtures. In the research of Prasad et al. [26], the researchers applied the LightGBM and ANN Fusion (LAF) model, two machine learning methods that can predict the compressive strength of mixed concrete. In another study by Fu et al. [27], the researchers used Multi-Expression Programming (MEP) and Gene Expression Programming (GEP), both predictive models, to develop a model for predicting chloride penetration and carbonation resistance in blended concrete. Meanwhile, Mosquera and Estores [28] used an artificial neural network (ANN) to examine the effect of corrosion on the pull-out capacity of expansion stud anchor bolts, evaluating how various factors contribute to changes in their performance. Naderpour et al. [29] utilized an ANN to estimate the compressive strength of recycled aggregate concrete. To build the ANN model, 139 data points from 14 published studies were collected and used for both training and testing. The ANN model was built using six input variables: water–cement ratio, water absorption, fine aggregate content, coarse aggregate content, recycled coarse aggregate content, and water-to-solid ratio. With a mean squared error of 0.004447, the results indicate that the ANN approach is highly effective in accurately predicting the compressive strength of recycled aggregate concrete. Table 4 presents the summary of these studies.
Table 4.
Summary of studies on expanded polystyrene replacement in concrete mixtures.
With this, the study focuses on developing an artificial neural network (ANN) predictive model to estimate the compressive strength of lightweight concrete incorporating expanded polystyrene (EPS) as a partial replacement for coarse aggregates. It includes the collection and analysis of experimental data for training and testing the model, which will be implemented in MATLAB R2025a. However, the scope of the study is limited to the prediction of compressive strength only and does not extend to other mechanical properties of EPS-infused lightweight concrete. The study also does not compare the compressive performance of EPS-infused concrete with that of other lightweight concrete mixtures. In addition, no further experimental investigations, such as microstructural analysis, were conducted to examine EPS behavior within the concrete matrix. In terms of modeling, the study is limited by the relatively small dataset of 55 samples obtained from the experiments. It also does not incorporate data from online databases or the previous literature since such data may involve different parameters and experimental conditions that are not fully consistent with the present study. Moreover, an uncertainty analysis was not yet explored, which could have provided additional support for the reliability and robustness of the ANN model predictions.
2. Materials and Methods
This study implements a quantitative experimental research design incorporated with a predictive modeling approach using an artificial neural network (ANN) with 5-fold cross-validation. It includes the preparation and testing of concrete specimens with varying levels of expanded polystyrene (EPS) as a partial volume replacement for coarse aggregates. The empirical data from these laboratory experiments will serve as the foundation for developing an ANN predictive model in MATLAB using 5-fold cross-validation to estimate the 28-day compressive strength of EPS-infused lightweight concrete based on multiple input parameters. As lightweight concrete should not be less than 17 MPa per ASTM C330 [30], the research used M20-grade concrete, with a 1:1.5:3 cement:sand:coarse aggregate ratio.
2.1. Phase 1: Compressive Strength Test Procedure
Figure 1 shows the materials used in the making of the expanded polystyrene (EPS)-infused lightweight concrete: water (local municipal water supply, Esperanza, Philippines), cement (3Kids Auto Supply & Hardware, Esperanza, Philippines), sand (3Kids Auto Supply & Hardware, Esperanza, Philippines), gravel (3Kids Auto Supply & Hardware, Esperanza, Philippines), and expanded polystyrene beads (Noble General Merchanise, Quezon City, Philippines). The water used in the specimens is tap water. The cement used is a Portland cement, specifically of the “Holcim” brand. The sand was sieved using a 1/8-inch hardware cloth. The gravel used was washed and dried to remove soil and other unwanted particles that might be mixed into the concrete. Lastly, the expanded polystyrene used had a size between 3 and 5 mm.
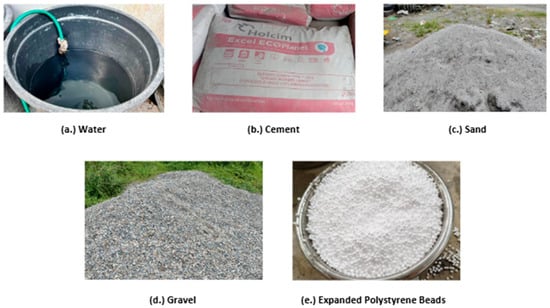
Figure 1.
Materials used in the experimental procedure of the EPS-infused concrete.
Figure 2 shows the equipment used in the experiment, including a trowel (Castillanes Construction and Supply, Esperanza, Philippines), steel rod (Castillanes Construction and Supply, Esperanza, Philippines), shovel (Castillanes Construction and Supply, Esperanza, Philippines), slump cone (Castillanes Construction and Supply, Esperanza, Philippines), steel tape measure (Castillanes Construction and Supply, Esperanza, Philippines), PVC cylinder cone (Castillanes Construction and Supply, Esperanza, Philippines), hardware cloth (Castillanes Construction and Supply, Esperanza, Philippines), and weighing scale (Castillanes Construction and Supply, Esperanza, Philippines). The trowel, steel rod, weighing scale, and shovel were used to prepare and mix the concrete. The slump cone and steel tape measure were used to measure the slump test of each batch mix. The PVC cylinder cone is where concrete is molded into cylinder specimens. The hardware cloth was used to sieve the sand, removing stones and other particles.

Figure 2.
Equipment used in the experimental procedure of the EPS-infused concrete.
The data were collected through physical laboratory experiments, specifically compressive strength tests conducted on a Universal Testing Machine (UTM). Standardized procedures for batching, mixing, and curing were followed in accordance with ASTM Mix Design Evaluation [31], ASTM C33 [32], ASTM C330 [30], and ASTM C143 [33] guidelines to ensure accuracy. The compression test was conducted in accordance with ASTM C39 [34]. To isolate the influence of expanded polystyrene (EPS) replacement on compressive performance, the cement, water, and sand contents were held constant across all mixtures. The independent variables were gravel content, EPS content, slump value, and density. The compressive strength was designated as the dependent variable. Figure 3 summarizes the overall workflow of specimen production, curing, and testing. Each stage is described in detail as follows.
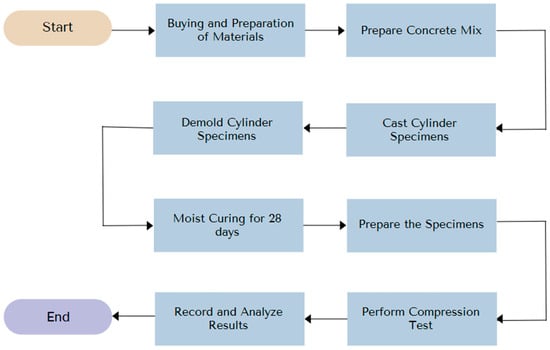
Figure 3.
Compressive strength test procedure.
In step 1, all materials (cement, water, sand, gravel, and expanded polystyrene) and equipment (trowel, steel rod, shovel, slump cone, steel tape measure, PVC cylinder cones, hardware cloth, and weighing scale) were procured and prepared prior to mixing. Each component was measured according to the predetermined mix design proportions to ensure consistency across the mix batches. In preparation for casting, cylindrical molds were assembled. The molds were designed to produce specimens measuring 4 in × 8 in (100 mm × 200 mm) and fabricated from PVC Pipe No. 4. The molds were cleaned and prepared to prevent contamination and facilitate demolding.
In step 2, concrete mixing was carried out following standardized laboratory practices consistent with ASTM guidelines (ASTM C330 [30], ASTM C192 [31], ASTM C33 [32], and ASTM C143 [33]). It was mixed until the concrete mixture showed uniformity. Immediately after mixing, the slump test was performed in accordance with ASTM C143 to quantify the workability and consistency of the fresh concrete. The measured slump values were recorded and later used as input variables for modeling and predicting concrete performance.
In step 3, the prepared concrete was cast into the cylindrical molds using a two-layer placement procedure in accordance with ASTM guidelines. The first one was half the height of the cylinder, and the second one extended to the top of the cylinder. On both occasions, the cylinder mold was compacted and vibrated with a steel rod to minimize hollow spaces and improve uniformity within the specimens. After consolidation, the top surface was leveled and finished, and excess concrete was removed to avoid surface irregularities and potential misalignment during testing. Each specimen was kept undisturbed to allow initial setting.
In step 4, the cast specimens were left in the molds and placed in a dry and secure area for 48 h prior to demolding. After that period, the specimens were carefully removed from their molds. Excess debris and materials observed around the specimens were cleaned. Moreover, the specimens were visually inspected for defects, such as honeycombing, surface voids, and cracks that may affect their compressive strength. After that, each specimen was thoroughly labeled to ensure they are organized and do not get mixed together as these specimens have different mixing designs.
In step 5, after demolding, labeling, and 48 h of drying, the specimens were subjected to moist curing by water immersion in accordance with ASTM C192 [31]. The specimens were placed in a water bath and fully submerged for 28 days. The container was a plastic barrel cut to serve as a water bath, and the water used was clean tap water. This water batch was placed in a closed room at approximately 23–25 °C and covered to prevent contamination. The specimens were placed with spaces between one another to ensure equal hydration in all areas of each specimen. These specimens remained untouched until the due date.
In step 6, the researcher pulled out the concrete specimens from the water bath after 28 days. It was observed that some of the expanded polystyrene that had floated to the top of the concrete cylinders before they dried was still floating around the top of the water bath. To continue, these concrete cylinders were set to dry for about 24 h in preparation for the compressive test the next day. Here, the containers for these cylinders were also prepared to ensure they would not develop cracks or other damage during transportation. Moreover, the labels of each specimen were checked and organized properly to ensure that the specimens would not be mixed.
In step 7, compressive strength testing was conducted at a certified testing center using a Universal Testing Machine (UTM) (E.B. Testing Center, Inc., Koronadal City, Philippines) in accordance with ASTM C39 [34]. Before testing, each specimen was measured for height, length, and diameter. Each specimen was then positioned centrally between the loading platens to ensure proper alignment. The load was applied gradually and continuously until failure occurred, characterized by visible cracking and loss of load-bearing capacity. The UTM recorded the maximum applied load at failure, which was used to compute compressive strength. In step 8, all test results obtained from the Universal Testing Machine (UTM) were recorded and encoded into a spreadsheet for organization and post-processing.
Overall, phase 1 of the methodology was designed to ensure consistent specimen fabrication and controlled testing conditions, thereby enabling reliable assessment of compressive strength trends across varying volume replacement levels of expanded polystyrene in the coarse aggregates.
2.2. Phase 2: ANN Predictive Model Procedure
Figure 4 illustrates the systematic procedure followed for the development, training, validation, and testing of the artificial neural network (ANN) predictive model using a 5-fold cross-validation scheme for compressive strength estimation.
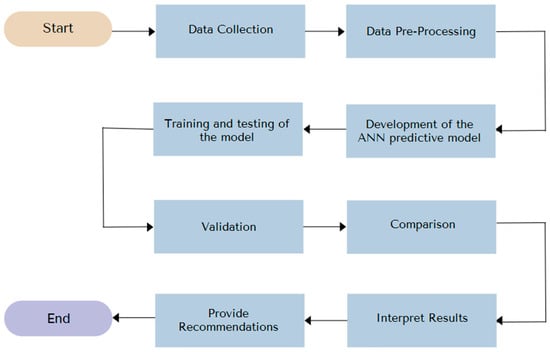
Figure 4.
ANN predictive model procedure.
In step 1, the dataset used for model development was obtained from the laboratory compressive-strength testing procedure described in Figure 3. Each specimen produced a corresponding compressive strength value after 28 days of curing. As mentioned in phase 1, the first four parameters (expanded polystyrene, gravel, slump value, and density) were treated as independent variables, and the compressive strength was treated as the dependent variable.
In step 2, prior to the model development, the dataset underwent pre-processing to ensure compatibility with machine learning. All laboratory data were encoded and organized in spreadsheets into a tabular format, with each row representing a specimen and each column representing the variables. The input variables (EPS, gravel, slump value, and density) were normalized to ensure that all parameters were within comparable numerical ranges. Since normalization prevents bias during training, it is particularly useful when the variables have different units of measurement.
In Step 3, the artificial neural network (ANN) model with 5-fold cross-validation was developed in MATLAB R2025a using the Regression Learner App. In MATLAB, the input parameters and the output parameters were identified. The input parameters were the EPS content, gravel content, slump test values, and the density of the specimens. The output variable is the compressive strength.
In Step 4, called Training and Testing of the model, the model was configured with 5-fold cross-validation to reduce the risk of overfitting, with 80% of the data used for training and 20% for testing. The model randomly selected 44 training and 11 test data samples. Data samples (1, 4–7, 9–14, 16, 19–25, 27–29, 32–49, 51–52, and 54–55) were separated for the training dataset and data samples (2–3, 8, 15, 17–18, 26, 30–31, 50, and 53) were separated for the testing dataset of the models. Given the limited number of specimens, cross-validation was considered more robust than a single training–validation–testing split.
In step 5, called Validation, the model is validated using statistical methods like mean squared error (MSE), root mean squared error (RMSE), mean absolute error (MAE), mean absolute percentage error (MAPE), coefficient of determination (R2), and scatter index (SI), which will be discussed in the data analysis methods. The use of multiple evaluation metrics ensures a comprehensive assessment of each model’s reliability. Moreover, plots such as predicted vs. actual, response, and residual were presented to further support the analysis of which model performed best.
In step 6, called Comparison, the artificial neural network (ANN) model was benchmarked against a traditional statistical method, such as multiple linear regression (MLR). This comparative analysis determines whether nonlinear modeling with an ANN yields significant results compared to linear modeling for predicting the compressive strength of expanded polystyrene (EPS)-infused concrete. Two ANOVA calculations were also performed, one to determine whether the percent variation in expanded polystyrene is significant and another to compare the optimum replacement with the control specimen (0% replacement).
In step 7, called Interpret Results, the researcher analyzed the results produced by the statistical methods and assessed the model’s reliability. In step 8, called Recommendations, the researcher provided recommendations to improve the model and the research as a whole, as well as a recommended mix design based on the results of the compressive strength test and the predictions.
2.3. Data Analysis Methods
This study incorporates both statistical analysis and machine learning model evaluation to ensure the developed predictive model is accurate and robust. Initially, raw experimental data will be cleaned, randomized, and normalized in Excel Version 2602 prior to model training. Statistical visualizations, including line graphs, box plots, and summary tables, will clarify and present the experimental dataset. Model performance will be quantified using various statistical metrics that assess prediction accuracy and error margins.
In the normalization part of the idea, this equation will be used:
The normalization formula scales a dataset to specific values between −1 and 1, allowing the data to be compared more easily.
In the analysis of the model, the first equation that will be utilized is the mean squared error formula:
The mean squared error (MSE) formula emphasizes larger model prediction errors. A value of 0 indicates that the model has perfect predictive performance. A small positive number indicates that the model’s predictions are close to the actual values and that the model is considered good. Meanwhile, a large number indicates that the model’s predictions are far from the actual values and is considered a bad model.
Meanwhile, the root mean squared error (RMSE) formula measures the average magnitude of the model’s prediction errors. It makes the results more interpretable compared to the MSE. As with the MSE, a value of 0 indicates perfect prediction; a smaller RMSE indicates that the predictions are close to the real data; and a larger RMSE indicates that the predictions are inaccurate relative to the real data.
On the other hand, the mean absolute error (MAE) formula is similar to the RMSE formula in that the values should always be non-negative. The lower the MAE, the better the model’s performance.
The mean absolute percentage error (MAPE) formula measures the model’s prediction error and should never yield a negative value. The lower the MAPE, the better.
The coefficient of determination formula measures how well the model’s predictions match the actual data in the dataset. A higher R2 value indicates that the predictive model’s values closely match the actual values in the dataset. The values are usually between 0 and 1.
Lastly, the scatter index (SI) formula measures the prediction errors relative to the mean value of the actual data used. SI values less than 0.1 indicate an excellent prediction, 0.1–0.2 means a good prediction, 0.2–0.3 indicates a fair prediction, and anything beyond 0.3 shows a poor model prediction.
3. Results
3.1. Experimental Data Presentation
Table 5 shows the density of each material used in the experiment. The cement used had a density of 1440 kg/m3, specifically the brand ‘Holcim’. The sand had a density of 1600 kg/m3. The sand was sieved through a ⅛-inch hardware cloth to ensure that it was not mixed with rocks or other debris. Meanwhile, the gravel used had a density of 1520 kg/m3. The gravel was washed and dried before using to ensure that soil particles would not be mixed within the cement mixture. Lastly, the expanded polystyrene had a density of 19.8 kg/m3 and had sizes between 3 and 5 mm. The cement–sand–gravel ratio used in the experiment was 1:1.5:3, corresponding to the M20 grade, as discussed in the introduction to the Materials and Methods Section. The cement had a volume of 0.0046127 m3, sand had a volume of 0.00069191 m3, and gravel had a starting volume of 0.0138382 m3, which decreased as the EPS percent volume replacement increased, and the expanded polystyrene had a volume dependent on the percent volume replacement of the gravel.
Table 5.
Material’s general information.
Table 6 presents the experimental mix design parameters of the samples. The 55 samples were divided into 11 batch mixes. The cement, water, and sand values were constant across all the samples, with a water-to-cement ratio of 0.55, while the gravel was replaced by volume from 0% to 50% with 5% intervals. At the same time, the slump values were also taken per batch mix. It can be observed that a small percentage of volume replacement in gravel or coarse aggregates resulted in a large amount of expanded polystyrene due to its lower density.
Table 6.
Experimental mix design parameters.
Figure 5 shows the line graph of the specimens’ density. Each batch mix had five samples, where the average density was used. According to Vives et al. [22], lightweight concrete is defined as having a density of less than 2000 kg/m3. Values within 2000–2200 kg/m3 are considered semi-lightweight concrete, while values more than 2200 kg/m3 are considered normal-weight concrete. In this study, samples 1.1–1.5 had an average density of 2201.51 kg/m3. Since this is a sample specimen with 0% replacement, it is considered a normal-weight concrete. As the EPS replacement increases from 5% in sample 2.1 to 5% in sample 2.5, the average density of these samples is 2211.81 kg/m3. These specimens are still considered normal-weight concrete as they remain above 2200 kg/m3. In the next specimens, 3.1–3.5, which have the 10% EPS replacement, the average density is 2146.28 kg/m3, indicating that these samples are transitioning to lightweight concrete and are currently considered semi-lightweight concrete. In specimens 4.1–4.5, which have a 15% EPS replacement, the average density is 2161.70 kg/m3, indicating that these samples remain in the semi-lightweight category. In specimens 5.1–5.5, which have a 20% EPS replacement, the average density is 2118.77 kg/m3, which decreased compared to the previous samples but is still considered a semi-lightweight concrete. In specimens 6.1–6.5, with 25% EPS replacement, the average density is 2067.81 kg/m3, showing a slight decrease but still within the semi-lightweight range. In specimens 7.1–7.5, which have the 30% EPS-replacement specimens, the average density is 2077.26 kg/m3. This value had a slight increase in density; however, it is still considered a semi-lightweight concrete. In specimens 8.1–8.5, which have the 35% EPS replacement, the average density is 1949.27 kg/m3. This value indicates that these specimens are now considered lightweight concrete. In specimens 9.1–9.5, with 40% replacement, the average density is 1870.19 kg/m3, which is a significant decrease compared to the previous samples and is still considered lightweight concrete. In specimens 10.1–10.5, which have the 45% EPS replacement, the average density is 1862.38 kg/m3, showing a small decrease and remaining lightweight concrete. In the final specimens, 11.1–11.5, which have the 50% EPS replacement, the average density is 1860.05 kg/m3, which is still considered lightweight concrete.
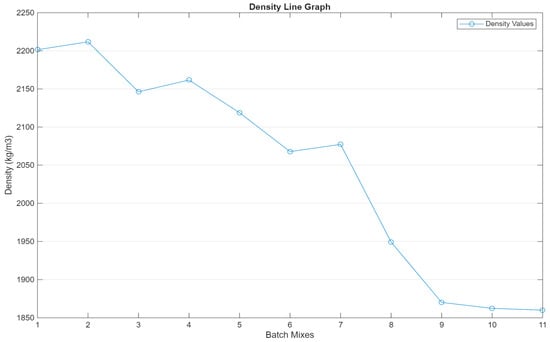
Figure 5.
Line graph of the average density of the specimens in each batch mix.
Figure 6 shows the compressive strength of expanded polystyrene (EPS)-infused concrete at different intervals of gravel being replaced by EPS. The orange line within each box represents the median compressive strength, while the plus sign indicates an outlier in the dataset. In sample 1, the 0% EPS volume replacement was recorded with a compressive strength of 23.10 MPa, sample 2 was recorded with 22.10 MPa, sample 3 with 23.50 MPa, sample 4 with 20.40 MPa, and sample 5 with 21.40 MPa. In this specimen, the required strength of the M20 mixing ratio was achieved, exceeding 20 MPa. At a 5% EPS volume replacement, the compressive strengths were 16.60 MPa, 17.90 MPa, 16.00 MPa, 16.70 MPa, and 18.70 MPa, respectively. In this replacement, the required strength was not met and was observed to be lower than that of the control specimen. At a 10% EPS volume replacement, the compressive strength was 12.70 MPa, 14.70 MPa, 13.80 MPa, 12.20 MPa, and 14.00 MPa, respectively. In this specimen, the required strength was not met, and it had lower values compared to the 5% replacement values. At a 15% EPS volume replacement, the recorded compressive strengths were 22.20 MPa, 21.00 MPa, 18.90 MPa, 19.60 MPa, and 21.40 MPa, respectively. In this specimen, the required strength was met by three samples, with the rest not meeting it. At the same time, the compressive strength value was observed to have increased compared to the previous samples in 5–10% replacement. At a 20% EPS volume replacement, the measured compressive strength was 14.90 MPa, 14.70 MPa, 15.10 MPa, 13.50 MPa, and 15.00 MPa, respectively. In this specimen, none of the samples met the required strength, and it was observed to have decreased compared to the previous specimen. At a 25% EPS volume replacement, the compressive strengths were 11.30 MPa, 12.30 MPa, 10.30 MPa, 12.60 MPa, and 10.60 MPa, respectively. In this specimen, none of the samples met the required strength, and the decrease was greater than in the previous specimen. At a 30% EPS volume replacement, the compressive strength of dataset 7 was 9.70 MPa, 10.30 MPa, 10.10 MPa, 9.00 MPa, and 8.90 MPa, respectively. In this specimen, the required strength was not met, and it is observable that it decreased compared to the 25% replacement values. At a 35% EPS volume replacement, the compressive strength of the concrete was 6.00 MPa, 7.20 MPa, 7.40 MPa, 7.20 MPa, and 7.30 MPa, respectively. In this specimen, the required strength was not met, and it was observed to have decreased from the previous values. At a 40% EPS volume replacement, the concrete compressive strengths were 7.50 MPa, 5.80 MPa, 7.40 MPa, 7.20 MPa, and 8.00 MPa, respectively. In this specimen, the required strength was not met and was similar to that of the previous specimen. At a 45% EPS volume replacement, the compressive strength of the concrete in dataset 10 was 5.60 MPa, 5.80 MPa, 6.70 MPa, 5.70 MPa, and 6.70 MPa, respectively. In this specimen, the required strength was not met, and it was observed to be lower than in the previous specimen. At a 50% EPS volume replacement, the compressive strength of the concrete in dataset 11 was 6.10 MPa, 5.30 MPa, 6.10 MPa, 5.90 MPa, and 6.20 MPa, respectively. In this specimen, the required strength was not met, and its values are in the same range as those of its previous specimen.
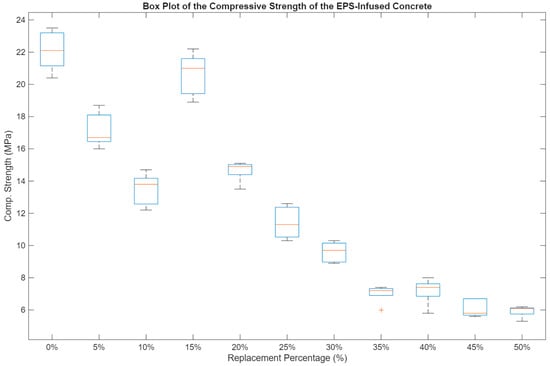
Figure 6.
Box plot of the compressive strength of the EPS-infused concrete.
Among all the expanded polystyrene (EPS) volume replacements, the 15% EPS replacement had the best compressive strength for lightweight concrete. Although no microstructural analysis was performed that might have prevented this phenomenon, it can be hypothesized to result from the correlation between density and compressive strength observed in this study, as well as the tendency of EPS to float in the absence of admixtures. Meanwhile, at a 15% EPS volume replacement, there was an observable increase in density compared to the samples at a 10% EPS volume replacement. A study found that expanded polystyrene floats to the top due to its low density and hydrophobic properties [10,13]. Since these samples were mixed separately into 11 batches, differences in EPS counts across batches may have affected the uniformity of the mixture. For that reason, future studies may incorporate admixtures to further control external factors that may affect the uniformity of EPS-infused concrete.
3.2. Relative Importance
Relative importance explains which of the input variables carries the most weight in the compressive strength of the EPS-infused concrete. Initially, a calculation was performed in Excel using multiple linear regression. Based on that, the gravel and expanded polystyrene are most significant in the multiple linear regression model, while the slump test value and density are not significant. However, in this calculation, it could not include the variables cement, water, and sand since they were constant. In this case, a SHAP analysis in MATLAB was performed to identify which input parameter has the greatest influence on the compressive strength of EPS-infused concrete. Figure 7 shows the result of the SHAP analysis done in MATLAB. It can be observed that the EPS with a mean SHAP value of 2.22 has the greatest influence on the predictions of the compressive strength of EPS-infused concrete. Next is the slump value, which lies at a mean SHAP value of 1.89. The gravel content has a mean SHAP value of 1.29, and the density of the specimens has a mean SHAP value of 0.94. The larger the mean SHAP value, the greater the variable’s influence on the model. However, the analysis has identified that the sand, water, and cement variables do not affect the predictive model. Therefore, only the values for gravel, EPS, slump value, and density will be used in the dataset to predict the compressive strength of EPS-infused concrete. Despite these variables remaining constant, they are still essential to the concrete’s actual compressive strength.
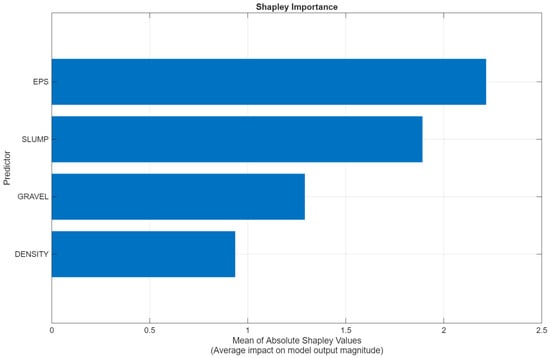
Figure 7.
Shapley importance of the independent variables.
In connection, Figure 8 shows another representation of the input parameters to be used in the model. The pink color represents larger values of that variable, while the blue represents smaller values of the variable. On the x-axis, the left side indicates that the variable has a negative impact on the outcome, while the right side indicates that the variable can increase the outcome. In this case, it can be observed that higher EPS content decreases the predicted compressive strength of concrete, while lower EPS content increases it. In terms of slump value, it is the same as the EPS content: the higher the value, the lower the predicted compressive strength value. In terms of the gravel content, it is the opposite: the higher the gravel content is, the higher the predicted compressive strength value it can produce. Lastly, in terms of density, it can be observed that both higher and lower values cluster around zero, indicating that it has a limited influence regardless of its value. Meanwhile, the variables sand, cement, and water are still considered constant, meaning their values will not affect the model’s prediction. However, it is essential to note that these variables are still needed to determine the concrete’s actual compressive strength.
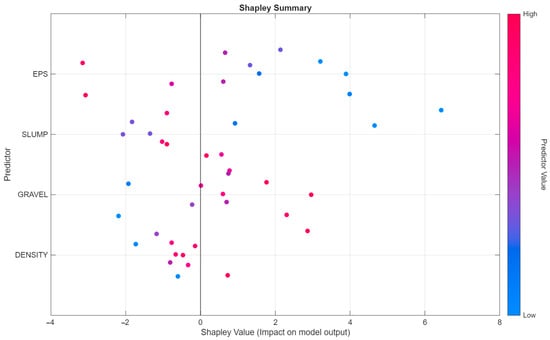
Figure 8.
SHAP bee swarm scatter plot of the independent variables.
After this SHAP analysis, it has been identified that some variables did not affect the predictive model. Initially, seven variables were present: cement, water, sand, expanded polystyrene, gravel, the slump test, and the density of the specimens. After the SHAP analysis, only four variables, expanded polystyrene, gravel, the slump test value, and the density of the specimens, were found to have significance in the prediction of the model. For that reason, the cement, water, and sand variables are removed from the equation and treated as constants. Figure 9 shows the final conceptual diagram of the research.
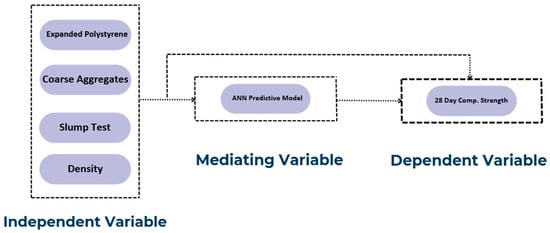
Figure 9.
Final conceptual diagram.
3.3. ANN Model Evaluation
Table 7 presents the MSE, RMSE, MAE, MAPE, R-squared, and SI values for the model’s training set, evaluated in MATLAB using 5-fold cross-validation and 80% of the 55 data points. Based on the seven models evaluated, model 4-5-1 has the best results in the training phase, with an MSE of 3.1635, RMSE of 1.7786, MAE of 1.4544, MAPE of 12.6737%, R2 of 0.8970, and SI of 0.1515.
Table 7.
ANN model with 5-fold cross-validation (training).
Table 8 presents the MSE, RMSE, MAE, MAPE, R-squared, and SI values of the ANN model obtained with 5-fold cross-validation during testing. Further, 20% of the 55 data points were set aside for this model phase. Upon observation, model 4-9-1 has the best results in the testing phase, with an MSE of 1.4059, an RMSE of 1.1857, an MAE of 0.8887, an MAPE of 6.1320%, an R-squared of 0.9596, and an SI of 0.0816. When choosing the best model, especially with 5-fold cross-validation, validation results are often based on the test results.
Table 8.
ANN model with 5-fold cross-validation (testing).
3.4. Analysis of the ANN Model
Figure 10 presents the interface of the preliminary steps of training the model. It can be observed that there are three input variables: gravel content, EPS content, slump value, and density of the specimens. Here, a 5-fold cross-validation scheme was implemented to reduce model overfitting, with 80% of the data used for training and 20% for testing.
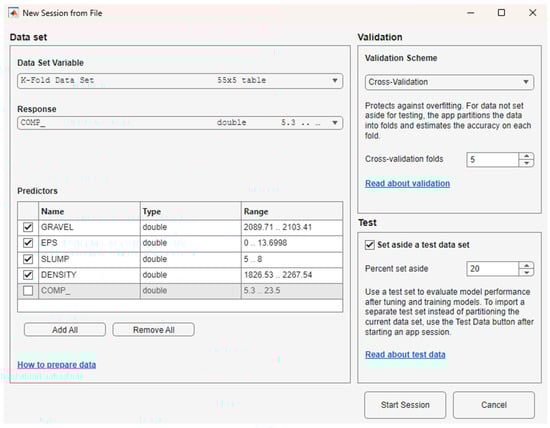
Figure 10.
ANN model with 5-fold cross-validation preliminary interface.
Figure 11 shows the predicted vs. actual plots generated by the seven ANN configurations, labeled model 4-4-1, model 4-5-1, model 4-6-1, model 4-7-1, model 4-8-1, model 4-9-1, and model 4-10-1. The 45-degree diagonal line represents the ideal prediction condition, where the predicted value equals the actual value. The points in the plot scattered around the line indicate the predictive accuracy and capabilities of each model. Based on the observations, all the models exhibit a positive linear relationship between the predicted and actual compressive strength values, confirming that the models successfully link the input variables to the output variable. Models 4-6-1, 4-7-1, and 4-9-1 showed some data points far from the 45-degree line, indicating significant inconsistency between their actual and predicted values. Models 4-4-1, 4-8-1, and 4-10-1 show a linear relationship; however, the data points appear to be flattening in some areas. However, model 4-5-1 presents data points more evenly distributed along the 45-degree line, indicating stable predictive capabilities. Unlike the other models, only model 4-5-1 showed no observable flattening, indicating minimal bias in predicting compressive strength. Therefore, the model with the best predictive performance in this category is model 4-5-1.
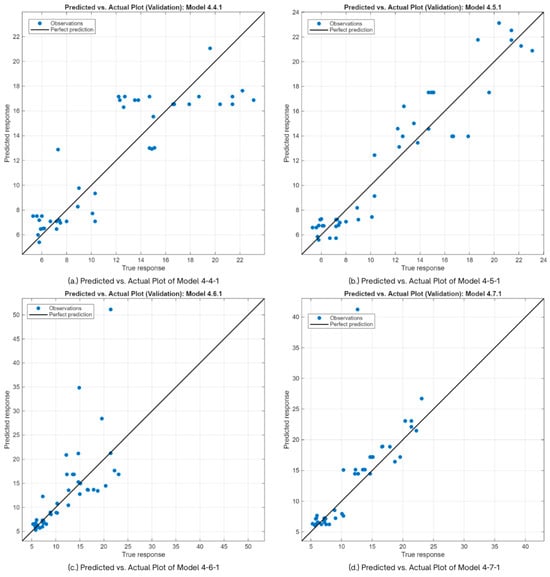
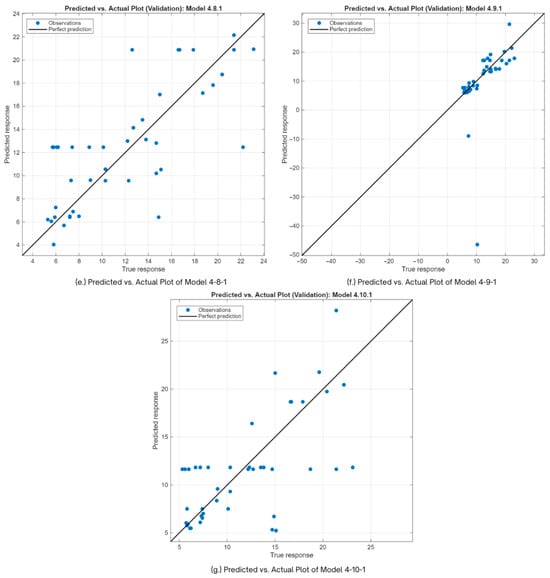
Figure 11.
Predicted vs. actual plots of the 7 ANN models.
Figure 12 presents the response plots of the seven models evaluated in the study. The response plots visually showcase the comparison between the actual compressive strength values and their predicted values from 0% to 50% replacement. It can be observed that all the models had the majority of their predicted values closely follow the actual values. However, it can be observed that all the models exhibit flattening in some areas; the greatest flattening is observed in models 4-4-1, 4-8-1, and 4-10-1. The remaining models had minimal flattening values. This flattening indicates inconsistencies in the predictive capabilities of these models. Some models, like 4-6-1, 4-7-1, and 4-9-1, have some values that are very far from the actual value. With that being said, based on observation, the best model in this regard is 4-5-1, with very minimal flattening and most of its predicted values following the actual values closely.
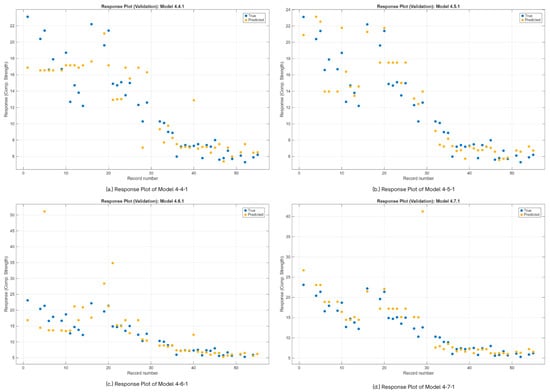
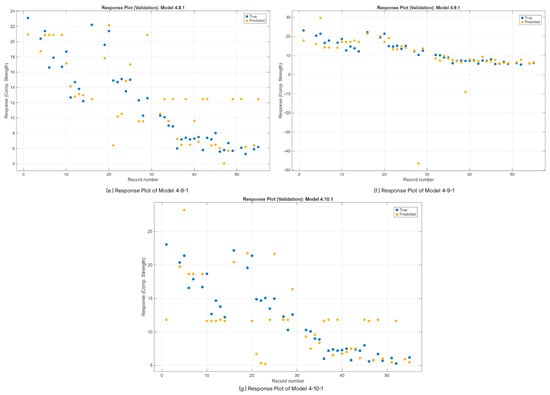
Figure 12.
Response plots of the 7 ANN models.
Moreover, Figure 13 shows the residual plots of the seven models evaluated in the study. Models 4-6-1, 4-7-1, and 4-9-1 exhibit visible clustering in the range 6–8 MPa, indicating a slight predictive bias in this range. Models 4-4-1, 4-5-1, 4-8-1, and 4-10-1 show linear patterns in the data that shift from negative to positive residuals. However, model 4-5-1 shows a very minimal observable pattern and clustering, indicating less bias and a good model. With that, in the current observation, model 4-5-1 tends to perform better than the other six models evaluated.
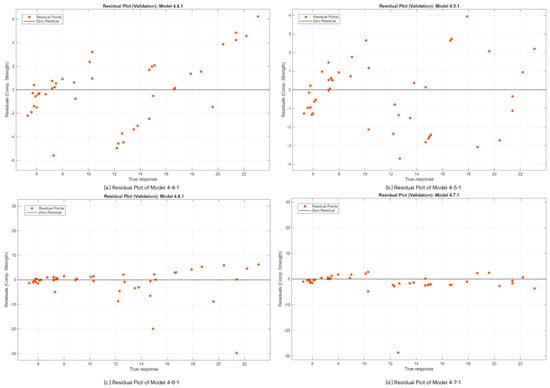
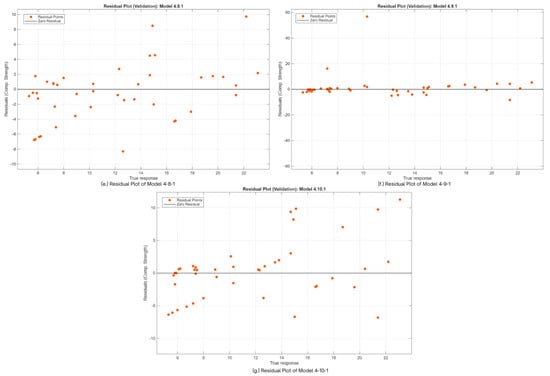
Figure 13.
Residual plots of the 7 ANN models.
3.5. Comparison to Multiple Linear Regression
As stated in the objectives, one goal of this research is to determine whether the ANN model can predict more efficiently than the MLR model. For this reason, the same dataset was used to create a multiple linear regression model in Excel, specifically using the regression data analysis tool. The input variables were the coarse aggregate content, expanded polystyrene content, slump test value, and the specimen density, while the output variable was the compressive strength of the concrete.
Based on the Excel calculations shown in Table 9, the Multiple R (correlation coefficient) of 0.93 indicates a strong positive relationship between the actual and predicted data. The R-squared (coefficient of determination) of 0.87 indicates that this model is good. The adjusted R-squared is slightly lower but still indicates the model is not overfitted. The standard error indicates that the predictions differ by ±2 MPa from the actual data, and the observations show that 55 samples were used in this model.
Table 9.
Regression statistics.
3.6. One-Way ANOVA
The varying compressive strength values of the EPS-infused lightweight concrete at different percentage levels were evaluated using one-way ANOVA. Table 10 presents a summary of the data used in this ANOVA. As observed, as the percentage replacement increases, the compressive strength decreases at every level. Regarding the variance within each group, the values are relatively low, indicating very consistent results.
Table 10.
One-way ANOVA data summary.
Table 11 shows the results of the one-way ANOVA. The null hypothesis is that changing the percentage replacement does not affect the results, while the alternative hypothesis is that it does. With an F-value of 207.78 and a p-value of 1.28 × 10⁻³³, the data indicate that changes in compression results are strongly influenced by the percentage of EPS replacement, leading to the rejection of the null hypothesis.
Table 11.
One-way ANOVA results (comparing all batch mixes).
Table 12 shows the second one-way ANOVA, wherein the 0% and 15% expanded polystyrene volume replacements were compared. The null hypothesis is that the 15% replacement does not significantly change the result compared to the standard mix. The alternative hypothesis is that the 15% replacement does significantly change the result compared to the standard mix. Based on the results, the mean value of the 15% EPS replacement mix was lower than that of the 0% standard mix. However, the computed p-value of 0.1103 was greater than the 0.05 level of significance, indicating that the null hypothesis was not rejected. Overall, there is no statistically significant difference between the 0% standard mix and the 15% EPS replacement mix.
Table 12.
One-way ANOVA results (comparing 0% and 15% EPS replacement).
4. Conclusions
This study was conducted to create an artificial neural network (ANN) predictive model with 5-fold cross-validation that specifically caters to expanded polystyrene (EPS)-infused concrete specimens. Initially, a physical experiment with 55 specimens varying in EPS content replacement (%) was conducted to collect data for the predictive model’s training phase. These specimens had constant values for cement, water, and sand content and were cured for 28 days. Following the experiment, the predictive model was created using MATLAB’s Regression Learner App, with 80% of the data used for training and 20% for testing. A multiple linear regression model was also developed and tested using the same dataset as the ANN to identify which model performs better. In addition, a SHAP analysis was implemented to identify the essential variables for predicting the compressive strength of EPS-infused concrete, and a one-way ANOVA was used to confirm the consistency of the results and to assess the difference between the chosen optimal mix and the control mix. Below are the conclusions after a thorough review of the results and analysis.
- The data showed that the compressive strength regarding a 15% replacement of coarse aggregates with expanded polystyrene (EPS) had the best results. Therefore, a recommendation for a mix design can be made to create EPS-infused concrete mixtures. In this study, at a 15% EPS volume replacement with a cement content of 664.2346 g, a water content of 365.3291 g, a sand content of 1107.0577 g, a gravel content of 2099.2998 g, an EPS content of 4.11 g, and a recommended slump value of 6 inches, the mixture can achieve the greatest compressive strength under the lightweight concrete category.
- In terms of density, a 0% expanded polystyrene (EPS) volume replacement, which is the sample specimen, is in the category of normal-weight concrete; a 5% replacement is also in the category of normal-weight concrete. Meanwhile, 10%, 15%, 20%, 25%, and 30% are in the semi-lightweight concrete category. Finally, the remaining 35%, 40%, 45%, and 50% replacements are in the category of lightweight concrete.
- In terms of the artificial neural network (ANN) model, the 4-5-1 ANN with 5-fold cross-validation performed the best among the six models evaluated. Based on the statistical methods, model 4-5-1 achieved an MSE of 3.1635, an RMSE of 1.7786, an MAE of 1.4544, an MAPE of 12.6737, an R-squared value of 0.8970, and an SI of 0.1515. In terms of the plots, model 4-5-1 showed the best predictive capabilities, with consistent performance and better results than the other models evaluated.
- Compared with multiple linear regression (MLR), with an R-squared value of 0.87, the ANN model 4-5-1 still performed better at predicting the compressive strength of expanded polystyrene (EPS)-infused concrete.
- Moreover, the one-way ANOVA yielded an F-value of 207.78 and a p-value of 1.28E-33. This confirmed that replacing expanded polystyrene (EPS) with coarse aggregates in the volume of the EPS greatly affected the compressive strength of EPS-infused concrete. Additionally, another ANOVA provided an F-value of 3.22 and a p-value of 0.110299. When comparing the 0% replacement (control mix) and the 15% replacement (optimum mix), there was no statistically significant difference between them. This indicates that the 15% replacement passed the M20-grade concrete requirements.
- Out of the seven input variables, only four of the variables were found to be relevant in predicting the compressive strength of EPS-infused concrete. The most significant is the EPS content, followed by the slump value, then the gravel content, and the least significant is the density of the specimens. On that note, the cement, water, and sand contents were found to have no bearing on the prediction of the compressive strength of EPS-infused concrete as they remained constant throughout the dataset. However, these variables remain highly important for concrete’s actual compressive strength.
This study successfully completed the two main phases of the research: the experimental determination of the 28-day compressive strength of expanded polystyrene (EPS)-infused concrete and the development of an artificial neural network (ANN) predictive model to estimate compressive strength based on the collected data. The selected ANN model demonstrated good predictive performance within the experimental dataset. However, several limitations remain and should be addressed in future studies to further strengthen the robustness, interpretability, and practical relevance of the findings. First, since the model was developed with a small dataset of 55 samples, future studies should expand the dataset through additional experiments or by integrating compatible data from related EPS-concrete studies. Second, a non-monotonic trend in compressive strength was observed, particularly at a 15% EPS replacement. Future studies should explore detailed microstructural characterization, such as scanning electron microscopy (SEM), X-ray CT imaging, interfacial transition zone analysis (ITZ), or void distribution assessment, to further understand this behavior. Third, the study only provides a 28-day compressive strength evaluation. Important mechanical properties, such as tensile strength, flexural strength, and modulus of elasticity, should be examined in the future as well to provide a more comprehensive assessment of the use of EPS in concrete and to better understand its potential in structural and non-structural applications. Fourth, the study observed a tendency for EPS to increase within the concrete mixture. Future researchers should consider using admixtures, binders, or surface treatment procedures when mixing EPS in concrete. Lastly, future researchers can include additional statistical descriptors to further improve the interpretability of the experimental findings.
Author Contributions
Conceptualization, K.J.O.C.; Methodology, K.J.O.C. and G.B.E.; Software, K.J.O.C. and G.B.E.; Validation, K.J.O.C. and G.B.E.; Formal analysis, K.J.O.C.; Investigation, K.J.O.C.; Resources, K.J.O.C.; Data curation, K.J.O.C.; Writing—original draft, K.J.O.C.; Writing—review & editing, K.J.O.C. and G.B.E.; Visualization, K.J.O.C.; Supervision, K.J.O.C. and G.B.E.; Project administration, K.J.O.C. All authors have read and agreed to the published version of the manuscript.
Funding
This research received no external funding.
Data Availability Statement
The original contributions presented in the study are included in the article, further inquiries can be directed to the corresponding author.
Conflicts of Interest
The authors declare no conflict of interest.
Abbreviations
The following abbreviations are used in this manuscript:
| ANN | Artificial Neural Network |
| ANOVA | Analysis of Variance |
| ASTM | American Society for Testing and Materials |
| EPS | Expanded Polystyrene |
| MSE | Mean Squared Error |
| MAE | Mean Absolute Error |
| MAPE | Mean Absolute Percentage Error |
| RMSE | Root Mean Squared Error |
| SI | Scatter Index |
| ITZ | Interfacial Transition Zone |
References
- Siman, B.P. A Critical Analysis of the Philippine Construction Industry: Current Trends, Forecast, and Business Focus for Engineering Design Firms. Int. J. Multidiscip. Appl. Bus. Educ. Res. 2023, 4, 2691–2699. [Google Scholar] [CrossRef]
- Babor, D.; Plian, D.; Judele, L. Environmental Impact of Concrete. Bull. Polytech. Inst. Jassy 2009, 5–8. [Google Scholar]
- Mehta, K. Reducing the Environmental Impact of Concrete. Concr. Int. 2001, 23, 61–66. [Google Scholar]
- Sulong, N.H.R.; Mustapa, S.A.S.; Rashid, M.K.A. Application of expanded polystyrene (EPS) in buildings and constructions: A review. J. Appl. Polym. Sci. 2019, 136, 47529. [Google Scholar] [CrossRef]
- Kulkarni, A.A. Strength and Durability of Polystyrene Concrete. Int. J. Recent Technol. Eng. 2021, 9, 166–171. [Google Scholar] [CrossRef]
- Assaad, J.J.; Mikhael, C.; Hanna, R. Recycling of waste expanded polystyrene concrete in lightweight sandwich panels and structural applications. Clean. Mater. 2022, 4, 100095. [Google Scholar] [CrossRef]
- EPSOLE. What Are EPS Beads? Ultimate Guide to Expanded Polystyrene Beads. Available online: https://epsole.com/what-are-eps-beads/ (accessed on 16 June 2025).
- MATWEB. Overview of Materials for Expanded Polystyrene (EPS). Available online: https://www.matweb.com/search/DataSheet.aspx?MatGUID=5f099f2b5eeb41cba804ca0bc64fa62f&ckck=1 (accessed on 21 November 2025).
- Ousji, H.; Miled, K.; Siala, A.; Belkassem, B.; Lecompte, D. Blast mitigation using low-density EPS concrete: An experimental study. Case Stud. Constr. Mater. 2024, 21, e03962. [Google Scholar] [CrossRef]
- Maghfouri, M.; Alimohammadi, V.; Gupta, R.; Saberian, M.; Azarsa, P.; Hashemi, M.; Asadi, I.; Roychand, R. Drying shrinkage properties of expanded polystyrene (EPS) lightweight aggregate concrete: A review. Case Stud. Constr. Mater. 2022, 16, e00919. [Google Scholar] [CrossRef]
- Wang, Y.; Zhuang, X. Experimental Study on Mechanical Properties of Graded EPS–Steel Fiber-Reinforced Concrete. Appl. Sci. 2025, 15, 1980. [Google Scholar] [CrossRef]
- Zhao, C.; Xing, F.; Feng, Y.; Lv, L.; Kou, Z.; Li, L. Study on the Mechanical Properties and Interfacial Interaction Mechanism of Nano-SiO2-Modified Expanded Polystyrene Lightweight Concrete. Buildings 2026, 16, 1078. [Google Scholar] [CrossRef]
- Silva, V.G.; Filho, C.G.S.; Angelin, A.F.; Paiva, A.E.M.; Palma, S.S.A.; Goncalves, R.; Lintz, R.C.C.; Gachet, L.A.; Miranda, E.J.P., Jr. Microstructural, mechanical, and acoustic analyses of concrete with EPS and silica fume. Rev. IBRACON Estrut. Mater. 2025, 18, e18112. [Google Scholar] [CrossRef]
- Ubi, S.E.; Ewa, D.E.; Bessong, A.R.; Nyah, E.D. Effects of Incorporating Expanded Polystyrene in Concrete Construction. J. Build. Constr. Plan. 2022, 10, 79–101. [Google Scholar] [CrossRef]
- Kharun, M.; Svintsov, A. Polystyrene concrete as the structural thermal insulating material. Int. J. Adv. Appl. Sci. 2017, 4, 40–45. [Google Scholar] [CrossRef]
- Perry, S.H.; Bischoff, P.H.; Yamura, K. Mix details and material behaviour of polystyrene aggregate concrete. Mag. Concr. Res. 1991, 43, 71–76. [Google Scholar] [CrossRef]
- Kan, A.; Demirboga, R. A novel material for lightweight concrete production. Cem. Concr. Compos. 2009, 31, 489–495. [Google Scholar] [CrossRef]
- Saradhi Babu, D.; Ganesh Babu, K.; Tiong-Huan, W. Effect of polystyrene aggregate size on strength and moisture migration characteristics of lightweight concrete. Cem. Concr. Compos. 2006, 28, 520–527. [Google Scholar] [CrossRef]
- Topacio, A.; Marcos, M.C.M. Lightweight interlocking blocks using expanded polystyrene foam as partial replacement to coarse aggregates. In Proceedings of the 2018 World Congress on Advances in Civil, Engineering, & Materials Research, Incheon, Republic of Korea, 27–31 August 2018. [Google Scholar]
- Ibrahim, M.; Ahmad, A.; Barry, M.S.; Alhems, L.M.; Mohamed Suhoothi, A.C. Durability of Structural Lightweight Concrete Containing Expanded Perlite Aggregate. Int. J. Concr. Struct. Mater. 2020, 14, 50. [Google Scholar] [CrossRef]
- Meena, R.; Sharma, S.; Sharma, A.; Kumar, M. Study on Lightweight Concrete- Review. Int. J. Eng. Res. Technol. 2020, 9, 786–787. [Google Scholar] [CrossRef]
- Vives, I.; Varona, F.; Tenza-Abril, A.; Pereiro-Barceló, J. A Parametric Study to Assess Lightweight Aggregate Concrete for Future Sustainable Construction of Reinforced Concrete Beams. Sustainability 2021, 13, 13893. [Google Scholar] [CrossRef]
- Smoczkiewicz-Wojciechowska, A.; Sybis, M.; Madrawski, J.; Kostrzewski, W. The Study on Possible Applications of Lightweight Concrete Based on Waste Aggregate in Terms of Compressive Strength and Thermal Insulation Properties. Pol. J. Environ. Stud. 2022, 31, 833–841. [Google Scholar] [CrossRef]
- Islam, S.; Ara, G.; Akhtar, U.S.; Mostafa, M.G.; Haque, I.; Shuva, Z.M.; Samad, A. Development of lightweight structural concrete with artificial aggregate manufactured from local clay and solid waste materials. Heliyon 2024, 10, e34887. [Google Scholar] [CrossRef]
- Le Roy, R.; Parant, E.; Boulay, C. Taking into account the inclusions’ size in lightweight concrete compressive strength prediction. Cem. Concr. Res. 2005, 35, 770–775. [Google Scholar] [CrossRef]
- Prasad, E.V.; Rama Krishna, S.; Singha, S. A novel composite machine learning model for the prediction of compressive strength of blended concrete. J. Build. Pathol. Rehabil. 2024, 10, 13. [Google Scholar] [CrossRef]
- Fu, B.; Lei, H.; Ullah, I.; El-Meligy, M.; El Hindi, K.; Javed, M.F.; Ahmad, F. Predictive modeling for durability characteristics of blended cement concrete utilizing machine learning algorithms. Case Stud. Constr. Mater. 2025, 22, e04209. [Google Scholar] [CrossRef]
- Mosquera, K.U.; Estores, G.B. Pull-out Capacity of Expansion Anchor Bolt as influenced by corrosion. Int. J. GEOMATE 2023, 25, 1–8. [Google Scholar] [CrossRef]
- Naderpour, H.; Rafiean, A.H.; Fakharian, P. Compressive strength prediction of environmentally friendly concrete using artificial neural networks. J. Build. Eng. 2018, 16, 213–219. [Google Scholar] [CrossRef]
- ASTM C330/C330M-09; Standard Specification for Lightweight Aggregates for Structural Concrete. ASTM International: West Conshohocken, PA, USA, 2009. [CrossRef]
- ASTM C192/C192M-24; Standard Practice for Making and Curing Concrete Test Specimens in the Laboratory. ASTM International: West Conshohocken, PA, USA, 2024. [CrossRef]
- ASTM C33/C33M-18; Standard Specification for Concrete Aggregates. ASTM International: West Conshohocken, PA, USA, 2018. [CrossRef]
- ASTM C143/C143M-98; Standard Test Method for Slump of Hydraulic-Cement Concrete. ASTM International: West Conshohocken, PA, USA, 1998. [CrossRef]
- ASTM C39/C39M-21; Standard Test Method for Compressive Strength of Cylindrical Concrete Specimens. ASTM International: West Conshohocken, PA, USA, 2023. [CrossRef]


Disclaimer/Publisher’s Note: The statements, opinions and data contained in all publications are solely those of the individual author(s) and contributor(s) and not of MDPI and/or the editor(s). MDPI and/or the editor(s) disclaim responsibility for any injury to people or property resulting from any ideas, methods, instructions or products referred to in the content. |
© 2026 by the authors. Licensee MDPI, Basel, Switzerland. This article is an open access article distributed under the terms and conditions of the Creative Commons Attribution (CC BY) license.