Abstract
The built environment in the EU accounts for 40% of the total energy consumption and 36% of the total greenhouse gas emissions. To address the inefficiency of existing buildings, renovation could reduce their total energy consumption by 5–6% and lower carbon dioxide emissions by approximately 5%. A retrofit solution for existing buildings involves the use of lightweight prefabricated systems, some of which include integrated HVAC components that are able to enhance their functionality. Indeed, such prefabricated facade elements with integrated HVAC systems can represent a minimally invasive method for reducing the energy consumption of an existing building. To assess the potential of this approach, a full-scale mock-up of a prefabricated timber facade with integrated HVAC system was tested at the Facade System Interactions Lab (FSIL) of Eurac Research, Bolzano. The experimental data were used to develop a calibrated and validated 3D finite element model in COMSOL Multiphysics. The validated model was used to evaluate the facade’s thermal performance under standard heating conditions through a proposed equivalent thermal transmittance indicator (Ueq). Results show that the active facade achieves 0.07 W m−2 K−1, compared to 0.21 W m−2 K−1 for the passive facade with identical materials but without active components.
1. Introduction
Replacing or upgrading facades with off-site prefabricated systems is increasingly explored in research and implemented in the market as a fast, high-quality way for deep energy renovation of existing buildings [1]. This is particularly relevant given that buildings in the EU account for 40% of the total energy consumption and 36% of greenhouse gas emissions [2], and renovating the existing building stock could reduce total energy consumption by 5–6% and lower carbon dioxide emissions by approximately 5% [2]. Prefabricated facade solutions range from simple insulated panel kits to modular “plug-and-play” units that combine glazing, insulation, and building services in a single element [3]. These systems are valued for their potential to significantly reduce on-site construction time and to improve quality control through factory production, particularly in terms of airtightness and the continuity of insulation. By standardizing and optimizing the renovation process, they also offer a scalable approach that can support higher renovation rates and contribute to climate targets.
Prefabricated facade systems are often grouped into passive and active approaches [4]. Passive systems aim primarily to improve the building’s thermal behavior through building-physics measures such as adding high-performance insulation, applying ventilated rainscreens, or installing double-skin and buffer-zone assemblies [5]. These solutions reduce heat losses and solar gains without relying on mechanical equipment. Active prefabricated facades, by contrast, integrate energy-generating or dynamic components. These may include energy-generating components, HVAC modules, or adaptive elements [3]. A clear understanding of thermal performance is essential in facade retrofit, and its assessment becomes particularly complex and system-specific in the case of active facade solutions [6].
1.1. Performance Evaluation of Active Facade Systems
The development of multifunctional active facades has been supported by numerous European research initiatives over the past decade. As highlighted in a recent special issue collecting results from EU H2020 funded projects, Founti et al. [7] emphasized that plug-and-build smart components—including insulation materials, heating and cooling elements, ventilation, smart windows, energy production, and solar harvesting systems—can be integrated into prefabricated envelope systems suitable for mass production and deep renovation to nZEB (Nearly Zero Energy Buildings [8]) standards.
In Dermentzis et al. [9] and Ochs et al. [10], the analysis of a facade integrated micro-heat pump in combination with a mechanical ventilation system with heat recovery is performed. In these studies, the model of the facade is calibrated with measurement data, as in the present study, but the focus of the performed analysis is on the energy performance characterization of the heat pump for seven different climate conditions [9]. More recently, Ochs et al. [11] extended this research by presenting a comprehensive holistic design and optimization process for compact decentral facade-integrated air-to-air heat pumps, demonstrating improvements in thermal comfort and control for serial renovation of multi-apartment buildings.
Moreover, in Adamovsky et al. [12], three different types of plug-and-use building envelope kits are introduced: “SmartWall”—a multifunctional prefabricated wall panel; “eWHC”—an external prefabricated Wall Heating and Cooling module panel; and “eAHC”—a prefabricated module with air handling unit with Advanced Heat/Cool recovery system. However, the analysis of these systems covers case studies for which the obtained results are compared to standard values of local nZEB requirements. The “SmartWall” system analysis is the focus of the paper [13], where the facade is described and analyzed in more detail. The equivalent thermal transmittance calculation method is introduced in this paper, and the heating load and energy demands are assessed first for the existing building and second for the same building but with the “SmartWall” applied.
A comprehensive review of European modular facade systems integrating renewable energy technologies was provided by Li and Chen [14], who systematically analyzed projects from Horizon 2020 and IEA ECBCS Annex 50 Prefabricated Systems for Low-Energy Renovation of Residential Buildings. Their investigation classified all modular facade systems into three functional layers—interior, module, and exterior—and concluded that integrating renewable energy techniques into insulated building facade systems represents the core achievement of these innovative approaches. Furthermore, Evola et al. [15] investigated the thermal performance of prefabricated timber-based retrofit solutions, applied to a pilot building in Southern Europe. Their dynamic energy simulations revealed that the proposed solutions allow for the energy need for space heating and cooling to be reduced by 66% and 25%, respectively, while highlighting that the impact of thermal bridges cannot be neglected after renovation, as they still account for a significant share of the overall heat losses.
Expanding on these solutions, other studies have explored the integration of renewable energy generation and storage systems within prefabricated facades. Van Roosmalen et al. [3] reviewed State-of-the-Art prefabricated systems with integrated HVAC, BIPV, solar thermal collectors, and energy storage, assessing their potential for self-sufficiency. However, no specific performance evaluations at the whole facade system scale were reported. Field validation of energy-saving benefits was provided by Callegaro and Albatici [16], who presented a pre- and post-renovation comparison between two identical buildings using timber-based prefabricated modules. Their study, based on continuous monitoring over multiple heating seasons, confirmed significant reductions in heat flux through the building envelope, with thermographic analysis clearly highlighting the improved thermal performance at masonry joints and thermal bridges after renovation.
However, while the thermal performance of passive prefabricated facades can be assessed using conventional metrics such as thermal transmittance (U-value), the evaluation of multifunctional facades integrating active HVAC components poses additional challenges. Standard calculation methods based on EN ISO 6946:2017 [17] assume steady-state heat transfer through static building elements and do not account for the thermal interactions introduced by integrated ventilation systems, heat exchangers, or air distribution networks. A similar limitation has been identified for transparent facades, where Gazzin et al. [18] demonstrated that conventional steady-state metrics such as the Solar Heat Gain Coefficient (SHGC) inadequately capture the complex thermal behavior of modern glazing systems under dynamic conditions. Their work proposed novel key performance indicators—the Daily Integrated SHGC and the Maximum Solar Gain Ratio—to provide a more accurate reflection of facade performance by considering daily variations in solar exposure and real environmental conditions. Analogously, for opaque multifunctional facades with integrated HVAC components, simplified indicators are needed to capture the thermal behavior of such complex assemblies while enabling direct comparison with traditional wall systems for design and regulatory purposes. This paper addresses this gap by analyzing the thermal performance of a novel prefabricated facade system with integrated HVAC and proposing a methodology for its characterization.
1.2. Technology Development
In response to these challenges, this study focuses on the thermal performance characterization of a novel modular prefabricated timber facade with an integrated energy and fresh air distribution kit that is designed to operate as mechanical ventilation and space heating/cooling systems at the same time. It is designed for nearly Zero-Energy Building (nZEB) retrofits thanks to a simple installation on the existing building’s exterior, whereby the intervention on the existing building is minimized through the integration of the HVAC system within the facade. The ventilation machine developed specifically for this multifunctional facade provides a dual-flow heat recovery system and a water coil for air heating and cooling. Such a machine is integrated in a timber-based prefabricated facade along with a set of air ducts with connection points for fresh and exhaust air (Figure 1); water pipes connected to a hot- and cold-water generation system; and a sensing and control unit. The ventilation units are connected to different areas of the climate-controlled environment through air ducts embedded in the prefabricated facade modules, whereas a centralized heat pump, located in technical spaces, generates the necessary energy for heating and cooling. In addition, facade-integrated water pipes connect the heat pump to each decentralized ventilation unit. Finally, the system adjusts the amount of air and energy distributed based on the conditions of the indoor environment. The multifunctional facade was developed and designed by merging the experiences of an interdisciplinary team, aiming at taking into consideration the building physics and the mechanical engineering [19]. This innovative comprehensive solution aims to deliver thermal insulation, heating, cooling, and fresh air all in one package [20].
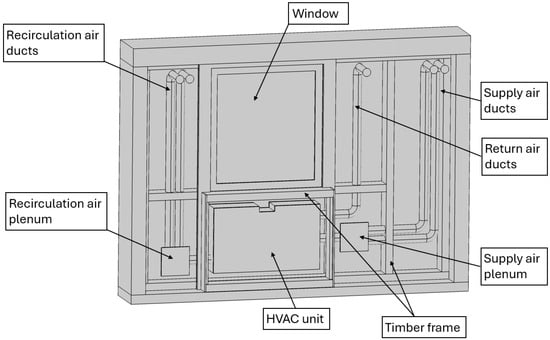
Figure 1.
Multifunctional facade with energy and fresh air distribution kit—view from inside.
Prefabrication and multifunctionality offer competitive advantages by reducing both disruption to inhabitants and installation complexity. However, bottlenecks remain in terms of (i) reliability of actual operation and (ii) proper design with not-detailed tools. Indeed, there is limited understanding of how integrated active components affect heat transfer in prefabricated facade and influence overall system performance [6].
Having a facade system with non-standard inhomogeneous integrated components (that could be non-active or active) creates a complex thermal interaction which is hardly manageable by designers and manufacturers. There is, hence, the need to (i) understand and map such thermal performance with a detailed approach, and (ii) to define simplified yet sufficiently reliable indicators that allow practitioners to evaluate such facades and compare them with conventional retrofit approaches within a more standardized design process.
This study analyses the thermal performance of a prefabricated timber-based facade system integrating an HVAC unit and aeraulic network, combining experimental testing and numerical modeling. The novelty lies in (i) developing a 3D finite element model calibrated and validated against full-scale laboratory measurements, with a simplified representation of the HVAC unit; and (ii) proposing an equivalent thermal transmittance indicator (Ueq) that allows for direct comparison with conventional wall systems.
2. Methodology
To address this challenge and achieve the objectives outlined in Section 1.2, a combined experimental and numerical approach was adopted, integrating laboratory measurements with detailed 3D finite element modeling. This enables both the validation of the numerical model and the characterization of the facade’s thermal behavior under reference conditions.
This work was structured in the following steps:
- An experimental measurement campaign was carried out in the Facade System Interactions Lab (FSIL) of Eurac Research [21], where a full-scale mock-up of the multifunctional facade was tested under controlled indoor and real outdoor boundary conditions.
- A 3D finite element model of the tested multifunctional facade was developed in COMSOL Multiphysics [22], and a series of simulations were performed to calibrate and validate the model.
- The validated model was then used to evaluate the facade’s thermal performance under standard boundary conditions, enabling comparison with conventional wall assemblies.
- Finally, a simplified methodology was developed to evaluate the overall thermal behavior of the wall assembly, accounting for the different thermal performances of individual facade components and enabling direct comparison with conventional wall systems through a single performance indicator, the equivalent thermal transmittance (Ueq).
2.1. Key Performance Indicators
The key performance indicators (KPIs) used in this paper to evaluate the performance of the multifunctional facade are reported and described in the following paragraph.
Surface temperature (T [°C]): The surface temperature was measured in specific points of the facade mock-up and extracted from the numerical simulation on the same points. These values were compared and used as calibration targets during the model validation process.
Total normal heat flux (tnHF [W]): The total normal heat flux through the internal surface of the facade was calculated from the simulation results. This indicator was used to compare the thermal performance under different operational conditions and to derive the equivalent thermal transmittance based on the projected surface area.
Equivalent thermal transmittance (Ueq [W m−2 K−1]): The equivalent thermal transmittance was calculated using the simulated total normal heat flux divided by the projected area and the air temperature difference between internal and external ambient. This indicator enables comparison of the facade’s thermal performance under different operational conditions at standard heating boundary conditions. It is important to note that Ueq is not equivalent to the standard thermal transmittance (U-value) for passive building elements. While the standard U-value is an intrinsic property of the wall assembly under fixed surface resistance assumptions, Ueq is a boundary condition-dependent performance indicator that accounts for the combined effect of transmission heat losses and internal heat gains introduced by the active components (e.g., supply air duct). As such, Ueq reflects the overall heat transfer behavior of the facade system under specific operating conditions.
Specific heat flux by temperature difference (sHFT [W m−2 K−1]): In the facade region influenced by the supply air duct, the heat flux reverses direction, resulting in a net heat gain to the indoor environment rather than a heat loss. Under these conditions, Ueq loses its conventional physical interpretation, as it would yield negative values that cannot be compared with standard thermal transmittance. Therefore, the specific heat flux by temperature difference (sHFT) is introduced to describe this heat gain per unit area and temperature difference.
2.2. Measurements
The goals of this measurement campaign were twofold: on the one hand, to test the multifunctional facade system in a semi-real environment and, on the other hand, to collect data to calibrate and validate the numerical model.
A full-scale prototype of the multifunctional facade was installed and tested at the Facade System Interactions Lab (FSIL) of Eurac Research [21]. The facade was constructed as a layered assembly, comprising the following components from interior to exterior: an existing masonry wall (brick and mortar), a thin mineral wool insulation layer, oriented strand board (OSB), a timber frame structure housing air ducts and filled with mineral wool insulation, high-density wood fiberboard (HDF), a naturally ventilated air cavity, and external timber cladding. The material properties of the facade’s layered structure are derived from the datasheets of the materials used for the construction of the prototype, as reported in Table 1.

Table 1.
Multifunctional facade material properties from material datasheets.
The FSIL laboratory comprises two identical test chambers (8 m × 4 m × 3 m) mounted on a rotating platform that allows for adjustment of the facade orientation (see Figure 2). For this study, the facades were oriented towards the south. One chamber was equipped with a reference facade without active components, while the other housed the multifunctional facade with the integrated HVAC system under investigation. The indoor air conditions in the chamber with the multifunctional facade were controlled by its integrated energy and fresh air distribution system, whereas the reference chamber was conditioned by the laboratory’s air handling unit. Data from the reference facade were not considered in this study.
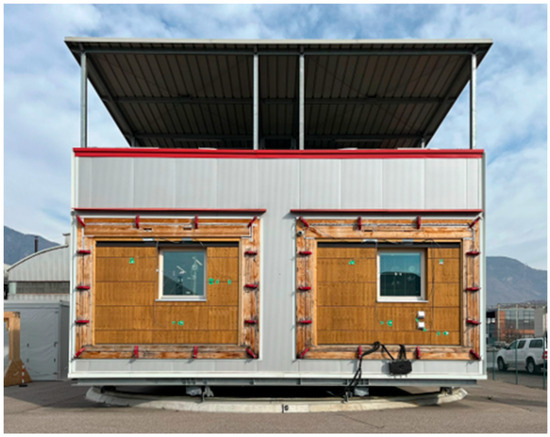
Figure 2.
The FSIL facility at Eurac Research, Bolzano. Left, reference timber facade without HVAC system; right, multifunctional facade with integrated HVAC system.
The measurement campaign included the acquisition of air and surface temperatures at multiple locations on the mock-up, as summarized below.
Air temperatures: Indoor and outdoor air temperatures were recorded, along with air temperatures in the three ducts (supply, return, and recirculation). These measurements provided the boundary conditions for the numerical model (Table 2). For each duct, two sensors were installed: one at the ventilation-unit end and one at the room-side end. The mean value of the two readings was calculated for each duct, and the corresponding measurement uncertainty was determined following the procedure described in [23].
Table 2.
Type and accuracy of the temperature sensors used at the mock-up. ∆T, temperature accuracy of sensor; @T, temperature at which the accuracy is evaluated.
Surface temperatures: Surface temperatures were recorded at ten sensor locations on the mock-up (Figure 3). Four sensors were placed on the internal facade surface, directly on the plaster layer (TintS1, TintS2, TintS3, and TintS4). Three sensors were positioned between the HDF layer and the mineral wool insulation on the external side (TextS1, TextS3, and TextS4). Two sensors were installed on the internal surface of the window, one at the top (TintWt) and one at the bottom (TintWb), while one sensor was located at the center of the window on the external surface (TextWc). The sensor positions are shown in Figure 4.
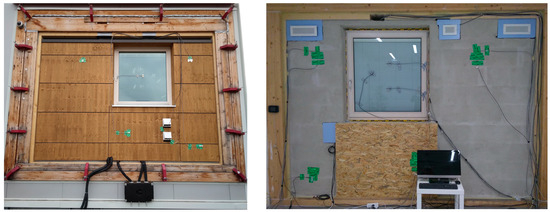
Figure 3.
Multifunctional facade mock-up installed in the FSIL facility (left, external view; right, internal view).
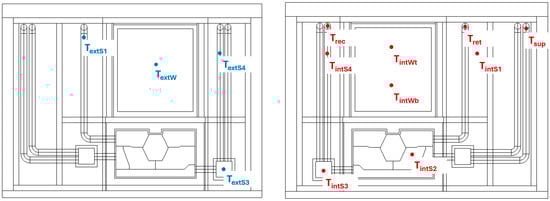
Figure 4.
Surface temperature measurement points’ layout (left, external view; right, internal view).
In Table 2, the type and accuracy of the temperature sensors used on the mock-up to measure the mentioned temperatures are reported.
The expanded measurement uncertainty for each temperature sensor was estimated following the GUM methodology [24]. All uncertainty components were evaluated as Type B, assuming a rectangular probability distribution. Two contributions were considered: (i) the standard uncertainty derived from the manufacturer’s accuracy specification, = ∆T/√3; and (ii) an estimated installation uncertainty accounting for thermal contact and sensor positioning effects, estimated as ±0.10 K and converted to standard uncertainty as = 0.10/√3 [25]. The combined standard uncertainty was calculated as the root sum of squares of the individual contributions:
where = 2 is the coverage factor, corresponding to a 95% confidence level. The resulting expanded uncertainty is ±0.12 K for the PT100 plate sensors (used for surface temperature measurements on the opaque facade and window) and ±0.36 K for the EE060 sensors (used for air temperatures and the surface temperatures between the HDF layer and the mineral wool insulation on the external side).
The overall duration of the monitoring campaign was six months (from October 2022 to March 2023), from which several days were chosen for model calibration and validation. In particular, for the model calibration, a period of three hours on 27 February 2023, from 5:00 AM to 8:00 AM, was selected. Meanwhile, for the model validation, three additional periods, one for each operational condition, were taken: one heating case (14 February 2023, from 5:00 AM to 8:00 AM), one cooling case (10 March 2023, from 4:30 AM to 7:30 AM), and one case with switched-off HVAC unit (12 November 2023, from 5:00 AM to 8:00 AM).
2.3. Modeling Approach
2.3.1. Model Setup
The numerical model of the facade was developed using the finite element software COMSOL Multiphysics [22]. The model was based on a detailed three-dimensional geometry of the facade system and the material properties reported in Table 1, enabling simulation of heat transfer through the facade under different boundary conditions.
Figure 5 shows the COMSOL model’s geometry from both external and internal perspectives, including a detailed view of the interior.
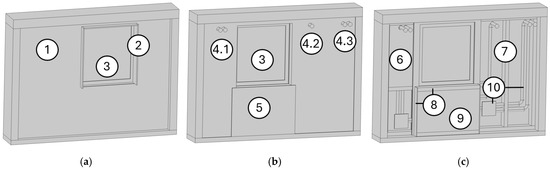
Figure 5.
The geometry of the COMSOL model from the external (a) and internal (b) point of view. (1) HDF layer, (2) timber window frame, (3) glazing system, (4.1) recirculation air duct, (4.2) return air duct, (4.3) supply air duct, and (5) timber cover of ventilation machine. Internal geometry of the COMSOL model (c). (6) Mineral wool insulation, (7) timber frame, (8) timber box for ventilation machine, (9) mineral wool insulation of ventilation machine, and (10) air ducts and plenum. Facade width, 3.75 m; facade height, 2.80 m.
The numerical model was developed using the Heat Transfer in Solids module of COMSOL Multiphysics [26]. The simulation of the multifunctional facade included several simplifying assumptions, as described below.
First, the external cladding was excluded from the model to focus on the interaction between the timber-based facade and the integrated technologies. To account for the ventilated air cavity, its thermal resistance was modeled in accordance with EN ISO 6946:2017 [17]. This standard classifies air gaps into non-ventilated, weakly ventilated, and strongly ventilated types, based on the ventilation area (Av). For vertical ventilated facades, Av is determined by the ratio of the total area of air passage openings to the horizontal length of the facade. If Av exceeds 1500 mm2 m−1, the facade is classified as strongly ventilated. In this study, Av was calculated to be 152 446 mm2 m−1, classifying the air cavity as strongly ventilated. Consequently, only the layers between the heated space and the cavity contribute to the thermal resistance calculation, and the internal surface resistance (Rsi = 0.13 m2 K W−1) is applied at the external surfaces covered by the cladding.
Second, the window was modeled assuming direct contact between frame, glazing, and facade, omitting the anchoring system and intermediate materials. This simplification divides the window into two components: the glazing and the wooden frame. Equivalent thermal conductivities for these materials were calculated based on thermal transmittance values from the manufacturer’s technical datasheets. The equivalent thermal conductivity of the glazing, λg, was calculated knowing the thermal transmittance, Ug = 0.5 W m−2 K−1, and using Equation (2):
where thg is the thickness of the glass, and Rsi = 0.13 m2 K W−1 and Rse = 0.04 m2 K W−1 are the internal and external surface resistances according to the standard EN ISO 6946:2017 [17].
Third, air movement within the facade ducts was not modeled directly. Instead, a heat flux boundary condition was applied based on the air flow velocity inside the ducts. Using the volume flow rate () and the thermal resistance of the air ducts (), the total heat transfer coefficient () was calculated according to Equations (3) and (4) [26].
where const is a temperature-dependent constant of air, calculated for 40 °C (supply) and for 20 °C (return and recirculation) for the winter-heating case. It is a function of the air density, the dynamic viscosity, the heat capacity, the thermal conductivity, and the pipe diameter. Rduct is instead the thermal resistance of the air ducts given the considered uninsulated pipe thickness and thermal conductivity reported in Table 1. The just-described values are reported in Table 3. This simplified approach was adopted instead of a full conjugate heat transfer simulation to reduce computational cost, as the study focuses on the thermal characterization of the facade assembly rather than on the detailed aeraulic behavior within the ducts. This approach is considered appropriate given that duct air temperatures and flow rates are known from measurements, the duct geometries are simple circular channels for which established forced-convection correlations apply, and the short duct length within the facade ensures approximately uniform air temperature. The validity of this simplification is confirmed by the model validation results presented in Section 3.1.
Table 3.
Thermal resistance and constants for the air ducts’ heat transfer coefficient calculation. Rduct, thermal resistance of the air ducts; const40°C, constant at 40 °C; and const20°C, constant at 20 °C.
Finally, the integrated HVAC unit was simplified by dividing its geometry into several isothermal temperature zones [19]. This approach significantly reduced calculation time while maintaining an acceptable level of accuracy, as the focus is on the wall’s performance rather than the detailed modeling of the HVAC unit. In particular, the HVAC system was divided into seven temperature zones, as shown in Figure 6, to which different temperatures were assigned. The fresh air zone is connected to the external air and has therefore the same temperature as the external air. The return air is connected to the return air duct and has therefore the same temperature as the air in this duct. The same concept was applied also to the supply air II and recirculation air zones. As reported in Section 2.2, the zone temperatures were derived from measured air temperatures and the manufacturer’s declared heat-exchanger efficiency.
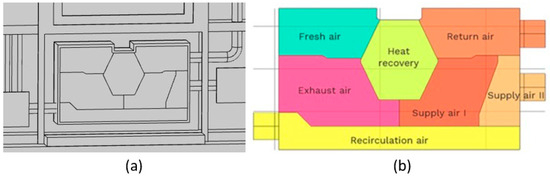
Figure 6.
HVAC system temperature zones. (a) Ventilation machine in the context of the facade geometry in COMSOL and (b) description of the temperature zones.
For the remaining zones, the calculation of the temperatures was performed knowing the stated efficiency of the heat exchanger by the producer. The following formulas calculating the temperatures of the three remaining zones were taken from the standard reported in [16], and the efficiency of the heat exchanger given by the manufacturer is η = 0.85.
Mesh discretization
The three-dimensional geometry was discretized using approximately 8,350,000 finite elements with a maximum element size of 3 cm. Swept meshes were used wherever the geometry allowed it, ensuring at least three elements across each material layer thickness to adequately resolve the heat transfer through the facade assembly. Free tetrahedral elements were used for the remaining geometrically complex regions, such as the HVAC unit and duct junctions. A mesh refinement study was performed by progressively reducing the element size until the variation in simulated surface temperatures at the monitoring points was below 0.1 K between consecutive refinements, confirming mesh independence of the results.
External and internal boundary conditions
Boundary conditions were applied to all external surfaces of the computational domain. An adiabatic boundary condition (q = 0) was set for the lateral surface of the facade frame that is in contact with the frame of the FSIL test chamber, assuming zero heat flux across these surfaces. On all other surfaces (room-side and outdoor-side), a convective heat flux boundary condition (Robin third type) was applied (8) with surface-specific heat transfer coefficients, . The exact value of the heat transfer coefficients was determined in the model calibration phase, as described in Section 2.3.2. Different values were defined for the following domains: internal surfaces, ; external surfaces, ; and external cladding, Figure 7 presents the boundary conditions assigned to the various surfaces of the numerical model.
where is the measured internal/external air temperature, as reported in Section 2.3.2, while is the wall internal/external surface temperature resulting from the simulation.
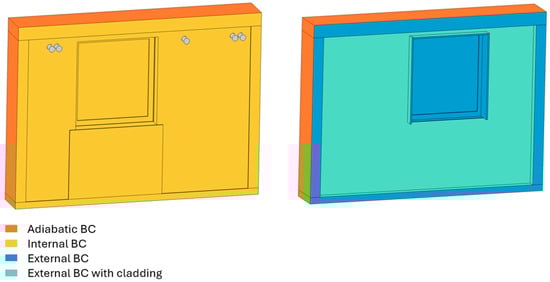
Figure 7.
The boundary conditions (BCs) applied at facade’s surfaces. Left, view from inside with adiabatic and internal BC; right, view from external side with external BC with and without cladding.
Air duct boundary conditions
In addition to the domain’s external surfaces, also for the ducts inside the facade, appropriate boundary conditions had to be set. Also, for these surfaces, a heat flux boundary condition was defined, where the heat transfer coefficient depended on the temperature and the volume flow rate of the fluid, as described by Equation (3). Different heat transfer coefficients were applied to the three typologies of ducts, namely supply air, return air, and recirculation air ducts. Figure 8 shows the position of the ducts within the façade.
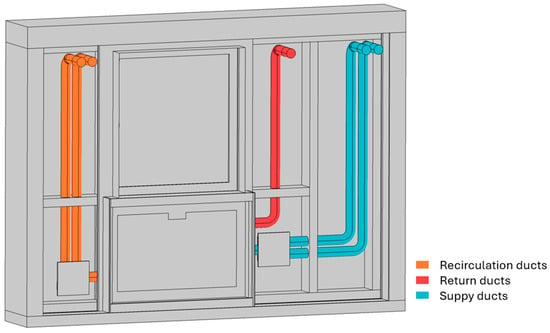
Figure 8.
The boundary conditions (BCs) applied on the internal surface of the air ducts of the facade. The recirculation ducts are in orange, the return duct is in red, and the supply ducts are in blue.
2.3.2. Model Calibration and Validation
The model was calibrated using a steady-state simulation representing winter-heating conditions. Since the measured data varied over time due to changing weather conditions, average values over periods with approximately constant temperatures were used as boundary conditions. Although the monitoring campaign covered a six-month period, this study focused on steady-state thermal characterization rather than dynamic facade behavior. Therefore, specific time periods with approximately constant boundary conditions were selected from the available data, covering a representative range of operational scenarios.
Firstly, the calibration process necessitated the identification of a suitable dataset from the measurement data taken at the FSIL. The dataset selection was based on the following criteria: (1) data from all sensors need to be available for the selected period, and (2) the measured values must remain constant for approximately two hours. The most straightforward approach to meet these conditions involved conducting the calibration during the early morning hours. During this time, radiation is minimal, and the cool-down of the night is completed, ensuring relatively stable temperatures.
For the model calibration, the following data were considered: (1) internal and external air temperature, (2) duct air temperatures, (3) the ventilation machine’s percentage settings, and (4) the surface temperatures of the 10 sensor points (seven on the opaque facade surfaces and three on the window), as shown in Figure 4. The first three datasets were used to set the boundary conditions described in Section 2.3.1, and the last one was used for the comparison with the simulated values.
The optimal day and time period for calibration, satisfying the requirements of having all datasets available and maintaining constant temperatures, was determined to be 27 February 2023, from 5:00 AM to 8:00 AM. The mean air temperatures for this period, in addition to the ventilation machine operative conditions, are shown in Table 4 and were used to establish the boundary conditions for calibrating the model on the selected day.
Table 4.
Mean air temperatures used as boundary conditions for the model calibration (27 February 2023), with Tint, internal air temperature; Text, external air temperature; Tsup, temperature of the air in the supply air duct; Tret, temperature of the air in the return air duct; and Trec, temperature of the air in the recirculation air duct.
The model calibration was performed by parametrically varying the heat transfer coefficients for three surface groups—internal surfaces, external surfaces, and external cladding—in order to minimize the mean absolute error (MAE) between measured and simulated surface temperatures at all 10 control points. The examined heat transfer coefficient values are reported in Table 5. The model was considered calibrated and validated when the MAE did not exceed 0.6 K for all cases. This value is below twice the maximum expanded measurement uncertainty (2 × 0.36 K = 0.72 K), confirming that the model error remains within the range attributable to measurement uncertainty. In addition to the MAE, the mean bias error (MBE) and root mean square error (RMSE) were evaluated to detect systematic deviations and to assess the influence of individual larger deviations, respectively.
where is the measured temperature in point ; is the calculated temperature in point ; and is the total number of measurement points, equal to 10.
Table 5.
Heat transfer coefficient values considered for the model calibration.
To validate the calibrated model, three additional datasets for different operation and environmental conditions were examined. Also, for the validation, the indicators MAE, MBE, and RMSE between measured and simulated surface temperatures at the same 10 control points were used as performance metrics. In this way, the selection of the best combination of heat transfer coefficients resulting from the model calibration was validated for an additional heating case (Table 6), a cooling case (Table 7), and a case with switched-off HVAC unit (Table 8).
Table 6.
Mean air temperatures used as boundary conditions for the model validation, heating case II (14 February 2023), with Tint, internal air temperature; Text, external air temperature; Tsup, temperature of the air in the supply air duct; Tret, temperature of the air in the return air duct; and Trec, temperature of the air in the recirculation air duct.
Table 7.
Mean air temperatures used as boundary conditions for the model validation, cooling case (10 March 2023), with Tint, internal air temperature; Text, external air temperature; Tsup, temperature of the air in the supply air duct; Tret, temperature of the air in the return air duct; Trec, temperature of the air in the recirculation air duct.
Table 8.
Mean air temperatures used as boundary conditions for the model validation, switched-off ventilation machine (12 November 2022), with Tint, internal air temperature; and Text, external air temperature.
2.4. Thermal Performance Evaluation
The thermal performance of the multifunctional facade was assessed under standard heating conditions using the calibrated and validated model. To ensure that the results are independent of the specific installation in the FSIL facility, the external wooden frame of the test facility was removed from the model, and the adiabatic boundary conditions were directly applied to the lateral surfaces of the different layers which previously had been in touch with the external frame. This approach allowed for a more generic geometry to be analyzed for all subsequent studies.
In Table 9, the used standard values for the internal and external temperatures (standard ISO 15099:2003 [27]) and the standard values for the heat transfer coefficients (standard EN ISO 6946:2017 [17]) applied as boundary conditions for the standard heating case are reported.
Table 9.
Standard air temperatures and heat transfer coefficients for the standard heating case, with Tint, standard internal air temperature; Text, standard external air temperature; hint, standard internal surface heat transfer coefficient; hext, standard external surface heat transfer coefficient; and hext,clad, external surface heat transfer coefficient below the cladding.
The thermal performance at standard heating conditions of the multifunctional facade was compared with the one of a reference facade (same layout as the multifunctional facade but without ducts and without integrated HVAC unit), evaluating different operational conditions of the multifunctional facade. In particular, three different supply air temperatures (30 °C, 35 °C, and 40 °C) and an HVAC unit-off case were considered (Table 10).
Table 10.
Description of five different operational cases and facade configurations that are compared for the standard heating thermal performance analysis: three cases with activated ventilation machine at different supply air temperatures, Tsup; one with switched-off ventilation machine (VM OFF); and one for the reference facade without any ducts and no ventilation machine in it (REFERENCE).
For the evaluation of the thermal performance and comparison between different operational conditions at standard heating boundary conditions, two characteristic indicators were assessed: the internal total normal heat flux (tnHFint) and the equivalent thermal transmittance (Ueq.). The results for the different operational conditions are reported in Section 3.2.
Parametric analysis for different existing wall thermal resistances
Since the multifunctional facade is intended for retrofit applications, it may be installed on existing walls with widely varying thermal properties. Understanding how the existing wall characteristics influence the overall thermal performance is essential for accurate design predictions and energy calculations. Therefore, the analysis was extended to five discrete existing wall thermal resistance values, Rth,op,exisiting, ranging from 0.67 to 2.16 m2 K W−1 (Table 11). These thermal resistance values are representative of brick walls with thicknesses (thbrick) from 0.16 to 0.50 m with an equivalent thermal conductivity of 0.232 W m−1 K−1.
Table 11.
Different thermal resistances of the existing wall analyzed for the standard heating case.
To analyze the specific influence of the ducts and the ventilation machine, the facade surface was subdivided into characteristic areas, and an equivalent thermal transmittance was calculated for each. This approach, involving the subdivision of the facade, enables the extension of facade performance evaluation to any layout of this multifunctional facade, including various positions and paths of the air ducts.
In particular, the facade was divided into the following areas: one for the supply air duct, one for the recirculation/return air duct (same equivalent thermal transmittance is assumed because of the same duct air temperature), and finally one for the ventilation machine unit area itself. The characteristic surfaces are highlighted in Figure 9. The simulation was performed for supply temperatures of 30 °C and 40 °C and for all existing wall thermal resistances listed in Table 11.
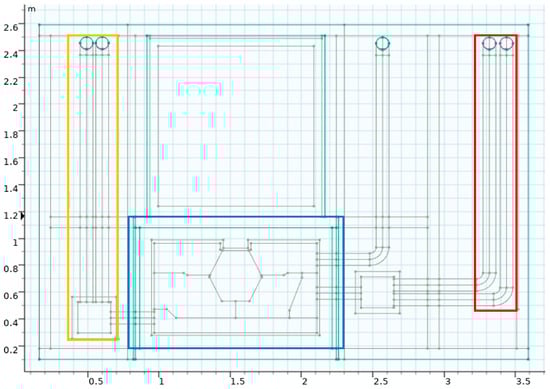
Figure 9.
Standard heating analysis characteristic surfaces: in yellow, the characteristic recirculation and return duct area; in blue, the characteristic ventilation machine area; and in red, the characteristic supply duct area.
For the passive undisturbed part of the facade, the model of the reference facade (without air ducts and ventilation machine) was used for the equivalent thermal transmittance calculation.
3. Results
3.1. Calibrated and Validated Model
The model calibration was performed using a steady-state simulation of a winter-heating case, with the boundary conditions reported in Table 4. By minimizing the MAE between measured and simulated temperatures at all 10 control points, the optimal combination of surface heat transfer coefficients was determined (Table 12).
Table 12.
Optimal combination of surface heat transfer from model calibration.
Table 13 presents the temperature results obtained using the optimal heat transfer coefficients. It can be noted that the temperature differences are limited and never exceed 0.80 K. The mean absolute error is MAE = 0.47 K (see Table 14). As in a similar study [21], this level of error was considered acceptable, and consequently, the performance model utilizing the boundary conditions specified in the Table 12 can be considered calibrated.
Table 13.
Comparison between the simulated and measured surface temperatures for calibrated model.
Table 14.
Comparison between the mean absolute error (MAE) of the calibrated model and the values for the three validation cases.
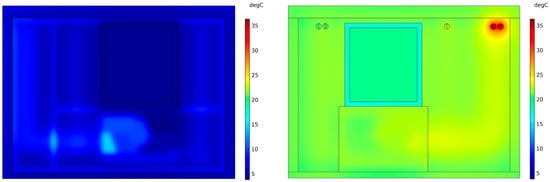
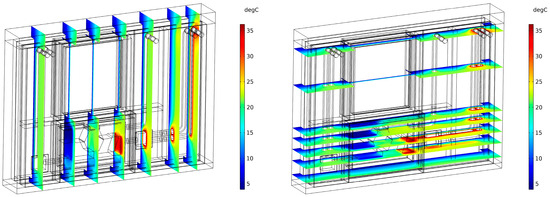
Figure 10 and Figure 11 show the simulated temperature distribution of the calibrated model: surface temperatures from external and internal views (Figure 10), and internal cross-sections (Figure 11). On the external surface (Figure 10, left), the temperature distribution is relatively uniform and consistent with the external boundary conditions, with localized warmer areas in the lower part corresponding to the HVAC unit and duct regions. On the internal surface (Figure 10, right), the temperature field is more heterogeneous: the opaque passive regions show uniform temperatures around 20–25 °C, the window area is clearly distinguishable as a cooler zone due to its lower thermal resistance, and two high-temperature spots (~35 °C) are visible in the upper-right corner, corresponding to the supply air duct outlets.
As described in Section 2.3.2, the model validation was done for three additional datasets with different operation and environmental conditions, namely an additional heating case, a cooling case, and a case with a switched-off HVAC unit. The mean absolute error for each case is reported in Table 14.
The MAE values for the validation cases are slightly higher than for the calibration case but do not exceed the acceptance threshold of 0.60 K for all cases, confirming the model validity. The MBE values are close to zero for the calibrated model (0.03 K) and the HVAC-off case (−0.05 K), indicating no systematic bias. Heating case II shows a small positive bias (0.23 K), while the cooling case exhibits a higher MBE (0.55 K), suggesting a slight systematic overprediction. This is likely related to the fact that the model was calibrated on a winter-heating case, and the heat transfer coefficients may not fully capture the boundary layer conditions during cooling operation. Nevertheless, the RMSE values remain below 0.73 K across all cases, confirming that no individual measurement point presents a critical deviation [28].
3.2. Thermal Performance at Standard Boundary Conditions
For the evaluation of the thermal performance at standard heating boundary conditions, a comparison between the internal total normal heat flux (tnHFint) and the equivalent thermal transmittance (Ueq) for five different operational conditions (see Table 10) was performed. The following results should be interpreted considering that Ueq, as defined in Section 2.1, includes the thermal effect of the active components embedded in the facade. The results are reported in Table 15.
Table 15.
Internal total normal heat flux and equivalent thermal transmittance for different facade configurations and operational conditions.
From the results reported in Table 15, it can be noticed that for the HVAC unit-off case and for the reference facade, similar results were obtained, which led to the conclusion that no additional losses due to the presence of the air-filled ducts and the ventilation machine in a switched-off case are expected. This indicates that, within the modeling framework adopted, the presence of the air-filled ducts and the switched-off ventilation machine does not introduce significant additional heat losses compared to the fully insulated reference facade. However, it should be noted that since the airflow inside the ducts was not modeled directly (see Section 2.3.1), free convection effects within the inactive air-filled ducts are not captured. Such effects could introduce additional heat transfer that would slightly increase the thermal bridging in this region. The quantification of this effect would require a conjugate heat transfer and fluid flow simulation and is beyond the scope of the present study.
When the ventilation machine is activated, an internal heat source is introduced within the facade, and the Ueq decreases to values between 0.07 and 0.11 W m−2 K−1 depending on the supply air temperature, corresponding to a reduction of 50–68% compared to the HVAC-off case. Higher supply air temperatures result in a greater heat input to the facade assembly, further reducing the Ueq from 0.11 W m−2 K−1 at Tsup = 30 °C to 0.07 W m−2 K−1 at Tsup = 40 °C.
3.3. Thermal Performance Analysis for Different Thermal Resistance Values of the Existing Wall
In Figure 12, the results for the equivalent thermal transmittance of the four different characteristic surfaces (supply, return/recirculation, ventilation machine, and passive undisturbed; see Figure 9) for the existing wall thermal resistance values between 0.67 and 2.16 m2 K W−1 are reported.
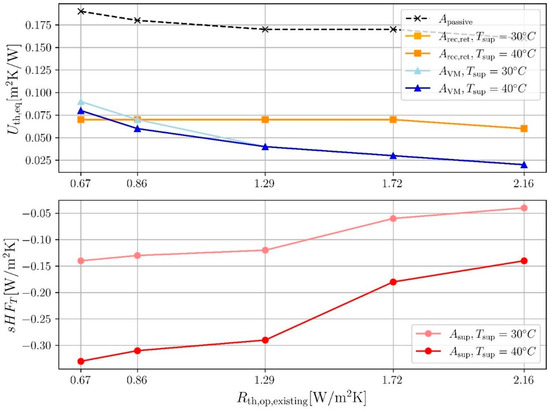
Figure 12.
Characteristic equivalent thermal transmittance (Ueq) and specific heat flux by temperature difference (sHFT) values for different thermal resistances of the existing wall, Rth,op,existing.
First, the equivalent thermal transmittance values for the supply duct area are negative. This is due to the significant heat input from the supply air duct, which results in a net heat gain to the room rather than a heat loss to the exterior. As discussed in Section 2.1, Ueq remains physically meaningful only when the facade operates as a net heat loss element. In the supply duct region, this condition is not met, and the negative Ueq values lose their conventional interpretability. Therefore, the specific heat flux by temperature difference (sHFT) is used instead to characterize this area. For the remaining characteristic areas (recirculation/return duct, HVAC unit, and passive undisturbed), the net heat flux is directed outward, and Ueq retains its physical meaning.
Second, the equivalent thermal transmittance values for the recirculation/return and HVAC unit areas are very low. This can be justified by the introduced heat gain inside the facade on these areas. However, even for the undisturbed passive characteristic area, where no gain is introduced, still a quite low thermal transmittance value is obtained. This latter ranges from 0.16 to 0.19 W m−2 K−1 depending on the existing wall thermal resistance.
Third, it can be observed that for the different typologies of characteristic areas, the simulated equivalent thermal transmittances change to different extents with the change in the existing wall thermal resistance. For example, for the supply characteristic area with 40 °C supply temperature, the specific heat flux by temperature difference varies from 0.14 to 0.33 W m−2 K−1, corresponding to a difference of 0.19 W m−2 K−1 (+136%) between the lowest and highest existing wall thermal resistance. For the recirculation/return area, the equivalent thermal transmittance varies only between 0.06 and 0.07 W m−2 K−1, a difference of 0.01 W m−2 K−1 (+17%).
Overall, the results demonstrate that the validated 3D finite element model effectively captures the thermal behavior of the multifunctional facade across different operational conditions. The characteristic equivalent thermal transmittance values obtained for the individual facade areas provide the basis for calculating the Ueq indicator, enabling direct comparison with conventional wall systems.
4. Conclusions
This study investigated the thermal performance of a prefabricated timber facade with an integrated HVAC system, designed as a minimally invasive retrofit solution for reducing the energy consumption of existing buildings. A full-scale mock-up was built and tested at the Facade System Interactions Lab (FSIL) of Eurac Research, and the experimental data were used to calibrate and validate a 3D finite element model in COMSOL Multiphysics.
The model was considered calibrated and validated after achieving a mean absolute error below 0.6 K between measured and simulated surface temperatures. The validated model was then used to assess the thermal performance under standard heating conditions for different operational scenarios.
The results show that the active multifunctional facade achieves significantly lower equivalent thermal transmittance values compared to the reference passive configuration. The best performance was obtained at the highest supply air temperature (Tsup = 40 °C; Ueq = 0.07 W m−2 K−1), due to the heat release from the supply air duct. Even with the HVAC unit switched off (Ueq = 0.22 W m−2 K−1), the performance remains comparable to the reference facade without ducts (Ueq = 0.21 W m−2 K−1), confirming that the presence of inactive ducts does not introduce additional thermal losses.
From a practical perspective, the subdivision of the facade into characteristic areas with distinct thermal behaviors enabled the definition of area-specific equivalent thermal transmittance values. This approach provides the basis for a simplified Ueq indicator that allows direct comparison with conventional wall systems, addressing a key gap in current assessment methods for active facade components. While the parametric analysis and the resulting characteristic Ueq values are specific to the analyzed facade typology and operating conditions, the proposed methodology—subdividing the facade into characteristic areas based on the influence of active components and defining area-specific thermal performance indicators—is conceptually applicable to other multifunctional facade configurations with embedded active systems. However, its transferability would need to be verified case by case, as the characteristic areas, their geometry, and the corresponding thermal behavior will depend on the specific facade layout and active system configuration.
5. Outlook
Despite their potential, multifunctional prefabricated facades present several challenges that require further investigation. Achieving compatibility with the diverse range of existing facade structures remains challenging, and inadequate detailing may lead to thermal bridging and moisture problems. These systems also require close coordination during design and installation. The integration of active components adds complexity in terms of controls, maintenance, and interaction with building services.
To address some of these challenges and extend the applicability of the thermal performance evaluation to different building configurations, a simplified calculation tool named HeTheP (heating thermal performance) was developed. The tool calculates the equivalent thermal transmittance of the multifunctional facade applied to an existing wall, accounting for the thermal resistance and geometry of the existing structure, as well as the heterogeneity of the prefabricated system, including different duct positions and layouts.
Future development of the tool will focus on enhancing functionality and usability, including the implementation of a graphical user interface, extension to other multifunctional facade configurations, and integration with established building performance calculation tools. Future research should focus on robust in situ monitoring and validated thermal models to confirm the energy savings predicted at the design stage, as well as on a systematic sensitivity analysis of the equivalent thermal transmittance to key model inputs—such as heat transfer coefficients, supply air temperature, flow rate, and duct thermal resistance.
Author Contributions
Conceptualization, S.A. and I.D.; methodology, B.M. and I.D.; software, B.M.; validation, B.M. and I.D.; data curation, B.M.; writing—original draft preparation, B.M.; writing—review and editing, I.D., G.P., S.A., M.G., D.T. and A.G.; supervision, G.P., A.G. and I.D.; project administration, S.A., M.G. and D.T. All authors have read and agreed to the published version of the manuscript.
Funding
This research and the APC were funded by the EU Horizon 2020 INFINITE project under the Grant Agreement 958397.
Data Availability Statement
The original contributions presented in this study are included in the article. Further inquiries can be directed to the corresponding author.
Acknowledgments
The work presented in this paper was conducted within the framework of the project INFINITE, funded by the EU Horizon 2020 under the Grant Agreement 958397, and was carried out as part of the master’s thesis of Barbara Messner. The authors gratefully acknowledge the constructive and productive collaboration between Eurac Research and the Free University of Bozen-Bolzano, which was instrumental in the successful completion of this study. The authors also wish to thank all collaborators at Eurac Research whose contributions and support were essential to the development of this work, in particular, Lorenzo Bonelli, Valentino Diener, Diego Menegon, and Andrea Bernardi.
Conflicts of Interest
All authors declare that the research was conducted in the absence of any commercial or financial relationships that could be construed as a potential conflict of interest.
References
- Pittau, F.; Malighetti, L.E.; Iannaccone, G.; Masera, G. Prefabrication as Large-scale Efficient Strategy for the Energy Retrofit of the Housing Stock: An Italian Case Study. Procedia Eng. 2017, 180, 1160–1169. [Google Scholar] [CrossRef]
- European Commission—Department: Energy. In Focus: Energy Efficiency in Buildings; European Commission: Brussels, Belgium, 2020. [Google Scholar]
- van Roosmalen, M.; Herrmann, A.; Kumar, A. A review of prefabricated self-sufficient facades with integrated decentralised HVAC and renewable energy generation and storage. Energy Build. 2021, 248, 111107. [Google Scholar] [CrossRef]
- Sarihi, S.; Saradj, F.M.; Faizi, M. A Critical Review of Façade Retrofit Measures for Minimizing Heating and Cooling Demand in Existing Buildings. Sustain. Cities Soc. 2021, 64, 102525. [Google Scholar] [CrossRef]
- Brunoro, S. Passive Envelope Measures for Improving Energy Efficiency in the Energy Retrofit of Buildings in Italy. Buildings 2024, 14, 2128. [Google Scholar] [CrossRef]
- Monteleone, W.; Pinotti, R.; Ochs, F.; Dermentzis, G. Hygrothermal analysis of prefabricated façades with active components for minimal invasive renovations. J. Build. Eng. 2025, 107, 112735. [Google Scholar] [CrossRef]
- Founti, M.; Avesani, S.; Elguezabal, P. Multifunctional Facades for Renovation through Industrialization. J. Facade Des. Eng. 2023, 11, V–VI. [Google Scholar] [CrossRef]
- European Parliament and Council. DIRECTIVE 2010/31/EU, 2010. Available online: https://eur-lex.europa.eu/eli/dir/2010/31/oj/eng (accessed on 29 January 2026).
- Dermentzis, G.; Ochs, F.; Siegele, D.; Feist, W. A Facade Integrated Micro-Heat Pump—Energy Performance Simulations. In Proceedings of the Fifth German-Austrian IBPSA Conference—BauSIM, Aachen, Germany, 22–24 September 2014; Available online: https://api.semanticscholar.org/CorpusID:174780102 (accessed on 13 January 2026).
- Ochs, F.; Siegele, D.; Dermentzis, G.; Feist, W. Prefabricated Timber Frame Façade with Integrated Active Components for Minimal Invasive Renovations. Energy Procedia 2015, 78, 61–66. [Google Scholar] [CrossRef]
- Ochs, F.; Monteleone, W.; Dermentzis, G.; Siegele, D.; Speer, C. Compact Decentral Façade-Integrated Air-to-Air Heat Pumps for Serial Renovation of Multi-Apartment Buildings. Energies 2022, 15, 4679. [Google Scholar] [CrossRef]
- Adamovský, D.; Vcelak, J.; Mlejnek, P.; Colon, J.; Prochazkova, Z.; Tsoutis, C.; Philippen, D.; Founti, M. Technology concepts for rapid renovation using adaptable lightweight façade systems. In Proceedings of the Clima 2022—REHVA 14th HVAC World Congress, Rotterdam, The Netherlands, 22–25 May 2022; TU Delft OPEN: Delft, The Netherlands, 2022. [Google Scholar] [CrossRef]
- Katsigiannis, E.; Gerogiannis, P.A.; Atsonios, I.; Bonou, A.; Mandilaras, I.; Georgi, A.; Papadopoulou, S.; Tsoutis, C.; Founti, M. Energy assessment of a residential building renovated with a novel prefabricated envelope integrating HVAC components. IOP Conf. Ser. Earth Environ. Sci. 2022, 1078, 012130. [Google Scholar] [CrossRef]
- Li, Y.; Chen, L. Investigation of European modular façade system utilizing renewable energy. Int. J. Low-Carbon Technol. 2022, 17, 279–299. [Google Scholar] [CrossRef]
- Evola, G.; Costanzo, V.; Urso, A.; Tardo, C.; Margani, G. Energy performance of a prefabricated timber-based retrofit solution applied to a pilot building in Southern Europe. Build. Environ. 2022, 222, 109442. [Google Scholar] [CrossRef]
- Callegaro, N.; Albatici, R. Energy retrofit with prefabricated timber-based façade modules: Pre-and post-comparison between two identical buildings. J. Facade Des. Eng. 2023, 11, 1–18. [Google Scholar] [CrossRef]
- EN ISO 6946:2017; Building Components and Building Elements—Thermal Resistance and Thermal Transmittance—Calculation Methods. International Organization for Standardization: Geneva, Switzerland, 2017.
- Gazzin, R.; De Michele, G.; Avesani, S.; Pernigotto, G.; Gasparella, A. Simulative Applications of Novel Indicators for the Characterization and Performance Evaluation of Transparent Facades. In Building Simulation Applications BSA 2024, Proceedings of the 6th IBPSA-Italy Conference, Bozen-Bolzano, Italy, 26–28 June 2024; Bozen-Bolzano University Press: Bozen-Bolzano, Italy, 2025; pp. 549–556. [Google Scholar] [CrossRef]
- Gubert, M.; Modena, R.; Tamburrini, D.; Leonardelli, N.; Fasce, E.; Miorin, F.; Stefano, A.; Demanega, I. All-in-one Industrialized Active Facade for Deep Building Retrofit: Timber Engineering Process and Performance Analysis. In Proceedings of the 14th World Conference on Timber Engineering: Advancing Timber for the Future Built Environment, WCTE 2025, World Conference on Timber Engineering (WCTE), Brisbane, Australia, 22–26 June 2025; Curran Associates, Inc.: Red Hook, NY, USA, 2025; pp. 1873–1882. [Google Scholar] [CrossRef]
- INFINITE Building Renovation Website. Available online: https://infinitebuildingrenovation.eu/ (accessed on 20 November 2025).
- Facade System Interactions Lab. Available online: https://www.eurac.edu/en/institutes-centers/institute-for-renewable-energy/pages/facade-system-interactions-lab (accessed on 3 June 2024).
- COMSOL Multiphysics®, v.5.6; COMSOL: Burlington, MA, USA, 2019. Available online: www.comsol.com (accessed on 10 January 2025).
- Taylor, J.R. An Introduction to Error Analysis, 2nd ed.; University Science Books: Melville, NY, USA, 1997. [Google Scholar]
- JCGM 100:2008; Evaluation of Measurement Data—Guide to the Expression of Uncertainty in Measurement. JCGM: Sèvres, France, 2008. Available online: https://www.bipm.org/en/doi/10.59161/jcgm100-2008e (accessed on 14 December 2025).
- García-López, C.; Álvarez-Tey, G. Evaluation of the Uncertainty of Surface Temperature Measurements in Photovoltaic Modules in Outdoor Operation. Sensors 2022, 22, 5685. [Google Scholar] [CrossRef] [PubMed]
- COMSOL. Heat Transfer Module—User’s Guide; COMSOL: Burlington, MA, USA, 2019; Available online: https://doc.comsol.com/5.5/doc/com.comsol.help.heat/HeatTransferModuleUsersGuide.pdf (accessed on 16 January 2025).
- ISO 15099:2003; Thermal Performance of Windows, Doors and Shading Devices—Detailed Calculations. International Organization for Standardization: Geneva, Switzerland, 2003.
- Baba, F.M.; Ge, H.; Zmeureanu, R.; Wang, L. Calibration of building model based on indoor temperature for overheating assessment using genetic algorithm: Methodology, evaluation criteria, and case study. Build. Environ. 2022, 207, 108518. [Google Scholar] [CrossRef]


Disclaimer/Publisher’s Note: The statements, opinions and data contained in all publications are solely those of the individual author(s) and contributor(s) and not of MDPI and/or the editor(s). MDPI and/or the editor(s) disclaim responsibility for any injury to people or property resulting from any ideas, methods, instructions or products referred to in the content. |
© 2026 by the authors. Licensee MDPI, Basel, Switzerland. This article is an open access article distributed under the terms and conditions of the Creative Commons Attribution (CC BY) license.