Abstract
To achieve the “dual carbon” goals, the management and control of the construction sector’s embodied carbon is crucial, as it is a key field of carbon emissions. This study focuses on the entire process of building structural design, construction and procurement, and building material production and trading. Based on the principles of system dynamics, it constructs a building embodied carbon analysis model consisting of three subsystems: building structural design, production, and building material market. The core elements of each subsystem and their interaction relationships are clarified, and the model variables and parameters are defined. Through multi-scenario simulation analysis, the influence mechanisms of key factors such as different building heights, seismic influence coefficients, expected project costs, and carbon reduction policies on building embodied carbon are explored. The results show that building height and seismic influence coefficients have significant impacts on material consumption during the building structural design stage, with building height exerting a more prominent driving effect; increasing the prefabrication rate can improve construction efficiency, shorten the construction period, reduce construction carbon emissions, and simultaneously balance the current pressure of rising labor costs; and carbon reduction policies guide market demand, prompting low-carbon building material manufacturers to expand R&D investment and production capacity, forming a positive cycle of “demand growth—cost reduction—market expansion”. In contrast, conventional building materials are affected by tightened carbon quotas and rising carbon prices, leading to a continuous shrinkage of their market share and gradual withdrawal from the market, ultimately realizing overall carbon reduction in the industry. The system dynamics model constructed in this study provides a scientific analysis framework for the full-process management and control of building embodied carbon, reveals the key influencing factors and evolution laws, and offers theoretical support and practical reference for the precise management and control of building embodied carbon and the formulation of carbon reduction pathways.
1. Introduction
As industrialization enters the later stage, the intensification of greenhouse gas emissions has led to growing concerns about global climate change. The Paris Agreement adopted in 2015 proposed a long-term emission reduction pathway, aiming to achieve global carbon neutrality in the second half of the 21st century [1]. In 2020, China put forward the strategic goals of “carbon peaking by 2030 and carbon neutrality by 2060”, which has promoted various industries to carry out comprehensive carbon reduction actions [2]. The industrial sector focuses on energy-saving transformation of traditional high-energy-consuming industries and clean energy substitution; the energy sector accelerates the grid connection layout of renewable energy, such as wind power and solar energy [3]; and the transportation sector promotes the popularization of new energy vehicles and the optimization of transportation structure [4]. As a key field accounting for nearly half of the national total carbon emissions, the decarbonization process of the construction sector directly affects the overall achievement of the “dual carbon” goals [5].
Carbon reduction in the construction sector has formed diversified technical pathways and research directions covering the entire life cycle. The largest proportion of carbon emissions in the construction industry comes from building material production, accounting for about 56% of the total carbon emissions in the construction industry [6]. Current research focuses on the application of green building materials [7], resource recycling [8,9], and carbon emission calculation [10]. These studies laid a theoretical and practical foundation for the future promotion and application of low-carbon building materials, as well as carbon reduction in building materials production. These carbon emission calculation methods provide a reference for future studies.
System dynamics, which is good at dealing with complex system problems with multi-factor coupling, has been widely used in carbon reduction research in the construction industry and has achieved remarkable results [11]. Ghufran et al. identified ten key enablers for the sustainable development of the construction industry, clarified the causal relationships among them, and developed a system dynamics (SD) model based on these findings. After five years of simulation, the model concluded that policy support and organizational incentive schemes are the key factors for the sustainable development of the construction industry [12]. Zhan et al. focused on precast concrete and developed a system dynamics model (SD). The research results indicate that with moderate green policy investment combined with a carbon tax, the carbon emission reduction rate can reach 7.52%. Additionally, the carbon reduction effects of technology optimization and energy structure optimization are more significant [13]. Wang et al. conducted an analysis by setting different scenarios and found that the order of carbon emission reduction effects of single policies is energy structure optimization > economic growth regulation > carbon emission policy factor adjustment > industrial structure adjustment [14]. Eissa and Adaway established an SD model with multi-source U.S. data to quantify embodied carbon mitigation [15]. Under the baseline scenario, cumulative emissions would reach 5605 MtCO2e by 2050. Floor area reduction alone yields a 38.8% reduction, and combined with circular-economy policies, the reduction reaches 45.2%, supporting evidence-based building decarbonization policies. All of these studies demonstrate the feasibility and effectiveness of system dynamics in addressing multi-factor complex issues, providing methodological and practical support for the research conducted in this paper.
Existing studies mostly focus on carbon emission accounting of individual projects or discussions on carbon emission influencing factors in isolated systems. However, fewer studies have systematically represented the cross-stage influence mechanisms targeting the entire process of building engineering design, construction, and procurement, particularly the endogenous feedback among structural design decisions; production/construction constraints; and building material market dynamics under policy interventions. Therefore, the research gap addressed in this study is the lack of an integrated dynamic modeling framework that can capture (i) how structural design parameters drive material demand, (ii) how construction strategy choices (e.g., prefabrication rate) interact with schedule and cost expectations, and (iii) how policy-driven market mechanisms feed back into material selection and embodied carbon outcomes over time.
Based on the principles of system dynamics, the research objective of this study is to construct an SD model of building embodied carbon by clarifying the core elements and interaction relationships of the three subsystems—building structural design, production/construction, and building material trading—defining variables and parameters, and simulating dynamic evolution under different scenarios.
Accordingly, this study innovatively incorporates policy-driven factors to elucidate the pivotal role of carbon reduction policies in the governance of building embodied car-bon. The core contributions of this research lie in the development of a whole-process system dynamics (SD) analytical framework that integrates the design, construction, trading, and policy subsystems through explicitly defined feedback loops and time lags. This integrated framework facilitates the identification of key driving forces and leverage points across the entire building lifecycle, moving beyond the limitations of isolated stage-wise accounting. Furthermore, it generates scenario-based empirical evidence to underpin the systematic management and prioritization of embodied carbon reduction measures, ensuring full alignment with the principles of standardized life-cycle thinking.
2. Building Embodied Carbon Analysis Model Based on System Dynamics
2.1. Mechanism of Action of the Building Embodied Carbon System
System dynamics is an interdisciplinary subject integrating system science theory and computer simulation, focusing on the study of system feedback structure and behavioral laws, and it is an important branch of system science and management science [16]. According to the dominant structure principle of system dynamics, the system structure is composed of multiple feedback loops, together with links such as logical relations, material delays, and information delays, organized hierarchically and by causal relationships. At each stage of system development, one or more feedback loops always play a dominant role. System dynamics refers to these dominant loops as dominant feedback loops. The characteristics of dominant loops, the connections between them, and their effects collectively determine the dynamic behavior and developmental trend of the entire system. This study aims to identify the composition of these feedback loops, analyze their interactive relationships, and quantitatively examine the evolutionary patterns of relevant factors.
In the research on building embodied carbon, after comprehensively considering various influencing factors, the model construction focuses on three subsystems with significant contributions and relative independence, namely the building structural design subsystem, the building material market subsystem, and the construction subsystem. The three form a dynamic interaction relationship through multiple correlations (see Figure 1). Specifically, the building structural design subsystem directly determines the project’s building material consumption according to the actual working conditions of the building project and determines the overall prefabrication level of the project in combination with the prefabrication rate requirements; the construction subsystem carries out component processing and on-site construction work in accordance with the design plan and determines the construction period accordingly; and the building material demand is closely related to the building material market subsystem. Under the guidance of carbon reduction policies, low-carbon building material manufacturers and conventional building material manufacturers will actively adapt to changes in market demand and dynamically adjust their production plans to maximize their own interests. Finally, the building material market subsystem affects the project cost in the construction subsystem by regulating the building material price, and the project cost reversely adjusts the prefabrication rate parameters of the building structural design subsystem, forming a closed-loop interaction. To simplify the complex connections within and between each subsystem, this study makes some assumptions, as shown in Table 1.
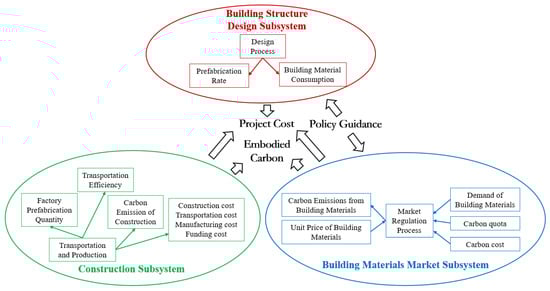
Figure 1.
Diagram of the interaction of building embodied carbon subsystems.

Table 1.
Modeling assumptions.
2.2. Causal Loop Analysis of the Building Embodied Carbon System
The first step of the SD model is to construct a causal loop diagram to show the causal relationships between various factors and explore the interactions between different factors. This study uses Vensim PLE 7.3.5 software for system dynamics modeling and simulation. Figure 2 describes the mutual influence and interaction relationships among the building structural design subsystem, production subsystem, and building material market subsystem. Arrows indicate the causal relationships between related factors, with a positive sign indicating a positive promoting effect between related variables, and a negative sign indicating an inhibitory effect.
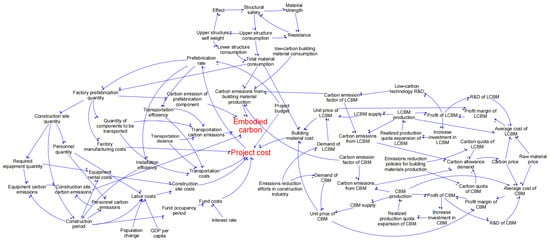
Figure 2.
Causal loop diagram of the building embodied carbon system. Note: The “+”and “−” denote positive and negative correlations respectively.
The mutual influence relationships among various factors in the building structural design subsystem are shown in Figure 3a. Firstly, based on the actual conditions of the engineering project and the given design parameters, the designer determines the initial material consumption of the superstructure and the initial material strength, and then calculates the initial self-weight of the superstructure. Secondly, using the information above, the initial load effect value and structural resistance value can be further calculated. If the load effect is greater than the structural resistance, the designer will take measures such as increasing the upper material consumption and improving the material strength to enhance the structural resistance. Increasing material consumption can significantly improve structural resistance but has little impact on the total structural weight, so that the increase range of the load effect is smaller than that of the structural resistance, making the two gradually approach until the structural resistance is greater than the load effect. Thirdly, at this stage, the material consumption of the superstructure is determined, which in turn determines the material consumption of the lower structure. Fourthly, from an economic perspective, the increase in total material consumption will lead to a rise in the budget. When there is a large deviation between the budget and the cost, the designer tends to reduce the material consumption. Finally, this iterative process is realized through three negative feedback loops and one positive feedback loop. According to the calculation results of each cycle, the component layout, structural consumption, and material strength are gradually optimized until the total material consumption reaches a steady state. The loop cycle is shown in Figure 3b.

Figure 3.
Causal loop diagram of the building design subsystem. (a) Causal diagram. (b) Loop diagram.
The construction subsystem reveals the main influencing factors of the project cost. As shown in Figure 4, firstly, with economic development and changes in population structure, labor costs on construction sites continue to rise, and improving the component prefabrication rate can reduce on-site labor costs, thereby lowering the total project cost. Secondly, this subsystem is mainly regulated by two linear causal relationships: after the designer determines the material consumption and component prefabrication rate, the constructor and the manufacturer carry out production work accordingly. Thirdly, in the process of component prefabrication and construction, a higher project prefabrication rate leads to more prefabricated components produced in the factory, less on-site construction and installation work, improved project standardization, and higher on-site installation efficiency, which reduces the number of on-site personnel and equipment required and shortens the construction period. Fourthly, the above changes reduce carbon emissions from on-site personnel, equipment, and production processes on the one hand, and they reduce labor costs, equipment costs, and capital occupation time on the other hand, ultimately achieving a reduction in the total project cost. Fifthly, in terms of prefabricated component transportation, an increase in the project prefabrication rate leads to a simultaneous rise in both transportation efficiency and transportation volume of prefabricated components, generally resulting in higher carbon emissions and transportation costs during component transportation. The transportation of raw materials is considered to be part of the building material cost. Finally, the core variable of the construction subsystem is the project cost: when the project cost exceeds the project budget, the designer needs to optimize the scheme to reduce the cost.

Figure 4.
Causal diagram of the construction subsystem.
Through this feedback process, the construction subsystem has an impact on the building structural design subsystem, and the two form a large negative feedback system. Various factors iterate with each other to control the project cost, material consumption, and prefabrication rate at a stable level.
The operation mechanism of the building material market subsystem is shown in Figure 5a. At present, pilot carbon quota systems are being carried out in the building material field. Policies dominate the market demand for low-carbon building materials and conventional building materials, and they control the carbon quotas and carbon prices of enterprises. If the carbon emissions of manufacturers exceed the corresponding carbon quotas, they need to purchase carbon emission quotas according to the excess emissions. Driven by policies, the demand for low-carbon building materials continues to grow, and their prices and production capacity fluctuate under the influence of supply and demand, making low-carbon building material manufacturers dominant in market competition; while conventional building materials are affected by policies, their demand gradually shrinks, putting them at a disadvantage in market competition, and their market share continues to decline. The final evolution result of the building material trading market is as follows: the production capacity of low-carbon building materials is significantly improved, the production cost is reduced, and the product price is lowered; the production capacity of conventional building materials is greatly reduced, and manufacturers will gradually transform to low-carbon building material production to pursue maximum profits.
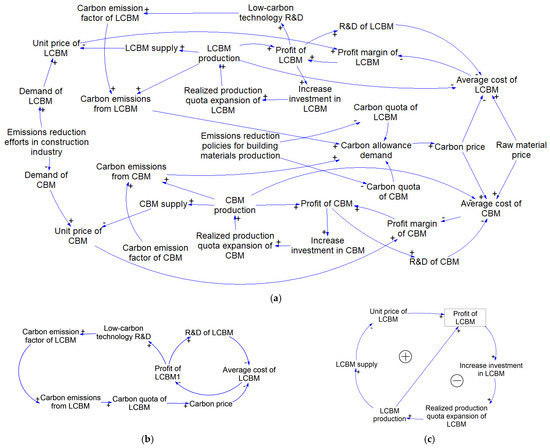
Figure 5.
Causal loop diagram of the building material market subsystem. (a) Causal diagram. (b) Loop Diagram 1. (c) Loop Diagram 2. Note: CBM refers to “conventional building materials”; LCBM refers to “low-carbon building materials”.
The building material market subsystem is mainly regulated by two parallel negative feedback systems, and the negative feedback includes a positive feedback system that achieves cost reduction and carbon reduction goals, as shown in Figure 5b.
For the low-carbon building material loop, firstly, national carbon reduction policies promote the increase in demand for low-carbon building materials and drive up their prices, thereby increasing the profit margin of low-carbon building material manufacturers. Secondly, the growth in profits encourages manufacturers to increase investment in production technology research and development, as well as carbon reduction research and development, which further reduces costs and increases profits, forming a positive feedback loop, and ultimately realizing the reduction of production costs and the increase in profits for low-carbon building material manufacturers. Thirdly, with cost reduction and market demand expansion, low-carbon building material manufacturers tend to expand production capacity rapidly, leading to a rapid increase in supply until it exceeds market demand. Fourthly, at this stage, product prices decline, and manufacturers’ profits decrease, thus inhibiting the excessive expansion of production capacity and forming a negative feedback loop. Finally, the two feedback loops jointly regulate the output and price of low-carbon building materials to maintain a relatively stable state.
Another parallel negative loop is the supply-and-demand regulation mechanism of conventional building materials. Firstly, under the guidance of national carbon reduction policies, the demand for conventional building materials declines. Secondly, to reduce losses, manufacturers tend to lower their selling prices and rapidly reduce production capacity. Thirdly, when production capacity drops below demand, prices will rebound slightly. Finally, this negative feedback process regulates the gradual and stable decline of the production capacity of conventional building materials and keeps prices stable, thus avoiding sharp fluctuations.
3. Design of the System Dynamics Model for Building Embodied Carbon
3.1. Building Structural Design Subsystem Model
This section briefly introduces the iterative calculation process in the design. With iterative optimization as the core, three types of variables are set to construct the dynamic balance between resistance and seismic load effect, so as to realize the optimal adjustment of material consumption and strength. First, the baseline values of exogenous variables are determined, including initial material consumption, initial material strength, αmax (maximum seismic influence coefficient) taken according to seismic codes, and building height set in combination with engineering practice, as the basic input for calculation. Among the state variables, the upper material consumption starts from the initial value, and it is only related to the structural system and cross-section without considering the material strength. When the structural safety factor is 1 (effect > resistance), it increases by 10 t per iteration step and stops when the safety factor is 0. The material strength represents the average strength of components; based on the initial value, it increases by 0.1 MPa per iteration step when the safety factor is 1, and it stops when the safety factor is 0. The resistance is the product of the material strength and the square of the upper consumption, and the effect is the product of the upper self-weight, αmax, and the square of the building height [17]. The structural safety factor is used as the control index. When the effect > resistance, the state variables are updated; when the effect ≤ resistance, it takes 0 and stops iteration. Currently, the parameters are the results meeting the safety requirements. The model achieves the balance between safety and consumption through dynamic iteration. Its stock-flow diagram is shown in Figure 6. It should be noted that all red-marked variables in the stock-flow diagrams can be adjusted according to specific situation. The values adopted in this study are only those selected by the authors for this illustrative example and do not imply that these values are fixed.

Figure 6.
Stock-flow diagram of the building structural design subsystem.
3.2. Construction Subsystem Model
The stock-flow diagram of the construction subsystem is shown in Figure 7. The simulation model of the construction subsystem takes the deviation between the project cost and the expected cost as the core of regulation, and it simulates the dynamic adjustment of building material consumption and component prefabrication rate, as well as the cost composition logic. Among the state variables, the building material consumption is based on the given initial value of the structural design subsystem. When the cost exceeds the expectation, the building material demand will be appropriately reduced to reflect the weak impact of the budget on the design consumption. It is assumed that the initial component prefabrication rate is 25% [18], and when the cost exceeds the expectation, the prefabrication rate will be slightly increased. The auxiliary variables are calculated around the cost composition and construction parameters: the labor cost is the product of the number of on-site personnel, the worker’s salary, and the construction period; the number of on-site personnel is estimated according to the on-site construction volume; the construction period is deduced according to the empirical formula combined with the construction volume and installation efficiency; the factory prefabrication volume is the product of the prefabrication rate and the building material consumption; and the equipment rent is calculated according to the number of equipment, the construction period, and the annual equipment rent. The on-site construction price is the sum of the labor cost and the equipment rent. The project cost is the sum of the on-site construction price, the total building material price, the capital cost, and the transportation price. The exogenous variables are set according to the actual scenario, including interest rate, expected project cost, established transportation parameters and worker’s salary.

Figure 7.
Stock-flow diagram of the construction subsystem.
3.3. Building Material Market Subsystem Model
The stock-flow diagram of the building material market subsystem is shown in Figure 8. The state variables are the production capacity growth rate, price, demand, cost reduction coefficient, carbon emission factor of low-carbon building materials, and carbon price of the two types of building materials. Among them, the production capacity is affected by investment decisions and will be appropriately expanded according to the profit margin. To reflect the lag, a 12-month delay is added [19]. When the profit is negative, the production will be reduced by 1% immediately. The price is controlled by the demand gap ratio, and the demand changes linearly driven by policies. The production costs of both types of building material manufacturers will continue to decline due to product R&D, and the carbon emission factor of low-carbon building materials will also decline [20]. The carbon price rises when there is a carbon quota gap, and it remains unchanged when there is no gap. The rate variables mainly include the demand gap ratio and investment decisions. Among them, the demand gap ratio is determined according to the supply-and-demand relationship, and the investment decision is the ratio of profit to revenue, which determines the growth rate of production capacity. The auxiliary variables include the total production capacity of the two types of building materials, which is the product of the growth rate and the initial production capacity; the revenue is calculated as “the minimum value of price × production capacity/demand”; the average cost integrates fixed costs, technical cost reduction, and carbon costs; the profit is the difference between revenue and total costs; and carbon emissions, carbon quota gap, and carbon costs are converted according to the corresponding logic, which determines the carbon cost of building material production. The exogenous variables are determined based on actual data.

Figure 8.
Stock-flow diagram of the building material market subsystem.
4. Simulation Result Analysis of the Building Embodied Carbon System
Based on the stock-flow diagram, different analysis scenarios are set to analyze the impact of control factors on the building embodied carbon system, and explore the impact of design, production, and carbon market on building material embodied carbon.
4.1. Simulation Analysis of the Building Structural Design Subsystem
To verify and demonstrate the rationality and effectiveness of the system, five simulation scenarios are constructed in this section, as shown in Table 2. It can be found from the stock-flow diagram that the main influencing factors in the building structural design subsystem are the building height and the maximum seismic influence coefficient, αmax. Taking a steel-frame structure as an example, the initial material consumption (actually the material consumption of the upper structure) is set to 1000 t [21], and the initial material strength is the minimum strength design value of Q355 steel, 270 MPa [22]. The following scenarios are set to analyze the impact of the above two key factors on material consumption and material strength. It should be noted that the variables in this simulation case are not functions related to time, but functions related to the number of iterative calculations. Therefore, only the final results of the iterative calculations are given, and the intermediate process is not shown.
Table 2.
Scenarios of the building structural design subsystem.
The simulation results are shown in Table 3. The increase in building height has a more significant impact on material consumption and material strength, which is consistent with the actual situation, verifying the rationality of the simulation process.
Table 3.
Simulation results of the building structural design subsystem under different scenarios.
4.2. Simulation Analysis of the Construction Subsystem
In actual engineering construction projects, most of the costs are concentrated in the on-site construction link, and the core cost of on-site construction is the labor cost. With the economic and social development of China and the change in population age structure, the labor cost has increased significantly, which in turn affects the project cost. The key influencing factor of the construction subsystem is the expected project cost, which changes the component prefabrication rate, thereby acting on the project construction period and operation cost to achieve cost reduction. To reflect this process, four different labor cost scenarios are set, as shown in Table 4, to analyze how to determine the component prefabrication rate to control the project cost at the target level when the labor cost continues to increase. The building material demand is set according to the baseline scenario of the building structural design subsystem. The upper structure is steel (fixed consumption of 1852 t, unit price referring to the current market average price of about 3300 yuan/t), and the lower structure is concrete (consumption of 555 t, equivalent to 250 m3, unit price referring to the current market average price of about 300 yuan/m3).
Table 4.
Scenarios of the construction subsystem.
The simulation results are shown in Table 5. With the increase in labor cost, the component prefabrication rate needs to be appropriately increased to control the project cost. The increase in prefabrication rate can improve the on-site construction efficiency, shorten the construction period, and significantly reduce the on-site construction cost and capital cost. At the same time, the transportation price does not increase significantly. Although the cost of prefabricated components produced by the factory increases, the overall project cost does not change significantly.
Table 5.
Simulation results of the construction subsystem under different scenarios.
4.3. Simulation Analysis of the Building Material Market Subsystem
For the building material market subsystem, the main driving factor is the market demand for low-carbon building materials driven by policies. First, the rationality of the model is verified with the baseline state. The values and basis of some exogenous variables in the model are shown in Table 6.
Table 6.
Initial values of exogenous variables in the building material trading subsystem.
Assumptions for other key variables:
1. National policies encourage enterprises to use low-carbon building materials, leading to a gradual increase in the demand for low-carbon building materials by 4000 tons per month, and a gradual decrease in the demand for conventional building materials by 3000 tons per month.
2. Affected by national carbon reduction policies, the initial carbon quota of low-carbon building material manufacturers is 560,000 tons, and the monthly carbon quota will decrease by 4000 tons, while the minimum carbon quota for low-carbon enterprises is 20,000 tons. The initial carbon quota of conventional building material manufacturers is 9.6 million tons. The monthly carbon quota will decrease by 8000 tons, and the minimum carbon quota for conventional building material manufacturers is 100,000 tons.
Based on the above information, the simulation calculation is carried out with a simulation time of 360 months (30 years). The main variables concerned are the price, demand, and production capacity of the two types of building materials, as well as the revenue, profit, carbon emission, average cost, and carbon price changes in the two types of building material manufacturers.
4.3.1. Output Evolution Characteristics
The demand and production capacity evolution curves of the two types of building materials are shown in Figure 9, which generally present the dynamic law of “demand guidance—production capacity adaptation—market balance”. For low-carbon building materials, the demand is greater than the production capacity in the initial stage, and the revenue is positive. Manufacturers tend to expand production capacity, but due to the 12-month lag effect of production capacity construction, the production capacity grows slowly in the initial stage; after 12 months, the production capacity increases significantly and exceeds the demand, and then the production capacity growth slows down due to the decline in profits, gradually matching the market demand.

Figure 9.
Simulation results of demand and production capacity of the two types of building materials. Note: M refers to 106.
For conventional building materials, there is still a certain profit margin in the initial stage, and manufacturers expand production slightly; when the profit drops to zero, manufacturers start to reduce production. The cost reduction after production reduction brings a short-term profit recovery, which in turn leads to phased expansion, resulting in a fluctuating downward trend of production capacity; after 240 months, the carbon quota of conventional building materials drops to the minimum threshold, and the carbon cost increases significantly, entering a vicious cycle of “cost increase—profit decline—production reduction—further cost increase”. Unless manufacturers transform to low-carbon production, it will be difficult to sustain operations.
From the perspective of market structure, the total output of the two types of building materials has steadily increased over 30 years. The market share of conventional building materials has dropped from 90% initially to 60%, and the market share of low-carbon building materials has risen from 10% to 40%, which is in line with the policy orientation and market laws of the low-carbon transformation of the building materials industry, verifying the rationality of the simulation results.
4.3.2. Price Evolution Characteristics
The price and average cost evolution curves of the two types of building materials are shown in Figure 10, presenting significant differentiated characteristics. For low-carbon building materials, the demand far exceeds the supply in the initial stage, and the price rises rapidly, reaching a peak of 4500 yuan after 16 months; then the price declines slowly due to overcapacity, dropping to 2600 yuan after 360 months. On the cost side, it benefits from three driving factors: the decrease in average cost brought by the economies of scale of production capacity, the reduction in production cost driven by production technology R&D, and the decrease in carbon cost brought by carbon reduction R&D, ultimately achieving continuous cost reduction over 30 years, fully reflecting the supporting role of technological progress in the low-carbon industry.

Figure 10.
Simulation results of price and average cost of the two types of building materials.
For conventional building materials, affected by the continuous shrinkage of demand, the price generally shows a downward trend, with phased recovery due to production capacity adjustment; after 270 months, the price of conventional building materials exceeds that of low-carbon building materials, losing market competitiveness. Although the cost side decreases due to production R&D in the early stage, affected by factors such as the weakening of economies of scale caused by production capacity reduction and the increase in carbon cost brought by tightened carbon quotas, the cost stops declining and rebounds after 240 months, highlighting the sustainability crisis of backward production capacity.
4.3.3. Revenue and Profit Evolution Characteristics
The revenue changes in the two types of building material manufacturers are highly correlated with the output evolution (as shown in Figure 11). With the continuous expansion of production capacity, low-carbon building materials have maintained a steady increase in revenue driven by the substantial growth in total output, despite the simultaneous decline in price and unit cost; meanwhile, conventional building materials have shown a steady downward trend in revenue due to the fluctuating downward output. The shrinkage of market share directly leads to the reduction of their revenue scale, further weakening their market competitiveness.
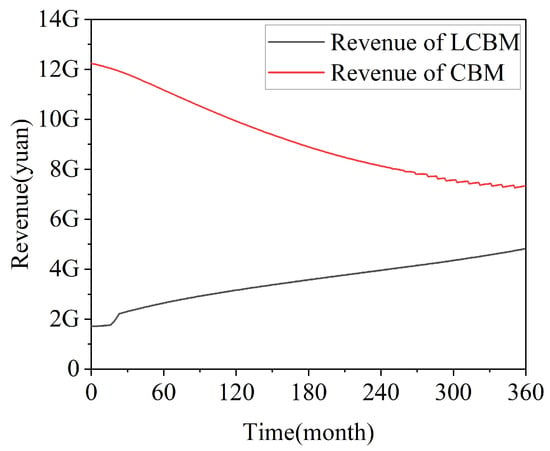
Figure 11.
Simulation results of revenue of the two types of building material manufacturers. Note: G refers to 109.
The profit evolution shows an obvious differentiation trend (as shown in Figure 12). The profit of low-carbon building materials increases significantly within the initial 15 months, then drops significantly due to overcapacity, and then enters a fluctuating upward channel due to continuous cost reduction and production capacity optimization, with overall profitability continuously improving. The profit of conventional building materials shows large fluctuations with a continuously decreasing average value, and the fluctuation range narrows after 270 months; except for the short-term profit advantage in the initial 12 months due to market dominance, the profit is lower than that of low-carbon building materials in other periods. The core reasons are the multiple pressures of shrinking demand, low profit margin, and increasing carbon cost.

Figure 12.
Simulation results of profit of the two types of building material manufacturers. Note: M refers to 106.
4.3.4. Carbon Emission Evolution Characteristics
The total carbon emission evolution of the two types of building materials is shown in Figure 13, generally showing a significant downward trend, which is in line with the expectation of carbon reduction policies. Due to the continuous decline in output, the carbon emissions of conventional building materials decrease synchronously; although the production capacity of low-carbon building materials expands significantly, the carbon emissions remain at a low level due to the reduction of carbon emission factors brought by carbon reduction technology R&D. Within the 30-year cycle, the overall carbon emissions of the building materials industry have been significantly reduced, verifying the effectiveness of the low-carbon transformation path of “policy guidance—market drive—technology empowerment”.

Figure 13.
Simulation results of carbon emissions of the two types of building materials. Note: M refers to 106.
Through the above building material-carbon market simulation model, a sound system is constructed in which policies drive demand, demand dominates supply and price, and revenue and profit drive transformation, ultimately achieving the goals of increasing the market share and profit of low-carbon building materials, reducing carbon emissions, and gradually eliminating high-carbon emission production, thereby providing quantitative support for the low-carbon transformation of the building materials industry.
5. Discussion
This study constructs a system dynamics model of building embodied carbon covering structural design, construction, and building material market subsystems, and explores key influencing factors via multi-scenario simulation. The results show that building height and seismic influence coefficients significantly drive structural design-stage material consumption, with building height exerting a more prominent effect; raising prefabrication rate balances rising labor costs and cuts construction carbon emissions while stabilizing project costs; and carbon reduction policies boost low-carbon building material demand, forming a “demand-R&D-cost-market” positive cycle, while conventional building materials shrink gradually under carbon quota and price pressures, realizing industrial carbon reduction.
Our findings align with existing research: Ghufran et al. [12] and Zhan et al. [13] verified policy and prefabrication’s carbon reduction effects, and this study further quantifies their dynamic adjustment mechanisms and cross-stage transmission paths. Different from single-stage or isolated system analysis in prior studies [6,10], this research builds an integrated dynamic framework, clarifying endogenous feedback between design parameters, construction strategies, and market mechanisms, making the analysis more systematic.
This study has several limitations. First, all subsystems in the model are constructed as mechanism-based and stylized representations, rather than detailed empirical replicas of real-world systems. The model is designed to reveal the directional mechanisms through which policy variables form reinforcing and balancing loops via price, profit, investment, capacity, and technological progress, rather than to generate highly precise quantitative predictions for a specific region or sector. In line with the validation logic of system dynamics, it should be emphasized that the purpose of the model determines the appropriate level of validation rigor and data requirements. Therefore, the results should be interpreted as behavioral tendencies and policy insights, rather than exact forecasts.
Targeted optimizations can be adopted: expand design factor scope, revise assumptions with actual market characteristics, add heterogeneous scenario simulation, and incorporate a waste recycling subsystem to form a full-life cycle model.
Future research can extend to different building types and regions, combine BIM and big data to build a digital twin model of embodied carbon, conduct empirical verification with actual projects, and explore the impact of global building material supply chains on embodied carbon to provide more precise support for the construction industry’s dual-carbon goals.
6. Conclusions
Based on the system dynamics method, this study focuses on three core links: building structural design, production, and building material market. First, it conducts a causal loop analysis of the key influencing factors of building embodied carbon, and then it constructs a building embodied carbon analysis model including three subsystems, building structural design, production, and building material market, deeply revealing the influence mechanisms and evolution laws of embodied carbon in each link. The main conclusions are as follows:
(1) The key engineering parameters in the building structural design link directly dominate the building material consumption, which is the source of embodied carbon management and control. The analysis taking building height and the maximum seismic influence coefficient as examples shows that the building material consumption increases with the increase in both, and the driving effect of building height on the building material consumption is more significant.
(2) In the production link, improving the prefabrication rate is the core way to balance cost and emission reduction. With the annual increase in labor cost, the cost pressure of the traditional on-site construction mode continues to increase. Improving the prefabrication rate can improve the construction efficiency and shorten the construction period through factory standardized production, thereby reducing the on-site labor and equipment investment. At the same time, the growth rate of transportation cost of prefabricated components is controllable, and the overall dual goals of stable project cost and reduced carbon emissions are achieved, which is in line with the economic and environmental benefit demands of engineering construction.
(3) The transformation and evolution of the building material market link are jointly driven by carbon reduction policies and market mechanisms. Carbon reduction policies guide changes in demand structure, making the market demand for low-carbon building materials continue to grow; encouraging manufacturers to increase R&D investment and expand production capacity; and thereby promoting the reduction of production costs and product prices, forming a positive cycle of “demand growth—R&D upgrading—cost reduction—market expansion”. In contrast, conventional building materials are subject to multiple pressures of shrinking demand, tightened carbon quotas, and rising carbon prices, gradually losing their cost advantage, with continuous shrinkage of market share, and finally gradually withdrawing from the market, promoting the overall low-carbon transformation of the building materials industry.
As this study involves reasonable assumptions in the research process, the results may differ somewhat from real situations. Nevertheless, the regularities revealed in this study are constructive. The conclusions clarify the importance of policy-driven carbon reduction in the construction industry and also provide a reference for calculating carbon emissions in construction and building material manufacturing from the perspective of system dynamics.
Author Contributions
Conceptualization, H.Z.; methodology, H.Z.; formal analysis, L.G.; writing—original draft preparation, L.G.; writing—review and editing, Y.Z. All authors have read and agreed to the published version of the manuscript.
Funding
This research was funded by the Shanghai Rising-Star Program of the Shanghai Municipal Science and Technology Commission (23QB1400700).
Data Availability Statement
Dataset available upon request from the authors.
Conflicts of Interest
Authors Leming Gu and Haoyan Zhu were employed by the company East China Architectural Design & Research Institute Co., Ltd. The remaining author declares that the research was conducted in the absence of any commercial or financial relationships that could be construed as a potential conflict of interest.
References
- Walsh, B.; Ciais, P.; Janssens, I.A.; Janssens, I.A.; Peñuelas, J.; Riahi, K.; Rydzak, F.; van Vuuren, D.P.; Obersteiner, M. Pathways for balancing CO2 emissions and sinks. Nat. Commun. 2017, 8, 14856. [Google Scholar] [CrossRef]
- He, J.; Li, Z.; Zhang, X.; Wang, H. Towards carbon neutrality: A study on China’s long-term low-carbon transition pathways and strategies. Environ. Sci. Ecotechnol. 2022, 9, 100134. [Google Scholar] [CrossRef] [PubMed]
- Liddle, B. To What Extent Do Alternative Energy Sources Displace Coal and Oil in Electricity Generation? A Mean-Group Panel Analysis. Sustainability 2024, 16, 5319. [Google Scholar] [CrossRef]
- Xiang, X.; Peng, T.; Du, E. Assessing decarbonization benefits of transport electrification: A provincial perspective in China. eTransportation 2025, 27, 100529. [Google Scholar] [CrossRef]
- Xia, Y.; Yang, Z.; Jiang, X.; Wang, H. The road to carbon neutrality in China’s building sector. Iscience 2024, 27, 110664. [Google Scholar] [PubMed]
- Li, C.; Pradhan, P.; Chen, G.; Kropp, J.P.; Schellnhuber, H.J. Carbon footprint of the construction sector is projected to double by 2050 globally. Commun. Earth Environ. 2025, 6, 831. [Google Scholar] [CrossRef]
- Agrela, F.; Rosales, M.; Alonso, M.L.; Ordóñez, J.; Cuenca-Moyano, G.M. Life-Cycle Assessment and Environmental Costs of Cement-Based Materials Manufactured with Mixed Recycled Aggregate and Biomass Ash. Materials 2024, 17, 4357. [Google Scholar] [CrossRef]
- Jiang, B.; Huang, H.; Ge, F.; Huang, B. Carbon Emission Assessment During the Recycling Phase of Building Meltable Materials from Construction and Demolition Waste: A Case Study in China. Buildings 2025, 15, 456. [Google Scholar] [CrossRef]
- Nian, T.; Li, Y.; Jin, X.; Wang, Z. Toward Carbon Balance in Life Cycle: The Carbon Emission Assessment for the Recycled Coarse Aggregate Concrete. Adv. Civ. Eng. 2025, 2025, 9184976. [Google Scholar] [CrossRef]
- Liang, Y. Low-Carbon Pathways for Solid Waste Resource Utilization in High-performance Building Materials. Environ. Resour. Ecol. J. 2025, 9, 148–155. [Google Scholar] [CrossRef]
- Dai, T.; Wang, J. Dynamic Simulation for Carbon Emissions of the Entire Building Industry Chain Based on System Dynamics. Adv. Manag. Appl. Econ. 2025, 15, 209–246. [Google Scholar] [CrossRef]
- Ghufran, M.; Khan, K.I.A.; Ullah, F.; Nasir, A.R. Circular Economy in the Construction Industry: A Step towards Sustainable Development. Buildings 2022, 12, 1004. [Google Scholar] [CrossRef]
- Zhan, Z.; Wu, J.; Xia, P.; Hu, Y. Toward Low-Carbon and Cost-Efficient Prefabrication: Integrating Structural Equation Modeling and System Dynamics. Sustainability 2025, 17, 8307. [Google Scholar] [CrossRef]
- Wang, X.; Qu, L.; Wang, Y.; Xie, H. Dynamic Scenario Predictions of Peak Carbon Emissions in China’s Construction Industry. Sustainability 2023, 15, 5922. [Google Scholar] [CrossRef]
- Eissa, R.; El-Adaway, I.H. Circular Economy Policies for Decarbonization of US Commercial Building Stocks: Data Integration and System Dynamics Coflow Modeling Approach. J. Manag. Eng. 2023, 40, 04024003. [Google Scholar] [CrossRef]
- Forrester, J.W. Industrial Dynamics: A Major Breakthrough for Decision Makers. Harv. Bus. Rev. 1958, 36, 37–66. [Google Scholar]
- Clough, R.W.; Penzien, J. Dynamics of Structures, 2nd ed.; McGraw-Hill: New York, NY, USA, 1993. [Google Scholar]
- Wang, S.; Sinha, R. Life Cycle Assessment of Different Prefabricated Rates for Building Construction. Buildings 2021, 11, 552. [Google Scholar] [CrossRef]
- Boafo, F.E.; Kim, J.-H.; Kim, J.-T. Performance of Modular Prefabricated Architecture: Case Study-Based Review and Future Pathways. Sustainability 2016, 8, 558. [Google Scholar] [CrossRef]
- Althoey, F.; Ansari, W.S.; Sufian, M.; Deifalla, A.F. Advancements in low-carbon concrete as a construction material for the sustainable built environment. Dev. Built Environ. 2023, 16, 100284. [Google Scholar] [CrossRef]
- Burchart-Korol, D. Life cycle assessment of steel production in Poland: A case study. J. Clean. Prod. 2013, 54, 235–243. [Google Scholar] [CrossRef]
- GB 50017-2017; Standard for Design of Steel Structures. China Architecture and Building Press: Beijing, China, 2017.
- Song, X.; Du, S.; Deng, C.; Shen, P. Carbon emissions in China’s steel industry from a life cycle perspective: Carbon footprint insights. J. Environ. Sci. 2025, 148, 650–664. [Google Scholar] [CrossRef]
- Iron and Steel Whole Industry Chain EPD Platform. Available online: https://www.cisa-epd.com/ (accessed on 22 August 2025).
- Yang, L.; Hu, H.; Yang, S.; Wang, S. Life cycle carbon footprint of electric arc furnace steelmaking processes under different smelting modes in China. Sustain. Mater. Technol. 2023, 35, e00564. [Google Scholar] [CrossRef]
- Qiao, Y.; Wang, G. Recent Status of Production, Administration Policies, and Low-Carbon Technology Development of China’s Steel Industry. Metals 2024, 14, 480. [Google Scholar] [CrossRef]
- Price Changes of Important Production Means in Circulation Field in Late August 2025. Available online: https://www.stats.gov.cn/zwfwck/sjfb/202509/t20250903_1961000.html (accessed on 30 August 2025).
- Price Changes of Important Production Means in the Circulation Field in Late October 2025. Available online: https://www.stats.gov.cn/xxgk/sjfb/zxfb2020/202511/t20251103_1961784.html (accessed on 30 October 2025).
- Liu, X.; Niu, D.; Bao, C.; Suk, S.; Sudo, K. Affordability of energy cost increases for companies due to market-based climate policies: A survey in Taicang, China. Appl. Energy 2013, 102, 1464–1476. [Google Scholar] [CrossRef]


Disclaimer/Publisher’s Note: The statements, opinions and data contained in all publications are solely those of the individual author(s) and contributor(s) and not of MDPI and/or the editor(s). MDPI and/or the editor(s) disclaim responsibility for any injury to people or property resulting from any ideas, methods, instructions or products referred to in the content. |
© 2026 by the authors. Licensee MDPI, Basel, Switzerland. This article is an open access article distributed under the terms and conditions of the Creative Commons Attribution (CC BY) license.