Abstract
Achieving sustainability in prefabricated construction necessitates a balance between operational efficiency and stringent environmental constraints. However, cascading rework chains triggered by assembly defects frequently disrupt this equilibrium. Existing literature predominantly addresses this dynamic through reactive rescheduling, thereby largely overlooking the potential of proactive topological interception. To bridge this gap, this study proposes a proactive bi-level scheduling framework that mathematically integrates strategic quality inspection planning with operational low-carbon project execution. Specifically, a Generalized Total Cost (GTC) model is formulated to internalize multi-objective trade-offs—including time, cost, and carbon emissions—into a unified financial metric through market-based shadow prices. This framework is operationalized through a novel bi-level Hybrid Evolutionary Algorithm (H-TS-CDBO). By combining the global exploration capabilities of Chaotic Dung Beetle Optimization with the local refinement mechanisms of Tabu Search, the proposed solver is specifically engineered to navigate the topological ruggedness induced by proactive inspection interventions. Empirical benchmarking validates the computational robustness of the solver, while an illustrative case study substantiates a critical managerial paradigm shift from “passive remediation” to “active prevention”: compared to traditional methods, a marginal preventive investment of 5.4% functions as an effective containment mechanism, yielding a 40.8% net reduction in the GTC. Furthermore, a sensitivity analysis regarding varying static carbon tax rates simulates algorithmic adaptation under diverse regulatory intensity thresholds, delineating an actionable pathway for project managers to achieve lean, low-carbon synergy amidst evolving regulatory pressures.
1. Introduction
1.1. Industrial Background and Research Motivation
Driven by the technological surge of Industry 4.0, prefabricated construction is rapidly establishing itself as the cornerstone of the modern building sector. This shift represents more than a mere technological upgrade; it is a fundamental structural evolution that capitalizes on inherent efficiency and sustainability by relocating operations from the unpredictable, stochastic conditions of traditional job sites to the precision of controlled factory settings [1,2]. Within this industrialized framework, the capacity for “flexible production”—which allows for the dynamic adjustment of component specifications—has been instrumental in accelerating project delivery cycles. However, practical observation suggests that this agility comes at a steep price: it places an immense, often underappreciated burden on resource scheduling and process sequencing, turning logistical precision into a critical operational bottleneck [3].
Yet, internal logistical efficiency is no longer the sole determinant of success. The sector is currently maneuvering through a tightening maze of regulatory headwinds, specifically those stemming from global “Dual Carbon” targets and “Green Manufacturing” mandates [4]. Since prefabrication inherently relies on energy-intensive mechanized processes, carbon accounting has transitioned from a peripheral indicator to a binding hard constraint within green evaluation systems. This evolution forces us to confront a critical dilemma: how do we reconcile the necessary agility of flexible production with the rigid, non-negotiable limitations of emission caps? Resolving this conflict—especially when compounded by the inherent uncertainties of construction—demands integrated solutions that can effectively bridge the widening gap between theoretical models and real-world industrial applications.
Compounding this dilemma is the trade-off between speed and quality. While flexible scheduling theoretically enhances prefabrication efficiency, in practice it entails a critical trade-off: accelerated project schedules often compromise quality assurance. High-density parallel operations, designed to expedite delivery, frequently introduce structural vulnerabilities—such as component misalignment or hoisting deviations—that propagate downstream [5]. This phenomenon, termed the “rework cascade,” precipitates compounded negative externalities: beyond direct schedule delays, it escalates material waste and energy consumption, leading to actual carbon emissions that significantly exceed baseline projections [6,7].
Conversely, excessive risk-aversion strategies, characterized by redundant inspections or inflated safety buffers, are equally suboptimal. Such over-conservatism results in resource idleness and diminished equipment utilization rates. Paradoxically, this operational inefficiency inflates both total costs and carbon footprints, driven by prolonged project durations and sustained holding costs. Consequently, the central managerial challenge lies in identifying an optimal equilibrium that minimizes rework risk without incurring the opportunity costs of overly cautious prevention measures.
1.2. Literature Review and Critical Gaps
A retrospective review of the literature reveals a specific gap in the triadic trade-offs among “time, risk, and emissions.” Conventional methodologies, notably the Critical Path Method (CPM), predominantly prioritize mono-objective optimization, typically treating rework as an isolated stochastic event and carbon emissions as static deterministic parameters [8,9,10]. While academic research has evolved toward multi-objective optimization—such as Song et al. [11] utilizing interval grey GERT networks and Guo et al. [12] identifying efficiency windows for prefabrication rates—a unified framework to simultaneously quantify these coupled factors remains elusive. Although recent studies by Zhang et al. [13] and Verma et al. [14] have advanced green rescheduling and mixed combinatorial optimization, they largely focus on external disruptions.
A significant oversight persists regarding the handling of internal quality risks. Current literature largely fails to incorporate mechanisms for intercepting “internal risks”—specifically endogenous quality defects—before they propagate into severe cascading failures [15]. While Aramesh et al. [16] and Peng et al. [17] have highlighted the “duration–cost–sustainability” nexus and the environmental cost of rework, existing decision-making frameworks rarely integrate active mitigation strategies. Specifically, the treatment of proactive inspection as a decision variable remains critically underinvestigated. Although advanced techniques like the Design Structure Matrix (DSM) [18] and dynamic rework subnets [19] have been employed to track topological evolutions, prevailing solutions predominantly favor “reactive remediation” over “proactive prevention.” This reactive paradigm lacks a rigorous mechanism to optimize the allocation of inspection resources, thereby failing to sever rework propagation chains at their inception. Consequently, a theoretical framework that advances beyond these rework-based approaches to optimize the Generalized Total Cost (GTC) remains absent.
Navigating the highly nonlinear trade-off among prevention, failure risks, and low-carbon objectives necessitates a scheduling algorithm that rigorously balances global exploration with local exploitation. In this context, the Dung Beetle Optimizer (DBO), a bio-inspired meta-heuristic introduced by Xue et al. [20], has demonstrated rapid convergence across diverse engineering applications. However, the standard DBO architecture suffers from inherent limitations, most notably insufficient population diversity, which predisposes the solver to stagnation in local optima. To mitigate this deficiency, scholars such as Hu et al. [21] and Liu et al. [22] have augmented the escape capabilities of the algorithm by integrating chaotic mapping initialization and adaptive T-distribution perturbation strategies.
Nevertheless, the computational challenge extends beyond mere parameter calibration; the proactive insertion of preventive checkpoints induces fundamental topological shifts that render traditional static fixed-length encoding schemes ineffective. In response to this dynamic complexity, recent scholarship has pivoted toward adaptive network architectures. For instance, Duane et al. [23] developed a flexible network structure capable of accommodating variable node configurations. Building upon this foundation, Li et al. [24] and Gu et al. [25] introduced hybrid algorithmic strategies that significantly enhance solution precision for such complex engineering optimization problems.
1.3. Proposed Methodology and Contributions
To address these computational deficiencies and the lack of proactive risk management, this study proposes the Low-Carbon Project Scheduling Model (LC-RC-GTC). This framework integrates Quality Inspection (QI), Rework Cascades (RC), and Generalized Total Cost (GTC) into a cohesive mathematical formulation. To implement this model, we employ the H-TS-CDBO algorithm, which synergizes Tabu Search (TS) with a Chaotic Dung Beetle Optimizer (CDBO). Central to this approach is a dynamic “macro-activity”-encoding mechanism that rigorously decouples discrete decision variables from continuous-time scheduling. The main contributions of this work are summarized as follows:
- Establishment of the Coupled “Risk–Cost–Low-Carbon” Framework: We propose the LC-RC-GTC model to address endogenous quality risk transmission—a critical factor frequently overlooked in extant scheduling literature. By integrating a pre-emptive prevention mechanism, this framework quantifies the nonlinear dynamics governing prevention expenditure, failure liability, and project duration, transitioning the determination of the “optimal prevention threshold” from subjective empirical estimation to rigorous quantitative decision support.
- Development of the Adaptive H-TS-CDBO Algorithm: To navigate the high-dimensional irregularity and topological shifts induced by rework cascades, we engineered a hybrid architecture synergizing Tabu Search with a Chaotic Dung Beetle Optimizer. Distinguished by its dynamic “macro-activity” encoding, this approach transcends the rigidity of traditional heuristics to decouple discrete decision variables from continuous scheduling constraints effectively. Empirical benchmarking confirms that this structure delivers superior convergence and robustness for large-scale Resource-Constrained Project Scheduling Problems (RCPSPs).
- Elucidation of “Active Prevention” and “Policy Response” Mechanisms: Empirical analysis uncovers a high-leverage managerial insight: a marginal strategic investment of 5.4% in inspection resources effectively mitigates significant downstream failure losses, yielding a 40.8% reduction in Generalized Total Cost (GTC). Furthermore, the study maps the adaptive migration of inspection strategies in response to fluctuations in carbon pricing, establishing a robust quantitative paradigm that harmonizes emission-reduction targets with schedule stability.
1.4. Paper Organization
The remainder of this paper is structured as follows. Section 2 formulates the mathematical model, explicitly defining the double-trigger interception mechanism and the bi-level GTC objective function. Section 3 presents the proposed H-TS-CDBO algorithm, with particular emphasis on the macro-activity-encoding strategy and the hybrid search logic tailored for topological variations. Section 4 details comprehensive numerical experiments conducted to validate the convergence and robustness of the algorithm in comparison with conventional meta-heuristics. Section 5 applies the framework to a real-world prefabricated construction project and analyzes the managerial implications derived from the empirical results. Finally, Section 6 concludes the study by summarizing key findings, acknowledging limitations, and outlining directions for future research.
2. Problem Description and Model Formulation
2.1. Problem Description and System Boundaries
This study addresses the complex scheduling challenges inherent in prefabricated construction (PC), a domain characterized by the rigorous integration of off-site manufacturing, logistics, and on-site assembly [26]. Unlike traditional cast-in situ methods, PC projects rely on stringent assembly sequences where the dimensional precision of upstream components strictly constrains downstream tasks. Recent scholarship highlights that the operational efficiency of this system is frequently compromised by quality uncertainty, particularly in concealed works and critical connection nodes [27,28]. Consequently, this study formulates a generalized Resource-Constrained Project Scheduling Problem (RCPSP) that explicitly incorporates these engineering characteristics and their associated environmental externalities.
To contextualize the rework cascade phenomenon modeled in this research, we consider a typical vertical assembly cycle in shear wall structures: Shear Wall Hoisting → Sleeve Grouting → Floor Slab Installation [29]. In engineering practice, the sleeve grouting process is critical for structural integrity but prone to latent defects, such as insufficient slurry fullness or air voids, due to operational errors [30]. If such a defect evades early detection and is identified only after the subsequent floor slabs have been hoisted and fixed, the rectification process transcends simple repair. It necessitates the structural demolition of the upper slabs to access the faulty connection, followed by the re-execution of the hoisting tasks. This demolition–reconstruction–recovery chain represents a non-linear propagation of failure [31]. The repercussions extend far beyond schedule delays; they fundamentally exacerbate carbon footprints by intensifying material wastage—such as scrapped concrete and steel—and necessitating additional energy consumption for heavy machinery operations during the demolition and rebuilding phases.
To accurately quantify these environmental impacts, we define the system boundary in accordance with EN 15978 standards [32]. The scope of analysis specifically targets the lifecycle stages most sensitive to the aforementioned rework loops: Stage A4 (Transport) and Stage A5 (Construction) [33]. Specifically, Stage A4 accounts for not only the initial logistics but also the additional transportation emissions required for replacement components following severe defects. Similarly, Stage A5 encompasses the on-site energy consumption for assembly equipment, as well as the carbon intensity associated with demolition and waste disposal processing [34].
To mathematically formalize this physical process, we abstract the aforementioned critical assembly tasks (e.g., grouting, hoisting) into discrete decision nodes. The project structure is modeled by an Activity-on-Node (AON) network graph , where represents the set of basic engineering activities, and represents the rigid technological precedence constraints. To mitigate the chain risk described above, the decision-making process involves selecting an optimal inspection scheme from a candidate checkpoint set . The quality inspection operation mode is based on strict topological rules in the project network. We use to represent our selected checkpoints, which are arranged according to their topological order in . Specifically, if , it implies that will not be ranked after in the time sequence. For any checkpoint , its coverage is defined as the set of all its upstream activities, excluding those already covered by preceding checkpoints. The specific definition is formulated as follows:
We define as the complete set of all recursive predecessor activities related to activity . Setting the parameters in this way ensures that the quality integrity of any activity is solely attributed to its direct downstream checkpoint, thereby avoiding logical redundancy within the inspection system. When the system detects accumulated defects within the coverage of checkpoint , it triggers a corresponding rework subnet, which is then dynamically embedded into the existing project topology.
Figure 1 delineates the theoretical implications of rework cascades on network topology and environmental cost accumulation. Figure 1a establishes the baseline configuration, featuring six standard activities interspersed with three candidate checkpoints (CP1–CP3); this represents an idealized, interference-free schedule. In contrast, Figure 1b illustrates the topological reconstruction triggered by defect propagation. Specifically, a failure mode is depicted in which a defect-evading CP1 propagates downstream, compromising Activities 2 and 3 (which can be interpreted as the contaminated hoisting tasks in our grouting example, highlighted in red to signal high-risk delays). Crucially, however, active intervention at CP2 arrests this chain reaction by initiating a corrective protocol and establishing a closed-loop rework cycle (indicated by the blue dashed arrow). This interception effectively severs the cascade at Node 4, thereby immunizing the downstream Activity 5 and preserving its original low-carbon profile. This function acts as a strategic containment mechanism, demonstrating that optimal checkpoint placement constrains rework at the source, effectively precluding the exponential escalation of environmental costs.
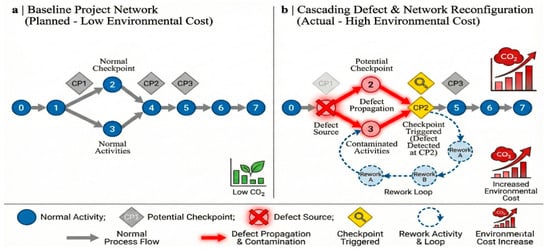
Figure 1.
Dynamic network reconstruction and carbon accumulation driven by rework cascades.
From a low-carbon perspective, these phenomena constitute not merely operational constraints but a theoretical impasse characterized by nonlinear scheduling complexity. The stochastic insertion of rework subnets destabilizes the underlying graph topology, inducing probabilistic shifts in the critical path that render static scheduling baselines obsolete. Concurrently, a fundamental trade-off emerges between carbon accumulation and defect interception: while rework inherently prolongs project duration and escalates cumulative environmental costs—driven by ancillary resource consumption and the carbon intensity of demolition processes—it represents a dynamic variable that must be weighed against the risk of unchecked propagation.
Conversely, the configuration in Figure 1b exemplifies a mitigation strategy predicated on optimization. The strategic placement of a control node at CP2 intercepts defects before they propagate to downstream linkages, such as Activity 5. Although this necessitates localized rework, the intervention proves efficacious by curtailing the systemic cascading failures that typically precipitate surges in carbon emissions. Ultimately, this control mechanism achieves an optimal equilibrium, securing overall economic and environmental stability by leveraging controllable local rework costs to preempt catastrophic macro-level deviations.
2.2. Model Assumptions
To align the mathematical model with the operational realities of low-carbon prefabricated construction while ensuring computational tractability, this study establishes the system boundaries based on the following four foundational assumptions:
- Task Indivisibility (Non-Preemptive Execution): To mirror the physical constraints of on-site assembly, strict non-preemptive rules are enforced. Once initiated, all activities—whether baseline operations or stochastic rework—must execute continuously to completion without interruption. This constraint precludes mid-stream resource reallocation, ensuring the scheduling model remains consistent with the physical indivisibility of prefabricated components.
- Idealized Inspection Efficacy (Macro-Level Abstraction): This study prioritizes the topological optimization of inspection layouts over micro-level detection accuracy. The model assumes that certified third-party verification yields definitive outcomes, thereby excluding stochastic Type I (false-positive) and Type II (false-negative) errors. In engineering practice, this assumption approximates scenarios utilizing high-precision Non-Destructive Testing (NDT) technologies (e.g., ultrasonic phased arrays or industrial computed tomography) for critical node verification, where detection reliability theoretically approaches certainty. This abstraction isolates the checkpoint configuration as the primary decision variable, enabling a focused analysis of carbon reduction mechanisms unclouded by instrument precision noise.
- To incorporate externalities of the “demolition–treatment–reconstruction” cycle without overcomplicating the network structure, we introduce an aggregate penalty coefficient (). Rework emissions are calculated via the multiplier. (), where the baseline 1.0 covers reconstruction inputs, and the surplus () quantifies the specific burden of demolition and waste processing. Calibrated against Life Cycle Assessment (LCA) standards [35], which estimate demolition impacts at 20–50% of asset value, parameter α is constrained within the range .
- Deterministic Correction Efficacy: The model assumes a one-time correction effect, with remedial measures immediately satisfying delivery standards upon completion. Practically, this rationale aligns with strict quality management protocols where remedial works are subject to heightened supervision and often involve the complete replacement of defective components rather than provisional repairs, thereby statistically ensuring compliance. This assumption eliminates the computational intractability associated with recursive failure cycles (secondary rework), ensuring the solvability of the dynamic scheduling problem.
2.3. Notation and Parameters
To align the mathematical formulation with the physical prefabrication processes detailed in Section 2.1, the parameter set is grounded in three theoretical dimensions: project topology, quality dynamics, and environmental metrics. First, regarding topological and resource constraints, the standard parameter set of the Resource-Constrained Project Scheduling Problem (RCPSP) is adopted. Parameters such as the normal duration and resource requirements are selected to define the rigid precedence relations and finite resource capacities inherent in on-site assembly [36]. These parameters establish the fundamental constraints for the lower-level scheduling model (Equations (11)–(14)).
Second, to model the dynamic rework mechanism effectively, a dynamic set and a rework penalty coefficient are introduced. Unlike static scheduling variables, the dynamic rework set functions as a state variable to accommodate remedial nodes generated by real-time defect triggers. Correspondingly, (where ) serves as a critical parameter derived from construction waste management practices. This coefficient quantifies the double penalty of rework, encompassing not only material reinvestment but also the additional emissions resulting from the demolition of defective components and waste transportation [37]. Consequently, this parameter is explicitly integrated into the total carbon footprint calculation (Equation (10)) to penalize quality failures.
Third, the carbon accounting boundaries are rigorously defined. Environmental parameters, including the carbon intensity factor and inspection emissions , are determined in accordance with EN 15978 standards, thereby covering the system boundaries of Stage A4 (Transport) and Stage A5 (Construction). The inspection emission parameter is explicitly incorporated into the upper-level objective function (Equation (9)) to capture the trade-off between the carbon cost of inspection and the potential carbon savings derived from avoided rework. Table 1 summarizes the mathematical symbols, their definitions, and the quantification units used within the bi-level framework.

Table 1.
Definition of Model Notations.
2.4. Activity Quality Transmission Model
In the domain of prefabricated construction, the quality of an activity functions not as an isolated metric but as a cumulative variable that propagates physically throughout the assembly sequence. Unlike abstract scoring systems, the variable is strictly defined herein as the degree of geometric compliance or the probability of meeting acceptance standards, quantified on a continuous scale . The interaction between predecessor and successor activities adheres to a rigorous physical logic: the output quality of upstream tasks () establishes the installation boundary conditions for downstream operations. Even if a successor activity has not yet commenced, its potential execution quality is pre-constrained by the dimensional precision of its predecessors. Consequently, the total output quality () is decomposed into two distinct components: input quality (), which represents the external geometric constraints inherited from predecessor nodes; and sub-quality (), which represents the internal execution performance. Crucially, to capture the realistic variability of construction sites, is modeled as an aggregate stochastic variable. It explicitly encapsulates endogenous uncertainties derived from labor proficiency (human error), machinery precision, and environmental interference (e.g., weather impacts on grouting curing) during the specific execution window.
Figure 2 visualizes this composition and transmission mechanism. To contextualize this abstract framework within the engineering scenario established in Section 2.1, Activity 4 is interpreted as the sleeve grouting task. In this context, the input quality () serves not as a subjective score but as a tangible metric of the combined geometric compliance inherited from preceding activities (e.g., for rebar tying and for sleeve positioning). A low value indicates that cumulative dimensional deviations—such as misaligned sleeves—have compromised the feasibility of the grouting process. Conversely, measures the precision of the grouting operation itself, including factors such as slurry ratio and injection pressure, under the given conditions. The final output quality () is thus determined by the interaction of these two factors, reflecting the physical reality of how successfully the grouting can be performed on a base with existing deviations. Mathematically, this aggregation logic is formalized in Equation (2), where the function represents the generalized transmission law:
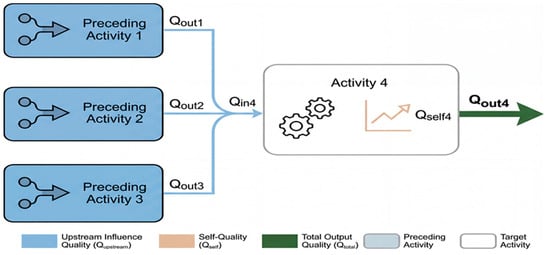
Figure 2.
Framework of activity quality components and their transmission relationships.
The function in Equation (2) serves as a mathematical abstraction. To operationalize this for specific engineering contexts, is instantiated into three distinct theoretical models: System Reliability, Weighted Average, and the Weakest Link Principle. While the first two provide generalized perspectives, the Weakest Link model (Equations (7) and (8)) is identified as the dominant physical paradigm for prefabricated assembly, owing to its alignment with the rigid dimensional chain characteristics of PC.
(1) Quality transfer based on System Reliability Theory, a paradigm historically established as a primary benchmark for engineering quality evaluation. Conceptualized within this framework, the quality transmission process functions analogously to a series system, where the overall integrity depends on the cumulative probability of success across all components. Consequently, the explicit mathematical formulation for this transmission mechanism is expressed as follows:
Mathematically, this formulation implies that if any predecessor activity achieves the theoretical maximum quality score of 1.0, the current activity’s total output depends entirely on its endogenous sub-quality. This logic parallels the “parallel redundancy” strategy often employed in high-uncertainty R&D projects. Under this paradigm, the simultaneous execution of multiple competing workflows creates structural redundancy, ensuring that the success of a single upstream path maintains overall project continuity even in the face of failures in concurrent branches.
(2) Quality transmission based on weighted average. Acknowledging that distinct project activities exert heterogeneous impacts on the outcome, we employ the weighted average method, a quantitative tool validated in prior studies [38]. We adapt this established methodology to design a transmission mechanism in which the Total Quality of an activity is defined as a composite aggregate integrating its inherent sub-quality with the quality transmitted from its immediate predecessors. This model effectively balances internal execution variables with external quality inputs, according to the mathematical relationship presented below:
Within this formulation, the parameter quantifies the magnitude of the current activity’s influence on its successor. This relationship defines a critical boundary condition: should the cumulative weight of predecessor activities converge to zero, the task effectively decouples from the interdependent activity chain. In such a boundary scenario, the quality outcome transitions from a cumulative dependency to a state governed exclusively by the activity’s endogenous sub-quality.
(3) Quality transmission based on the Weakest Link Principle (Dominant Mode for PC). In the specific context of prefabricated construction, assembly chains are characterized by rigid dimensional chains, as exemplified by the sleeve grouting case detailed in Section 2.1. A single dimensional error in a critical predecessor (e.g., sleeve positioning) may render the subsequent component (grouting) uninstallable, regardless of the quality of other inputs. This phenomenon is physically analogous to the Bucket Effect or Cannikin’s Law. To mathematically capture this binary all-or-nothing reality, the minimization operator is adopted. This implies that the installation condition () is capped by the worst-performing predecessor, and the final quality () cannot exceed the limitations imposed by these boundary conditions. This model, described in Equations (7) and (8), provides the most rigorous representation of risk propagation in structural assembly:
2.5. Quality-Driven Network Reconstruction and Parameter Quantification
This study introduces a deterministic mapping methodology connecting quality states to network topology, a linkage essential for simulating the complex triggering of rework cascades. Departing from conventional stochastic approaches that treat rework merely as random duration extensions, a Constructive Reconstruction Framework is proposed. Within this framework, rework activities are operationalized not as abstract time delays but as explicit, unique decision nodes. As cascading failures propagate, these distinct nodes coalesce to form a coherent rework sub-network, which integrates formally into the baseline project network, thereby inducing a dynamic topological reconfiguration driven by emergent rework paths.
To quantify the physical parameters of these rework nodes, a discrete quality-level threshold model grounded in operational inspection protocols is employed. Recognizing that engineering quality is typically assessed in discrete intervals rather than on a continuous spectrum, this framework utilizes a piecewise step function to capture the nonlinear relationship between quality grades and rework duration. The quality spectrum is stratified into tiers, ranging from Qualified to Serious Defect, with each tier assigned a specific Rework Intensity Coefficient. Functionally, this operates as a strict penalty mechanism: a Serious Defect classification triggers a mandatory 100% rework load, whereas a Qualified status incurs zero penalty. This model serves as a transformation interface, converting continuous quality indices into discrete temporal constraints, thereby mapping quality risks directly to resource inputs. The mapping logic is illustrated in Figure 3.
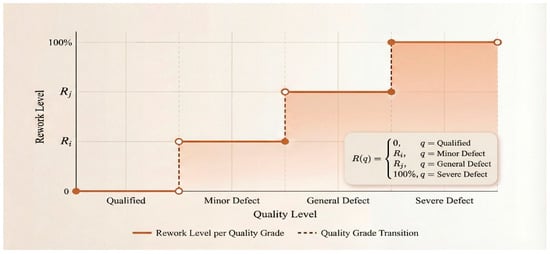
Figure 3.
Piecewise step function mapping discrete quality states to rework levels.
Based on the rules illustrated in Figure 3, the generation of a rework sub-network follows a non-binary logic; instead, a Double-Trigger Mechanism is adopted for defect interception. Under this mechanism, the topological instantiation of a rework node is not automatic but contingent upon the simultaneous satisfaction of two conditions. First, physical non-conformance must occur, meaning the actual output quality of activity falls below the acceptance threshold (i.e., ), which indicates the objective existence of a defect (e.g., sleeve misalignment exceeding tolerance, as contextualized in Section 2.1). Second, effective detection is required, meaning the defective activity must strictly reside within the coverage scope of an active checkpoint .
If a defect occurs but fails to meet the second condition—a scenario characterizing an inspection blind spot—it is classified as a Latent Defect. Such defects propagate downstream without triggering immediate topological reconstruction, simulating the risk of undetected quality hazards accumulating in the system. Conversely, when both conditions are strictly met, the topology update algorithm is activated immediately. Following the Single Correction Assumption, the algorithm instantiates a specific rework node and inserts it between the initial activity and its successors. Consequently, the network adjacency matrix is readjusted, and a strict Finish-to-Start (FS) constraint is enforced between and . This setting ensures that the time sequence remains ordered and that remedial measures take precedence over subsequent operations. Through this mechanism, cascading failures are effectively intercepted at the source, and the project schedule is dynamically recalibrated during calculation.
2.6. Bi-Level Mathematical Model
Synthesizing the quality transmission dynamics and network reconstruction protocols established in Section 2.4 and Section 2.5, this study formulates the multi-objective scheduling problem within a hierarchical bi-level programming framework. The Upper-Level Problem (ULP) functions as the strategic leader, tasked with determining the optimal inspection topology vector by minimizing a Generalized Total Cost (GTC) objective function. Conditional upon the topological decisions of the ULP, the Lower-Level Problem (LLP) acts as the follower, executing resource-constrained scheduling on the dynamically reconfigured network. By feeding the minimized project makespan back to the upper tier, the LLP completes the closed-loop Stackelberg optimization cycle.
2.6.1. Upper-Level Model: Quality Inspection Layout and Generalized Cost Optimization
The primary objective of the ULP is to identify the optimal inspection vector that minimizes the Generalized Total Cost (GTC). Here, is a binary decision variable, where denotes the deployment of a checkpoint at candidate node , and indicates otherwise.
Addressing the challenge of weighting calibration in multi-objective optimization, this study eschews arbitrary subjective weights in favor of a “Shadow Price” Monetization Strategy. This approach aligns the objective function with the economic realities of construction stakeholders:
- Regulatory Stakeholders: The environmental impact is monetized via the carbon tax rate (), reflecting the external cost imposed by government emission regulations.
- Project Owners: The time dimension is monetized via the unit time penalty coefficient (), representing the contractual liquidated damages for schedule delays.
By anchoring these conversion coefficients to deterministic market and contractual parameters rather than dimensionless weights, the GTC formulation provides a transparent, cost-centric criterion for project compliance. The mathematical formulation is expressed as follows:
In this equation, the first term represents the direct economic cost of inspection activities. The third term () quantifies the financial risk of schedule overruns. The middle term, , internalizes the environmental externalities. While integrating heterogeneous dimensions into a single scalar might obscure specific trade-offs in a static view, this study mitigates the risk of “loss of transparency” by treating and as dynamic variables. The sensitivity of the optimal strategy to these price fluctuations—and the resulting trade-offs between efficiency and sustainability—are explicitly analyzed in Section 4.4. The total carbon footprint is calculated by aggregating the baseline emissions of normal activities and the conditional emissions triggered by rework events:
Equation (10) quantifies emissions based on tangible physical processes rather than abstract mathematical representations. Specifically, the baseline emissions () are calculated as the product of resource consumption and the corresponding carbon intensity factors () derived from LCA databases (e.g., CLCD or Ecoinvent). Furthermore, the rework emissions are not a subjective estimation but an explicit summation of three physical stages: accounts for the energy consumption of machinery required to dismantle the defective component; covers the emissions associated with the transportation and landfill processing of construction waste; and represents the embodied carbon of new materials required to re-execute the activity. By explicitly accounting for the demolition–disposal–reconstruction cycle, this model transforms the implicit environmental impact of rework into a quantifiable metric.
2.6.2. Lower-Level Model: Resource-Constrained Scheduling on the Reconstructed Network
Conditional upon the upper-level decision vector and the resultant rework triggers, the Lower-Level Problem (LLP) is instantiated as a dynamic Resource-Constrained Project Scheduling Problem (RCPSP). Unlike static scheduling models, the network topology in this framework () evolves dynamically in response to inspection outcomes. represents the complete node set, comprising the baseline activities , the dynamically generated rework nodes , and the active inspection nodes . The adjacency set contains both the fundamental precedence constraints and the logical edges generated by rework insertion. The objective of the LLP is to minimize the total project duration by optimizing the start time of each activity, subject to the updated topological structure and finite resource availability:
Scheduling execution is governed by rigid topological dependencies and resource capacities. Specifically, precedence logic stipulates that no activity may commence before its immediate predecessor is completed. This constraint is formally expressed as:
Simultaneously, resource utilization is subject to strict capacity ceilings. In any given time interval , the cumulative consumption of resource by all active operations must not exceed its total availability . To model this, a binary state variable is defined, indicating whether activity is active at time :
Consequently, the renewable resource constraint is formulated as follows:
3. Design of the Hybrid TS-CDBO Algorithm
3.1. Algorithmic Architecture: Hierarchical H-TS-CDBO Framework
The bi-level mathematical model formulated in Section 2.6 presents a complex leader–follower optimization challenge characterized by mixed-integer constraints and topological variability. The principal computational barrier stems from the structural heterogeneity of the decision variables: the upper-level inspection plan constitutes a discrete binary vector , whereas the lower-level scheduling priority functions as a continuous floating-point vector . Conventional monolithic solvers are often ill-suited to navigate this disjointed solution space effectively. To address this limitation, this study proposes the H-TS-CDBO architecture, a hybrid meta-heuristic specifically engineered to decompose this NP-hard problem into two mathematically compatible sub-domains. This framework functions not merely as a sequential combination of algorithms but as a closed-loop Stackelberg equilibrium solver governed by a rigorous Structure–Mapping–Optimization protocol.
The selection of the constituent algorithms—Tabu Search (TS) and the Chaotic Dung Beetle Optimizer (CDBO)—is driven by the “Topological Ruggedness” of the dynamic scheduling problem. As analyzed in Section 2.5, the stochastic insertion of rework subnets creates substantial “cliffs” in the solution space, where traditional gradient-based methods are prone to premature convergence. Consequently, as illustrated in the system architecture (Figure 4), the operational logic coordinates three distinct computing layers to resolve the coupling between inspection topology and schedule execution. At the strategic upper level, Tabu Search is employed to explore the discrete combinatorial space of the inspection vector [39]. TS is selected specifically for its “Adaptive Memory” mechanism (Tabu List), which is methodologically optimal for the specific dynamics of rework. Unlike memoryless algorithms (e.g., Simulated Annealing), the Tabu List explicitly prevents the algorithm from revisiting recently discarded solutions, thereby avoiding invalid “repair–fail–repair” cycles and ensuring efficient escape from local optima within the binary domain.
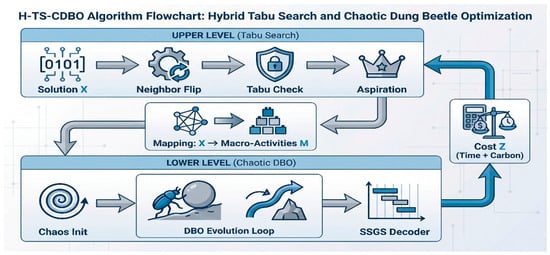
Figure 4.
Overall Framework of the H-TS-CDBO Algorithm.
Serving as an interface with the upper level, a Mapping Layer translates the physical decision vector into logical Macro-Activities (), thereby encapsulating the variable network topology to ensure structural stability. Conditional upon this topology, the lower scheduling level employs the improved Chaotic Dung Beetle Optimizer (CDBO) to optimize the continuous priority vector [20]. Although CDBO is a relatively novel meta-heuristic, it offers a distinct advantage over established methods (e.g., PSO) through its inherent “Dancing behavior.” This tangent-based search mechanism mathematically models a reorientation strategy when encountering obstacles. In the specific context of this study, this behavior is isomorphic to the “Active Interception” logic required to bypass high-penalty rework chains. To further enhance reliability and address stability concerns in high-dimensional spaces, CDBO integrates Circle chaotic mapping for ergodic initialization, ensuring the solver can escape the “makespan traps” caused by nonlinear rework cascades.
The convergence of this leader–follower system relies on a quantitative feedback loop. The scheduling layer decodes vector via the Serial Schedule Generation Scheme (SSGS) to calculate the project makespan and total carbon emissions . These metrics are aggregated into the Generalized Total Cost (), which is subsequently fed back to the strategic layer as a fitness signal. This feedback directs the Tabu Search to adjust its neighborhood exploration trajectory, thereby iteratively driving the system toward a cost–carbon equilibrium that minimizes the Generalized Total Cost ().
3.2. Encoding and Decoding Strategies
3.2.1. Macro-Activity Definition and Network Mapping
Random insertion of rework nodes induced by on-site quality failures will lead to topological instability. Because chromosome length is variable in the physical network, directly coding physical nodes will make the calculation unstable. To balance these process dynamics with fixed-length coding constraints, this study uses an improved “Macro-Activity” abstraction method [40]. This layer separates the logical construction sequence from stochastic physical execution. Officially, the set defines the macro-activity vector, in which each encapsulates a complete “Work Package” (including the baseline operation, potential inspection, and conditional rework tasks) as an independent scheduling unit.
Figure 5 shows the encapsulation protocol and describes the interface between the random “Physical View” and the “Logical View” determined by the protocol. In the physical layer (left panel), the active topology is variable and controlled by the binary decision vector . This dependence results in different execution paths (baseline vs. rework instantiation), leading to random time variations. On the contrary, the logical layer is a standardized abstraction: regardless of the physical implementation status, the scheduling vector is fixed as a set of macro-activities . In order to formalize this mapping, the logical duration is defined as a conditional function of the decision variable and the quality output :
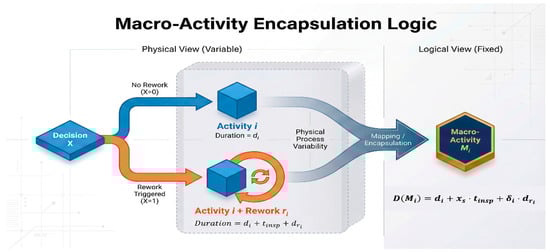
Figure 5.
Macro-activity encapsulation mechanism.
In this formula, represents the determined basic time. This value will be based on an alternative decision variable to decide whether to add the time required for inspection. In addition, this formula also includes the conditional rework time , which is controlled by a trigger indicator (This indicator is defined in Section 2.5). This encapsulation mechanism mathematically mirrors the “Black Box” nature of on-site task execution: from the perspective of the master schedule (Logical View), a task is assigned a start time; however, its actual completion (Physical View) is contingent upon internal quality checks and potential rectification cycles. Most importantly, this abstract method ensures that the dimension is unchanged: the coding length is strictly fixed to the number of basic activities . This transformation maps the physical network with variable structure to a fixed logical vector, thereby resolving the problem of unstable computation.
3.2.2. Bi-Level Encoding Mechanism
According to the hierarchical structure of the two-layer model, we used a hybrid coding method in this study. At the strategic upper level, we use the discrete binary vector . This vector directly corresponds to the “Inspection Deployment Plan” in construction management, where the decision variable indicates that a checkpoint is to be deployed at the candidate node . So this vector determines the configuration of macro activities.
To match the continuous meta-heuristic search space with the discrete resource scheduling constraints, the bottom model uses the Random Keys (RK) representation [41]. Because it performs well in combinatorial optimization [42], the RK scheme serves as a mapping protocol for permutation problems. The solution vector here is defined as , where each element will assign a floating-point number priority weight to the corresponding macro-activity . In the context of resource-constrained construction, this priority vector represents the “Resource Access Right.” When multiple activities compete for limited on-site resources (e.g., cranes or specialized labor), the activity with a higher priority (smaller RK value) secures the resource first.
In the decoding stage, continuous vectors will be converted to a discrete arrangement using the Smallest Position Value (SPV) rule. We sort the components of from small to large, and the corresponding index arrangement forms the macro-activity priority list . This rule forces an inverse monotone mapping: the smaller the value of , the higher the scheduling priority. Importantly, this abstract method avoids generating infeasible permutations, a common side effect when using continuous operators for integer coding, thereby maintaining the structural integrity of the evolution process of CDBO.
3.2.3. Feasible Schedule Generation Mechanism
The priority list is converted into a specific schedule using the Serial Schedule Generation Scheme (SSGS) [43]. This scheme, like a decoder, turns the abstract arrangement into a practical resource timeline. We selected SSGS over parallel schemes specifically to address the “Topological Volatility” induced by rework. The SSGS’s gradual allocation mechanism is exceptionally stable in the face of network structure changes. Unlike parallel schemes that slice time rigidly, SSGS adopts an “Activity-Oriented” logic similar to on-site construction management: it strictly follows the updated precedence chain. No matter how the adjacency set in the reconstructed network is updated by defect triggers, the algorithm will strictly adhere to the modified sequential logic when arranging the times. This ability ensures that even if the network changes dynamically as described in Section 2, the algorithm can still calculate the results.
Compared with the Parallel Schedule Generation Scheme (PSGS), the Serial Schedule Generation Scheme (SSGS) demonstrates superior efficacy in environments with stringent resource constraints and variable process flows. This advantage stems from the fundamental algorithmic design: SSGS explores the domain of active schedules, a comprehensive search space theoretically guaranteed to contain the global optimum. In contrast, the parallel mechanism typically generates non-delay schedules; by restricting the solution space to strictly non-delay operations, this approach risks excluding the optimal scheduling configuration when rework inserts unexpected delays, as noted in prior literature [44].
In operation, this algorithm will check the decision set according to the order , and arrange the earliest feasible start time for each Work Package . The arrangement process is divided into two steps: first, the earliest start time, considering the sequence, is calculated using Formula (12). Then, a time resource feasibility check will be conducted. If it is found that the remaining resources at time are not enough to meet the demand , then will be pushed back repeatedly until an adequate time window satisfying Equation (13) is found. This method ensures the feasibility of the activity sequence and resources, and realizes lossless mapping from the algorithmic coding space to the actual solution. Finally, this process will provide evaluation indicators, including the total project duration and the total carbon emissions .
3.3. Upper Level: Tabu Search Design
In the upper two-tier framework, there is a module called the strategic optimizer, which uses Tabu Search (TS) to find the best check vector , which is a problem about binary combinations. Because the problem is particularly complicated (NP-hard), this algorithm uses a method called a “single-bit flip operation” to generate nearby possible solutions. In the context of our inspection model, this mathematical operation corresponds to the “Strategic Adjustment of Quality Checkpoints”—specifically, adding a new inspection station or removing an existing one at a candidate node. The concrete operation is as follows: for the current solution , we randomly select a position is selected, and then reverse the binary state at this position, thus obtaining a new candidate solution . To avoid repeating the old path, the algorithm also maintains a Tabu List of size , which records recently modified positions, effectively adding a short-term memory limit.
Evaluating neighbor solution needs to nest and call the low-level CDBO algorithm. This subroutine will perform complete scheduling optimization according to the macro-activity structure . Under this framework, the generalized cost is the standard to measure the solution. To balance exploration and utilization and avoid getting stuck, we also use an Aspiration Criterion. If the calculated of a solution marked as tabu is better than the current optimal solution , then the tabu limitation can be ignored. This mechanism simulates a “High-Value Override” decision strategy: even if a specific inspection adjustment was recently discarded, it will be reconsidered if it yields a breakthrough in reducing total cost or carbon emissions. The optimization loop will keep running until it reaches the stop condition of the maximum number of iterations , and finally, the global optimal solution can be obtained.
3.4. Lower Level: Chaotic Dung Beetle Optimization Algorithm
Within the fixed macro-activity framework , the underlying solver is tasked with optimizing the priority sequence . To circumvent the susceptibility of the standard Dung Beetle Optimization (DBO) to premature convergence—a common pathology in high-dimensional combinatorial landscapes—this study implements a hybrid initialization strategy grounded in Chaos Theory. Unlike conventional pseudo-random generation methods, which often result in detrimental population clustering, our approach employs the Circle Chaotic Map. By exploiting the ergodic properties inherent to chaotic systems, this method facilitates a uniform distribution of initial position vectors, thereby ensuring robust global exploration of the solution space. The governing iterative mechanism is formulated as follows:
In the experimental setup, the control parameters are calibrated to and . Then, the generated chaotic sequence is linearly scaled, and the macro-activity priority vector is obtained.
This evolutionary framework emulates four distinct ethological patterns: ball-rolling, dancing, breeding, and foraging. While biologically inspired, these mechanisms are recalibrated here to address specific scheduling challenges. While the ball-rolling mode facilitates global exploration for diverse resource sequences, the Dancing behavior has been specifically recalibrated to mitigate topological stagnation risks inherent in cascaded rework networks. In rework-intensive regions, the objective function often exhibits “Cliffs”—discontinuous surges in makespan caused by the sudden insertion of rework subnets. Standard gradients fail in these non-convex landscapes. To counteract this sensitivity, we introduce a tangent-guided adjustment mechanism as a “Slope Navigation Strategy”. This strategy dynamically realigns the search trajectory, enabling the algorithm to circumvent local optima traps effectively, as formalized by the following position update equation:
here represents the deflection angle with respect to the previous position vector . This angular deviation acts as a stochastic perturbation, which can prevent the motion trajectory from getting stuck. It allows particles to escape from “Schedule Traps”—local optima where the algorithm falsely converges to a high-penalty sequence due to rework peaks. This exploration mechanism complements the local reinforcement provided by breeding and foraging protocols, ensuring final convergence to the global optimal priority vector . In this way, this vector can produce the minimum-cost value, which is decoded by SSGS and fed back to the upper-layer strategy.
3.5. Algorithm Parameters and Complexity Analysis
3.5.1. Parameter Settings
The convergence effect of H-TS-CDBO architecture depends on the precise super-parameter configuration. To avoid subjective deviations in manual parameter adjustment, the Taguchi orthogonal array method is used to calibrate the system. The experimental design prioritizes highly sensitive variables, especially the interaction between the upper constraints (iterations, tabu length) and the lower operating parameters (population size, iterations). In order to ensure the feasibility of the experiment, the low sensitivity parameters, such as neighborhood size (), remain fixed, while the chaotic map is set according to the existing literature standard [45]. The specific calibration method is detailed in Section 4.1.2, and the optimized parameter set is summarized in Table 2.
Table 2.
Parameter settings of the H-TS-CDBO algorithm.
To guarantee the reproducibility of the computational experiments, strict initialization protocols were enforced. All stochastic processes, including the chaotic map generation and the neighbor selection in Tabu Search, were governed by a fixed random seed (Seed = 42) during the benchmarking phases. This control variable ensures that the algorithmic performance remains deterministic across independent runs, facilitating rigorous comparative analysis. Furthermore, the algorithmic logic relies entirely on the mathematical formulations and topological transformation rules explicitly detailed in Section 3.1, Section 3.2, Section 3.3 and Section 3.4, ensuring that the solver can be reconstructed based on the presented equations. Regarding the experimental data, the standard PSPLIB instances (J30–J120) are publicly available, while the specific parameters for the illustrative case study are fully enumerated in in the corresponding section below.
3.5.2. Complexity Analysis
Computational overhead depends on hierarchical iteration constraints and decoding delay. Let and , which respectively represent the number of activities (Engineering Scale) and the dimension of resources. Although the sorting operation takes time, gradually, SSGS decoding protocol () is the main influencing factor. Therefore, the sorting part can be ignored in the progressive analysis. Given the nested execution logic, each upper-neighbor query will call the lower subroutine. The total time complexity can be expressed as:
The derivation process proves that although the hierarchical nested structure is used, the complexity of the algorithm is still controlled at the polynomial level of , which is related to the problem scale . In the context of medium- and large-scale engineering applications (where activity counts typically range from hundreds to thousands), decision-making accuracy is critical. The polynomial complexity ensures that the solver can generate optimized inspection-scheduling plans within a reasonable timeframe (e.g., minutes to hours), balancing computational efficiency with the practical need for robust project planning.
4. Experimental Design and Result Analysis
4.1. Experimental Settings and Verification Protocol
4.1.1. Engineering Scenario Simulation and Instance Generation
To validate the applicability of the proposed bi-level model within realistic prefabricated construction (PC) scenarios, this study establishes a simulation environment grounded in standard benchmarks while augmenting them with specific engineering attributes. Since the canonical PSPLIB repository (J30–J120) focuses solely on logic and resource constraints, it fails to capture the multi-dimensional risks of quality and carbon emissions inherent in PC projects. To address this limitation, extended test instances were generated to function as digital twins of actual construction projects. Specifically, to validate the robustness of the framework across varying levels of project complexity, the dataset encompasses a comprehensive spectrum of topological scales, ranging from small-scale renovations (J30, comprising 30 activities) to complex, large-scale infrastructure developments (J120, comprising 120 activities). This stratified experimental design ensures that the performance of the algorithm is rigorously evaluated against the structural complexities typical of diverse engineering sectors, thereby mitigating the limitations associated with single-case verification. Consequently, these instances constitute the standardized testbed for the subsequent comparative analyses.
These instances are calibrated using specific physical parameters to reflect authentic operational constraints. As detailed in Table 3, the carbon emission penalty coefficient is not an arbitrary mathematical weight but a composite index strictly derived from the physical rework process described in Section 2.6. Specifically, this coefficient is set at 1.4, aggregating baseline material re-input (1.0), additional resource consumption for demolition (0.3), and the environmental load of waste disposal (0.1). Similarly, the inspection cost is configured to follow a uniform distribution U ~ [10, 50], simulating the cost variability associated with different detection technologies (e.g., simple visual inspection versus ultrasonic non-destructive testing). To ensure the reproducibility of the stochastic simulation and reflect the industrial consistency of prefabricated manufacturing, the sub-quality index () for each activity is modeled as a random variable following a Truncated Normal Distribution bounded within the interval . This parameterization mathematically captures the high-precision characteristics of off-site production, where quality deviations are stochastic but strictly controlled within acceptance tolerances. By embedding these tangible engineering metrics into standard topological structures, the experimental dataset transforms abstract mathematical problems into concrete project management scenarios. Furthermore, to ensure experimental reproducibility and eliminate hardware-induced variance, all computational simulations were executed on a uniform computing platform. All simulations were executed on a standardized computing platform (Lenovo, Beijing, China; AMD Ryzen 7 7840H, 16 GB RAM) to eliminate hardware-induced variance.
Table 3.
Parameter settings for the extended dataset and experimental environment configuration.
4.1.2. Algorithmic Calibration for Practical Applicability
To ensure the reliability of the comparative experiments in Section 4.2 and the policy sensitivity analysis in Section 4.4, establishing a robust configuration for the proposed H-TS-CDBO algorithm is essential. Although the architecture provides a theoretical solution framework, its deployment in practical engineering management requires precise calibration of endogenous parameters to balance solution quality with computational timeliness. Unlike purely theoretical studies that pursue infinite convergence, real-world project scheduling demands rapid decision support. Therefore, the Taguchi method utilizing an [46] orthogonal array was employed not merely to tune the algorithm, but to identify the most robust configuration that minimizes the Generalized Total Cost within a reasonable timeframe.
Sensitivity analysis conducted on representative J60 instances reveals trade-offs between search intensity and resource consumption. As illustrated in the main effect plots (Figure 6), the iterative parameters ( and , shown in Figure 6a,c) exhibit a monotonic positive correlation with solution quality, indicating that sufficient search depth is required to navigate the complex topological landscape of rework. Consequently, these parameters are set to their tested upper bounds (45 and 60, respectively) to ensure reliability. In contrast, the population size (, Figure 6d) demonstrates a diminishing return effect beyond 30 agents. In the context of nested bi-level optimization, an excessively large population induces exponential computational overhead, which proves detrimental to practical application. Thus, fixing the population at 30 represents an optimal equilibrium, ensuring that the solver provides high-precision schedules without incurring the prohibitive latency associated with larger population swarms. Similarly, the Tabu Length (Figure 6b) indicates that a moderate memory size is sufficient to prevent cycling. This finalized constellation () serves as the standardized protocol for the proposed algorithm. For the comparative baselines (H-TS-GA, H-TS-PSO, H-TS-DE), the algorithmic parameters were configured based on established empirical standards commonly used in RCPSP literature [47,48,49] to ensure a fair benchmarking baseline. The detailed parameter settings for all algorithms are summarized in Table 4.
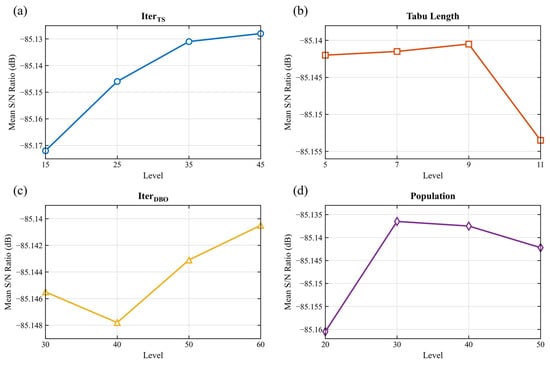
Figure 6.
Main effect plots of Signal-to-Noise (S/N) ratios for key parameters of the H-TS-CDBO algorithm: (a) TS iterations; (b) Tabu length; (c) DBO iterations; (d) Population size.
Table 4.
Parameter settings for the proposed algorithm and baseline comparisons.
4.2. Multidimensional Verification of Algorithm Performance
4.2.1. Optimization Accuracy Verification
To validate the fidelity of convergence of the H-TS-CDBO architecture, we employed a small-scale J15 benchmark instance. Utilizing Big-M constraints and piecewise linearization techniques [49], the original nonlinear bi-level model was reformulated into a tractable Single-Level Mixed-Integer Linear Programming (MILP) formulation. This transformation enabled the deployment of the CPLEX 22.1 exact solver to ascertain the theoretical global optimum. As detailed in Table 5, CPLEX identified the precise lower bound () with remarkable computational expediency, converging in merely 0.03 s, thereby establishing a rigorous theoretical benchmark.
Table 5.
Optimization benchmarks for the J15 small-scale verification instance.
Against this benchmark, the H-TS-CDBO algorithm demonstrated robust performance across 10 independent trials, yielding an average solution quality proximal to the global optimum () with a mean computation time of 5.42 s. The observed optimality gap of 3.46% is intrinsic to the algorithmic design. Unlike the exact solver which seeks a mathematically perfect optimum in a static vacuum, the proposed heuristic adopts a conservative “wait-and-synchronize” protocol. This design choice intentionally sacrifices marginal theoretical optimality to guarantee absolute resource feasibility under dynamic rework conditions, a trade-off essential for ensuring that the schedule remains executable in realistic engineering environments. Furthermore, the algorithm exhibits high reliability, evidenced by a low standard deviation (4.21) and a 90% success rate. These metrics confirm that the search mechanism is systematic rather than stochastic, ensuring stable convergence toward high-quality solutions.
Regarding computational efficiency, a distinct trade-off emerges. While the bi-level nested structure of H-TS-CDBO is marginally slower than the exact solver for small-scale instances, the divergence in scalability is profound. The exact solver, constrained by the exponential complexity inherent to NP-hard problems, becomes computationally intractable for instances exceeding J30. Conversely, the H-TS-CDBO framework, grounded in polynomial-time heuristics, maintains computational viability as problem dimensions expand. Therefore, the J15 validation serves a dual purpose: it confirms the algorithm’s accuracy at small scales while validating its ability to deliver high-quality approximate solutions at reasonable computational cost.
4.2.2. Comparative Analysis of Solution Efficiency and Quality
Due to the NP-hard nature of low-carbon scheduling with cascade rework, exact methods are computationally intractable for large-scale instances, necessitating the use of heuristic approaches. To rigorously benchmark the proposed H-TS-CDBO algorithm, this study conducts a comparative evaluation against established high-performance meta-heuristics commonly utilized in the RCPSP domain, specifically the Genetic Algorithm (GA), Particle Swarm Optimization (PSO), and Differential Evolution (DE). The selection of these baselines is strictly governed by the suitability of the algorithm for the defined optimization landscape. Since the Generalized Total Cost (GTC) formulated in this study aggregates multi-dimensional objectives into a unified scalar function, the problem constitutes a single-objective mixed-integer task. Consequently, the experimental design prioritizes population-based global solvers (GA, PSO, DE) over constructive heuristics (e.g., ACO) or Pareto-based multi-objective algorithms (e.g., NSGA-II, MOEA/D), ensuring methodological consistency. Furthermore, to ensure a fair assessment against high-end baselines and eliminate architectural bias, all comparative algorithms were upgraded to “hybrid variants” (H-TS-GA, H-TS-PSO, H-TS-DE) embedded within the identical Tabu Search hierarchical framework. This rigorous experimental control isolates the efficacy of the core evolutionary engine, allowing for a precise evaluation of accuracy, convergence speed, stability, and computational costs across the extended J30–J120 datasets.
A comparative analysis of the convergence trajectories presented in Figure 7 and the statistical data summarized in Table 6 reveals a strong correlation between performance disparity and problem dimensionality. In lower-dimensional instances (J30 and J60, as shown in Figure 7a,b), convergence behavior is consistent across all evaluated methods. However, a distinct divergence emerges as problem complexity increases (J90 and J120, as shown in Figure 7c,d). The nonlinear propagation of rework cascades creates a highly rugged solution space. Consequently, traditional meta-heuristics, such as the Genetic Algorithm (GA) and Particle Swarm Optimization (PSO), frequently suffer from “Topological Entrapment.” As evidenced in Figure 7d, these algorithms converge prematurely due to the lack of a mechanism to escape local optima formed by high-penalty rework chains, often referred to as “Cliffs” in the solution space.
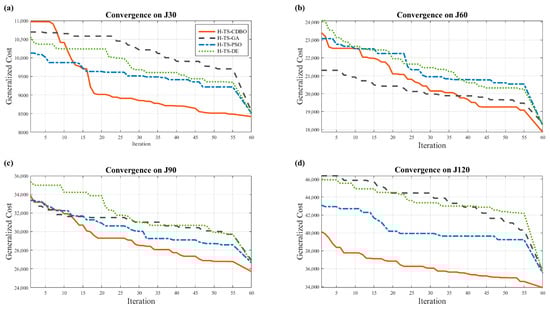
Figure 7.
Comparison of convergence characteristics among different algorithms on J30–J120 instance sets: (a) J30 instance set; (b) J60 instance set; (c) J90 instance set; (d) J120 instance set.
Table 6.
Statistical comparison of performance among different algorithms on J30–J120 instance sets (Unit of Z: CNY).
In contrast, the H-TS-CDBO algorithm effectively mitigates this topological complexity through the tangent-guided “dancing mechanism” described in Section 3.4. Table 6 substantiates this superiority, not merely through numerical margins but by highlighting three critical algorithmic implications. First, regarding optimization accuracy, the proposed algorithm consistently achieves the lowest Generalized Total Cost. In the demanding J120 instance, it maintains a minimal optimality gap of less than 1%, significantly outperforming comparative variants that exhibit deviations exceeding 5%. This precision validates the efficacy of the “macro-activity” encoding in stabilizing the search trajectory within rugged topological spaces. Second, concerning algorithmic robustness, H-TS-CDBO achieves an optimal balance; it secures high-quality convergence without the excessive computational overhead observed in stable variants such as H-TS-DE, which requires nearly double the execution time for a marginal reduction in variance. Critically, the worst-case solution identified by H-TS-CDBO remains superior to the best-case outcomes of the comparative methods. This “Worst-Case Superiority” provides a vital safety margin for engineering management, ensuring that generated schedules remain economically viable even under suboptimal search conditions. Finally, in terms of operational feasibility, the solver requires an average of approximately 343 s for large-scale instances. This efficiency confirms that the bi-level framework delivers robust decision support within a timeframe viable for on-site management, avoiding the prohibitive latency that often renders theoretical heuristics impractical.
To ascertain whether the observed performance differences are genuinely statistically significant rather than due to stochastic variance, we subjected the results of 20 independent trials to the Wilcoxon Rank-Sum Test. Pairwise comparisons were conducted at a significance level of . The resulting statistical outcomes are tabulated in Table 7. Table 7 substantiates the statistically significant superiority of H-TS-CDBO, initially evidenced in the J30 instance (p < 0.05). Crucially, this performance differential amplifies as problem complexity escalates. In the high-dimensional J120 instances, the p-value diminishes to 10−6, a magnitude that decisively refutes the null hypothesis. This confirms that the observed advantage stems from the intrinsic capability of the algorithm to navigate the rugged landscapes of dynamic scheduling, rather than mere stochastic variance.
Table 7.
Wilcoxon Rank-Sum Test results between H-TS-CDBO and comparison algorithms (p-values).
Table 7 substantiates the statistically significant superiority of H-TS-CDBO, initially evidenced in the J30 instance (p < 0.05). Crucially, this performance differential amplifies as problem complexity escalates. In the high-dimensional J120 instances, the p-value diminishes to 10−6, a magnitude that decisively refutes the null hypothesis. This confirms that the observed advantage stems from the algorithm’s intrinsic capability to navigate the rugged landscapes of dynamic scheduling, rather than mere stochastic variance.
4.2.3. Ablation Study: Validating the Chaotic Initialization Strategy
To isolate the contribution of the Circle Chaotic Map initialization, we conducted a controlled ablation study. Given that macro-activity encapsulation constitutes a structural constraint and the “dancing mechanism” is intrinsic to the DBO core, this experiment specifically delineates the performance differential between chaotic and standard stochastic initializations. Using the high-dimensional J120 dataset as a representative benchmark for complexity, we contrasted the fully configured H-TS-CDBO model with a control variant (H-TS-DBO) that employs pseudo-random initialization.
The convergence trajectories illustrated in Figure 8 validate the efficacy of the proposed initialization strategy. Notably, the H-TS-CDBO trajectory exhibits superior initial fitness, indicating that the ergodic properties of the chaotic sequence effectively circumvent suboptimal population clustering during the nascent phase. From an engineering perspective, this implies that the algorithm can identify a “Good Enough” schedule much earlier in the computation process, a critical feature for rapid on-site decision-making. Quantitatively, the H-TS-CDBO algorithm converges to a minimum Generalized Total Cost of 33,600 CNY, resulting in a 1046 CNY (approximately 3.1%) cost reduction relative to the baseline H-TS-DBO. These findings demonstrate that the Circle Chaotic Map serves not merely as a preliminary configuration step but as a foundational structural enhancement.
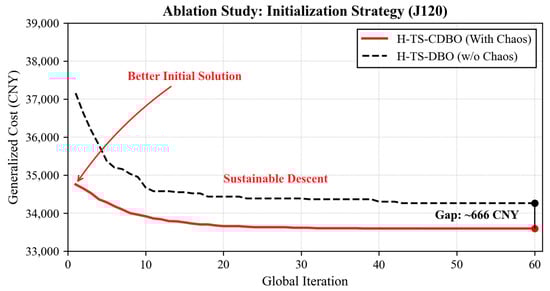
Figure 8.
Ablation analysis of initialization strategies in H-TS-CDBO (Unit: CNY).
4.3. Intelligent Decision-Making vs. Rule-Based Heuristics
To validate the practical viability of the proposed bi-level model, we implemented a rigorous comparative analysis benchmarking the H-TS-CDBO framework against established industrial management heuristics. Specifically, three traditional priority rules serve as control baselines: the Critical Path (CP) method; the High Rework (HR) rule; and the Successor Influence (SI) heuristic. This experimental design aims to ascertain whether the proposed algorithm offers statistically significant advantages over standard static decision protocols currently prevalent in project management.
The empirical performance distributions for the J120 instance (Figure 9) reveal a fundamental structural divergence between our method and traditional heuristics. The H-TS-CDBO algorithm demonstrates superior efficacy in terms of normalized generalized cost, characterized by a significantly lower median and a tightly constrained Interquartile Range (IQR). This minimal statistical variance attests to the algorithm’s exceptional robustness; it maintains performance stability even amidst stochastic topological perturbations caused by rework. In stark contrast, the heuristic strategies exhibit significant heavy-tailed volatility and elevated medians.
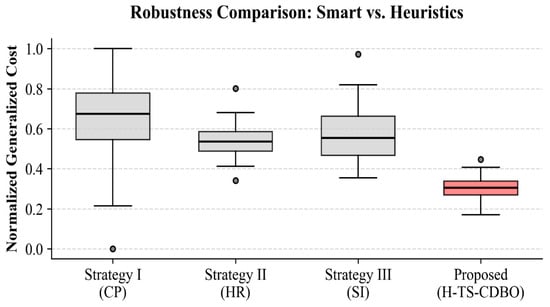
Figure 9.
Comparison of generalized cost performance and robustness under different inspection strategies.
Analysis of Performance Divergence:
A critical examination of these performance disparities exposes the mechanical limitations of static heuristic rules in dynamic low-carbon scheduling:
- Static vs. Dynamic Criticality: The CP method fails in Figure 9 because it relies on a pre-computed baseline. In our simulation, the stochastic insertion of rework nodes frequently alters the critical path during execution, rendering the initial CP calculation obsolete.
- Local vs. Global Optima: The HR strategy exhibits high variance because it executes a local greedy search. By fortifying nodes solely based on defect probability without considering the global network topology, it often misallocates resources to non-critical branches.
- Algorithmic Robustness: In contrast, the low IQR of H-TS-CDBO confirms its algorithmic capability to internally simulate these topological shifts, thereby identifying “structural hubs” that remain critical even under stochastic perturbations.
4.4. Sensitivity Analysis of Weights: Unveiling Trade-Offs via Carbon Tax Modulation
To address the concern regarding the potential opacity of the Generalized Total Cost (GTC) formulation and to rigorously evaluate the sensitivity of the model to weighting parameters, this section conducts a dynamic sensitivity analysis on the J120 dataset. Specifically, we modulate the carbon tax rate (), which functions mathematically as the “shadow price” or weighting coefficient for the environmental objective within the GTC function. Although real-world carbon pricing involves complex regional disparities, this study adopts a “Scenario-Based Static Pricing” approach to isolate the impact of regulatory intensity. By varying this parameter across the interval [0, 100] in increments of 20, we explicitly simulate a broad spectrum of global regulatory environments, ranging from loose constraints (typical of developing regions) to stringent penalties (comparable to high-standard thresholds in Nordic countries). This design allows us to reveal the latent trade-offs that might otherwise be obscured by a static scalar index.
The averaged results, presented in Figure 10, demonstrate that the “single-indicator” GTC does not mask conflicting objectives; rather, it internalizes them through a responsive pricing mechanism. As illustrated in Figure 10a, the relationship between optimal checkpoint density and the carbon weight exhibits a strictly monotonic increase. Under a low-weight regime (Low Tax), the solver prioritizes immediate cost efficiency, adopting a “Low-Frequency” inspection mode (8 checkpoints). Conversely, as the environmental weight escalates (High Tax), the system autonomously transitions to a “High-Frequency” mitigation paradigm (21 checkpoints, a 160% increase). This trajectory explicitly maps the Pareto frontier: the model trades off higher upfront inspection costs to secure lower long-term carbon liabilities, proving that the GTC structure remains sensitive to stakeholder preferences.
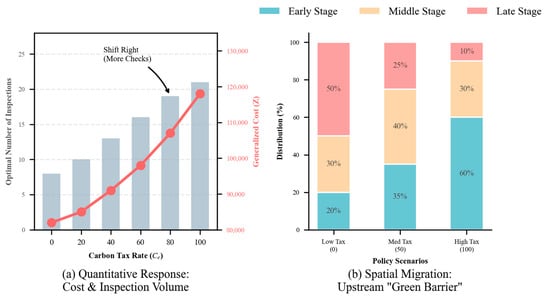
Figure 10.
Sensitivity analysis of the optimal inspection strategy to the carbon tax rate.
Furthermore, the spatio-temporal analysis in Figure 10b reveals that increasing the environmental weight induces a qualitative reconfiguration of the resource allocation layout. Most notably, the allocation of inspection nodes to upstream (early-stage) phases escalates from 20% to 60%. This reallocation signifies a decisive paradigm shift from “terminal inspection” to “early-stage intervention.” This “upstream migration” serves as an algorithmic countermeasure against the “Carbon Accumulation Effect.” Unlike static scheduling models, the proposed framework demonstrates a “Proactive Prevention” capability. By intercepting risks at the source, it precludes the exponential accumulation of embodied carbon caused by cascading rework in later stages. Consequently, this sensitivity analysis validates that the GTC model possesses high transparency and practical interpretability: it successfully simulates rational engineering responses to varying regulatory pressures, ensuring that the equilibrium between economic feasibility and environmental sustainability is dynamically adjustable rather than statically fixed.
5. Illustrative Case Study Verification and Analysis
5.1. Case Background and Parameter Settings
To validate the practical applicability of the proposed framework and rigorously demonstrate its topological interception mechanism, a representative prefabricated assembly module was selected as an illustrative case study. While full-scale construction projects typically encompass hundreds of activities, this study intentionally isolates a critical path segment (comprising 12 key nodes) to provide a clear, educational demonstration of the “rework cascade” phenomenon. This scale allows for a precise visualization of how algorithmic interventions sever defect propagation chains without the confounding noise of large-scale heterogeneity.
The optimization objective is strictly defined as the minimization of the Total Generalized Cost, with specific project parameters enumerated in Table 8. For the purpose of international understanding, monetary values are converted to US Dollars (USD) at an approximate exchange rate of 1 USD = 7.20 CNY. The cost coefficients were calibrated as follows: the unit temporal cost—aggregating management overheads and penalty fees—is fixed at 5.0 kCNY (approx. $694)/day; the unit prevention cost associated with intelligent inspection is set at 12.0 kCNY (~$1667); and the unit failure cost, encompassing comprehensive demolition and reconstruction expenses, is valued at 125.0 kCNY (~$17,361).
Table 8.
Detailed Project Activities and Logical Parameters.
5.2. Analysis of Optimization Results Based on Generalized Total Cost
5.2.1. Comparative Analysis of Strategic Efficacy
Guided by the precedence logic defined in Table 9, the H-TS-CDBO algorithm was utilized to perform global optimization. Figure 11 illustrates the comparative simulation outcomes of two distinct strategic approaches. The Baseline Strategy (Figure 11a) exhibits the “Late Rework Cascade” phenomenon, exposing a critical structural deficit: the absence of active intervention during the pivotal 1F Hoisting stage. In this scenario, latent defects originating from upstream tasks, such as Foundation Pouring or Wall Grouting, propagate downstream without interception. These accumulated errors eventually trigger the activation condition for Activity L (Rework), resulting in a mandatory 10-day bottleneck during the terminal phase. Quantitative analysis (Table 8) underscores a severe cost–benefit asymmetry: while zero capital is allocated to prevention, the strategy incurs a substantial failure penalty of 125.0 kCNY (approx. $17,361). Compounding this issue, the extended makespan (reaching 50 days) escalates time-dependent indirect costs to 250.0 kCNY (approx. $34,722), culminating in a prohibitive total expenditure of 375.0 kCNY (approx. $52,083).
Table 9.
Generalized Total Cost Comparison under Different Strategies.
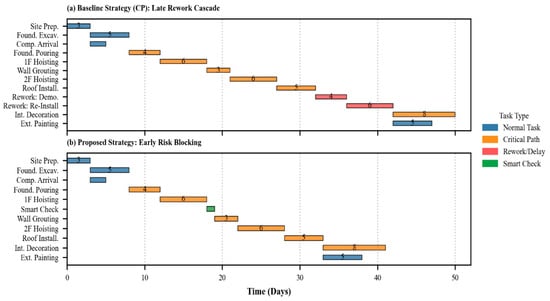
Figure 11.
Comparative construction schedules: Baseline vs. Proposed Strategy.
Conversely, Figure 11b depicts the proposed “Early Risk Blocking” strategy, wherein the H-TS-CDBO algorithm identifies the optimal equilibrium between preventive investment and potential failure losses. Moving beyond passive reactivity, this model mandates the deployment of intelligent inspection protocols at key topological nodes. The efficacy of this intervention is empirically validated: a marginal preventive outlay of 12.0 kCNY (approx. $1667) effectively averts potential losses of 125.0 kCNY (approx. $17,361). Concurrently, the project duration contracts to 42 days, reducing temporal costs to 210.0 kCNY (approx. $29,167) and resulting in a total cost of 222.0 kCNY (approx. $30,833). Relative to the baseline, this approach achieves a 40.8% cost reduction, thereby empirically validating the superiority of source-based mitigation over retrospective remediation.
5.2.2. Mechanism of Rework Elimination and Reality Discussion
It is imperative to clarify the physical mechanism by which the proposed strategy achieves the apparent non-existence of rework for critical tasks (e.g., Tasks 4 and 6). The elimination of the extensive rework associated with Activity L is not a stochastic anomaly but a deterministic result of the Double-Trigger Interception logic defined in Section 2.5. The deployed inspection node functions as a quality filter, detecting deviations () immediately upon task completion. Rather than allowing the defect to propagate and compound into a structural failure requiring demolition (Activity L), the system triggers a localized, low-cost rectification process. The cost and time associated with this minor correction are implicitly absorbed into the prevention cost and the inspection duration. Therefore, the disappearance of Activity L represents the successful transformation of a high-impact failure cost into a manageable prevention cost.
However, the gap between this simulated ideal and onsite reality must be acknowledged. The complete avoidance of rework demonstrated in Figure 11b is contingent upon the assumption of high-reliability detection. In the simulation, intelligent inspection is assumed to possess a high probability of identifying defects, based on the cost setting of 12.0 kCNY which implies the use of advanced Non-Destructive Testing (NDT) techniques. In real-world scenarios, if inspection technology is inadequate (e.g., characterized by high false-negative rates) or if defects are strictly latent, the interception mechanism may fail, rendering the prevention of rework impossible. Thus, the proposed strategy represents the optimal theoretical boundary; its practical success depends strictly on the technological capability to ensure that detection probability exceeds the critical risk threshold.
5.3. Engineering Management Implications for Industrial Applications
To complement theoretical validation, this section synthesizes practical managerial insights directly derived from the empirical results. These strategies integrate the proposed bi-level optimization logic with existing literature to offer technical guidance for navigating the complexities of prefabricated construction.
- Strategic Adoption of Ex Ante Topological Interception: Conventional scheduling methodologies frequently rely on static critical path analysis, which significantly overlooks the stochastic nature of defect propagation. Simulation results presented in Section 5.2 demonstrate that rework is not merely a probabilistic event but a topological cascade. Consequently, the strategic placement of inspection nodes functions as a quality firewall, mathematically severing the transmission paths of cascading failure risks. This technical finding aligns with the dynamic scheduling principles discussed by Ma et al. [18], who emphasized that identifying nodes subject to iterative modification is crucial for managing rework scenarios. Furthermore, this finding extends the topological reconstruction approach proposed by Peng et al. [19], providing a quantifiable method to locate optimal interception points within the quality transmission network. Accordingly, practitioners should shift from passive ex-post remediation to proactive ex ante topological intervention. Resources should not be distributed evenly but rather concentrated on structural hubs—nodes with high centrality in the quality transmission network—to maximize the return on prevention investment.
- Optimization of the Equilibrium between Prevention and Failure Costs via Bi-level Decisions: Comparative analysis (Table 8) reveals that minimizing immediate costs often leads to suboptimal global outcomes due to the iceberg effect of hidden failure liabilities. The proposed H-TS-CDBO solver addresses this challenge by resolving the Stackelberg game between upper-level investment (prevention) and lower-level scheduling (failure response), thereby identifying a dynamic equilibrium that static heuristics fail to capture. This result corroborates the multi-objective optimization framework constructed by Song et al. [11], which validated the necessity of synchronizing constraints regarding cost, quality, and time. However, unlike deterministic risk management models reviewed by Khodabakhshian et al. [8], the proposed bi-level framework dynamically integrates schedule delays into the cost function, offering a more rigorous valuation of time-dependent risks in uncertain environments. Therefore, project managers must employ comprehensive evaluation frameworks to strictly balance preventive investments against potential failure liabilities, relying on data-driven solvers to identify the optimal trade-off point where the marginal cost of prevention equals the marginal reduction in risk.
- Adaptive Response to Low-Carbon Regulations through Structural Migration: Our sensitivity analysis (Section 4.4) uncovered a distinct “Structural Migration” phenomenon: as carbon tax rates rise, the optimal inspection strategy autonomously shifts upstream, with early-stage allocation increasing from 20% to 60%. This is an algorithmic response to the “Carbon Accumulation Effect,” where downstream rework incurs exponentially higher embodied carbon debts due to material waste and demolition energy. This finding resonates with the “efficiency window” identified by Guo et al. [12], who highlighted the synergy between economic and environmental dimensions in prefabrication. Crucially, this responsiveness validates the robustness of the framework across diverse geographic and market contexts. Although demonstrated here via an illustrative case study, the model possesses inherent scenario adaptability: variations in regional “energy mixes” (e.g., coal-intensive vs. renewable grids) or local market conditions (e.g., labor costs) are mathematically mapped to changes in emission factors and penalty coefficients. By dynamically recalibrating the inspection topology in response to these parametric shifts, the solver demonstrates its capability to maintain optimality across heterogeneous regulatory landscapes without requiring structural reformulation. This mechanism provides quantitative support for the lifecycle assessment principles advocated by Peng et al. [17], demonstrating how abstract emission metrics () can be translated into tangible operational adjustments within the nexus of duration, cost, and sustainability. Consequently, construction enterprises must transition to dual-control mechanisms for cost and carbon. Managers should utilize this framework as a policy-response simulator, dynamically calibrating inspection intensity to align with evolving emission quotas. In conclusion, by leveraging the rigorous structure–mapping–optimization protocol, the H-TS-CDBO framework serves as a unified quantitative platform that empowers decision-makers to navigate these multidimensional trade-offs among quality, cost, and sustainability.
- Operational Guidelines for Digital Implementation in BIM/4D Systems: To address the barrier of mathematical complexity and facilitate industrial adoption, this study proposes a digital integration framework that serves as a seamless decision support workflow within Building Information Modeling (BIM) environments. The implementation process follows a structured three-stage data flow. First, utilizing Industry Foundation Classes (IFC) standards, geometric quantities and precedence constraints are extracted automatically from 3D BIM models to initialize the problem instance, thereby eliminating the error-prone manual entry of complex parameters. Second, the bi-level H-TS-CDBO solver functions as a “black-box” backend engine. As evidenced in Section 4.2, the algorithm converges for high-complexity instances (J120) in approximately 343 s; this computational efficiency indicates that the processing load is negligible relative to the project duration, enabling real-time “What-If” scenario analysis without disrupting on-site operations. Third, the optimized schedule and specific inspection nodes are mapped back to the 4D BIM environment. This visualization allows managers to identify components requiring “Active Interception” (e.g., highlighting specific wall panels for non-destructive testing) directly within the simulation. By encapsulating theoretical complexity within this digital pipeline, the framework transforms into an accessible operational tool, enabling practitioners to execute low-carbon, high-quality scheduling with minimal technical barriers.
- Adaptive Implementation Strategies under Data Scarcity and Computational Constraints: Although the comprehensive bi-level framework is predicated on precise parametric inputs, practitioners operating in resource-constrained environments may adopt a “Hierarchical Simplification Strategy.” First, regarding limited data availability, exact probability distributions for defect rates (such as the Truncated Normal Distribution employed in the simulations) are frequently inaccessible during early project phases. In such scenarios, project managers can substitute continuous variables with discrete interval estimates derived from historical “Pass/Fail” records. By leveraging the “Worst-Case” scenario analyzed in Section 4.2.2, a conservative safety baseline can be established. Second, with respect to limited computational resources, the execution of a global H-TS-CDBO search for every minor schedule adjustment is not mandatory. Instead, practitioners can leverage the “Pareto Principle of Topology” identified in this study. Given that 60% of optimal inspection nodes are concentrated within upstream structural phases (as detailed in Section 4.4), managers should heuristically prioritize these high-centrality “structural hubs” for inspection. This simplified approach secures the majority of risk-mitigation benefits—specifically by severing the most detrimental rework chains—without requiring real-time algorithmic resolution, thereby ensuring the accessibility of the framework even in low-digitalization environments.
6. Conclusions
To reconcile the conflicting demands of agile, flexible production and rigid low-carbon constraints in prefabricated construction, this study establishes a hybrid evolutionary scheduling framework designed to disrupt cascading rework chains while synergizing quality, cost, and carbon control. This framework is operationalized via a bi-level Generalized Total Cost (GTC) optimization model, conceptually grounded in a Stackelberg leader–follower game, and solved using the novel H-TS-CDBO algorithm. By combining the global exploration capabilities of CDBO with the local refinement mechanisms of TS, the proposed solver effectively resolves the topological complexities induced by proactive interventions. Benchmarking against the extended PSPLIB dataset validates the computational efficiency and robustness of the solver. In high-complexity scenarios, the proposed method demonstrates superior tractability and convergence stability compared to conventional meta-heuristics (such as GA, PSO, and DE), thereby avoiding the “topological entrapment” that frequently leads to premature convergence in static solvers.
Complementing these general performance metrics, specific empirical analysis of the representative 1F Hoisting scenario confirms a high-leverage management insight within this illustrative context: the targeted application of intelligent inspection accounts for a marginal 5.4% of the total budget yet functions as a “quality firewall,” effectively severing the rework propagation chain and yielding a net GTC reduction of 40.8%. While the precise magnitude of economic savings may vary across heterogeneous project topologies, the consistent convergence superiority observed in the extensive PSPLIB benchmarking (spanning J30 to J120 instances) supports the broader applicability of this topological interception mechanism. Furthermore, sensitivity analysis reveals a distinct phenomenon of structural migration: increasing carbon taxation drives the optimal inspection strategy to autonomously shift toward upstream processes (with early-stage allocation increasing from 20% to 60%). This algorithmic response validates the framework as an adaptive decision-support tool capable of proactively mitigating the carbon accumulation effect by intercepting defects before they accrue prohibitive embodied carbon debts.
Theoretically, this study moves beyond numerical optimization to construct a bi-level programming framework that mathematically bridges strategic inspection planning and operational low-carbon scheduling. By integrating quality inspection, rework chains, and multi-source carbon emissions, it bridges the gap in coupled risk–cost–carbon decision-making. A primary methodological contribution is the development of the Structure–Mapping–Optimization protocol rooted in the macro-activity-encoding strategy. By decoupling discrete topological decision variables from continuous scheduling constraints, this mechanism mitigates the complexity of network reconstruction during the proactive insertion of inspection nodes. Crucially, these findings extend the theoretical boundaries of Lean Construction by redefining rework management: moving from the traditional “buffer management” approach (tolerating waste) to a “source elimination” paradigm (Zero Defects). Furthermore, the proposed topological interception mechanism contributes to Resilience Engineering theory, demonstrating that strategic redundancy (checkpoints) creates a “safe-fail” system structure that is significantly more robust than the brittle efficiency of traditional Critical Path Method (CPM) schedules.
However, several limitations inherent in the current modeling assumptions warrant detailed scrutiny to delineate the boundaries of applicability. First, the study assumes ideal inspection reliability, thereby excluding the impact of stochastic errors, such as false negatives in non-destructive testing (NDT) equipment. Second, regarding the rework chain mechanism, the model assumes a simplified sequential dependency structure between components. While the sub-quality index () aggregates operational uncertainties, it lacks a specific dynamic probabilistic distribution to govern defect propagation, thus partially neglecting real-world site variability such as human error, extreme weather conditions, upstream supply chain delays, or latent manufacturing defects. Third, economic variables (e.g., carbon tax) are modeled as deterministic constants, limiting the ability to hedge against extreme market volatility. Fourth, although the extended PSPLIB dataset validates algorithmic performance, empirical verification is restricted to a single project context, presenting a potential risk of idealization regarding external validity across heterogeneous typologies. Future research will address these limitations through three specific extensions: (1) Modeling “Imperfect Inspection” by introducing Type I/II error matrices to simulate real-world NDT reliability; (2) Addressing “Stochastic Market Conditions” by coupling the GTC model with dynamic carbon pricing forecasts to hedge against volatility; and (3) Achieving “Digital-Twin Integration” to enable the real-time synchronization of site parameters with the optimization engine. Ultimately, the goal is to establish a closed-loop sensing–decision–execution system, utilizing deep reinforcement learning (DRL) to enable adaptive rescheduling in response to dynamic engineering uncertainties.
Author Contributions
Conceptualization, Y.T. and Y.Y.; Data curation, Y.T.; Formal analysis, Y.T.; Funding acquisition, Y.Y.; Investigation, Y.T. and X.L.; Methodology, Y.T. and Y.Y.; Project administration, Y.Y.; Resources, Y.Y.; Software, Y.T. and X.L.; Supervision, Y.Y.; Validation, Y.T. and X.L.; Visualization, Y.T. and X.L.; Writing—original draft, Y.T.; Writing—review and editing, Y.T., X.L. and Y.Y. All authors have read and agreed to the published version of the manuscript.
Funding
This research was supported by the Shaanxi Provincial Sports Bureau Project (2025)—Research on Winter Sports Driving the Sports Industry: Research on the Integrated Development Path of Winter Sports and Cultural Tourism Industry in Shaanxi Province under the Background of Rural Revitalization (Project No. 20250823).
Data Availability Statement
The data supporting the findings of this study are not publicly available due to privacy and ethical restrictions.
Acknowledgments
We would like to thank the esteemed reviewers for their constructive comments and valuable suggestions, which have significantly enhanced the quality of this manuscript.
Conflicts of Interest
The authors declare no conflicts of interest.
References
- Aghasizadeh, S.; Tabadkani, A.; Hajirasouli, A.; Banihashemi, S. Environmental and economic performance of prefabricated construction: A review. Environ. Impact Assess. Rev. 2022, 97, 106897. [Google Scholar] [CrossRef]
- Wu, X.; Han, J.; Cui, H.; Li, T.; Bai, X.; He, Y.; Liu, N. A comparative review of recent research progress in prefabricated buildings in China and other countries. Buildings 2024, 14, 1062. [Google Scholar] [CrossRef]
- Liu, R.; Piplani, R.; Toro, C. Deep reinforcement learning for dynamic scheduling of a flexible job shop. Int. J. Prod. Res. 2022, 60, 4049–4069. [Google Scholar] [CrossRef]
- Hu, S.; Zhang, Y.; Yang, Z.; Yan, D.; Jiang, Y. Challenges and opportunities for carbon neutrality in China’s building sector—Modelling and data. Build. Simul. 2022, 15, 1899–1921. [Google Scholar] [CrossRef]
- Khan, A.A.; Yu, R.; Liu, T.; Gu, N.; Walsh, J. Volumetric modular construction risks: A comprehensive review and digital-technology-coupled circular mitigation strategies. Sustainability 2023, 15, 7019. [Google Scholar] [CrossRef]
- Mahamid, I. Impact of rework on material waste in building construction projects. Int. J. Constr. Manag. 2022, 22, 1500–1507. [Google Scholar] [CrossRef]
- Dixit, M.K.; Venkatraj, V.; Pariafsai, F.; Bullen, J. Site logistics factors impacting resource use on construction sites: A Delphi study. Front. Built Environ. 2022, 8, 858135. [Google Scholar] [CrossRef]
- Khodabakhshian, A.; Puolitaival, T.; Kestle, L. Deterministic and probabilistic risk management approaches in construction projects: A systematic literature review and comparative analysis. Buildings 2023, 13, 1312. [Google Scholar] [CrossRef]
- Qiu, J.; Zhao, J.; Wen, F.; Zhao, J.; Gao, C.; Zhou, Y.; Tao, Y.; Lai, S. Challenges and pathways of low-carbon oriented energy transition and power system planning strategy: A review. IEEE Trans. Netw. Sci. Eng. 2023, 11, 5396–5416. [Google Scholar] [CrossRef]
- Houssein, E.H.; Saeed, M.K.; Hu, G.; Al-Sayed, M.M. Metaheuristics for solving global and engineering optimization problems: Review, applications, open issues and challenges. Arch. Comput. Methods Eng. 2024, 31, 4485–4519. [Google Scholar] [CrossRef]
- Song, H.; Chen, X.; Wang, H. Carbon Emission Optimization for Assembled Buildings Using Interval Grey GERT Modelling and Modify NSGA-III Algorithm in China. KSCE J. Civ. Eng. 2024, 28, 5415–5426. [Google Scholar] [CrossRef]
- Guo, F.; Zhang, Y.; Chang, C.; Yu, Y. Carbon emissions of assembly buildings constrained by flexible resource: A study on cost optimization. Buildings 2022, 13, 90. [Google Scholar] [CrossRef]
- Zhang, R.; Feng, X.; Mou, Z.; Zhang, Y. Green optimization for precast production rescheduling based on disruption management. J. Clean. Prod. 2023, 420, 138406. [Google Scholar] [CrossRef]
- Verma, S.; Pant, M.; Snasel, V. A comprehensive review on NSGA-II for multi-objective combinatorial optimization problems. IEEE Access 2021, 9, 57757–57791. [Google Scholar] [CrossRef]
- Azamfirei, V.; Psarommatis, F.; Lagrosen, Y. Application of automation for in-line quality inspection, a zero-defect manufacturing approach. J. Manuf. Syst. 2023, 67, 1–22. [Google Scholar] [CrossRef]
- Aramesh, S.; Mousavi, S.M.; Ghasemi, M.; Shahabi-Shahmiri, R. An optimization model for construction project scheduling by considering CO2 emissions with multi-mode resource constraints under interval-valued fuzzy uncertainty. Int. J. Environ. Sci. Technol. 2023, 20, 87–102. [Google Scholar] [CrossRef]
- Peng, J.; Feng, Y.; Zhang, Q.; Liu, X. Multi-objective integrated optimization study of prefabricated building projects introducing sustainable levels. Sci. Rep. 2023, 13, 2821. [Google Scholar] [CrossRef]
- Ma, G.; Jiang, S.; Zhu, T.; Jia, J. A novel method of developing construction projects schedule under rework scenarios. Sustainability 2019, 11, 5710. [Google Scholar] [CrossRef]
- Peng, J.; Su, Z.; Liu, X. Multi skill project scheduling optimization based on quality transmission and rework network reconstruction. Sci. Rep. 2025, 15, 13545. [Google Scholar] [CrossRef]
- Xue, J.; Shen, B. Dung beetle optimizer: A new meta-heuristic algorithm for global optimization. J. Supercomput. 2023, 79, 7305–7336. [Google Scholar] [CrossRef]
- Hu, W.; Zhang, Q.; Ye, S. An enhanced dung beetle optimizer with multiple strategies for robot path planning. Sci. Rep. 2025, 15, 4655. [Google Scholar] [CrossRef] [PubMed]
- Liu, K.; Dai, Y.; Liu, H. Improvement of Dung Beetle Optimization Algorithm Application to Robot Path Planning. Appl. Sci. 2025, 15, 396. [Google Scholar] [CrossRef]
- Duan, T.; Wang, W.; Wang, T.; Chen, X.; Li, X. Dynamic tasks scheduling model of UAV cluster based on flexible network architecture. IEEE Access 2020, 8, 115448–115460. [Google Scholar] [CrossRef]
- Li, Z.; Xiao, P.; Pan, J.; Pei, W.; Lv, A. Energy management strategy for methanol hybrid commercial vehicles based on improved dung beetle algorithm optimization. PLoS ONE 2025, 20, e0313303. [Google Scholar] [CrossRef]
- Gu, W.; Wang, F. A multi-strategy improved dung beetle optimisation algorithm and its application. Clust. Comput. 2025, 28, 49. [Google Scholar] [CrossRef]
- Hussein, M.; Eltoukhy, A.E.; Karam, A.; Shaban, I.A.; Zayed, T. Modelling in off-site construction supply chain management: A review and future directions for sustainable modular integrated construction. J. Clean. Prod. 2021, 310, 127503. [Google Scholar] [CrossRef]
- Yang, S.; Hou, Z.; Chen, H. Network model analysis of quality control factors of prefabricated buildings based on the complex network theory. Buildings 2022, 12, 1874. [Google Scholar] [CrossRef]
- Yang, B.; Jiang, S.; Dong, M.; Zhu, D.; Han, Y. Graph database and matrix-based intelligent generation of the assembly sequence of prefabricated building components. Appl. Sci. 2023, 13, 9834. [Google Scholar] [CrossRef]
- Luo, X.; Chen, Q.; Deng, C.; Luo, W.; He, Y. Low-cyclic reversed loading tests on full-scale precast concrete composite wall connected by tooth groove and grouted sleeve. Materials 2024, 17, 476. [Google Scholar] [CrossRef]
- Guo, F.; Li, J.; He, S.; Zhou, C. Experimental Study on the Effect of Grouting Defects on Mechanical Properties of the Rebar Connected by Full-Grouted Sleeves. Adv. Civ. Eng. 2022, 2022, 5036505. [Google Scholar] [CrossRef]
- Buitrago, M.; Makoond, N.; Moragues, J.J.; Sagaseta, J.; Adam, J.M. Robustness of a full-scale precast building structure subjected to corner-column failure. Structures 2023, 52, 824–841. [Google Scholar] [CrossRef]
- Rinne, R.; Ilgın, H.E.; Karjalainen, M. Comparative study on life-cycle assessment and carbon footprint of hybrid, concrete and timber apartment buildings in Finland. Int. J. Environ. Res. Public Health 2022, 19, 774. [Google Scholar] [CrossRef] [PubMed]
- Hoxha, E.; Maierhofer, D.; Saade, M.R.M.; Passer, A. Influence of technical and electrical equipment in life cycle assessments of buildings: Case of a laboratory and research building. Int. J. Life Cycle Assess. 2021, 26, 852–863. [Google Scholar] [CrossRef]
- Chen, K.; Wang, J.; Yu, B.; Wu, H.; Zhang, J. Critical evaluation of construction and demolition waste and associated environmental impacts: A scientometric analysis. J. Clean. Prod. 2021, 287, 125071. [Google Scholar] [CrossRef]
- Hartmann, S.; Briskorn, D. An updated survey of variants and extensions of the resource-constrained project scheduling problem. Eur. J. Oper. Res. 2022, 297, 1–14. [Google Scholar] [CrossRef]
- Kabirifar, K.; Mojtahedi, M.; Wang, C.; Tam, V.W.Y. Construction and demolition waste management contributing factors coupled with reduce, reuse, and recycle strategies for effective waste management: A review. J. Clean. Prod. 2020, 263, 121265. [Google Scholar] [CrossRef]
- Qin, Y.; Qi, Q.; Shi, P.; Scott, P.J.; Jiang, X. A novel weighted averaging operator of linguistic interval-valued intuitionistic fuzzy numbers for cognitively inspired decision-making. Cogn. Comput. 2023, 15, 2101–2119. [Google Scholar] [CrossRef]
- Glover, F. Future paths for integer programming and links to artificial intelligence. Comput. Oper. Res. 1986, 13, 533–549. [Google Scholar] [CrossRef]
- Speranza, M.G.; Vercellis, C. Hierarchical models for multi-project planning and scheduling. Eur. J. Oper. Res. 1993, 64, 312–325. [Google Scholar] [CrossRef]
- Bean, J.C. Genetic algorithms and random keys for sequencing and optimization. ORSA J. Comput. 1994, 6, 154–160. [Google Scholar] [CrossRef]
- Liu, J.; Chen, J.; Tian, J.; Li, Y. An Efficient Random Key–Based Genetic Algorithm for Solving Multimode Resource-Constrained Project Scheduling Problem. J. Constr. Eng. Manag. 2025, 151, 04025193. [Google Scholar] [CrossRef]
- Kolisch, R. Serial and parallel resource-constrained project scheduling methods revisited: Theory and computation. Eur. J. Oper. Res. 1996, 90, 320–333. [Google Scholar] [CrossRef]
- Kara, K.; Yalçın, G.C.; Simic, V.; Önden, I.; Edinsel, S.; Bacanin, N. A single-valued neutrosophic-based methodology for selecting warehouse management software in sustainable logistics systems. Eng. Appl. Artif. Intell. 2024, 129, 107626. [Google Scholar] [CrossRef]
- Alatas, B. Chaotic bee colony algorithms for global numerical optimization. Expert Syst. Appl. 2010, 37, 5682–5687. [Google Scholar] [CrossRef]
- Taguchi, G. Quality engineering (Taguchi methods) for the development of electronic circuit technology. IEEE Trans. Reliab. 2002, 44, 225–229. [Google Scholar] [CrossRef]
- Huang, C.; Li, Y.; Yao, X. A survey of automatic parameter tuning methods for metaheuristics. IEEE Trans. Evol. Comput. 2019, 24, 201–216. [Google Scholar] [CrossRef]
- Chalupa, D. On transitions in the behaviour of tabu search algorithm TabuCol for graph colouring. J. Exp. Theor. Artif. Intell. 2018, 30, 53–69. [Google Scholar] [CrossRef]
- Centeno-Telleria, M.; Zulueta, E.; Fernandez-Gamiz, U.; Teso-Fz-Betoño, D.; Teso-Fz-Betoño, A. Differential evolution optimal parameters tuning with artificial neural network. Mathematics 2021, 9, 427. [Google Scholar] [CrossRef]
- Cococcioni, M.; Fiaschi, L. The Big-M method with the numerical infinite M. Optim. Lett. 2021, 15, 2455–2468. [Google Scholar] [CrossRef]


Disclaimer/Publisher’s Note: The statements, opinions and data contained in all publications are solely those of the individual author(s) and contributor(s) and not of MDPI and/or the editor(s). MDPI and/or the editor(s) disclaim responsibility for any injury to people or property resulting from any ideas, methods, instructions or products referred to in the content. |
© 2026 by the authors. Licensee MDPI, Basel, Switzerland. This article is an open access article distributed under the terms and conditions of the Creative Commons Attribution (CC BY) license.