Abstract
Building-integrated photovoltaics (BIPVs) can substantially increase renewable electricity utilization in buildings under China’s “dual-carbon” targets. Yet, fixed photovoltaic (FPV) windows cannot respond to seasonal and diurnal variations in solar altitude and azimuth, limiting their ability to jointly optimize power generation, shading, and solar heat gains. This study proposes a shading-type sun-tracking photovoltaic (STPV) window for south-facing residential glazing and evaluates its annual performance for a detached house in Hangzhou (hot-summer and cold-winter climate). Representative clear-sky field measurements were combined with annual EnergyPlus simulations to quantify PV yield, radiation regulation, and impacts on air-conditioning (HVAC) and lighting electricity use. STPV windows deliver an additional annual PV gain of ~336 kWh relative to FPV windows, mainly during transition seasons and around summer noon. Using the no-shading case as the baseline (4967 kWh/year), FPV windows reduce total electricity use to 4010 kWh (−957 kWh), while STPV windows further reduce it to 3281 kWh (−1686 kWh), providing an extra −729 kWh versus FPV. Accounting for PV generation, the annual net electricity demand decreases from 2929 kWh (FPV) to 1864 kWh (STPV), i.e., −1065 kWh (36.4%). These results highlight the synergy of tracking-enabled generation enhancement and cooling-load reduction for façade PV in Hangzhou-like climates.
1. Introduction
Under China’s “dual carbon” targets, the efficient utilization of renewable energy in the building sector is widely regarded as a critical technological pathway to reduce urban energy consumption and carbon emissions [1]. Solar photovoltaic (PV) technology, owing to its cleanliness and renewability, has demonstrated strong application potential within building energy systems. However, in highly urbanized contexts, rooftop and site resources for residential buildings are generally limited, which constrains the large-scale deployment of conventional rooftop PV systems [2]. In contrast, integrating PV systems into building façades or exterior window components to exploit solar resources on vertical surfaces has increasingly become an important development direction for building-integrated photovoltaics (BIPV) [3].
In recent years, studies on PV integration into building envelopes have mainly focused on fixed photovoltaic (FPV) windows, PV louvers, and semi-transparent PV components, with analyses conducted in terms of electricity generation, daylighting conditions, and thermal performance [4,5]. Existing research indicates that appropriate configuration of PV orientation and tilt can improve annual electricity yield and, to some extent, regulate building energy consumption. Nevertheless, FPV systems in practice cannot adapt to the dynamic annual variations in solar altitude and azimuth angles. This limitation is particularly pronounced in hot-summer and cold-winter (HSCW) climate regions, where summer shading demands and winter solar heat-gain requirements are difficult to satisfy simultaneously [4]. Existing BIPV-window studies have provided valuable evidence on PV yield, daylighting, and thermal behavior, and some have considered HVAC and/or lighting impacts. However, most remain focused on specific subsystems, operating periods, or single performance dimensions. For dynamically controlled tracking windows, a unified annual-scale framework linking PV generation gain, solar-radiation regulation, and whole-building electricity use (HVAC + lighting + net demand) is still limited, particularly for detached houses in HSCW climates such as Hangzhou [6,7].
Hangzhou is a representative city in the HSCW climate zone. Residential buildings in Hangzhou typically face high cooling loads in summer while still requiring heating in winter. For detached houses, south-facing exterior windows receive relatively high solar irradiation throughout the year, making them a key interface for coordinated PV integration and external shading design. Under this climatic context, conventional FPV windows can deliver certain electricity-generation benefits; however, achieving an optimal year-round balance between shading performance and PV electricity production remains challenging, thereby limiting the energy-saving potential of PV-integrated windows in residential buildings.
Previous studies have shown that integrating PV systems into building façades not only affects the electricity generation of PV modules but also alters the incident solar radiation entering the building, thereby exerting an important influence on whole-building energy consumption. Zhang et al. [8] investigated Hong Kong and used EnergyPlus to simulate the electricity-generation potential of façade-integrated PV systems under different orientations and tilt angles. The results showed that when PV panels were installed on the south façade with a tilt angle of 30°, the annual electricity yield reached 174 kWh·m−2, approximately 30% higher than that of a west-facing configuration under comparable conditions, indicating that optimizing façade orientation and tilt plays a significant role in enhancing PV output.
Building on this, some studies have begun to focus on the optimal operating states of PV components across different temporal scales. Hu et al. [9] used simulations to systematically analyze the optimal tilt angles of PV louvers across summer, winter, and transitional seasons as well as different times of day (09:00–17:00), revealing the energy-saving potential of dynamically adjusting louver angles with season and hour. Hong et al. [10] proposed a bidirectional slat-control PV louver system combining blinds with PV modules, and conducted comparative experiments in a real office space between unidirectional and bidirectional control modes. Their results showed that bidirectional control improved electricity generation by approximately 85–111% compared with unidirectional control, demonstrating the advantages of dynamic control strategies in enhancing the overall performance of PV systems.
Furthermore, Gao et al. [11] introduced sun-tracking mechanisms into PV window systems and analyzed the optimal attitudes of STPV components by coupling three-dimensional rotation angles. The results indicated that, compared with conventional vertical sun-tracking approaches, the proposed tracking method increased annual electricity generation by about 27% and improved annual average photoelectric conversion efficiency by about 19%. Collectively, studies ranging from FPV façades to adjustable PV louvers and STPV systems have progressively revealed the potential benefits of dynamic control strategies for improving electricity generation from building-integrated PV. However, their comprehensive impacts on building energy consumption remain insufficiently investigated and warrant further systematic research.
Therefore, the central focus of this study is to develop and validate an experiment-calibrated equivalent modeling framework for STPV-integrated windows, and to quantify their integrated annual effect on PV generation, building electricity use, and net energy demand in Hangzhou detached housing.
2. Research Methodology
2.1. System Composition and Modeling Assumptions
The proposed STPV window system is illustrated in Figure 1 and is installed as an integrated assembly on the exterior side of the south-facing window of the residential building. Unlike a conventional FPV, the STPV system dynamically adjusts the orientation of the PV modules in response to variations in solar altitude and azimuth angles. This tracking capability increases the effective collection of incident solar radiation while simultaneously providing external shading.
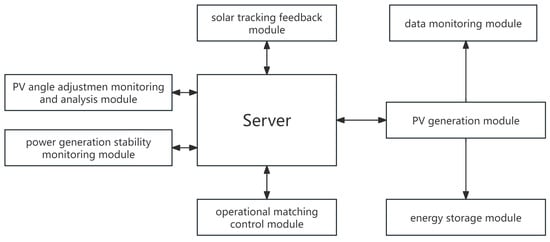
Figure 1.
STPV system structure.
The proposed STPV system is implemented as an external retrofit layer mounted outside the existing south-facing window, rather than replacing the original glazing unit. In practical application, the conventional window remains as the primary airtight and weatherproof envelope component, while the STPV assembly (mounting brackets, tracking PV modules, actuator, and controller) is installed on the exterior side of the façade. This strategy minimizes indoor disturbance and enables staged deployment in existing detached houses.
The retrofit process consists of four steps: on-site survey and structural check of the façade/window frame; installation and anchoring of the support brackets; alignment and commissioning of the tracking PV modules (south-facing reference; azimuth = 180°); and electrical wiring, controller setup, and safety verification. Under this configuration, the STPV unit functions as a dynamic external shading and power-generation layer, while the original window maintains enclosure performance. Therefore, the proposed solution is suitable for both new construction and retrofit projects, with good engineering adaptability.
To facilitate subsequent numerical simulations and experimental analyses and to reduce model complexity, the following assumptions are adopted in the system modeling process:
(1) Only the rotational motion of the PV modules is considered during operation; the effects of module thickness and the supporting bracket structure on solar shading/occlusion are neglected.
(2) All PV modules are assumed to share identical performance parameters, which remain constant throughout the simulation period.
(3) The response time of module rotation is assumed negligible compared with the rate of change in the solar trajectory; thus, the system is treated as operating in a quasi-steady state at each timestep.
These assumptions improve computational efficiency while preserving the validity of the overall assessment of the STPV window’s electricity-generation performance and its impact on building energy consumption.
2.2. Geometric Relationship and Parametric Description of the STPV Window System
The STPV window system is mounted on the exterior side of the south-facing window of the residential building and can be idealized as a rectangular plane perpendicular to the horizontal plane. Its geometric configuration is directly associated with the dimensions of the window opening. Taking a typical detached house in Hangzhou as the case study, the exterior window has a size of W × H. A set of PV module units is uniformly arranged outside the window frame (Figure 2).
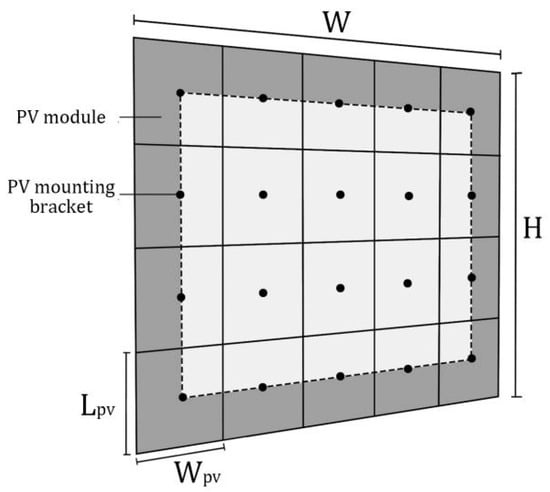
Figure 2.
The correlation between the parameters of solar photovoltaic panels and the size of windows.
For parametric modeling, the window plane is discretized into and equal divisions in the horizontal and vertical directions, respectively, where each cell corresponds to an independently rotatable PV module. Accordingly, the height and width of an individual PV module are given by Equations (1) and (2):
where and denote the module height and width, respectively. This parameterization enables flexible adjustment of the number and arrangement of PV modules under different window sizes, thereby improving the generalizability of the proposed design and the transferability of the findings.
2.3. Definition of Operating Modes for the STPV Window System
Considering the characteristics of solar availability and typical day–night occupancy patterns in residential buildings, the operating strategy of the STPV window system is categorized into two modes: a daytime operating mode and a nighttime operating mode.
In the daytime mode, the PV modules continuously adjust their orientation according to the instantaneous solar position, such that the module surface is maintained as close as possible to being normal to the incident solar beam. This strategy maximizes the captured solar irradiance and improves PV electricity-generation efficiency. Meanwhile, the STPV window forms a dynamic external shading interface in front of the glazing, which effectively attenuates direct solar radiation entering the indoor space and is therefore beneficial for reducing summertime cooling loads.
In the nighttime mode, the PV modules cease tracking and return to the initial position parallel to the window plane. In this state, the STPV window primarily acts as an additional envelope layer, reducing air and heat exchange between indoors and outdoors and providing an auxiliary thermal-insulation effect that can benefit indoor thermal conditions during winter.
The above operating-mode definitions serve as the unified control logic for the STPV window in the subsequent experimental measurements and EnergyPlus simulations.
In addition to daytime/nighttime mode switching, a practical tracking-delay parameter (τ) was introduced in the STPV control logic to represent sensing, communication, and actuator response lag in real operation. In the implemented prototype and simulations, τ was set to 1 min. During daytime operation, the module attitude at time t follows the target solar position computed at t–τ rather than at t. This treatment captures delay-induced deviations in instantaneous incidence angle and ensures consistency between the control logic used in field measurements and that used in annual simulation.
2.4. Data Screening and Pre-Processing
To ensure the reliability and reproducibility of the comparative analysis between STPVs and FPVs, the raw monitoring data were subjected to a unified screening and pre-processing procedure. The sampling interval was 10 min. All channels (solar irradiance, voltage, current, and environmental variables) were recorded with a common timestamp and synchronized during post-processing [12]. Identical pre-processing rules were applied to both the STPV and FPV datasets to avoid introducing subjective bias.
2.4.1. Timestamp Synchronization and Missing-Data Treatment
A consistency check of timestamps was first conducted for all channels. If sampling delays or timestamp drifts were detected across channels, a unified time axis was established using the solar-irradiance channel as the reference, and the remaining channels were resampled to a uniform 10 min series via linear interpolation. Missing values were handled according to the duration of data gaps. For short gaps of no more than two consecutive timesteps (≤20 min), linear interpolation was used for imputation. For longer gaps (>2 timesteps), the affected period was excluded from daily aggregation. The effective sample ratio was reported in the summary statistics to ensure transparency and traceability of the data coverage.
The exclusion of long missing-data segments (>20 min) improves integrity of daily integration but may shift the sample toward higher-quality days. To reduce bias, identical filtering rules were applied to STPVs and FPVs, and valid-data intersection windows were used for pairwise comparison. Nevertheless, calibration based on representative clear-sky days may overstate performance under highly variable weather; this is now stated as a methodological limitation, and multi-weather validation is planned in future work.
2.4.2. Physical-Range Constraints and Outlier Removal
To remove non-physical observations caused by sensor noise, transient shading, or communication errors, physical-range constraints were imposed on key variables [13]. Specifically, solar irradiance was required to satisfy ; voltage and current were required to satisfy V ≥ 0, I ≥ 0. The instantaneous electrical power computed as was further required to satisfy Any samples violating these constraints were classified as invalid and removed [14].
For potential spike noise, a robust sliding-window method was adopted. Using a three-point window as an example, a data point was flagged as a spike if its deviation from the window median exceeded a predefined threshold (three times the window standard deviation). Flagged spikes were replaced with the window median [15]. This procedure mitigates the disproportionate influence of isolated outliers on time integration while preserving the overall trend and diurnal characteristics of the time series [16].
2.4.3. Daily Aggregation and Statistical Basis for Comparison
After data cleaning, discrete time integration was used to compute daily cumulative quantities.
The daily electricity yield was obtained by integrating the power time series Equation (3):
The daily cumulative solar irradiation was obtained by integrating the irradiance time series Equation (4):
where ∆t = 10 min, denotes the integration time window.
To ensure a fair comparison between STPVs and FPVs, the integration window was defined as the intersection of valid-data periods from the two systems; that is, integration and aggregation were performed only over timesteps for which both datasets were available [15]. This avoids overestimation or underestimation of cumulative values caused by missing data in either system. Finally, the daily cumulative irradiation and electricity yield of the two systems were compared, and the results were used for subsequent model calibration and for constructing the equivalent-gain mapping applied in the annual simulations.
2.5. Clear-Sky Day Identification Criteria
Solar irradiance is highly sensitive to cloud cover. Intermittent cloud shading can induce high-frequency fluctuations in both irradiance and power-output time series, thereby masking performance differences attributable to tracking control and module attitude regulation [17]. To reduce the confounding effects of weather variability, representative clear-sky days were selected from the measured dataset for the performance evaluation and model calibration of STPVs and FPVs. Clear-sky identification was based on a combined set of criteria—irradiance intensity level, intra-day stability, short-term fluctuation characteristics, and effective sunshine duration—to avoid selection bias associated with subjective judgment or a single indicator [18].
Specifically, candidate days were first required to meet an irradiance-intensity threshold, namely that the daily peak irradiance exceeds a preset value (summer: ≥800 W/m2; winter: ≥600 W/m2), in order to exclude rainy or heavily overcast conditions [19]. In addition, the cumulative duration with W/m2 was required to be no less than 6 h to ensure that daily integration is representative. To characterize the smoothness of the irradiance profile, the coefficient of variation in irradiance was computed over the daytime effective period T (summer: 07:00–18:00; winter: 08:00–17:00) as Equation (5)
where and are the mean and standard deviation of irradiance over T, respectively. A day was regarded as exhibiting clear-sky-like stability when ≤ 0.25 [13].
Because some “intermittently cloudy” days may still satisfy the peak-intensity criterion while exhibiting frequent sudden drops and rebounds, an additional short-term fluctuation constraint was introduced. A normalized short-term irradiance jump index was defined over T as Equation (6):
where is the plane-of-array irradiance at time ); denotes the daytime effective period; is the peak irradiance within T; is the sampling interval (10 min in this study); and is a dimensionless jump magnitude. The number of jumps was then counted as for which . A day was classified as non-representative and excluded if = 0.2, = 3) [15]. Normalization by avoids inflated relative changes under low-irradiance conditions (e.g., early morning and late afternoon), thereby improving the robustness and reproducibility of the clear-sky selection.
Days satisfying all the above requirements on intensity, duration, stability, and short-term fluctuation characteristics were defined as “representative clear-sky days” and used for the day-scale performance comparison between STPVs and FPVs, the extraction of tracking-gain factors, and the equivalent-mapping calibration for the annual simulations. Ultimately, five clear-sky days were selected in both summer and winter, ensuring the robustness of the experimental comparison and the subsequent model calibration.
3. Experimental Methods and Results for the STPV Window System
3.1. Experimental Objectives and Overall Design
To verify the electricity-generation advantage of the STPV-integrated window under real operating conditions and to provide reliable parameters for subsequent numerical simulations, comparative experiments were conducted between the FPV and STPV systems. The experiments focused on the relationship between PV electricity output and the corresponding solar irradiance under different operating modes, in order to quantify the extent to which sun-tracking improves PV conversion performance.
An “experimental group–control group” design was adopted. The experimental group consisted of an STPV module capable of automatically adjusting its attitude according to the solar trajectory, while the control group used a PV module with a fixed tilt. Except for the operating mode (tracking versus fixed), all other conditions were kept as consistent as possible to ensure the comparability of the experimental results.
It should be noted that the small-scale concurrent experiments in this study are not directly used for the one-to-one verification of “the annual energy consumption of the entire building”, but are used to extract and verify the normalized performance gain caused by the tracking control. Specifically, during the experimental stage, the “power generation—irradiance” response relationship and gain coefficients of STPVs and FPVs under the same boundary conditions were obtained; in the simulation stage, the annual irradiation and building-end energy consumption under the FPV baseline were first calculated in EnergyPlus, and then the gain obtained from the calibration of the experiment was mapped to the annual irradiation conditions to obtain the equivalent annual power output of STPVs. This two-step method transforms the “absolute scale problem” into a “transferable response relationship problem”, thereby achieving the methodological connection between small-scale measurements and annual building simulation.
3.2. Experimental Setup and Measurement Scheme
The experiment was conducted on a rooftop test platform at the Donghu Campus of Zhejiang A&F University, Lin’an District, Hangzhou, China. The site is characterized by minimal surrounding obstructions and adequate solar exposure, providing representative outdoor boundary conditions. The experimental apparatus comprised a scaled prototype (Figure 3), monocrystalline silicon PV modules, a solar irradiance sensor, and electrical measurement instruments (Figure 4).
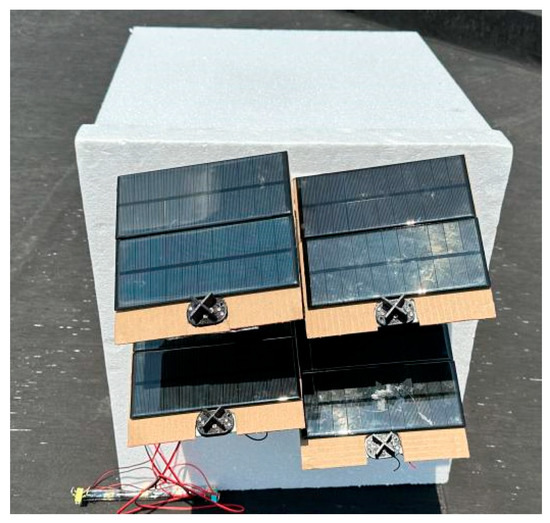
Figure 3.
STPV-integrated window model.
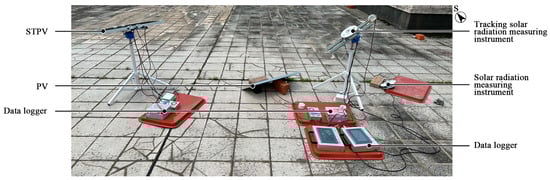
Figure 4.
STPV-integrated window and FPV test experiment.
For the experimental group, the STPV module was equipped with a control system that adjusts the module attitude based on real-time solar altitude and azimuth angles. In this study, the fixed PV window (FPV) baseline was set to a tilt angle of 30° with a due south azimuth (180°). This choice follows the widely adopted principle that the annual optimal fixed tilt is typically close to local latitude (Hangzhou: ~30.3° N) while remaining consistent with reported façade-PV performance in South-China climates, where south-facing configurations near 30° have shown favorable annual yield. Hence, 30° is adopted as a realistic and literature-supported reference condition for comparing FPVs and STPVs [8,20,21].
Electrical output was measured using a high-accuracy digital multimeter, while solar irradiance was recorded using a thermopile-based pyranometer (global solar irradiance sensor). The measurement accuracy of the instruments satisfies the requirements of this study, ensuring the reliability of the collected dataset.
To strengthen metrological transparency, instrument specifications, ranges, and accuracies are summarized in Table 1.

Table 1.
Instruments and key parameters used in the STPV/FPV comparative experiment.
3.3. Experimental Conditions and Data Acquisition
The experiments were conducted under clear-sky conditions in both summer and winter to capture PV operating characteristics under different solar altitude regimes. The experimental conditions were as follows:
(1) Summer campaign: Five consecutive clear-sky days from 17 to 21 August 2023 were selected. Measurements were recorded from 07:00 to 18:00 each day with a sampling interval of 10 min.
(2) Winter campaign: Five consecutive clear-sky days from 17 to 21 December 2023 were selected. Measurements were recorded from 08:00 to 17:00 each day with a sampling interval of 10 min.
During both campaigns, the experimental (STPV) and control (FPV) modules operated simultaneously. PV electrical output and the corresponding solar irradiance were recorded in real time, forming a time-aligned dataset for hour-by-hour comparison.
3.4. Experimental Results and Analysis
The experimental results (Figure 5 and Figure 6) show that, under both summer and winter conditions, the electricity outputs of STPVs and FPVs closely follow the variation in solar irradiance, exhibiting a typical diurnal pattern characterized by an increase in the morning followed by a decrease in the afternoon.
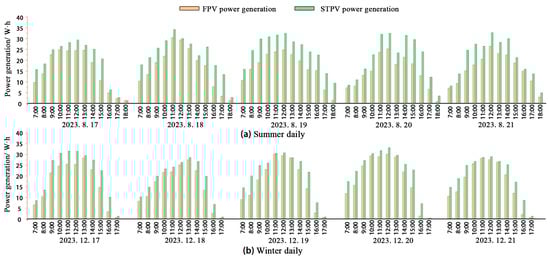
Figure 5.
Electricity output of STPVs and FPVs: (a) summer period; (b) winter period.
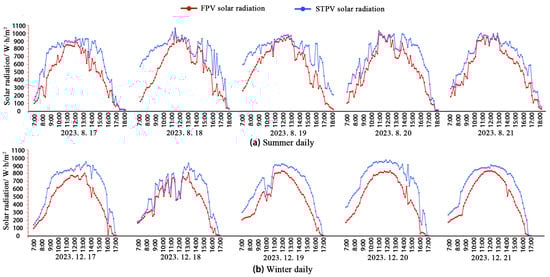
Figure 6.
Solar irradiance intensity for STPVs and FPVs: (a) summer period; (b) winter period.
During the summer campaign, the 5-day cumulative electricity yield of STPVs was 26 kWh, corresponding to a cumulative global solar irradiation of 781.42 kWh·m−2. In comparison, FPVs produced 15.24 kWh with a cumulative irradiation of 608.61 kWh·m−2. The advantage of sun-tracking was more pronounced during periods with higher solar altitude, when the fixed-tilt configuration experienced greater angular mismatch losses.
During the winter campaign, the STPV system generated 21.62 kWh over five days, whereas the FPV system generated 16.28 kWh. Although winter irradiance was generally lower, STPVs maintained a stable electricity-generation gain over FPVs, indicating that tracking can still improve incident-radiation utilization under low-sun conditions.
A statistical analysis of the time-resolved data further indicates that the maximum difference in electricity yield between STPVs and FPVs reached 18.36 Wh during peak-irradiance periods, whereas the difference diminished substantially under low-irradiance conditions. Overall, STPVs consistently outperformed FPVs in average electricity output throughout the experimental period, demonstrating that sun tracking effectively enhances the PV module’s ability to utilize incident solar radiation.
These experimental findings confirm the electricity-generation advantage of the STPV-integrated window under real operating conditions and provide essential empirical support for the subsequent annual EnergyPlus simulations of PV yield and building energy performance.
3.5. Scale Applicability and Boundary Condition Explanation
The above mapping is valid under the premise that the two systems use the same device technology route, similar incident angle response characteristics, and consistent data cleaning rules; and the cross-scale transfer is performed using normalized gain rather than absolute power. This method can effectively depict the incremental effect of “tracking strategy versus fixed strategy”, but in extreme solar altitude angles, complex local obstructions, strong reflection environments, and when the dynamic lag of the actuator is significant, the mapping error may be amplified. Therefore, in Section 4.5 of this paper, temporal error and uncertainty assessment are added, and in the Section 5, the applicable range and limitations of this method are clearly defined.
4. EnergyPlus-Based Annual Simulation
4.1. Simulation Objectives and Overall Framework
To evaluate the integrated impacts of the STPV-integrated window on annual PV electricity generation and building energy use, EnergyPlus [22] was employed to develop a residential building model and to compare different PV-window operating strategies. The simulations focus on quantifying the differences between STPV and a FPV window in terms of electricity generation, HVAC electricity consumption, and lighting electricity consumption.
Based on the experimental results, the measured relationship between PV electricity output and solar irradiance was incorporated into the simulation workflow to enable a realistic annual extrapolation of STPV performance. This approach reduces the reliance on idealized assumptions and mitigates potential bias that may arise from using purely nominal PV parameters.
4.2. Building Model and Meteorological Data
The simulation object is a typical single-room space in a detached house in Hangzhou, with dimensions of 4.8 m × 5.1 m × 3.6 m (Figure 7). A single-pane exterior window (2.4 m × 1.8 m) is located on the south façade and serves as the primary interface for PV integration and solar-shading effects. To ensure comparability across scenarios, all simulation cases use the same building geometry, orientation, and window-to-wall configuration; only the PV-window operating mode is varied (no-shading baseline, FPVs, and STPVs).
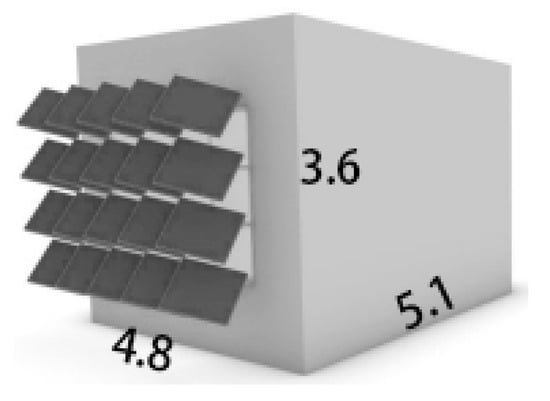
Figure 7.
3D model of an independent house room for the building simulation.
Thermal properties of the building envelope were specified with reference to the Energy Efficiency Design Standard for Residential Buildings in HSCW Regions (China) [23]. Key parameters include the U-values of the external wall, roof, floor slab, and window, as well as the window SHGC (Table 2). HVAC operation and lighting control were configured to reflect typical local residential usage patterns to maintain practical relevance. The main assumptions are as follows: the HVAC system is available year-round and switches on/off automatically according to temperature setpoint thresholds; electric lighting is activated when indoor daylight is insufficient; occupancy, equipment loads, and internal gains follow unified schedules and remain identical across scenarios; the FPV case is modeled with fixed tilt and azimuth; and the STPV case is represented by an experimentally calibrated equivalent-gain mapping approach rather than explicit timestep-by-timestep geometric rotation in EnergyPlus. These assumptions ensure that inter-scenario differences are primarily attributable to PV operating strategy rather than boundary-condition inconsistency.
Table 2.
Details of the building information and setpoints of the boundary conditions.
Meteorological inputs were taken from the Typical Meteorological Year (TMY) file for Hangzhou, which includes hourly solar radiation, ambient temperature, wind speed, and related variables, and is suitable for annual building energy simulations. All scenarios use the same TMY file and timestep settings, and a consistent accounting framework is applied to calculate HVAC electricity use, lighting electricity use, PV generation, and annual net building energy use.
4.3. Simulation Modeling Method for STPV-Integrated Windows
EnergyPlus does not natively provide a direct means to model the geometric rotation of PV modules required for a dynamic STPV window. To address this limitation, an equivalent modeling strategy was adopted, in which the electricity-generation benefit of STPVs is incorporated by correcting the effective solar-radiation receipt rather than explicitly rotating the module geometry.
Specifically, EnergyPlus was first used to simulate the annual plane-of-array solar radiation incident on the FPV window and the associated PV electricity generation under identical building and weather conditions. The experimentally derived relationship between PV electricity yield and incident solar irradiance was then applied to translate the tracking-induced radiation gain into an equivalent increase in electricity generation. In other words, the annual STPV output was obtained by mapping the measured “electricity–irradiance” proportionality (calibrated from the comparative experiments) onto the EnergyPlus baseline results.
In the simulations, the installed PV capacity was set to 1 kWp, with the PV array oriented due south azimuth (180°) and a tilt angle of (30°). By retaining the EnergyPlus building energy simulation framework while embedding experimentally calibrated parameters, this approach enables the dynamic effect of sun tracking to be represented in an equivalent form for annual-scale performance assessment without introducing additional geometric complexity.
4.4. Building Energy Calculation and Performance Metric
The building energy simulations considered two major end uses: HVAC electricity consumption and lighting electricity consumption. The HVAC system was assumed to operate year-round and to switch on/off automatically when the indoor air temperature exceeded the prescribed setpoint thresholds. The lighting system was activated when indoor daylight availability was insufficient to meet the minimum illuminance requirement for residential use.
To clarify the coupling between field measurements and annual simulations, a two-stage workflow was adopted.
In Stage 1 experimental calibration, synchronized outdoor measurements were conducted for STPVs and FPVs under representative clear-sky conditions at a 10 min interval. After timestamp synchronization, quality control, and outlier screening, irradiance , voltage , current and power were used to derive a calibrated electricity–irradiance relationship and the tracking-related gain relative to FPV.
In Stage 2 annual simulation, EnergyPlus was used to compute the annual FPV baseline under identical building geometry, envelope properties, schedules, and Hangzhou TMY weather inputs. Because EnergyPlus does not explicitly model timestep-by-timestep geometric rotation of the STPV modules in this study, the experimentally calibrated gain relationship from Stage 1 was applied as an equivalent mapping to convert the FPV baseline into STPV-equivalent annual PV generation.
Finally, HVAC electricity use, lighting electricity use, and PV generation were combined to compute annual net building energy use: defined as Equation (7):
where denotes the annual net energy consumption of the building, is the annual HVAC electricity use, is the annual lighting electricity use, and is the annual PV electricity generation.
This framework ensures that measured data are used for PV performance calibration, while EnergyPlus provides building-scale annual energy response, yielding a physically consistent and reproducible integration approach.
4.5. Model Validation and Uncertainty Assessment
To verify the credibility of the proposed equivalent modeling approach for the STPV/FPV systems at the power-output level, and to quantify uncertainties arising from measurement errors and model simplifications, time-series validation was conducted by comparing EnergyPlus predictions against field measurements on representative clear-sky days [24,25].
Direct time-series validation was performed for FPV because it can be represented natively in EnergyPlus and measured under fixed geometry. Annual STPV prediction was derived through experimentally calibrated gain mapping using comparative STPV/FPV measurements. While this provides an evidence-based transfer from measurement to annual simulation, direct long-term STPV monitoring is still needed and is identified as future work.
The validation focused on the FPV case. The measured power output and simulated power output were aligned at the same timestep (10 min), and the residual was defined as Equation (8):
As shown in Figure 7, the simulated power curve reproduces the measured diurnal pattern well, capturing the morning ramp-up, midday peak, and afternoon decay. No pronounced phase shift is observed in the peak timing, indicating that the model provides adequate temporal tracking under intra-day irradiance variations. The residual series fluctuates slightly around zero for most periods and is mildly negative overall, suggesting a small underestimation during high-irradiance hours around midday. The maximum instantaneous absolute error is approximately 5 W, corresponding to a relative error of about 1–2% given a peak power of ~330 W. Errors are mainly concentrated near noon when power output is high, whereas residuals are close to zero under low-irradiance conditions in the early morning and late afternoon. These results indicate that the model can stably reproduce the measured power output without evident phase mismatch or systematic drift.
To further quantify model accuracy in a statistical sense, the time-series errors were evaluated using an energy bias and commonly used metrics. The daily energy bias is defined as Equation (9):
where and = 10 min. In addition, the normalized mean bias error (NMBE) and the coefficient of variation in the root mean square error (CVRMSE) were calculated as Equations (10) and (11):
where is the number of samples and meas is the mean measured power [26]. For the representative clear-sky validation day, the intra-day energy bias was −1.85%, with NMBE = −1.85%, CVRMSE = 2.77%, _peak = 0.76 min. These results quantitatively confirm that the modeling bias is within an acceptable range. Combined with the time-series comparison shown in Figure 7, the “measured-gain–equivalent irradiance mapping” strategy is considered capable of reliably representing the electricity-generation characteristics of both FPV and STPV systems, providing a credible basis for annual yield estimation and for coupled analyses of PV output and building energy consumption [27].
Regarding uncertainty, the measured power output is obtained from voltage and current measurements (), and its measurement uncertainty can be estimated via error propagation as Equation (12):
When timestep uncertainty is neglected, the relative uncertainty of the daily accumulated electricity yield can be approximated as inheriting from [27]. Moreover, uncertainties in irradiance measurements—such as sensor calibration drift, cosine-response deviation, and installation errors in tilt and azimuth—can affect both the predicted power output and the equivalent-gain mapping, with greater sensitivity under midday high-irradiance conditions when module temperature rise is more pronounced.
Model-related uncertainty mainly arises from: (i) simplified assumptions in the EnergyPlus PV model regarding module temperature, incidence-angle modifiers, and electrical parameters; (ii) differences between measurements and simulations in local shading, reflected radiation (e.g., from the ground and surrounding buildings), and convective cooling conditions driven by wind speed; and (iii) the use of an equivalent mapping to represent STPV dynamic attitudes in annual simulations, which may introduce small deviations under extreme solar angles or changing boundary conditions. Despite these uncertainty sources, the relatively small residual amplitude and the absence of apparent systematic drift in Figure 8 indicate that the model uncertainty is controlled and sufficient to support the integrated assessment of “generation gain–radiation regulation–building energy performance” in this study.
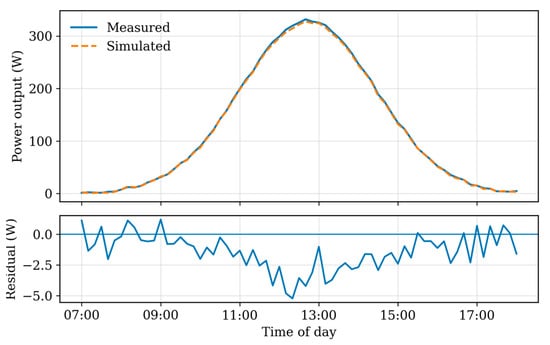
Figure 8.
Validation of the STPV power-output model against field measurements on a representative clear-sky day (07:00–18:00).
4.6. Simulation Results
Based on the EnergyPlus simulations under the Typical Meteorological Year conditions for Hangzhou (Figure 9, Figure 10, Figure 11, Figure 12, Figure 13 and Figure 14), the FPV window receives an annual solar irradiation of 1375 kWh·m−2, corresponding to an annual electricity generation of 1081 kWh. By applying the experimentally calibrated irradiation–gain relationship, the STPV-integrated window increases the annual received solar irradiation to 1802 kWh·m−2, resulting in an annual electricity generation of 1417 kWh.
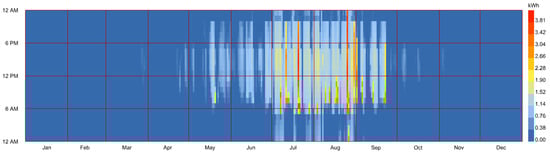
Figure 9.
STPV cooling electricity consumption.
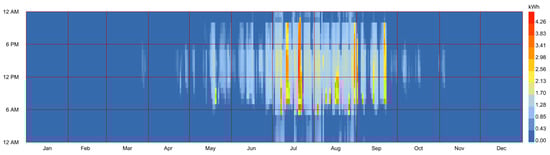
Figure 10.
FPV cooling electricity consumption.
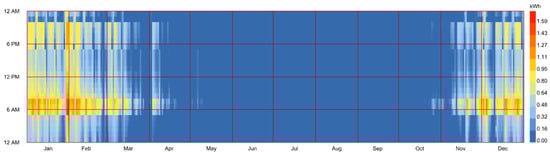
Figure 11.
STPV heating electricity consumption.
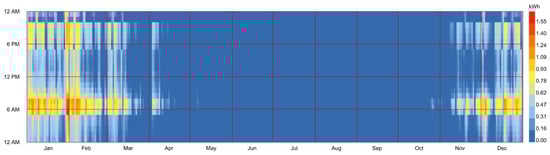
Figure 12.
FPV heating electricity consumption.
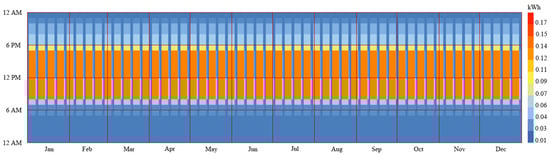
Figure 13.
STPV lighting electricity consumption.
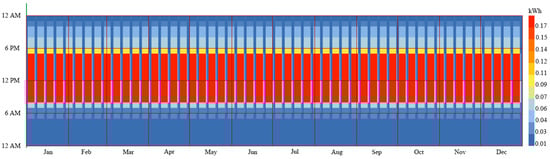
Figure 14.
FPV lighting electricity consumption.
Compared with the FPV, the STPV system achieves an additional annual electricity-generation gain of approximately 336 kWh. This gain occurs predominantly during the transition seasons and around midday in summer, when solar altitude varies more substantially, indicating that sun tracking can effectively mitigate the radiation-utilization losses associated with the fixed tilt of FPV.
To evaluate the comprehensive energy-saving performance of STPVs for a detached house in Hangzhou, annual electricity consumption was compared among the no-shading baseline, FPV, and STPV cases. The simulations show that the building’s annual total electricity consumption is 4967 kWh without shading. With FPVs installed, it decreases to 4010 kWh, corresponding to an annual saving of 957 kWh. With STPVs, it is further reduced to 3281 kWh, yielding a total annual saving of 1686 kWh. Thus, STPVs deliver an additional 729 kWh annual saving relative to FPV. This demonstrates that, beyond increasing PV electricity generation, sun tracking enhances dynamic shading control and thereby substantially reduces both HVAC and lighting electricity use, leading to a stable annual energy-saving advantage.
To account for the combined effects of PV generation and changes in building electricity demand, annual net energy consumption was adopted as the key metric. As shown in Figure 15, the operating strategy of the PV-integrated window significantly alters the composition of HVAC and lighting electricity use. Under the FPV case, cooling remains the dominant end-use, accounting for approximately 53% of annual electricity consumption. After introducing STPVs, the annual total electricity consumption decreases further, with the primary contribution arising from a pronounced reduction in cooling electricity use. This is consistent with the mechanism that STPVs form a dynamic external shading interface during summer daytime, attenuating direct solar gains through the window and thereby lowering indoor cooling demand. It should be noted that STPVs slightly increase heating electricity use in winter because the shading element partially reduces winter solar heat gains. However, this increase is much smaller than the reduction in summer cooling demand and therefore does not alter the conclusion of a net annual energy benefit.
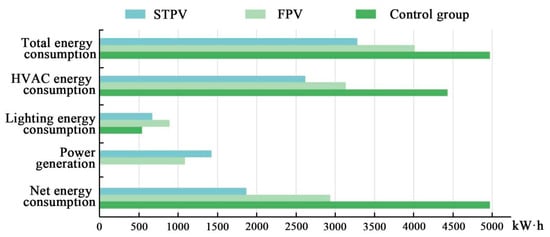
Figure 15.
Annual energy and PV generation comparison (Control, FPV, STPV).
When PV generation is incorporated, the building’s annual net electricity demand is 2929 kWh under the FPV case and decreases to 1864 kWh under the STPV case, corresponding to a net reduction of 1065 kWh and an overall saving rate of approximately 36.4%. These annual-scale results confirm the energy-saving potential of the STPV-integrated window for detached houses in Hangzhou and indicate that it achieves a more balanced co-optimization between electricity generation enhancement and building electricity-demand reduction than conventional FPV louvers or semi-transparent PV window systems reported in previous studies.
5. Discussion
5.1. Mechanisms Behind the Annual Benefit and Seasonal Trade-Offs
The annual advantage of STPVs over FPVs in Hangzhou is driven by two measurable pathways: (i) higher PV electricity generation due to reduced incidence-angle losses, and (ii) lower building electricity demand, dominated by cooling and, to a lesser extent, lighting. The tracking strategy increases plane-of-array irradiance capture when solar geometry deviates most from a fixed tilt—most notably around summer noon and during the shoulder seasons—thereby explaining the observed annual generation gain. On the demand side, the STPV modules act as an external, time-varying shading layer in daytime, which reduces transmitted direct solar radiation through the south-facing window and lowers indoor cooling loads. This cooling reduction is the primary contributor to the additional electricity savings relative to FPVs.
STPV gain is orientation- and glazing-dependent. South-facing façades generally maximize annual tracking benefit in Hangzhou, while east/west orientations may shift gains toward morning/afternoon and increase seasonal asymmetry. Lower-SHGC or spectrally selective glazing can reduce cooling load but may also attenuate daylight-related interactions; therefore, STPV control and glazing selection should be co-optimized rather than independently specified.
A seasonal trade-off is also evident: during winter, the external shading element partially reduces beneficial solar heat gains, leading to a slight increase in heating electricity use. However, under Hangzhou’s hot-summer/cold-winter context, the cooling savings outweigh the heating penalty on an annual basis, resulting in a net reduction in total and net energy consumption. These results imply that STPVs are most effective for south-oriented rooms with high solar exposure and in cooling-dominated operating profiles, while winter control should avoid unnecessary shading when heating demand is present.
The building model represents a single typical room, which enables controlled comparison but does not capture full-house zoning interactions, occupancy diversity, and inter-room thermal coupling. Therefore, absolute annual values should be interpreted as case-specific, while comparative STPV–FPV trends are more transferable.
5.2. Added Value Relative to Existing FPV/BIPV Window Studies
Most FPV/BIPV window studies evaluate performance primarily through PV yield or shading effectiveness in isolation. The present work extends this by quantifying how a tracking-enabled PV window affects both the supply side (PV generation) and the demand side (HVAC and lighting electricity), and by reporting the outcome using an integrated metric (net energy). This coupling is important because, for window-integrated PV, the PV geometry simultaneously governs electricity generation and solar gains to the indoor space; therefore, assessing PV yield alone can misrepresent the system-level benefit. In this study, the additional value of STPVs arises not only from higher generation but also from its stronger ability to modulate solar gains during high-load periods, translating PV tracking into a building-relevant annual energy impact.
To reflect realistic controller behavior, the STPV operation was evaluated with a 1 min tracking delay (τ = 1 min), consistent with the prototype control cycle. The delay-aware control was applied in both measurement interpretation and annual simulation coupling. Under this setting, the model reproduces intra-day PV dynamics without observable phase mismatch at the practical control timescale, while retaining the annual generation and load-reduction trends reported for STPVs. Therefore, the reported annual performance represents a practically implementable control condition rather than an ideal zero-delay case.
The 36.4% net-energy reduction should be interpreted against integrated baseline conditions rather than as a universal standalone benchmark. Compared with single-function measures (e.g., static shading or glazing retrofit), STPVs provide a combined mechanism—generation enhancement and cooling-load suppression—which is particularly effective for high solar-exposure south-facing windows in HSCW climates. Future work will provide formal side-by-side benchmarking under harmonized assumptions and life-cycle cost boundaries.
5.3. Practical Implications and Economic Interpretation
From an application perspective, the incremental value of STPVs depends on three factors that are directly linked to the observed mechanisms: local cooling intensity, electricity tariff structure, and tracking system cost and reliability. Because the major demand-side benefit comes from reducing summer cooling electricity, the economic attractiveness will be higher in households and zones with higher cooling usage. Likewise, tariffs with higher daytime prices can further increase the value of midday generation and cooling-load reduction. On the cost side, the feasibility of STPVs hinges on whether the tracking actuation and control hardware can deliver long-term outdoor reliability (wind load, water ingress, dust, fatigue) with manageable maintenance requirements; frequent failures or short service life would quickly erode the annual gains. These points suggest that engineering optimization should prioritize simplified actuation, robust enclosure/structural design, and modular maintainability, rather than maximizing tracking precision alone.
5.4. Quantitative Benchmarking Against Alternative Energy-Saving Measures
To position STPVs relative to other envelope-based solutions, a normalized benchmarking framework was introduced under consistent boundary conditions (same weather file, occupancy schedule, setpoints, internal gains, and simulation horizon). Four indicators were used:
(1) Annual net electricity reduction (kWh/year);
(2) Relative net-energy saving rate (%);
(3) Annual PV electricity yield increment (kWh/year);
(4) cooling-electricity reduction contribution (kWh/year).
Using the no-shading case as baseline, FPVs reduce annual building electricity use by 957 kWh, whereas STPVs reduce it by 1686 kWh. Relative to FPVs, STPVs provide an additional 729 kWh reduction in annual building electricity use and an additional 336 kWh PV generation gain. After accounting for on-site generation, annual net electricity demand decreases from 2929 kWh (FPV) to 1864 kWh (STPV), corresponding to a further 1065 kWh reduction and a 36.4% improvement versus FPV net demand.
These results indicate that the comparative advantage of STPVs is not only generation-side enhancement but also demand-side cooling reduction through dynamic solar control. Therefore, under Hangzhou HSCW conditions, STPVs should be interpreted as a coupled generation–load-management façade strategy rather than a pure PV-efficiency upgrade. To avoid over-generalization, this benchmark is constrained to the same building archetype and operation settings; cross-study comparisons should be made only after metric normalization and boundary harmonization.
5.5. Limitations and Future Work
Several limitations should be acknowledged. First, the annual simulation represents STPV dynamics through an equivalent mapping calibrated from clear-sky measurements; performance under highly variable sky conditions and in the presence of complex local reflections/shading may deviate from the mapped behavior. Second, the current analysis focuses on a representative room and window configuration; results may vary with window-to-wall ratio, glazing properties, interior setpoints, and occupancy/lighting controls. Third, the economic assessment is interpreted mainly through benefit drivers; a full life-cycle cost analysis would require product-specific costs, service life distributions, and maintenance schedules.
This study adopts a single-room model of an independent residential building to identify the energy efficiency mechanism of STPV south-facing windows under controlled conditions, and to achieve a clear coupling between “measured photovoltaic behavior—annual energy consumption simulation”. This simplification is beneficial for mechanism analysis, but it also limits the direct extrapolation boundary of the conclusion. In multi-zone residences, the comprehensive energy efficiency of STPVs may change due to the following factors: Firstly, differences in zones and orientations will alter the annual-scale balance of “summer cooling load gain—winter heat gain loss cost”, because not all rooms are dominated by south-facing solar radiation; Secondly, the indoor heat gain level (people, equipment, lighting) will change the air conditioning operation status, thereby affecting the marginal contribution of external window shading control to annual electricity consumption; Thirdly, differences in operation modes (temperature control settings, living periods, natural ventilation and intermittent air conditioning) will reshape peak-time and annual total responses, which is especially more obvious in the transitional season. The numerical conclusions of this study correspond to the empirical effect under the scenario of “Hangzhou climate, south-facing rooms, typical residential operation period”, and should be understood as the replicable effect quantity under given boundary conditions, rather than a fixed constant that can be unconditionally applied to all building types. Nevertheless, its core physical mechanism is robust: solar tracking enhances the utilization efficiency of incident radiation on components, and dynamic external shading inhibits summer direct heat gain. Subsequent research will expand to multi-zone residences, explicitly introducing zone orientation, random internal heat gain, and diversified operation strategies, and using normalized indicators such as annual energy consumption per unit area and peak load impact to enhance cross-building comparability.
Future work should therefore: (i) validate the tracking–shading performance over longer periods and across multiple weather types; (ii) refine winter operation logic (e.g., heating-aware “solar-admission priority” modes) to reduce the heating penalty; and (iii) evaluate design sensitivity across envelope configurations and control parameters to support generalized design guidance for hot-summer/cold-winter regions.
6. Conclusions
To meet the application needs of BIPV in residential buildings located in HSCW regions, this study proposes a STPV system integrated on the exterior side of a south-facing residential window. Using a detached-house case in Hangzhou, the annual-scale impacts of the system on PV electricity generation, solar-radiation regulation, and building electricity use were quantified through combined field measurements and EnergyPlus simulations. The main conclusions are as follows:
Sun tracking delivers a measurable annual generation gain. Compared with FPVs, the STPV-integrated window provides an additional annual electricity-generation gain of approximately 336 kWh. The gain is mainly concentrated in the transition seasons and around summer noon, when solar geometry varies markedly. This indicates that sun tracking effectively reduces incidence-angle losses associated with fixed-tilt configurations and improves solar-radiation utilization.
The dominant energy-saving mechanism is cooling-load reduction via dynamic external shading. With the no-shading case as the baseline (4967 kWh annual total electricity use), the FPV case reduces annual total electricity use to 4010 kWh (a saving of 957 kWh), whereas the STPV case further reduces it to 3281 kWh (a saving of 1686 kWh). Relative to FPVs, STPVs achieve an additional 729 kWh·yr−1 reduction in building electricity use. This demonstrates that, beyond higher PV generation, STPVs form a daytime, adaptive external shading layer that attenuates direct solar gains through the window and consequently lowers cooling demand, with additional impacts on lighting electricity.
STPVs yield a clear system-level benefit when generation and demand are evaluated jointly. Using annual net energy consumption as an integrated indicator, the building net energy demand is 2929 kWh under FPV and decreases to 1864 kWh under STPVs, corresponding to a net reduction of 1065 kWh and an overall saving rate of approximately 36.4%. These results confirm the annual energy-saving potential of the STPV-integrated window for detached houses in Hangzhou and indicate a more coordinated co-optimization between PV generation enhancement and building electricity-demand reduction.
A winter trade-off exists, but it does not overturn the annual net benefit. STPVs may slightly increase heating electricity use in winter due to reduced beneficial solar heat gains. However, the heating penalty is substantially smaller than the summer cooling savings, and the system maintains a pronounced net annual energy benefit. From a design perspective, winter operation could be further improved by adopting heating-aware control modes (e.g., solar-admission priority or attitude switching) to minimize the heating penalty.
This study has limitations. Annual STPV performance was represented through an equivalent mapping approach, which may introduce deviations under extreme solar angles, local shading, or complex reflective environments. In addition, experimental validation was primarily based on representative clear-sky samples; system behavior and benefit structures under overcast or rainy conditions require further quantification. Future work will conduct longer-term measurements across diverse weather types, refine seasonal control strategies considering winter solar admission as well as glare/daylighting constraints, and incorporate reliability and maintenance factors into a life-cycle techno-economic assessment to strengthen the engineering applicability and scalability of STPVs for residential buildings.
Author Contributions
Conceptualization, X.Y. and K.G.; methodology, X.Y. and K.G.; software, X.Y. and K.G.; validation, X.Y., K.G. and S.Z.; formal analysis, X.Y. and K.G.; investigation, X.Y. and K.G.; resources, L.H.; data curation, X.Y. and K.G.; writing—original draft preparation, X.Y. and K.G.; writing—review and editing, K.G., S.Z. and L.H.; visualization, X.Y. and K.G.; supervision, L.H.; project administration, L.H.; funding acquisition, L.H. All authors have read and agreed to the published version of the manuscript.
Funding
This research received no external funding.
Data Availability Statement
Data will be made available on request.
Conflicts of Interest
The authors declare no conflicts of interest.
Abbreviations
The following abbreviations are used in this manuscript:
| BIPV | Building-Integrated Photovoltaics |
| STPV | Shading-type Sun-Tracking Photovoltaics |
| FPV | Fixed Photovoltaics |
| PV | Photovoltaics |
| HVAC | Heating, Ventilation and Air Conditioning |
| HSCW | Hot-Summer and Cold-Winter |
| NMBE | Normalized Mean Bias Error |
| CVRMSE | Coefficient of Variation in the Root Mean Square Error |
References
- National Development and Reform Commission (NDRC). Working Guidance for Carbon Dioxide Peaking and Carbon Neutrality in Full and Faithful Implementation of the New Development Philosophy; National Development and Reform Commission (NDRC): Beijing, China, 2021. [Google Scholar]
- Biyik, E.; Araz, M.; Hepbasli, A.; Shahrestani, M.; Yao, R.; Shao, L.; Essah, E.; Oliveira, A.C.; del Caño, T.; Rico, E.; et al. A key review of building integrated photovoltaic (BIPV) systems. Eng. Sci. Technol. Int. J. 2017, 20, 833–858. [Google Scholar] [CrossRef]
- Attoye, D.E.; Aoul, K.A.T.; Hassan, A. A review on building integrated photovoltaic façade customization potentials. Sustainability 2017, 9, 2287. [Google Scholar] [CrossRef]
- Zhang, X.; Lau, S.K.; Lau, S.S.; Zhao, Y. Photovoltaic integrated shading devices (PVSDs): A review. Solar Energy 2018, 8, 170. [Google Scholar] [CrossRef]
- Romaní, J.; Ramos, A.; Salom, J. Review of transparent and semi-transparent building-integrated photovoltaics for fenestration application modeling in building simulations. Energies 2022, 15, 3286. [Google Scholar] [CrossRef]
- Luo, Y.; Zhang, L.; Liu, Z.; Su, X.; Lian, J.; Luo, Y. Coupled thermal-electrical-optical analysis of a photovoltaic-blind integrated glazing façade. Appl. Energy 2018, 228, 1870–1886. [Google Scholar] [CrossRef]
- Jung, W.; Hong, T.; Oh, J.; Kang, H.; Lee, M. Development of a prototype for multi-function smart window by integrating photovoltaic blinds and ventilation system. Build. Environ. 2019, 149, 366–378. [Google Scholar] [CrossRef]
- Zhang, W.; Lu, L.; Peng, J. Evaluation of potential benefits of solar photovoltaic shadings in Hong Kong. Energy 2017, 137, 1152–1158. [Google Scholar] [CrossRef]
- Hu, Z.; He, W.; Ji, J.; Hu, D.; Lv, S.; Chen, H.; Shen, Z. Comparative study on the annual performance of three types of building integrated photovoltaic (BIPV) Trombe wall system. Appl. Energy 2017, 194, 81–93. [Google Scholar] [CrossRef]
- Hong, S.; Choi, A.-S.; Sung, M. Development and verification of a slat control method for a bi-directional PV blind. Appl. Energy 2017, 206, 1321–1333. [Google Scholar] [CrossRef]
- Gao, Y.; Dong, J.; Isabella, O.; Santbergen, R.; Tan, H.; Zeman, M.; Zhang, G. A photovoltaic window with sun-tracking shading elements towards maximum power generation and non-glare daylighting. Appl. Energy 2018, 228, 1454–1472. [Google Scholar] [CrossRef]
- IEC 61724-1:2017; Photovoltaic System Performance—Part 1: Monitoring. International Electrotechnical Commission (IEC): Geneva, Switzerland, 2017.
- Journée, M.; Bertrand, C. Quality control of solar radiation data within the RMIB solar measurements network. Sol. Energy 2011, 85, 72–86. [Google Scholar] [CrossRef]
- Long, C.N.; Shi, Y. An automated quality assessment and control algorithm for surface radiation measurements. Open Atmos. Sci. J. 2008, 2, 23–37. [Google Scholar] [CrossRef]
- Geuder, N.; Wolfertstetter, F.; Wilbert, S.; Schüler, D.; Affolter, R.; Kraas, B.; Lüpfert, E.; Espinar, B. Screening and flagging of solar irradiation and ancillary meteorological data. Energy Procedia 2015, 69, 1989–1998. [Google Scholar] [CrossRef]
- Leys, C.; Ley, C.; Klein, O.; Bernard, P.; Licata, L. Detecting outliers: Do not use standard deviation around the mean, use absolute deviation around the median. J. Exp. Soc. Psychol. 2013, 49, 764–766. [Google Scholar] [CrossRef]
- Long, C.N.; Ackerman, T.P. Identification of clear skies from broadband pyranometer measurements and calculation of downwelling shortwave cloud effects. J. Geophys. Res. Atmos. 2000, 105, 15609–15626. [Google Scholar] [CrossRef]
- Reno, M.J.; Hansen, C.W. Identification of periods of clear sky irradiance in time series of GHI measurements. Renew. Energy 2016, 90, 520–531. [Google Scholar] [CrossRef]
- Ineichen, P.; Perez, R. A new airmass independent formulation for the Linke turbidity coefficient. Sol. Energy 2002, 73, 151–157. [Google Scholar] [CrossRef]
- Zang, H.; Guo, M.; Wei, Z.; Sun, G. Determination of the Optimal Tilt Angle of Solar Collectors in Different Climatic Zones of China. Sustainability 2016, 8, 654. [Google Scholar] [CrossRef]
- Liu, Y.; Yao, L.; Jiang, H.; Lu, N.; Qin, J.; Liu, T.; Zhou, C. Spatial estimation of the optimum PV tilt angles in China by maximizing electricity generation. Renew. Energy 2022, 189, 1249–1258. [Google Scholar] [CrossRef]
- U.S. Department of Energy (DOE). EnergyPlus™ Engineering Reference. EnergyPlus Documentation. U.S. Department of Energy. Available online: https://www.energyplus.net (accessed on 11 February 2026).
- JGJ 134-2010; Design Standard for Energy Efficiency of Residential Buildings in Hot Summer and Cold Winter Zone. Ministry of Housing and Urban–Rural Development of the PRC (MOHURD): Beijing, China, 2010.
- Heo, Y.; Choudhary, R.; Augenbroe, G.A. Calibration of building energy models for retrofit analysis under uncertainty. Energy Build. 2012, 47, 550–560. [Google Scholar] [CrossRef]
- Fabrizio, E.; Monetti, V. Methodologies and advancements in the calibration of building energy models. Energies 2015, 8, 2548–2574. [Google Scholar] [CrossRef]
- Reddy, T.A.; Maor, I.; Panjapornpon, C. Calibrating detailed building energy simulation programs with measured data—Part I: General methodology (RP-1051). HVACR Res. 2007, 13, 221–241. [Google Scholar] [CrossRef]
- Sun, K.; Hong, T.; Taylor-Lange, S.C.; Piette, M.A. A pattern-based automated approach to building energy model calibration. Appl. Energy 2016, 165, 214–224. [Google Scholar] [CrossRef]


Disclaimer/Publisher’s Note: The statements, opinions and data contained in all publications are solely those of the individual author(s) and contributor(s) and not of MDPI and/or the editor(s). MDPI and/or the editor(s) disclaim responsibility for any injury to people or property resulting from any ideas, methods, instructions or products referred to in the content. |
© 2026 by the authors. Licensee MDPI, Basel, Switzerland. This article is an open access article distributed under the terms and conditions of the Creative Commons Attribution (CC BY) license.