Highlights
- Development of a sustainable 3D-printable mortar from construction residue sand.
- Optimal mix ratio: CSA 10–15% for improved printability and strength.
- Highly fine recycled aggregates show promise for load-bearing 3D construction.
Abstract
This study addresses the technical challenges of using construction residue sand (CRS) with high mud content in 3D printing by developing a novel sustainable mortar system. The key novelty lies in optimizing the mix design with calcium sulfoaluminate cement (CSA) and defining a quantitative printability window. Results show that at a CSA dosage of 10–15% and a sand–binder ratio of 1.4–1.5, the mortar achieves excellent printability, with a fluidity of 165–195 mm and a slump of 10–40 mm. Mechanistically, CSA promotes AFt formation, refining pore structure, and enhancing mechanical strength. This work provides a high-value pathway for recycling construction waste and advancing green intelligent construction.
1. Introduction
Given the current climate emergency, it is imperative to address environmental degradation through urgent action in resource efficiency and waste recycling. The construction sector is a major contributor to global carbon emissions and waste generation. With the rapid progress of urbanization in China, construction activities generate approximately 3.5 billion tons of construction waste each year, of which construction waste residue (CWR) accounts for about 70% [1]. Landfilling this material not only occupies scarce land resources but also poses environmental risks, such as heavy metal contamination, dust emissions, and geological hazards [2,3]. In this context, improving the utilization of CWR resources through innovative technologies like 3D printing not only supports intelligent construction but also offers a pathway to reduce environmental impacts. However, existing recycling approaches, including use as roadbed backfill and in lightweight aggregate production, have absorbed only a limited fraction of this waste and still face major constraints. Owing to the complex and variable composition of CWR, the mechanical performance of recycled products made from it fluctuates considerably [4]. Although 3D printing can reduce construction costs by eliminating formwork [5], it imposes strict requirements on aggregate grading and fresh mix flow behavior. Construction residue sand (CRS), a very fine sand fraction derived from CWR, faces a key trade-off when used as fine aggregate: its high clay and mud content sharply increases water demand and conflicts with the need for a stable printable mixture while also weakening the bond between printed layers. These issues severely limit the direct use of CRS in 3D printing. This study aims to develop a sustainable, 3D-printable mortar utilizing CRS, thereby directly contributing to waste reduction and carbon emission mitigation, aligning with climate goals.
So far, the research on CWR recycling and on 3D printing materials has progressed largely in parallel. In terms of CWR utilization, Tauer et al. [6] improved shield tunneling spoil by pressure filtration and stabilization, enabling its use in roadbed construction. Muntohar [7] activated CWR with rice husk ash and increased the strength of non-fired bricks. Jiang et al. [8] showed that when CWR is used to manufacture lightweight aggregates, an optimum sintering temperature of 1150 °C yields suitable expansion and satisfactory physical properties. Jian et al. [9] prepared a flowable backfill material using CWR, ground granulated blast-furnace slag, and phosphogypsum, achieving strength levels that meet engineering requirements. Recent studies have advanced the use of recycled fine aggregates in 3D printing: for example, Vlieger et al. [10] assessed the buildability of mortar with fine recycled aggregates, but their work focused on well-graded materials, which differ fundamentally from the high mud content in CRS. Similarly, research on spoil-based materials, such as that by Xiong et al. [4] for non-fired bricks, has not addressed 3D printability. Although existing studies [10,11,12] have explored the rheological properties of 3D-printed mortar, most of these investigations are based on well-graded recycled aggregates. For ultra-fine excavated soil sand with high mud content, the threshold values for printability remain unclear. The high specific surface area and strong water absorption of CRS possess fundamental differences compared to traditional aggregates. Direct application of existing rheological parameter windows may lead to poor extrudability or insufficient structural stability. In the field of 3D printing, research has focused on redesigning binder systems and controlling fresh mix flow properties. Ordinary Portland cement (PO) requires accelerators to compensate for its slow setting [13], whereas calcium sulfoaluminate (CSA) cement, with its rapid hardening behavior, has become a preferred option [14,15]. Panda et al. [16] examined the anisotropy of printed specimens and found that specimens loaded along the X and Z directions exhibit markedly higher structural strength. Kilic et al. [17] reported that nano-clay can significantly improve the flow and viscoelastic behavior of 3D-printing mortars. Yin et al. [18] showed that HPMC greatly enhances the rheology of printable mixtures by increasing the initial yield stress and thixotropy. Regarding fiber reinforcement, Nematollahi [19] demonstrated that adding 0–1% of 6 mm polypropylene fibers improves shape retention capacity, and Vargas et al. [20] found that specimens containing up to 0.75% (by volume) of 6 mm PP fibers did not develop shrinkage cracks within 90 d, whereas unreinforced specimens cracked within 14 d. Despite these advances, there is still a clear gap in studies that use CRS in 3D printing. The suitability of CRS as a printing aggregate has not been systematically evaluated; the effect of clay-rich aggregate–cement interfacial zones on interlayer bond strength remains poorly understood; and conventional performance indicators do not account for the degradation caused over time by the strong adsorption capacity of CRS. These challenges severely restrict the engineering application of CRS-based printable materials and highlight the need for innovative binder systems and quantitative criteria for flow-related thresholds.
This research develops a CRS-based recycled mortar system tailored for 3D printing. The proposed mix design addresses the key bottlenecks associated with very fine, clay-rich sand, namely, the loss of controllable flow behavior and weakened interlayer bonding. It offers a low-carbon pathway for recycling construction waste, provides a new high-value use for CWR, and delivers essential technical support for the construction of “zero-waste cities”. More broadly, the work contributes to protecting the production environment and advancing green and sustainable development.
2. Materials and Methods
2.1. Material
2.1.1. Construction Residue Sand (CRS)
The fine aggregate used is from excavated CRS provided by Beijing Jianghong Technology Co., Ltd., Beijing, China, which is ultra-fine sand with high mud content; its sieve test and physical properties are shown in Table 1 and Table 2, respectively, and the mineral composition is shown in Figure 1.

Table 1.
Sieve data for CRS.
Table 2.
Physical property index of CRS.
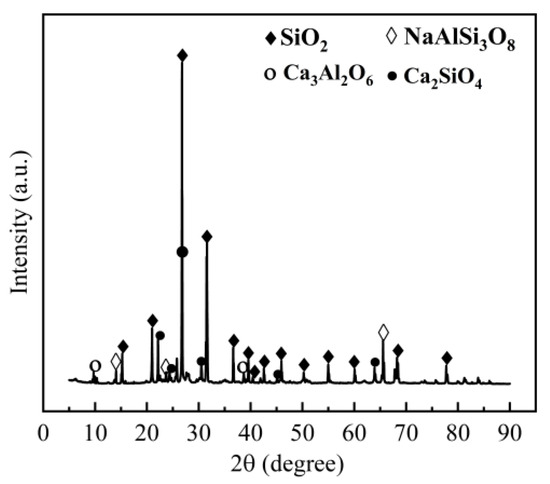
Figure 1.
Mineral composition of construction residue sand.
2.1.2. Cement
PO 42.5 was obtained from BBMG, and CSA 42.5 was obtained from Tangshan Polar Bear Building Material Co., Ltd., Tangshan, China. The chemical compositions of the two cements are shown in Table 3, and their physical property indexes are shown in Table 4.
Table 3.
Main chemical composition of cement (%).
Table 4.
Physical property indexes of cement.
2.1.3. Fly Ash (FA)
The FA used was class II, provided by Hebei Jintaicheng Environmental Resources Co., Ltd., Shahe, China, and its basic property indexes are shown in Table 5.
Table 5.
Physical property indexes of fly ash (%).
2.1.4. Polypropylene Fiber (PP Fiber)
The 6 mm PP fibers used were from Shanghai Chenqi Chemical Technology Co., Ltd., Shanghai, China, and their physical property indexes are shown in Table 6.
Table 6.
Physical property indexes of PP fiber.
2.1.5. Admixtures
(1) Thickener: HPMC, white powder in appearance;
(2) Water-reducing agent: Polycarboxylate superplasticizer composed of a slump-proof component and a water-reducing component from Jiangsu Subot New Material Co., Ltd., Nanjing, China, each 100 g of agent contained 70% water-reducing component and 30% slump-retaining component.
2.1.6. Water
Laboratory tap water.
2.2. Methods
2.2.1. Workability
(1) Setting time: Conducted according to the test specified in JGJ/T 70-2009 [21], and the arithmetic mean of two results was taken. The results were required to comply with the requirement of ≤90 min as stated in T/CECS786-2020 [22].
(2) Fluidity: Tested in accordance with GB/T 2419-2005 [23], a table jump test was performed at 5, 15, 25, 35, 45, 55, and 65 min after mixing, and the fluidity over time was recorded.
(3) Slump: The slump of the mortar was measured using a cylindrical mold 140 mm in height and 70 mm in diameter, following GB/T 50080-2016 [24], at 5, 15, 25, 35, 45, 55, and 65 min, and the slump over time was recorded.
The fluidity and slump tests were employed as practical, empirical proxies for key rheological properties relevant to printability, namely yield stress and thixotropy. The fluidity is inversely related to the static yield stress of the mortar; a higher fluidity generally indicates a lower yield stress, which facilitates extrusion. The loss of fluidity and slump over time provides an indirect measure of thixotropic behavior, indicating the rate of structural build-up over time, which is crucial for shape retention and constructability. However, it is important to acknowledge the limitations of these empirical indices compared to fundamental rheological measurements using rotational rheometry. While fluidity and slump are highly accessible and effective for quality control on-site, they provide integral, qualitative assessments rather than quantitative, shear-rate-dependent values of yield stress and viscosity. Rotational rheometry could offer more precise characterization of the evolution of the yield stress and thixotropic index, enabling the development of more sophisticated rheology-based printability models. The empirical windows established here are thus specific to the material system and printing parameters used in this study, and their correlation with absolute rheological parameters should be established through further rheometric analysis for broader theoretical modeling.
2.2.2. Printability
The printing parameters in this study were set as follows: an extrusion rate of 1.0 cm3/s, a horizontal printing speed of 30 mm/s, a vertical lifting speed of 5 mm/s, and a nozzle diameter of 20 mm. The ambient temperature was maintained at (23 ± 2) °C, with a relative humidity of (60 ± 5)%.
The printing operation time was defined as the duration for which the fluidity remained ≥150 mm in the fluidity over time tests. On the basis of the qualitative criteria for extrudability and constructability specified in T/CECS 786-2020 [22], quantitative evaluation methods were established. For extrudability, a mixture was considered to have good extrudability when the difference between the average measured width of the printed strips and the design width was within ±5%, while also satisfying the qualitative criteria. To this end, 11 continuous strips, each 400 mm in length, were printed. The measurement procedure and the printing path for the extrudability test are illustrated in Figure 2. The strip width was measured at the mid-length of each strip, and the arithmetic mean of all strip widths was calculated. For constructability, a mixture was considered to have good constructability when 20 layers could be printed continuously, and the cumulative deformation ratio of the 3D-printed specimen was ≤5%. Mixtures that could not complete 20 consecutive layers were regarded as non-buildable and were not subjected to the cumulative deformation test. The test method and printing path for cumulative deformation are shown in Figure 3, and the corresponding calculation formula is given in Equation (1):
where
—Cumulative deformation rate of 3D printed specimens (%);
—Design print height (mm);
—Actual print height (mm).

Figure 2.
Print strip width measurement method and extrudability print path schematic.
Figure 2.
Print strip width measurement method and extrudability print path schematic.


Figure 3.
Cumulative deformation test method rate and constructability print path schematic.
Figure 3.
Cumulative deformation test method rate and constructability print path schematic.

The selection of 20 layers as the constructability evaluation threshold is structurally representative. With a single-layer height of 10 mm, a 20-layer structure reaches a total height of 200 mm, which corresponds to the height of foundational courses or lower wall sections in practical applications. This criterion ensures that the material possesses adequate green strength and structural build-up to support its own weight over a representative number of layers, thereby mitigating the risk of plastic collapse during the printing process. Through preliminary experiments and industry practices, the selection of a ±5% tolerance for strip width deviation was rigorously justified to prevent overlapping or gaps between adjacent strips during printing, which could compromise interlayer bonding and dimensional accuracy. The ≤5% cumulative deformation rate was adopted to ensure geometric stability under multi-layer stacking. Excessive deformation (>5%) risks plastic collapse or layer misalignment, while lower deformation rates maintain the structural integrity required for load-bearing components.
2.2.3. Mechanical Properties
The compressive and flexural strengths of the mortar specimens were measured in accordance with GB/T 17671-2021 [25], the compressive strength was taken as the arithmetic mean of six measured values, and the flexural strength was taken as the arithmetic mean of three measured values. For the 3D-printed specimens, a block with dimensions 200 mm × 200 mm × 160 mm was first printed and then cut into prisms of 40 mm × 40 mm × 160 mm. The layer height was set to 10 mm, and the width of each printed strip was 25 mm. To ensure that all prisms contained the same number and arrangement of interlayer and interstrip interfaces, cuts were made every 40 mm (i.e., every four layers) in the vertical direction, and every 50 mm (corresponding to the width of two strips) in the horizontal direction, with the first cut at 40 mm. The resulting specimens were then tested for strength in the X, Y, and Z directions, as illustrated in Figure 4. The strength reduction factor was calculated according to T/CECS 786-2020 [22], and the mechanical anisotropy index [26] was obtained using Equation (2):
where
—Strength of cement mortar specimens;
, , —Strength of 3D printed specimens in the X/Y/Z directions;
—The ratio of the average variance of the strength in all directions to the strength of the cement mortar specimen.

Figure 4.
Schematic diagram of the direction of mechanical property testing of 3D printed specimens.
Figure 4.
Schematic diagram of the direction of mechanical property testing of 3D printed specimens.

2.2.4. Drying Shrinkage Properties
The drying shrinkage was measured in accordance with JGJ/T 70-2009 [21], and the arithmetic mean of the two results was taken. The initial length of each specimen and its length after 7, 14, 21, 28, 56, and 90 d were recorded.
2.2.5. Microstructure Analysis
(1) XRD: Grind the sample into particles of ≤45 μm and use Shimadzu XRD-6100, Shimadzu Co., Kyoto, Japan, to test the mineral composition of the sample.
(2) FITR: Grind the sample into particles ≤ 45 μm, and use Nicolet iS 10, Thermo Fisher Scientific, Waltham, MA, USA, to test the absorbance of the sample.
(3) SEM: Select block samples with a diameter ≤ 1 cm and thickness < 1 cm. After vacuum and gold spray treatments, use the Zeiss Gemini SEM 300, Carl Zeiss AG, Oberkochen, Germany, to capture the microscopic morphology of the samples and perform EDS analysis.
(4) Image analysis of Super Depth of Field (SDF): Using the Keyence VHX-2000 ultra-depth 3D microscope, Keyence Co., Osaka, Japan, to capture images of the sample, calculate the number of pores and porosity of the sample using Image-Pro Plus 6.0.
3. Results
3.1. Determination of Fluidity and Water-Reducing Agent
Based on pre-tests, the CSA dosage was selected to be 5–20%. A dosage below 5% failed to meet the early-age strength and rapid hardening requirements essential for 3D printing, while a dosage above 20% led to excessive workability loss and risks of microcracking due to the overformation of ettringite. For CRS with a fineness modulus of 1.44 and a mud content of 6.0%, the basic mix proportions are given in Table 7.
Table 7.
The basic mix design.
Because the fine aggregate used in this study is an ultra-fine waste soil sand with high mud content, it has strong water absorption, which leads to a greater loss of fluidity of the slurry per unit time. The clay fines form a loose and porous structure in the interfacial transition zone (ITZ) [27], which degrades the mechanical properties. Therefore, a slump-retaining polycarboxylate superplasticizer (PCE) combined with a slump-retaining solution was selected for preliminary testing. In these pre-tests, the total dosage of PCE and slump-retaining solution was 2.5% of the binder mass, and the results are shown in Figure 5.
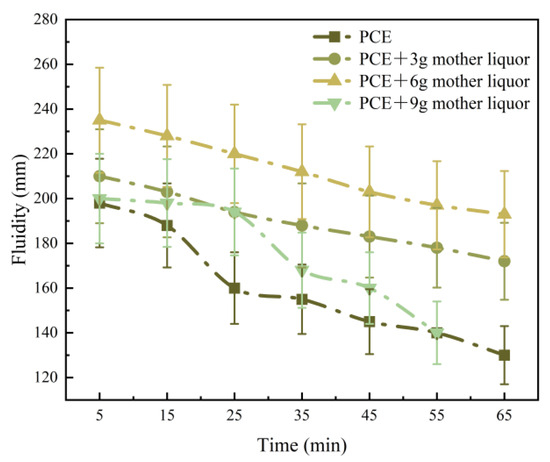
Figure 5.
Effect of different water-reducing agent formulations on the fluidity over time of mortar.
As shown in Figure 5, when 3 g of slump-retaining solution was added, the fluidity decreased slowly, indicating effective slump retention and enabling continuous and stable printing. With 6 g of solution, the initial fluidity was excessively high, although its decrease was still relatively gradual. With 9 g of solution, the fluidity dropped sharply between 25 and 35 min, resulting in an unstable loss of workability over time; this dosage was therefore excluded. Considering both the cost of the slump-retaining solution and the fact that 3 g was sufficient to ensure continuous mortar printing, the combination of the slump-retaining PCE and 3 g of solution was adopted for subsequent tests.
3.2. Influence of CSA Dosage on Mortar Properties
3.2.1. Effect on Slurry Properties
The effect of CSA dosage on the setting time of the slurry is as follows: 5%: 112 min > 10%: 83 min > 15%: 68 min > 20%: 45 min. Thus, the setting time decreases progressively with increasing CSA dosages. CSA hydrates rapidly, and the early formation of numerous fine crystals provides nucleation sites for the hydration of PO, thereby accelerating its hydration [28]. As a result, the saturation concentration of hydration products is reached more quickly, and large amounts of hydration products precipitate [29], which increases the early hydration rate of the PO-CSA system and shortens the setting time. Except for mixture P-C-1, all setting times are within 90 min. The influence of CSA dosage on slurry fluidity and slump over time is shown in Figure 6.
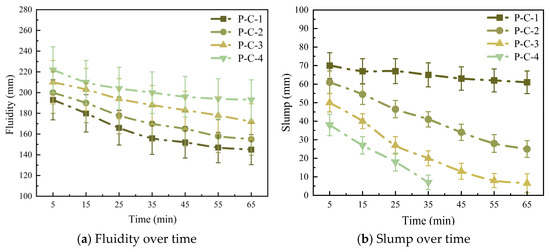
Figure 6.
Influence of CSA dosage on slurry fluidity and slump over time.
As shown in Figure 6, both the fluidity and slump of the slurry decrease markedly with increasing CSA dosages. This occurs because CSA hydrates much faster than PO, and a higher CSA dosage accelerates the hydration of the PO-CSA system, increasing the consumption of free water, reducing fluidity, enlarging the loss of fluidity over time, and shortening the workable time. At the same time, the addition of CSA reduces the slump, which helps restrain deformation and improve constructability. When the CSA dosage is 5%, the slurry maintains a fluidity ≥ 150 mm for more than 60 min, but the slump remains almost unchanged within 60 min, leading to significant self-deformation and poor volumetric stability. At dosages of 10–15%, the fluidity ≥ 150 mm is also sustained for more than 60 min, while both fluidity and slump decrease steadily with time, ensuring continuous extrusion and good constructability. At 20% CSA, the workable time with fluidity ≥ 150 mm is reduced to 46 min, but the lower slump provides better volumetric stability. Overall, a CSA dosage of 10–15% is favorable for the printability of the slurry. Based on these results, a mixture with 15% CSA and 85% PO was selected for subsequent experimental studies.
3.2.2. Effect on the Mechanical Properties of Cement Mortar Specimens
The effect of CSA dosage on the mechanical properties of cement mortar specimens is shown in Figure 7.
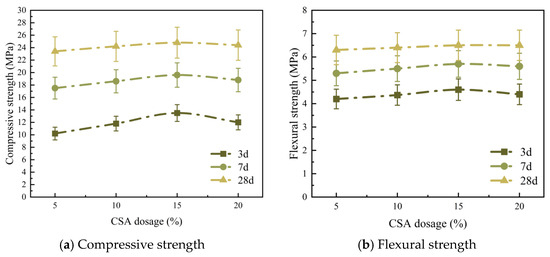
Figure 7.
Effect of CSA dosage on mechanical properties of cement mortar specimen.
As shown in Figure 7, when the CSA dosage is ≤15%, increasing the dosage enhances the specimen strength; however, the strength gain from 3 d to 7 d becomes smaller. This is because the early strength is mainly governed by AFt formed from CSA hydration. Once a rigid skeleton has rapidly developed, further filling and densification by C-S-H gel produced from PO hydration proceed more slowly and over a longer period. When the CSA dosage reaches 15%, the concentrated heat of hydration leads to an excessive growth of AFt crystals. The resulting micro-expansion fills pores at the clay–cement interface but also envelops PO particles and hinders their hydration, introducing microstructural defects into the PO-CSA composite and reducing strength [30]. At 28 d, the strength improves: with extended curing, continued PO hydration breaks the AFt coating, and the newly exposed PO particles hydrate to form C-S-H gel, which interlocks with AFt to create a denser network. The secondary hydration of fly ash further contributes to the later-age strength [31]. Therefore, a moderate CSA dosage improves strength, whereas excessive CSA reduces early strength but has a relatively small effect on long-term strength.
3.2.3. Effect on the Drying Shrinkage Properties of Cement Mortar Specimens
The effect of CSA dosage on drying shrinkage properties of cement mortar specimens is shown in Figure 8.
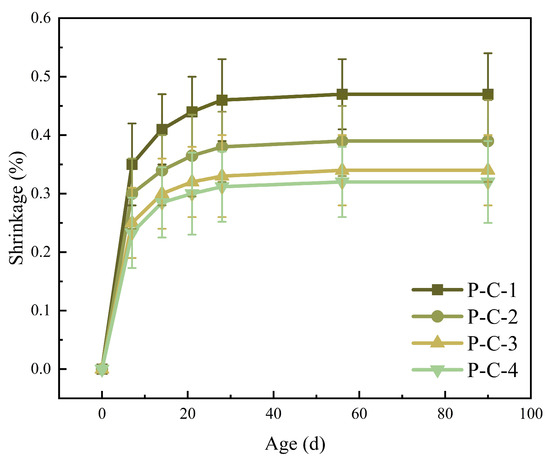
Figure 8.
Effect of CSA dosage on drying shrinkage properties of cement mortar specimen.
As shown in Figure 8, the shrinkage strain increases with curing age, and most of this increase occurs before 7 d. During the early curing stage, the slurry is still hardening: the solid skeleton is not yet fully formed, the microstructure is relatively open, and moisture is lost rapidly, which leads to significant shrinkage. From 7 to 14 d, the rate of increase in shrinkage gradually decreases, and after 28 d it becomes essentially stable. CSA can reduce drying shrinkage, and the shrinkage strain decreases progressively as the CSA dosage increases. Drying shrinkage is mainly caused by water loss from capillary pores in the hardened cement slurry. This water loss generates curved liquid surfaces and capillary tension, which in turn induce shrinkage. The main hydration product of PO, C-S-H gel, loses water readily in a dry environment, creating additional pores and increasing the shrinkage of the slurry. In contrast, the main hydration product of CSA, Aft, provides a compensating expansion effect. Consequently, the shrinkage strain is closely related to the type and quantity of hydration products. CSA develops strength rapidly at early ages, which helps the cement slurry form a stable structure during the initial curing period and thereby reduces drying shrinkage caused by moisture loss. However, when the CSA dosages exceeds 15%, its ability to restrain shrinkage begins to decline, because excessive CSA concentrates the heat of hydration and promotes the formation of microcracks. Therefore, using CSA within an appropriate dosage range is effective for reducing drying shrinkage.
3.3. Influence of Sand–Binder Ratio on Mortar Properties
3.3.1. Effect on Slurry Properties
The effect of the sand–binder ratio on setting time is as follows: 1.4: 75 min > 1.5: 68 min > 1.6: 60 min > 1.7: 55 min. The setting time decreases markedly as the sand–binder ratio increases. A higher ratio requires more CRS, which absorbs additional free water and reduces the amount of water available for hydration, thereby accelerating setting. For sand–binder ratios between 1.4 and 1.7, the setting time remains within 90 min. The influence of the sand–binder ratio on fluidity and slump over time is shown in Figure 9.
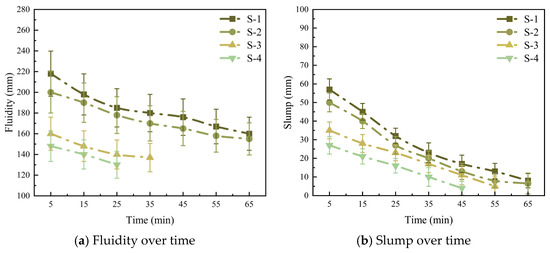
Figure 9.
Effect of sand–binder ratio on slurry fluidity and slump over time.
As shown in Figure 9, both the initial fluidity and slump decrease as the sand–binder ratio increases, and they continue to decline over time. A higher CRS content absorbs more water, reducing the effective water–binder ratio and decreasing the volume of slurry. At the same time, the increased specific surface area of the aggregate thins the slurry film and increases friction between particles [32], resulting in lower fluidity and slump. In addition, the higher sand content improves the internal skeleton of the mixture, increasing its packing ability and reducing deformation, which further contributes to the reduction in slump.
When the sand–binder ratio is 1.4–1.5, the workable time during which the fluidity remains ≥150 mm exceeds 60 min. Over this period, both fluidity and slump decrease steadily, which supports continuous extrusion of the printed strips and adequate constructability of the printed specimens. For sand–binder ratios of 1.6–1.7, the slump is very low, which is beneficial for constructability; however, at a ratio of 1.6, the time during which the fluidity is ≥150 mm is only 13 min, and at a ratio of 1.7, the initial fluidity is already <150 mm. Thus, neither mixture meets the workability requirements. In summary, sand-to-binder ratios in the range of 1.4–1.5 are most favorable for achieving good printability.
3.3.2. Effect on the Mechanical Properties of Cement Mortar Specimens
The effect of the sand–binder ratio on the mechanical properties of cement mortar specimens is shown in Figure 10.
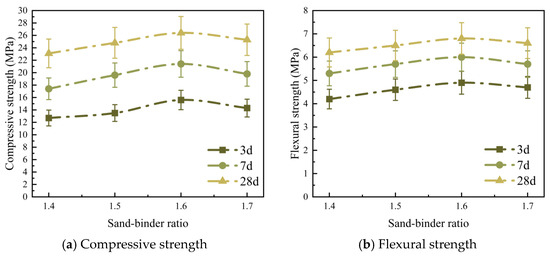
Figure 10.
Effect of sand–binder ratio on mechanical properties of cement mortar specimen.
As shown in Figure 10, the compressive and flexural strength first increase and then decrease with increasing sand–binder ratio, reaching a maximum at a ratio of 1.6. For mortar specimens prepared with CRS containing a high fines content, the mechanical properties are governed by several competing factors. On the one hand, a higher sand–binder ratio increases the sand content in the mixture. An appropriate increase in sand improves internal cohesion, and the very fine sand used in this study can fill voids in the matrix and enhance compactness [33]. On the other hand, when the amount of cementitious material is kept constant, an increase in the sand–binder ratio means that the available binder cannot fully coat all sand particles, and the binder between particles is reduced, weakening the interfacial bond. In addition, the fines act as an inert filler that can dilute and hinder cement hydration, weakening the bond between sand particles and hydration products and creating local weak zones [34,35,36]. When the sand–binder ratio is less than 1.6, the beneficial effects of increasing sand content on cohesion and compactness outweigh the detrimental effects, leading to higher compressive and flexural strengths. When the sand-binder ratio exceeds 1.6, the negative influence of additional sand on mechanical performance becomes dominant, and both compressive and flexural strengths decrease. Therefore, a sand–binder ratio of 1.5 is adopted for the subsequent experimental program.
3.3.3. Effect on the Drying Shrinkage Properties of Cement Mortar Specimens
The effect of the sand–binder ratio on drying shrinkage properties of cement mortar specimens is shown in Figure 11.
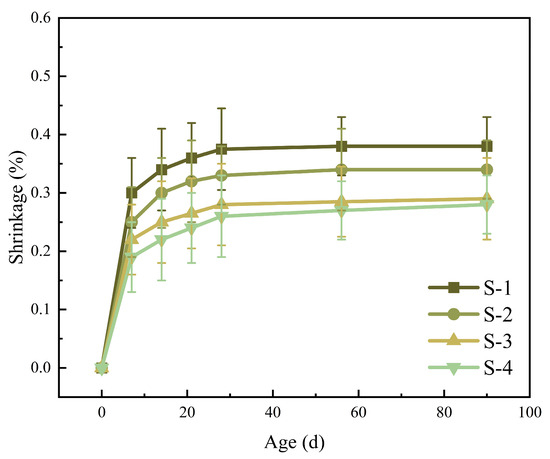
Figure 11.
Effect of sand–binder ratio on drying and shrinkage properties of cement mortar specimen.
As shown in Figure 11, the shrinkage strain increases with curing age. The shrinkage grows rapidly within the first 7 d, slows down between 7 and 14 d, and tends to stabilize after 28 d. In addition, a higher sand–binder ratio leads to lower shrinkage. For example, at 28 d, the shrinkage of mixes S-2, S-3, and S-4 is reduced by approximately 12%, 25.3%, and 30.7%, respectively, compared with S-1. Increasing the sand–binder ratio raises the sand content in the mixture, providing a stronger internal “skeleton” that helps resist shrinkage and offers structural support. However, Figure 11 also shows that the shrinkage of S-4 is not significantly lower than that of S-3. This may be attributed to the high fines content of the CRS, as the sand content increases, more water is absorbed by the fines, leading to non-uniform cement hydration, reduced compactness, non-uniform shrinkage, and more internal pores. These pores intensify capillary pressure and make moisture loss easier. Consequently, an excessively high sand–binder ratio may stop reducing shrinkage or even increase it, and may also raise the risk of cracking. Therefore, the sand–binder ratio should not be too high.
3.4. Factors Affecting the Performance of 3D-Printed Specimens
3.4.1. Extrudability and Constructability
Since P-C-1 did not meet the setting time requirements, S-3 exhibited fractures during strip printing, and S-4 had an initial fluidity of less than 150 mm and could not be extruded. Printing average strip width tests were conducted on the remaining test group, which met the qualitative evaluation criteria for extrudability. The results are shown in Figure 12(ai,bi). By establishing the relationship between strip width and fluidity over time at the same test time points, the fluidity range of the slurry that meets the criteria for good extrudability is determined, as shown in Figure 12(aii,bii).
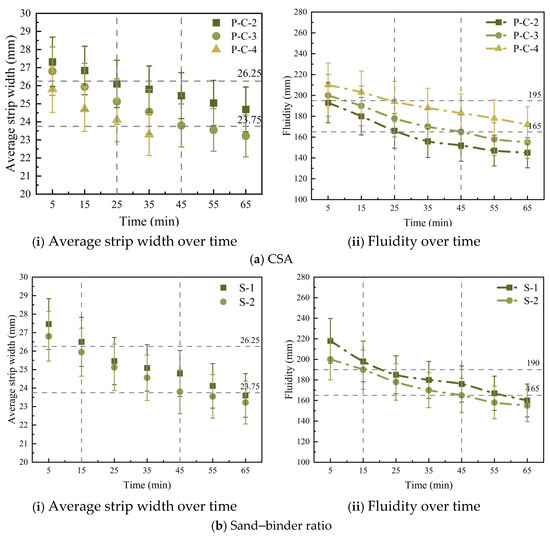
Figure 12.
Average strip width and fluidity of 3D-printed mortar.
As shown in Figure 12(ai,bi), with increasing time, the average strip width in all test groups gradually decreases. When establishing the relationship between fluidity and average strip width by measuring at specific time points, the two points closest to the design width ± 5% (23.75 mm and 26.25 mm) are selected, i.e., the narrowest and widest strip widths that meet the design requirements. Since lower fluidity results in a smaller average strip width, these two points correspond to the maximum and minimum fluidity of the slurry that meet the design requirements. By determining the time points corresponding to these two points in Figure 12(ai,bi) and Figure 12(aii,bii), the fluidity range of the slurry that meets the criteria for good extrudability is established. As shown in Figure 12(aii,bii), when the slurry fluidity is controlled between 165 mm and 195 mm, the actual printed strip width deviates from the design width by less than ±5%, indicating good extrusion properties.
Poorly extrudable slurry can lead to reduced interlayer adhesion during printing, resulting in unstable printed structures. Therefore, slump tests of slurry are conducted on the test group meeting the criteria for good constructability, with the results shown in Figure 13.
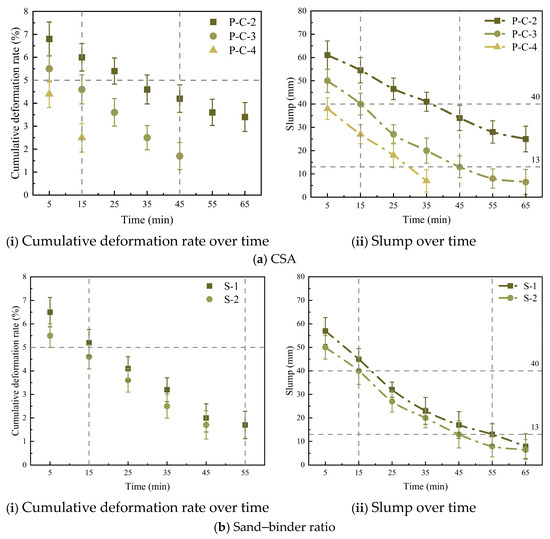
Figure 13.
Cumulative deformation rate and slump of 3D-printed mortar.
As shown in Figure 13(ai,bi), with increasing time, the cumulative deformation rate of the printed pieces in all test groups gradually decreases. When establishing the relationship between slump and cumulative deformation rate at measurement time points, the point closest to 5% in the figure is selected. Since a smaller slump corresponds to a smaller cumulative deformation rate, this point therefore represents the maximum slump value at which the cumulative deformation rate meets the design requirement of ≤5%. By referencing the corresponding time point in Figure 13(ai,bi) in Figure 13(aii,bii), the range of slump values for the mortar that meets the criteria for good constructability is determined. As shown in Figure 13(aii,bii), when the mortar slump is controlled between 10 mm and 40 mm, it exhibits good constructability.
3.4.2. Strength Reduction Rate
To investigate the anisotropy of the mechanical properties of CRS 3D-printed specimens and the relationship between this anisotropy and the mechanical properties of specimens, CSA dosages and the sand–binder ratio were selected as variables, using mix designs P-C-3 and S-1. Based on the mechanical test results, the reduction ratios of compressive and flexural strengths in each loading direction relative to the specimens were calculated, as summarized in Table 8 and Table 9.
Table 8.
Compressive strength reduction rate at different ages (%).
Table 9.
Flexural strength reduction rate at different ages (%).
As shown in Table 8 and Table 9, the 3D-printed specimens exhibit significant strength anisotropic reduction patterns, with a Z < Y < X direction. The reduction rate decreases with increasing curing age. This is because, compared to 7 d, the hydration reaction is more complete at 28 d, and the hydration products fully fill the pores and cracks, increasing density and improving structural defects at the interfaces between printed layers and between strips, thereby reducing differences in bond strength. Additionally, the flexural strength reduction rates in the Z/Y directions of the 28 d 3D-printed specimens are very low, with flexural strengths closely resembling those of mortar specimens. This is because, during flexural strength testing, the specimens are primarily subjected to tensile forces along the Z/Y direction, which are parallel to the interlayer direction, and the AFt crystals are distributed perpendicular to the interlayers, forming a bridging reinforcement effect [37], resulting in a smaller influence of interlayer bond strength on flexural strength in the Z/Y direction. In summary, in actual engineering applications, the strength reduction rate of 3D-printed mortar can be reduced by extending the curing time, eliminating the need to rely on physical fiber bridging to enhance toughness and reduce anisotropy [38].
3.4.3. Mechanical Anisotropy Index
The mechanical anisotropy index provides a more intuitive characterization of the mechanical anisotropy of 3D-printed mortar. The results of the mechanical anisotropy index calculations for compressive and flexural strengths at different ages for each group of specimens are presented in Table 10.
Table 10.
Anisotropy index of compressive and flexural strength at different ages.
As shown in Table 10, the mechanical anisotropy index in the later stages of curing is lower than that in the earlier stages, consistent with the results of the strength reduction rate analysis. Additionally, differences in the mix ratio also influence the mechanical strength anisotropy indices. From the perspective of material properties, the differences in the mechanical strength anisotropy indices may be related to the material’s fluidity and viscosity [39,40,41]. Higher fluidity allows more slurry to fill the mechanically weak regions between layers and strips, resulting in denser and more uniformly distributed pores within the 3D-printed specimens. Additionally, a slurry with better fluidity has higher viscosity, which facilitates bonding between layers and strips, thereby mitigating mechanical anisotropy issues. The differences between S-1 and P-C-3 lie in the reduced sand–binder ratio and increased water–binder ratio. Both groups exhibit better fluidity than the P-C-3 group, resulting in improved mechanical anisotropy. Based on the workability test results, the fluidity of S-1 is similar to that of P-C-3, leading to a comparable anisotropy index. In summary, the fluidity and viscosity of the slurry can be improved by appropriately adding high-efficiency water-reducing agents or water-retaining thickeners, thereby enhancing the bonding ability of the slurry between layers and between strips in 3D-printed specimens and improving the mechanical anisotropy of the 3D-printed specimens.
3.5. Microstructure Analysis
3.5.1. XRD
The XRD patterns of samples with different CSA dosages at 28 d are shown in Figure 14a. Taking P-C-3 as an example, the XRD patterns of samples cured for 3 d, 7 d, and 28 d are shown in Figure 14b.
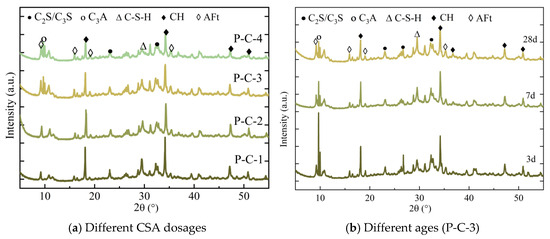
Figure 14.
XRD patterns.
As shown in Figure 14a, with increasing CSA dosage, the diffraction peaks of Aft steadily increase; Aft primarily originates from the hydration of CSA and the reaction between C3A in PO and CaSO4 in CSA. Therefore, an increase in CSA dosage leads to an increase in Aft generated by hydration. The diffraction peaks of C-S-H and CH gradually weaken. An increase in CSA dosage implies a decrease in PO content, and simultaneously, the volcanic ash reaction of fly ash consumes part of the CH. Therefore, the C-S-H gel and CH formed by the hydration of C2S and C3S decrease; the diffraction peaks of C3S and C2S gradually weaken, which is due to the reduction in PO, and CSA enhances the hydration activity of the system [42]. An increase in CSA dosages accelerates the hydration process of C3S and C2S, while the increase in the C3A diffraction peak is attributed to the complete consumption of CaSO4 by a high CSA dosage, causing residual C3A.
As shown in Figure 14b, the diffraction peaks of Aft can be clearly observed at 3 d, but the peaks do not show significant enhancement with prolonged curing time. This indicates that after mixing with water, CSA rapidly dissolves and releases Al3+ and SO42−, which react with Ca2+ in the pore solution to form a large amount of needle-like Aft [43]; the diffraction peaks of the C-S-H gel gradually intensify, indicating that an increasing amount of C2S and C3S undergo hydration reactions in the PO over time, and the CH diffraction peaks gradually decrease with age. In the early stage, CSA accelerates the hydration of C3S and enriches CH; in the middle stage, a large amount of Aft encapsulates part of the PO particles and hinders hydration, while the volcanic ash reaction of fly ash consumes CH, leading to the weakening of the CH peak. Additionally, the diffraction peaks of cement clinker minerals weaken, with the hydration of C3A primarily consuming CaSO4 to form Aft. By 7 d of curing, the CSA reaction is largely complete, having consumed a significant amount of CaSO4. C3A lacks sufficient CaSO4 to continue reacting, so the peak remains relatively stable after 7 d; C3S and C2S content gradually decrease with extended curing time.
3.5.2. FTIR
The infrared absorption spectrum of samples with different CSA dosages at 28 d is shown in Figure 15a. Taking P-C-3 as an example, the infrared absorption spectra of samples cured for 3, 7, and 28 d are shown in Figure 15b.
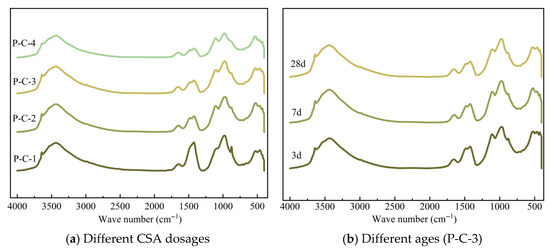
Figure 15.
Infrared absorption spectrum.
As shown in Figure 15a, the broad peak at 3400–3500 cm−1 corresponds to the stretching vibration of the O-H bonds in the C-S-H gel, while the absorption peak near 970 cm−1 corresponds to the stretching vibration of the Si-O-Si bonds in the C-S-H gel [44]. The absorption peak near 450 cm−1 corresponds to the vibration of Ca-O bonds in C-S-H gel, but with weaker intensity. The absorption peak near 1110 cm−1 corresponds to the vibration of S-O bonds in Aft. As the CSA dosage increases, the PO content decreases, leading to an increase in Aft formation and a decrease in C-S-H gel, resulting in enhanced intensity of the Aft absorption peak. While the intensity of the absorption peak of C-S-H gel decreases, the sharp absorption peak at 3640 cm−1 corresponds to the stretching vibration of the O-H bond in CH. As the CSA dosage increases, the intensity of the absorption peak decreases, primarily due to reduced PO content leading to decreased CH formation. The vibration wavenumber of the C-O-C bond in CO32− is around 1420 cm−1, and due to the decrease in CH in the system, the amount of CaCO3 generated by carbonation decreases, resulting in a gradual weakening of the absorption peak intensity at this wavelength [45].
As shown in Figure 15b, the intensity of the broad peak at 3400–3500 cm−1 and the absorption peak near 970 cm−1 gradually increase, while the sharp absorption peak at 3640 cm−1 and the absorption peak near 1420 cm−1 gradually decrease. This indicates that as the curing time increases, the amount of C-S-H gel generated increases, while the formation of CaCO3 from CH and carbonation decreases; the absorption peak near 1110 cm−1 shows no significant changes, indicating that Aft has already formed in large quantities by 3 d. The FTIR analysis results are consistent with XRD, explaining the formation process and interactions of hydration products within the system.
3.5.3. SEM
SEM images magnified 1000 and 5000 times and the EDS spectrum of P-C-1 are shown in Figure 16.
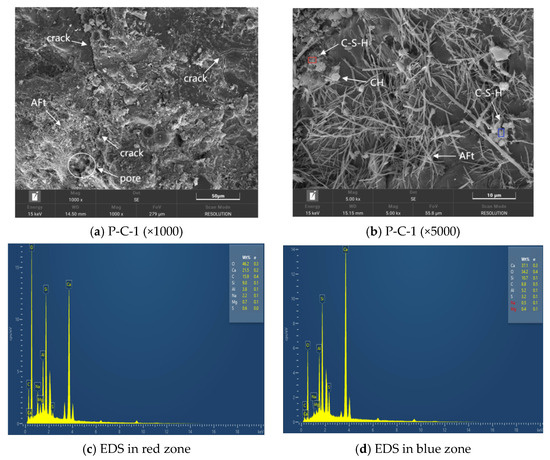
Figure 16.
SEM-EDS images of P-C-1.
As shown in Figure 16a, P-C-1 exhibits pores and cracks, with the sample surface partially covered by Aft. EDS was performed on the red and blue marked points in Figure 16b, with the results shown in Figure 16c,d, respectively. The results indicate that the main elements in the gel-like material are Ca, O, Si, and Al. At the red-marked points, the Ca/Si ratio is 1.7, and when the atomic ratio exceeds 1.5, a significant amount of C-S-H gel is formed. C-S-H gel is primarily calcium silicate hydrate [46], and when the Ca/Si ratio is greater than 1.5, it primarily exists as C-S-H (II) type, an amorphous dense structure typically appearing in the later stages of hydration [47]. At the blue-marked points, the Ca/Si ratio is 2.4. Combined with the XRD spectrum, this indicates that unhydrated C2S or C3S still exists in the sample. Additionally, the presence of Al may originate from unreacted Al2O3 and C3A in fly ash and PO. Therefore, in the P-C-1 image magnified 5000 times, hydration products such as C-S-H gel, hexagonal plate-like CH crystals, and needle-like Aft crystals can be observed.
SEM images magnified 1000 and 5000 times of P-C-3 are shown in Figure 17.
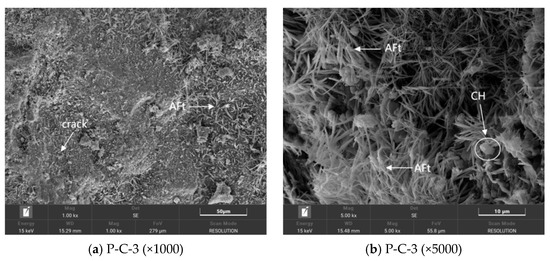
Figure 17.
SEM images of P-C-3.
As shown in Figure 17a, the pores and cracks in P-C-3 are reduced, the surface is more compact, with only minor cracks present, and the cement matrix is extensively covered by hydration products. Needle-like Aft crystals are more abundant than in P-C-1, penetrating the ITZ and forming a bridging reinforcement structure across the interlayer boundaries. Although a higher mud content weakens interfacial bonding, as shown in Figure 17b, the interior is filled with a large amount of Aft crystals. C-S-H gel, CH, and other hydration products are interlocked with Aft crystals, with some even being covered by Aft crystals. These hydration products intertwine, filling the pores and cracks, repairing the weak zones at the mud powder–cement interface, and enhancing the structural density and strength. These hydration products intertwine, filling the pores and cracks, repairing the weak zones at the mud powder-cement interface, and enhancing the structural density and strength. Both significantly strengthen the bond strength at the interlayers (Z-direction) and between filaments (X-direction), thereby reducing the performance differences in the various loading directions. This mechanism differs from the nanoscale physical filling effect of NGPs and their interfacial bonding with cement hydration products [48]. The optimized fluidity and viscosity within the established printability window ensure more uniform material deposition, further promoting a homogeneous microstructure with fewer weak planes.
3.5.4. Image Analysis of Super Depth of Field (SDF)
To further analyze the effects of CSA dosages on the internal pore structure, images magnified 500 times were captured using an ultra-depth 3D microscope and then processed using Image-Pro Plus image 6.0 software. The red areas in the figure represent pores. The super-depth images of samples with different CSA dosages are shown in Figure 18.
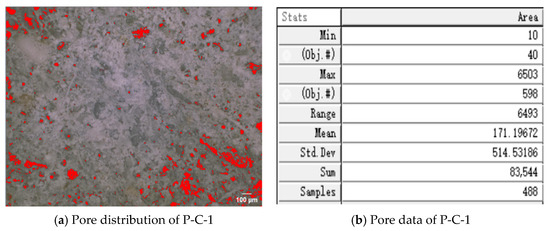
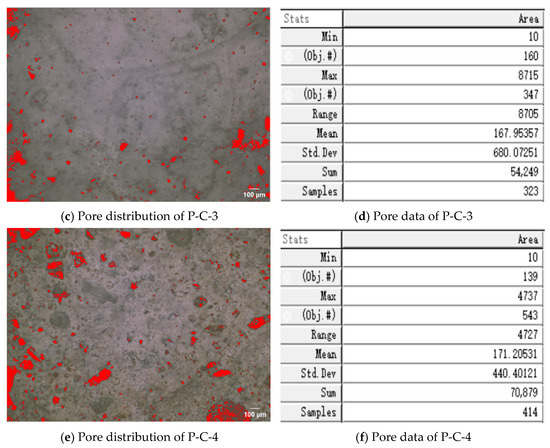
Figure 18.
Super depth of field images of samples with different CSA dosages.
As shown in Figure 18, the red area of P-C-3 is significantly smaller than that of P-C-1. Comparing the data results, the total pore count decreases by approximately 35.1%. The CSA generated during hydration forms Aft, which can fill capillary pores and transition pores, optimizing the pore structure. Additionally, the rapid hydration of CSA reduces the moisture content in the mortar, thereby appropriately reducing the pores caused by moisture evaporation. [49]. Therefore, when the CSA dosage increases from 5% to 15%, the internal structure of the material becomes more compact. Compared with P-C-3, the total pore count in P-C-4 increases to 70,879. When the CSA dosage is high, excessive Aft crystals cause local expansion stress, leading to microcracks and an increase in porosity, resulting in reduced density [50].
It should be noted that pore analysis based on 2D SDF images, while effectively revealing the distribution and relative number of pores on the observed surface, has inherent limitations. This method provides a qualitative assessment of surface porosity and distribution morphology but does not directly measure the total volumetric porosity or the three-dimensional connectivity of the pore network. The “pore count” and area measured are specific to the 2D cross-section and may not fully represent the true 3D pore size distribution or permeability. Therefore, the SDF results presented here should be interpreted as providing valuable comparative, visual evidence of microstructural refinement, rather than absolute quantitative metrics of the 3D pore structure. The observed significant reduction in surface pores for the P-C-3 sample strongly suggests an overall improvement in microstructural density, which is consistent with the mechanical strength test results.
4. Conclusions
This study develops a CRS-based 3D printable mortar system and identifies the range of printable mix proportions. Printability is achieved by optimizing key workability parameters. The workability and mechanical properties of the slurry, mortar, and 3D-printed specimens are systematically characterized. The hydration process of the PO-CSA system is analyzed using XRD, FTIR, and SEM, which, together with 3D optical microscopy, is employed to elucidate the mechanisms governing microstructure and pore refinement. The main conclusions are as follows:
(1) The primary novelty lies in establishing, for the first time, a quantitative printability window (fluidity: 165–195 mm; slump: 10–40 mm) specifically for 3D printing with high-fines CRS. This window ensures continuous extrusion (strip width deviation < ±5%) and stable stacking (cumulative deformation rate ≤ 5%), addressing the critical challenge of applying muddy, poorly graded aggregates in digital fabrication.
(2) The optimal mix design with 15% CSA and a sand–binder ratio of 1.4–1.5 achieves superior performance. Microstructurally, CSA-promoted AFt formation synergizes with C-S-H gel to refine pores, reinforce the interfacial transition zone, and minimize drying shrinkage.
(3) The 3D-printed specimens exhibit anisotropic strength (Z < Y < X), but the anisotropy index is significantly reduced with prolonged curing. Rheology optimization and AFt bridging enhance interlayer bonding, demonstrating the load-bearing potential of CRS-based printed structures.
(4) This research provides a high-value upcycling pathway by transforming low-value CWR into a viable material for load-bearing 3D-printed components. It offers a reproducible framework for incorporating complex solid-waste aggregates into additive manufacturing, enabling source reduction and advancing sustainable construction.
Author Contributions
Conceptualization, supervision, resources, project administration, funding acquisition, formal analysis, writing—review and editing, W.Z.; visualization, validation, software, resources, methodology, investigation, formal analysis, data curation, writing—original draft, C.Y.; conceptualization, visualization, software, methodology, investigation, data curation, X.H.; visualization, software, methodology, M.Z.; visualization, software, methodology, H.Z. All authors have read and agreed to the published version of the manuscript.
Funding
This research was funded by the Key Research and Development Project of the 14th Five-year Plan of China, grant number 2022YFC3803403-02.
Data Availability Statement
The original contributions presented in this study are included in the article; further inquiries can be directed to the corresponding author.
Conflicts of Interest
The authors declare no conflicts of interest.
References
- Wang, D.; Min, F.; Lyu, H.; Chen, J.; Wang, B.; Zhang, J. Recycling waste sand from slurry shield tunneling: A sustainable filter aid for waste slurry dehydration. J. Clean. Prod. 2023, 383, 135387. [Google Scholar] [CrossRef]
- Zhang, N.; Duan, H.; Sun, P.; Li, J.; Zuo, J.; Mao, R.; Liu, G.; Niu, Y. Characterizing the generation and environmental impacts of subway-related excavated soil and rock in China. J. Clean. Prod. 2020, 248, 119242. [Google Scholar] [CrossRef]
- Yin, Y.; Li, B.; Wang, W.; Zhan, L.; Xue, Q.; Gao, Y.; Zhang, N.; Chen, H.; Liu, T.; Li, A. Mechanism of the December 2015 Catastrophic Landslide at the Shenzhen Landfill and Controlling Geotechnical Risks of Urbanization. Engineering 2016, 2, 230–249. [Google Scholar] [CrossRef]
- Xiong, W.; Chen, Y.; Xu, J.; Zhang, Z.; Liang, C. Reuse of engineering waste soil and recycled fine aggregate to manufacture eco-friendly unfired clay bricks: Experimental assessment, data-driven modeling and environmental friendliness evaluation. Case Stud. Constr. Mater. 2023, 19, e02608. [Google Scholar] [CrossRef]
- Zaid, O.; El Ouni, M.H. Advancements in 3D printing of cementitious materials: A review of mineral additives, properties, and systematic developments. Constr. Build. Mater. 2024, 427, 136254. [Google Scholar] [CrossRef]
- Tauer, A.; Posch, H.; Kager, M.; Schubel, D. Recycling or landfill-Experience based on the example of Koralm Tunnel, contract KAT2 from design to construction: Verwertung oder Deponierung-Die Erfahrungen am Beispiel Koralmtunnel, Baulos KAT2 von der Planung bis zur Umsetzung. Geomech. Tunn. 2017, 10, 700–710. [Google Scholar] [CrossRef]
- Muntohar, A.S. Engineering characteristics of the compressed-stabilized earth brick. Constr. Build. Mater. 2011, 25, 4215–4220. [Google Scholar] [CrossRef]
- Jiang, J.; Wang, Y.; Li, J.; Wu, M.; Wang, C.; Bao, W. Characterization and mechanism of sintered light aggregate ceramsite with engineering excavated soil. Structures 2024, 70, 107699. [Google Scholar] [CrossRef]
- Jian, S.; Cheng, C.; Lv, Y.; Wang, C.; Tan, H.; Li, B. Preparation and evaluation of high-fluid backfill materials from construction spoil. Constr. Build. Mater. 2022, 345, 128370. [Google Scholar] [CrossRef]
- Vlieger, J.D.; Boehme, L.; Blaakmeer, J.; Li, J. Buildability assessment of mortar with fine recycled aggregates for 3D printing. Constr. Build. Mater. 2023, 367, 130313. [Google Scholar] [CrossRef]
- Yao, W.; Gao, Y.; Huang, X.; Du, H. Influence of printing speed and extrusion speed on the performance and pore structures of 3D printed mortar. Constr. Build. Mater. 2010, 493, 143157. [Google Scholar] [CrossRef]
- Hou, S.; Wu, W.; Duan, Z.; Zou, S.; Liang, C.; Ye, J.; Xiao, J. Rheology of fiber-reinforced mortar for 3D printing construction: Effect of recycled hybrid powder and polyethylene fiber. Constr. Build. Mater. 2024, 447, 138126. [Google Scholar] [CrossRef]
- Cho, E.; Gwon, S.; Cha, S.; Shin, M. Impact of accelerator on rheological properties of cement composites with cellulose microfibers: 3D printing perspective. J. Build. Eng. 2025, 106, 112538. [Google Scholar] [CrossRef]
- Liu, C.; Xiong, Y.; Chen, Y.; Jia, L.; Ma, L.; Deng, Z.; Wang, Z.; Chen, C.; Banthia, N.; Zhang, Y. Effect of sulphoaluminate cement on fresh and hardened properties of 3D printing foamed concrete. Compos. Part B Eng. 2022, 232, 109619. [Google Scholar] [CrossRef]
- Luo, W.; Liu, Y.; Lv, J.; Liu, H.; Li, H.; Chen, W. Mechanical and shrinkage properties of engineered cementitious composites with blended use of high-belite sulphoaluminate cement and ordinary Portland cement. J. Build. Eng. 2025, 106, 112551. [Google Scholar] [CrossRef]
- Panda, B.; Paul, S.C.; Hui, L.J.; Tay, Y.W.D.; Tan, M.J. Additive manufacturing of geopolymer for sustainable built environment. J. Clean. Prod. 2017, 167, 281–288. [Google Scholar] [CrossRef]
- Kilic, U.; Ma, J.; Baharlou, E.; Ozbulut, O.E. Effects of viscosity modifying admixture and nanoclay on fresh and rheo-viscoelastic properties and printability characteristics of cementitious composites. J. Build. Eng. 2023, 70, 106355. [Google Scholar] [CrossRef]
- Yin, Y.; Huang, J.; Wang, T.; Yang, R.; Hu, H.; Manuka, M.; Zhou, F.; Min, J.; Wan, H.; Yuan, D.; et al. Effect of Hydroxypropyl methyl cellulose (HPMC) on rheology and printability of the first printed layer of cement activated slag-based 3D printing concrete. Constr. Build. Mater. 2023, 405, 133347. [Google Scholar] [CrossRef]
- Nematollahi, B.; Vijay, P.; Sanjayan, J.; Nazari, A.; Xia, M.; Naidu Nerella, V.; Mechtcherine, V. Effect of Polypropylene Fibre Addition on Properties of Geopolymers Made by 3D Printing for Digital Construction. Materials 2018, 11, 2352. [Google Scholar] [CrossRef]
- Vargas, A.; Robayo-Salazar, R.; Mejía de Gutiérrez, R. Effects of Incorporating Fine Aggregates and Polypropylene Microfibres on the Cracking Control of 3D Printed Cementitious Mixtures. Buildings 2024, 15, 55. [Google Scholar] [CrossRef]
- JGJ/T 70-2009; Standard for Test Method of Performance on Building Mortar. Ministry of Housing and Urban-Rural Development of the People’s Republic of China: Beijing, China; China Architecture and Building Press: Beijing, China, 2009. (In Chinese)
- T/CECS 786-2020; Technical Specification for Concrete 3D Printing. China Association for Engineering Construction Standardization: Beijing, China; China Planning Press: Beijing, China, 2020. (In Chinese)
- GB/T 2419-2005; Test Method for Fluidity of Cement Mortar. General Administration of Quality Supervision, Inspection and Quarantine of the People’s Republic of China: Beijing, China; Standards Press of China: Beijing, China, 2005. (In Chinese)
- GB/T 50080-2016; Standard for Test Method of Performance on Ordinary Fresh Concrete. Ministry of Housing and Urban-Rural Development of the People’s Republic of China: Beijing, China; China Architecture and Building Press: Beijing, China, 2017. (In Chinese)
- GB/T 17671-2021; Test Method of Cement Mortar Strength (ISO Method). General Administration of Quality Supervision, Inspection and Quarantine of the People’s Republic of China: Beijing, China; Standards Press of China: Beijing, China, 2021. (In Chinese)
- Ma, G.; Li, Z.; Wang, L.; Wang, F.; Sanjayan, J. Mechanical anisotropy of aligned fiber reinforced composite for extrusion-based 3D printing. Constr. Build. Mater. 2019, 202, 770–783. [Google Scholar] [CrossRef]
- Gao, Y.; De Schutter, G.; Ye, G.; Tan, Z.; Wu, K. The ITZ microstructure, thickness and porosity in blended cementitious composite: Effects of curing age, water to binder ratio and aggregate content. Compos. Part B Eng. 2014, 60, 1–13. [Google Scholar] [CrossRef]
- Guo, C.; Chen, N.; Wang, R. Study on hydroxypropyl methylcellulose modified Portland cement-sulphoaluminate cement composites: Rheology, setting time, mechanical strength, resistance to chloride ingress, early reaction kinetics and microstructure. J. Build. Eng. 2024, 98, 111070. [Google Scholar] [CrossRef]
- Long, Z.; Long, G.; Tang, Z.; Shangguan, M.; Zhang, Y.; Wang, L.; Peng, L.; Yi, M. Hydration, strength, and microstructure evolution of Portland cement-calcium sulphoaluminate cement-CSH seeds ultra-early strength cementitious system. Constr. Build. Mater. 2024, 430, 136492. [Google Scholar] [CrossRef]
- Guo, C.; Wang, R. Using sulphoaluminate cement and calcium sulfate to modify the physical-chemical properties of Portland cement mortar for mechanized construction. Constr. Build. Mater. 2023, 367, 130252. [Google Scholar] [CrossRef]
- Bhat, R.; Han, T.; Sant, G.; Neithalath, N.; Kumar, A. A comprehensive analysis of hydration kinetics and compressive strength development of fly ash-Portland cement binders. J. Build. Eng. 2024, 88, 109191. [Google Scholar] [CrossRef]
- Li, J.; Chen, Y.; Wan, C. A mix-design method for lightweight aggregate self-compacting concrete based on packing and mortar film thickness theories. Constr. Build. Mater. 2017, 157, 621–634. [Google Scholar] [CrossRef]
- Wu, E.; Ma, X.; Fang, C.; Li, N.; Jia, L.; Jiang, P.; Wang, W. Strength performance and microscopic mechanism of cement mortar incorporating fine recycled concrete aggregate and natural sand. J. Build. Eng. 2025, 100, 111767. [Google Scholar] [CrossRef]
- Li, X.; Zhang, W.; Zhang, X.; Zhang, Y.; Zhang, L. Effects of inert particles in supplementary cementitious materials on the performance of super-sulfated cement and the enhancement mechanism of lithium slag. Constr. Build. Mater. 2025, 472, 140974. [Google Scholar] [CrossRef]
- Lopez-Zaldivar, O.; Lozano-Diez, R.V.; Verdu-Vazquez, A.; Llaurado-Perez, N. Effects of the addition of inertized MSW fly ash on calcium aluminate cement mortars. Constr. Build. Mater. 2017, 157, 1106–1116. [Google Scholar] [CrossRef]
- Petkova, V.; Stoyanov, V.; Mihaylova, K.; Kostova, B. Impact of pozzolanic and inert powders on the microstructure and thermal chemistry of cement mortars. Ceram. Int. 2025, 51, 5514–5527. [Google Scholar] [CrossRef]
- Chen, B.; Rao, M.; Feng, Y. Effects of curing temperature and supplementary cementitious materials on the interfacial transition zone (ITZ) of high-ferrite cement products. Constr. Build. Mater. 2024, 425, 135920. [Google Scholar] [CrossRef]
- Ahmad, Z.; Qureshi, M.I.; Ahmad, F.; El Ouni, M.H.; Asghar, M.Z.; Ghazouani, N. Effect of macro synthetic fiber (MSF) on the behavior of conventional concrete and the concrete containing e-waste aggregates. Mater. Struct. 2025, 58, 234. [Google Scholar] [CrossRef]
- Dai, P.; Lyu, Q.; Zong, M.; Zhu, P. Effect of waste plastic fibers on the printability and mechanical properties of 3D-printed cement mortar. J. Build. Eng. 2024, 83, 108439. [Google Scholar] [CrossRef]
- Li, L.G.; Xiao, B.; Kou, S. Influences of fiber length on the printability and strength of glass fiber-reinforced 3D-printed mortar. J. Intell. Constr. 2025, 3, 1–14. [Google Scholar] [CrossRef]
- Gurunandan, M.; Malla, H.J.; Nanthagopalan, P. Effect of water to binder, aggregate to binder ratio and admixtures on printability and mechanical properties of 3D printable mortar mixtures. J. Build. Eng. 2025, 99, 111649. [Google Scholar] [CrossRef]
- Tang, J.; Zhang, D.; Ma, G.; Ji, X.; Zhou, W. Early Hydration of Calcium Sulfoaluminate Cement at Elevated Temperaturesv. ACS Sustain. Chem. Eng. 2024, 12, 13654–13668. [Google Scholar] [CrossRef]
- Wu, Y.; Li, P.; Huang, X.; Li, W.; Sun, J.; Ma, S. Study on hydration mechanism of Ternesite-Ye’elimite binary system. Constr. Build. Mater. 2024, 421, 135699. [Google Scholar] [CrossRef]
- Higl, J.; Hinder, D.; Rathgeber, C.; Ramming, B.; Linden, M. Detailed in situ ATR-FTIR spectroscopy study of the early stages of C-S-H formation during hydration of monoclinic C3S. Cem. Concr. Res. 2021, 142, 106367. [Google Scholar] [CrossRef]
- Li, X.; Brigiano, F.S.; Pezzotti, S.; Liu, X.; Chen, W.; Chen, H.; Li, Y.; Li, H.; Lin, X.; Zhang, W.; et al. Unconventional structural evolution of an oxide surface in water unveiled by in situ sum-frequency spectroscopy. Nat. Chem. 2025, 17, 198–203. [Google Scholar] [CrossRef] [PubMed]
- Lothenbach, B.; Scrivener, K.; Hooton, R.D. Supplementary cementitious materials. Cem. Concr. Res. 2011, 41, 1244–1256. [Google Scholar] [CrossRef]
- Chen, B.; Fang, X.; Zhao, Y.; Li, Z. Ca/Si-dependent size of silica nanoparticles derived from C-S-H at high water to solid ratio. Cem. Concr. Res. 2024, 187, 107729. [Google Scholar] [CrossRef]
- Ahmad, F.; Jamal, A.; Iqbal, M.; Alqurashi, M.; Almoshaogeh, M.; Al-Ahmadi, H.M.; E. Hussein, E. Performance Evaluation of Cementitious Composites Incorporating Nano Graphite Platelets as Additive Carbon Material. Materials 2022, 15, 290. [Google Scholar] [CrossRef] [PubMed]
- Xie, Y.; Qian, C. Improved ettringite stabilization by calcium carbonate and calcium nitrate additions in ternary PC-CSA-C$ systems. Cem. Concr. Res. 2024, 175, 107383. [Google Scholar] [CrossRef]
- Zhang, Z.; Hu, Y.; Xiong, L.; Geng, G. The influence of portlandite, calcite, quartz and ettringite inclusions on the multiscale mechanical behaviors of C-S-H matrix. Cem. Concr. Res. 2025, 189, 107781. [Google Scholar] [CrossRef]


Disclaimer/Publisher’s Note: The statements, opinions and data contained in all publications are solely those of the individual author(s) and contributor(s) and not of MDPI and/or the editor(s). MDPI and/or the editor(s) disclaim responsibility for any injury to people or property resulting from any ideas, methods, instructions or products referred to in the content. |
© 2026 by the authors. Licensee MDPI, Basel, Switzerland. This article is an open access article distributed under the terms and conditions of the Creative Commons Attribution (CC BY) license.