Abstract
Noncontact, high-fidelity data acquisition has enabled terrestrial laser scanning (TLS) to be widely adopted for bridge geometry measurement and condition monitoring. In TLS applications, point cloud registration directly affects data quality and the correctness of subsequent results. For long-span bridges in large-scale scenes, complex geometry and sparse sampling pose challenges to surface-based, data-driven registration methods, and may degrade registration accuracy. A data-driven approach for high-precision point cloud registration, referred to as the Iterative Closest-Surface (IC-Surface) method, is presented in this study. The method extracts neighboring surface patches via a bounding box and applies random sampling-based plane fitting to derive surface features for registration, effectively mitigating the impact of sparse points and outliers in long-span bridges. Regular points are generated on the source patch and projected onto the corresponding target patch to establish high precision correspondences, yielding a stable and accurate transformation. This method effectively overcomes the limitations of the Iterative Closest Point (ICP), which struggles with unreliable correspondences and outliers. Comparative experiments were conducted using synthetic data, large bridge segments, and full-bridge datasets against commonly used registration methods. The results show that the IC-Surface method maintains high accuracy and stability across varying levels of outliers and overlap ratios. In complex scenes, IC Surface achieves higher registration accuracy than both ICP and the sphere target method, with distance errors reduced from 3 mm to 1 mm and inter-plane angle errors reduced from 0.016 rad to 0.009 rad. These findings demonstrate the method’s broad applicability in digital construction and operation and maintenance assessments of long-span bridges.
1. Introduction
Throughout a bridge’s service life, the detection and monitoring of its geometry are critical. These processes include dimensional inspection in the manufacturing stage [1,2,3], alignment control during construction [4,5,6,7], and deformation monitoring in operation [8,9,10,11], and they directly affect construction safety and the evaluation of service performance. However, as the span increases, bridge geometry becomes more complex and larger in scale, posing significant challenges to traditional surveying techniques. Conventional methods rely on total stations and theodolites for point-wise measurements. Although modern total stations with prisms can achieve millimeter-level accuracy, such measurements are sparse and require target placement, resulting in limited spatial coverage and making comprehensive monitoring of the as-built geometry difficult [12]. With advances in surveying, a global positioning system enables real-time dynamic monitoring of target points [13]. Nevertheless, existing positioning and solution techniques often fail to meet the accuracy requirements for bridge monitoring and are markedly less precise than total station-based measurements [14]. Photogrammetry can be used for either three-dimensional model reconstruction or tracking signalized targets [15,16]. However, for long-span bridges, modeling time and cost are high, and accuracy is difficult to guarantee under large-scale occlusions, while target tracking still provides only discrete measurements and cannot capture the continuous surface geometry [1,17]. Terrestrial laser scanning (TLS) is an advanced technique for rapid acquisition of structural geometry. It performs three-dimensional imaging in the form of point clouds [18], capturing Cartesian x, y, z coordinates together with intensity and color information. Owing to its non-contact, high-fidelity data acquisition, TLS shows strong potential for bridge geometry assessment and has been applied to construction control [12], virtual trial assembly [19], dimensional inspection [20], and deformation monitoring [21].
To capture the geometric state of long-span bridges in large-scale scenes, multiple instrument positions must be deployed to overcome occlusions and view limitations. The point clouds from these stations need to be registered into a common coordinate system to form a complete bridge point cloud model. The accuracy of the registration directly determines the precision of the resulting bridge point cloud model. Point cloud registration typically follows a coarse to fine strategy [22]. Coarse registration estimates approximate six degrees of freedom (6-DoF) rotation and translation between stations and provides the initial pose for fine registration [23]. Coarse registration commonly includes feature-based approaches [24,25], four point congruent sets-based registration [26], and probability-based registration [27]. The efficiency and robustness of coarse registration have been improved through advances in feature extraction and search strategies [28,29,30,31,32]. The fine registration stage refines the initial rotation and translation and determines the final registration accuracy of the model. Two main types of fine registration methods exist: target based and data driven. For target-based methods, commonly used targets include spherical targets and checkerboard targets. Corresponding points are obtained by extracting target features at identical locations in the source and target point clouds, and the transformation matrix is solved from these point pairs. Consequently, the accuracy of registration is determined by the accuracy with which target features are extracted [33,34]. For long-span bridges, as the measurement range increases, the point density on the target surfaces decreases, meaning that fewer points are captured on the targets. This phenomenon increases the uncertainty in estimating the target centers and may degrade registration accuracy. Bridge point cloud models are often expected to achieve millimeter-level accuracy to support subsequent construction control and deformation monitoring. Therefore, spherical and checkerboard targets often fail to meet the registration accuracy requirements of long-span bridges. In addition, targets must be placed between instrument positions for target-based methods, and the field workload is increased accordingly. Another class is represented by data-driven registration, with the iterative closest point (ICP) algorithm being the canonical example. Classical ICP is formulated by minimizing the Euclidean distance between transformed points and their nearest neighbors, i.e., a point-to-point metric [35]. However, ICP is sensitive to the initial state, including overlap ratio, noise, and outlier levels [36]. Numerous ICP variants have been proposed to improve registration accuracy and efficiency. Efforts have been directed toward enlarging the basin of convergence and improving robustness to outliers, low overlap, and occlusions. Fitzgibbon et al. [37] improved the ICP objective by using the Levenberg–Marquardt nonlinear optimizer, effectively expanding the convergence range. Yang et al. [38] introduced the globally optimal ICP, extending ICP to global optimization via a branch-and-bound strategy; the convergence range was enlarged, but a marked increase in computational cost and persistent sensitivity to outliers were noted. Zhang et al. [39] introduced robust cost functions in robust ICP, strengthening the alignment step. Accuracy was also improved by refining correspondences between epochs of point clouds. Chetverikov et al. [40] proposed trimmed ICP, in which point pairs with smaller local residuals are selected by a least-squares trimming scheme; however, the method is sensitive to the overlap ratio of the point clouds. Bae et al. [41] introduced an ICP algorithm based on random sample consensus (RANSAC) with curvature and normal-vector primitives, by which more efficient and accurate matching can be achieved. Bouaziz et al. [42] developed sparse ICP, where the ICP problem is formulated as an optimization under a sparse lp-norm, enabling systematic handling of outliers. Nevertheless, these ICP variants optimize their objective functions under point-to-point correspondences defined by nearest neighbors between the two point clouds. In practical scenes, both epochs are contaminated by noise, and theoretically identical points do not exist. When an exact one-to-one correspondence is absent, the registration accuracy of ICP deteriorates markedly [36]. Moreover, for long-span bridges in large-scale scenes, the point clouds are relatively sparse, which amplifies errors in inter-epoch correspondences and degrades the accuracy of the resulting model. Accordingly, a point cloud registration method tailored to long-span bridges is urgently needed.
A high-precision point cloud registration method for long-span bridges in large-scale scenes is proposed, namely, the iterative closest-surface (IC-Surface) method. The core idea is to exploit the abundance of planar and curved features on bridge surfaces: After coarse registration, common surface patches are identified between the two point clouds, and an iterative objective is formulated by minimizing the inter-patch distance. Specifically, a bounding box is used to extract the coarsely registered bridge point clouds; points within the box are classified into planar and curved regions, and surface features are fitted using random sampling. Finally, regular points are generated on the fitted patches and projected to the counterpart patches so that precise correspondences are constructed, achieving accurate registration.
The main advantages of IC-Surface over ICP are as follows: (1) The number of points to be processed is reduced by extracting point clouds using a bounding box; (2) registration is driven by bridge surface features fitted via random sampling, which improves robustness to outliers and noise in the sparse point clouds of long-span bridges; and (3) precise correspondences are established by constructing corresponding points, which overcomes the degraded accuracy of ICP under outliers and the absence of reliable correspondences.
The remainder of this paper is organized as follows. In Section 2, the challenges of applying classical point cloud registration schemes to long-span bridges are analyzed. In Section 3, a data-driven, high-precision registration method for bridge point clouds is presented. In Section 4, the performance of the proposed method is validated using synthetic data, and the method is applied to an actual bridge segment and the entire bridge. In Section 5, the study is concluded.
2. Analysis of Classic Registration Methods in Long-Span Bridges
2.1. Target-Based Registration Methods
In target-based registration, stable, high-quality point clouds are acquired by exploiting the geometric or radiometric attributes of the targets, and the coordinates of feature points on the targets are computed from their feature relations. With the spherical target taken as an example, registration is performed by fitting a sphere to the target point cloud, from which the center coordinates are obtained. The fitted sphere centers in the target point cloud (PC1) and the source point cloud (PC2) are used as corresponding points to solve a rigid-body transformation, implemented via a spatial similarity transformation. The procedure is illustrated in Figure 1.
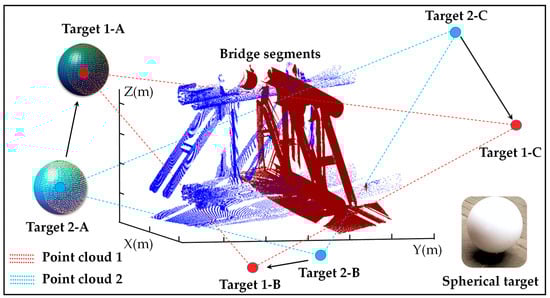
Figure 1.
The registration procedure for spherical targets.
However, in large-scale scanning of long-span bridges, the distance between the spherical target and the scanner is relatively large. Owing to the size and geometry of the sphere, excessive incidence angles between the laser and the spherical surface can induce edge point cloud drift, as illustrated in Figure 2. The edge drift is concentrated predominantly on the side opposite the scanner rather than being uniformly distributed random noise. Although the known sphere diameter can be used as a geometric constraint during fitting to mitigate the influence of edge drift, it may still bias the estimated sphere-center coordinates. Bias in the sphere-center coordinates propagates to the estimated rotation angles of the transformation; the geometric offset induced by rotation-angle bias is linearly proportional to range. In large-scale bridge scanning, a rotation-angle bias of 0.0001 rad yields a geometric offset of 1 mm at 10 m, whereas the offset reaches 10 mm at 100 m. Accordingly, spherical targets exhibit inherent limitations for registration of point clouds in large-scale bridge scenarios. Moreover, target placement between instrument positions must be planned in advance, and the associated field workload is increased.
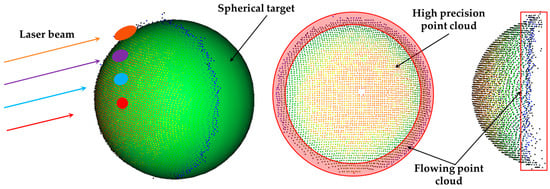
Figure 2.
Edge drift in the point cloud of a spherical target.
2.2. Data-Driven Registration Methods
ICP is a representative data-driven algorithm and is widely applied to the registration of three-dimensional shapes. Its objective is to estimate a 6-DoF rigid transformation, represented by a 3-DoF rotation matrix R and a 3-DoF translation vector t. After the rigid transformation, the target and source point clouds are aligned by globally minimizing a mean-squared distance metric over all six degrees of freedom, even when correspondences are initially unknown. Accordingly, nearest neighbors in the target point cloud are sought for points in the source, and one-to-one correspondences between the two sets are established. The point in point cloud A and the point in point cloud B constitute a corresponding pair, subject to Equation (1).
Once the correspondences have been established, the error function is minimized to estimate the rigid transformation parameters. The error function is given in Equation (2).
where denotes the error function between the two point clouds. According to the principle of ICP, the correspondence between the target and source point clouds is critical. However, in practical scans, exact one-to-one correspondences do not exist between the two point clouds, and ICP registration accuracy is degraded. As shown in Figure 3a, when the two epochs to be registered possess exactly identical corresponding points, exact registration with ICP is attained. Point clouds with exactly identical correspondences are referred to as same-origin point clouds, which typically arise in virtually generated datasets. For real two-epoch point clouds, such correspondences are absent. Owing to clutter, noise, and outliers, minimizing the ICP objective is not theoretically equivalent to exact registration, as illustrated in Figure 3b. Due to constraints on data volume, scanning time, and processing cost, point clouds acquired in large-scale TLS surveys of long-span bridges are often sparse. This sparsity further complicates the application of ICP, as registration errors may accumulate and prevent the resulting model from meeting bridge accuracy requirements.
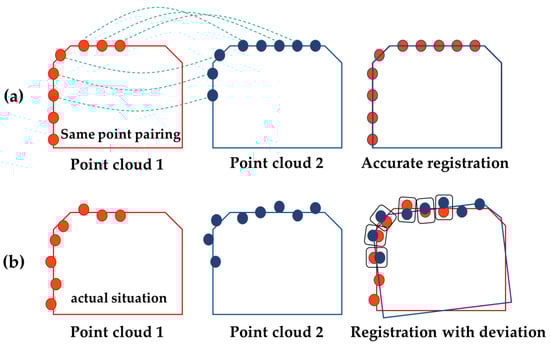
Figure 3.
Schematic illustration of ICP registration error. (a) Ideal point cloud registration; (b) Actual point cloud registration.
3. Methodology
On the basis of the preceding analysis, the IC-Surface method is proposed as a high-precision registration algorithm for point clouds of long-span bridges. As a feature-based, data-driven registration approach, it reduces the burden of field scanning compared with target-based registration. In addition, a bounding box is used to extract the bridge point clouds; surface patches on the structure are fitted, and correspondences are constructed for registration. The intent is to match point clouds via surface patch features, thereby avoiding—at the principle level—the loss of accuracy in ICP caused by the absence of truly identical correspondences in practical scans. A flowchart of the proposed method is shown in Figure 4. The IC-Surface registration procedure is summarized in Algorithm 1.
| Algorithm 1. IC-Surface point cloud registration |
| IC-Surface Point Cloud Registration Algorithm |
| Input: Dataset Data_A of Point cloud A, Dataset Data_B of Point cloud B; //A is the target point cloud, B is the point cloud to be converted. Output: Point cloud B transformed point cloud Data_ B’; 1. Size(Box) = e, Single subsample capacity n;//e is the size of the cube bounding box; 2. Using Box to traverse Data_A ∩ Data_B, partition it into paired blocks (Block_Ai and Block_Bi) for planar and curved surface fitting. 3. Using RANSAC, the curved-surface and planar feature parameters of each surface point cloud block within the bounding box, Block_Ai and Block_Bi, are estimated; 4. Using BIC, the final fitted surface domain Pia for point cloud block Block_Ai and Pib for Block_Bi are determined; //According to Equation (6), the smaller score indicates the better model; 5. On the fitted surface Pia, a resampled point set {Ai} is generated; {Ai} is then projected onto the fitted surface Pib to obtain the projected set {Bi}; 6. All valid point cloud block Block_Ai point sets {Ai} form the reference point cloud matrix A for calculating transformation parameters, and all valid point cloud block Block_Bi point sets {Bi} form the transformation point cloud matrix B. The rigid transformation parameters for point cloud registration are then solved using matrices; 7. Constructing the objective function ; /The variance of the point-to-point distances is used as the residual to control the overall registration accuracy. 8. Using Equations (8) and (9) to solve for the transformation parameters; 9. End; |
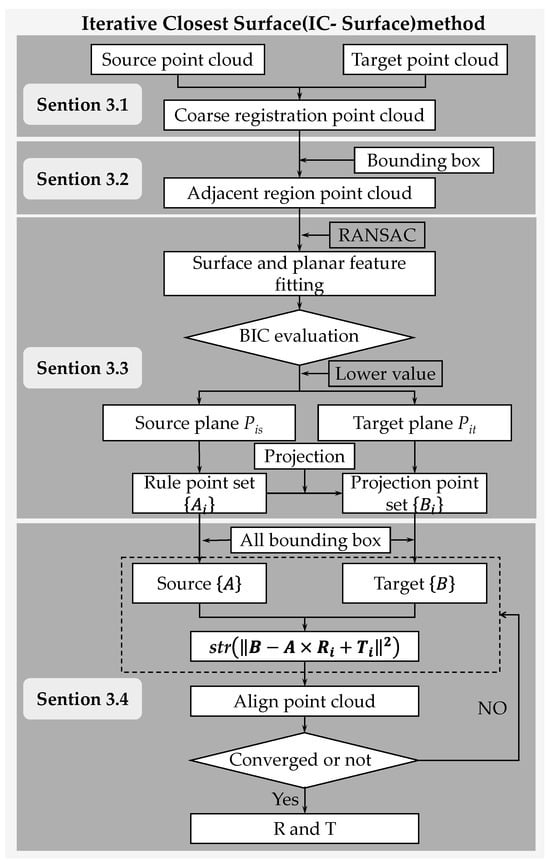
Figure 4.
Flowchart of the proposed method.
3.1. Coarse Registration
Point clouds of a long-span bridge were acquired using a terrestrial laser scanner, as shown in Figure 5a. Various established algorithms [24,25,43] can be employed for coarse registration of point clouds. This study performs coarse registration using the 4-Plane Congruent Sets method [43]. After coarse registration, residual layering that manifested as layer-wise separation between source point cloud A and target point cloud B remained, as shown in Figure 5b.
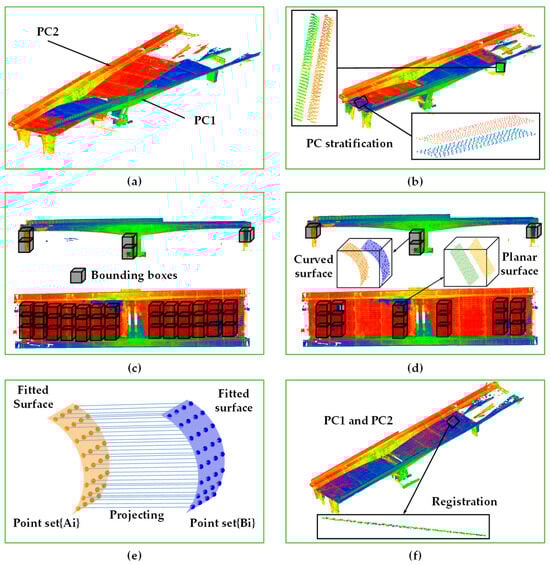
Figure 5.
Steps of the proposed IC-Surface point cloud registration: (a) initial point cloud; (b) coarsely registered point clouds; (c) segmenting point clouds with bounding boxes of a specified size; (d) filtering boxes by selection criteria and fitting planes to the in-box points; (e) generating regular points on the fitted planes; (f) registered point clouds.
3.2. Point Cloud Extraction Using a Bounding Box
Bridge structures contain many smooth planar and curved surfaces—such as pier side faces and girder soffits—with salient structural features. Adjacent surface point clouds are cropped and segmented using a square bounding box with side length z, as illustrated in Figure 5c, and these subsets serve as the objects for surface iteration. The point clouds within each bounding box are processed independently, reducing computational load and improves processing speed. More importantly, the choice of z depends on the spacing between adjacent faces in the coarsely registered point clouds and on the actual face dimensions of the bridge components. If z exceeds the face dimension, then corner points and other off-face points may be included and bias the plane fitting; if z is smaller than the inter-face spacing, then adjacent surface points may be absent from the box. Hence, z directly governs both the quality of the surfaces contained in each box and the number of boxes required. Therefore, the bounding box size should satisfy Equation (3).
where denotes the maximum distance between neighboring faces, and denotes the minimum face dimension among the bridge components, such as pier side faces, girder soffits, and deck surfaces. The recommended value for z is . After the adjacent surface point clouds are segmented using bounding boxes, bounding boxes are filtered out based on the plane-fitting standard deviation of the in-box points and the minimum number of points.
3.3. Surface Feature Discrimination and Fitting
After adjacent point clouds have been extracted using the bounding box, surface feature fitting is required, as illustrated in Figure 5d. Bridge surface features comprise curved and planar regions, for which the fitting equations differ. Accordingly, the surface points within each bounding box are fitted with both curved and planar models, and the models are compared and classified using the Bayesian information criterion (BIC) to determine the final surface feature equation.
First, the surface feature equations are constructed. Curved surfaces and planes are fitted to the data in the bounding boxes for both the source and target point clouds. The curved surface is given in Equation (4).
where αi, βi, χi, δi, εi, and ϕi are the parameters to be estimated when fitting a curved surface to the point cloud data within the i-th bounding box. The plane equation is given in Equation (5).
where ai, bi, and ci are the parameters to be estimated when fitting a plane to the point cloud data within the i-th bounding box.
Subsequently, the feature parameters are estimated. Sparse point clouds of long-span bridges typically contain noise and outliers, which is why these effects must be excluded during surface fitting. In traditional approaches, least-squares fitting is commonly used; however, the estimates can deviate substantially from the ground truth, as illustrated by the sample in Figure 6a, because least squares lacks a mechanism to reject noise and outliers. RANSAC [44] is employed to address this issue. Its main idea is to draw random subsets from the full sample, as shown in Figure 6b. Over repeated trials, estimates computed from inlier subsets remain consistent with the ground truth, whereas estimates from subsets dominated by outliers vary randomly.
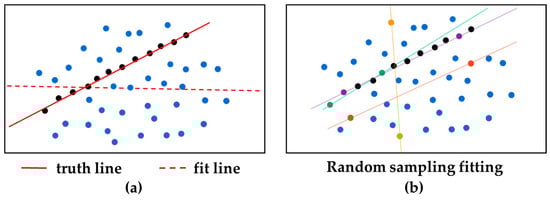
Figure 6.
Ground-truth estimation with asymmetric noise: (a) least-squares fitting versus ground truth; (b) random sampling.
On the basis of this principle, a subset of six points from the source and target point clouds within the bounding box is sampled in each RANSAC iteration, because six is the minimum number required to estimate the parameters of the quadratic surface model. This setting is also sufficient for the planar case. For each subset, the curved-surface and planar feature parameters are estimated, and the empirical probability density of each parameter is computed; the mode of the density is taken as the ground-truth estimate [44,45].
Finally, the surface model is determined. The curved-surface and planar models fitted within each bounding box by using RANSAC must be selected between. The BIC [46], which introduces a penalty related to the number of parameters, is adopted to choose the optimal model. With the use of BIC, the suitability of the two models is evaluated separately on the source and target point clouds within each bounding box, as given in Equation (6).
where denotes the BIC score obtained by fitting either a curved surface or a plane to the source or target point cloud data within the i-th bounding box. n denotes the number of points in the source or target point cloud, denotes the sum of squared distances from the points to the fitted surface, and k denotes the number of model parameters (k = 6 for a curved surface, k = 3 for a plane). After both surface models are evaluated for each point cloud, the model with the smaller is selected as the final surface representation. After the BIC-based model selection, we compute the root-mean-square error (RMSE) of the point-to-surface distances for the fitted model and use it as a quality criterion to filter bounding boxes. The RMSE threshold is set to 0.001 m, and only bounding boxes meeting this criterion are retained for subsequent steps.
3.4. Determination of Correspondences and Fine Registration
First, corresponding features for registration are constructed. Let the surface patches fitted in the i-th bounding box be the target plane and the transformed plane . The plane is resampled according to curvature [47], and a regular point set is generated. The set is then projected onto Pit to form the projected set , as shown in Figure 5e. Points in and that are linked by the projection relation are labeled as corresponding feature points and are used in the subsequent fine registration, thus addressing the absence of correspondences in ICP.
Then, an objective function is formulated for fine registration. All reconstructed points within the bounding boxes are collected as the source set , and all projected points are collected as the target set . The reconstructed points are regularly distributed on the fitted plane and are generated only within the local surface region defined by the bounding box, which is why positional deviations due to noise are absent. The key to registration is to estimate the rotation matrix and translation vector that minimize the distances between neighboring surfaces within each bounding box. Accordingly, the objective is defined as minimizing the distances between the reconstructed points and their corresponding projected points on the counterpart plane, as given in Equation (7).
where denotes the root-mean-square (RMS) error, R is the rotation matrix, and T is the translation vector. The covariance matrix is constructed and decomposed via singular value decomposition (SVD) to solve for R and T, as shown in Equations (8) and (9).
where and are the orthogonal matrices from the SVD of the covariance matrix , and sigma is the diagonal matrix. denotes the mean of , and denotes the mean of . Iterations are performed until Equation (7) converges, with the convergence threshold set to 1 × 10⁻⁵ [48]. On this basis, fine registration of the point clouds is achieved, as shown in Figure 5f.
4. Experiment of Synthetic Data and Real-Bridge Data
Synthetic experiments and field tests on real bridges were designed to comprehensively evaluate the proposed algorithm. The synthetic experiments were intended to verify registration performance under varying overlap ratios and outlier levels. For the field tests, representative cases were devised according to typical acquisition targets in practice—a full-scale bridge component and an entire bridge—to validate the registration effectiveness of the proposed algorithm in real large-scale scenes.
4.1. Synthetic Data Testing
4.1.1. Experimental Information
The performance of the proposed method was compared with that of four registration methods: classical ICP [35], point-to-plane ICP (ICP-P) [49], fast ICP [50], and sparse ICP [42]. In this section, a 3D digital model of a deck-type arch bridge with a span of 210 m and a rise of 42 m was built in a building information modeling (BIM) environment to generate synthetic point cloud data. The model is converted into a point cloud using curvature-based sampling [47], generating a synthetic bridge point cloud with a total of 1 million points, as shown in Figure 7. To evaluate the impact of different overlap ratios on the registration accuracy of the proposed method, the synthesized point cloud data are partitioned into segments along the bridge longitudinal direction. The first 70% of the synthesized point cloud data is used as the target point cloud, and the last 80%, 70%, and 60% are used as the source point cloud to construct point cloud pairs with different overlap ratios. At the same time, the point cloud registration performance of the method under different degrees of outliers was verified by adding Gaussian noise with mean and standard deviation to the synthesized point cloud data as outliers. For a more accurate assessment of the proposed algorithm, bounding boxes with a side length of 1 m were defined on the registered point clouds, and 20 boxes containing planar features were randomly selected. Transformed point cloud (PC1) and target point cloud (PC2) are respectively fitted in a single bounding box, and the unit normal and of the plane are solved. The average angle between the normals of and within m bounding boxes is taken as the angle error . The average difference of the Euclidean distance between the artificial point cloud on and the projected point cloud point pairs on inside m bounding boxes is computed. The performance of the proposed algorithm is evaluated by comparing the proposed method with that of the classical ICP, ICP-P, fast ICP, and sparse ICP algorithms in terms of angle error , distance error , and running time T. Table 1 summarizes the detailed parameter settings for each comparative algorithm in this experiment. and are calculated according to Equations (10) and (11).
where m refers to the number of selected bounding boxes, and refers to the average distance between the artificial point cloud on and the projected point cloud point pairs on within the i-th bounding box.
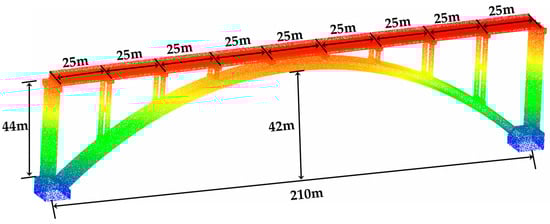
Figure 7.
Synthetic bridge point clouds.

Table 1.
Detailed parameter settings for each comparison algorithm (MNII and MNOI represent the maximum number of inner ICP and outer robust iterations, respectively; and are the maximum and minimal values for the Welsch cost, respectively).
4.1.2. Performance Evaluation
With three overlap levels considered, Table 2 compares the accuracy and efficiency of several representative ICP-based registration algorithms. Overall, as the overlap of point clouds decreases, the running time and registration error of several matching algorithms continue to increase. At several overlap rates, the running time of sparse ICP is the longest among all the algorithms mainly because many point cloud feature point samples are taken, which is the most time-consuming part. By contrast, fast ICP has the highest running speed among all the algorithms, but it comes at the cost of losing registration accuracy, resulting in the worst registration accuracy. ICP-P is achieved by finding the tangent plane with the minimum distance between the transformed point cloud and the target point cloud. It has higher accuracy than ICP does, its running time is reduced by half compared with that of ICP, and its registration accuracy is not significantly different from that of ICP. Robust ICP has high registration accuracy in several overlap rates, second only to the proposed method, but it comes at the cost of running time and has a large computational workload. Compared with other ICP algorithms, the proposed method has better robustness to point cloud overlap and maintains the minimum error. Its running time is only about one fourth of ICP. The most time-consuming part of this method is in using bounding boxes to search for adjacent planes, but it still runs faster than the other ICPs. This finding indicates that the algorithm has excellent performance in different overlap rates, with a running speed second only to that of fast ICP and higher accuracy and robustness than those of sparse ICP and robust ICP.
Table 2.
Comparison results between IC-Surface and other algorithms in point cloud registration operation time T, , and under different overlap rates.
Figure 8 shows the comparison of point cloud registration errors between several algorithms with different standard deviations of Gaussian noise added. The robustness of the proposed algorithm to outliers is evaluated by adding noise with different standard deviations to simulate different degrees of outliers. Overall, both and increase with the increase in Gaussian noise standard deviation. Fast ICP, ICP, and ICP-P are more sensitive to Gaussian noise levels than robust ICP and IC-Surface. As the standard deviation of noise increases, the registration error increases sharply. The main reason is that the fast ICP, ICP, and ICP-P algorithms have no strategy for handling outliers. When the standard deviation of Gaussian noise is 0.1, IC-Surface shows good performance with = 0.004 red and = 0.008 m. The error of robust ICP in is similar to that of the proposed method, while the error in increases significantly, reaching 0.014 rad. The reason for this result is that its outlier rejection strategy has difficulty effectively eliminating the influence of outliers in high-outlier situations. Fortunately, in the process of bounding box plane fitting using the proposed method, both plane fitting and artificial point cloud methods were used, effectively reducing the impact of outliers on the accuracy of point cloud registration. Therefore, the proposed method has good robustness against outliers.
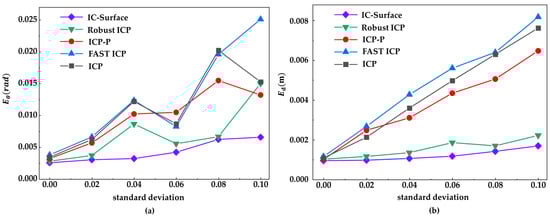
Figure 8.
Multiple methods are used to register Gaussian noise point clouds with different standard deviations. (a) error; (b) error.
4.2. Real-Bridge Experiments
4.2.1. Experiments on an Actual Bridge Segment
- (1)
- Test overview
The point cloud of bridge components is typically acquired for dimensional inspection and virtual trial assembly. In this subsection, the registration accuracy of the proposed method is evaluated on bridge-component point clouds of different densities by adjusting the scanning resolution. The Minjiang Bridge, a long-span concrete-filled steel tube arch bridge, is located in Sichuan, China. This section takes Segment No. 6 on the right carriageway of the south bank of the Minjiang Bridge as the test object. The segment consists of four steel tubes with an outer diameter of 1.3 m, with a length of 28.1 m and a width of 4 m. The segment is a variable-section member, and its height varies from 7.3 m to 6.7 m along the bridge longitudinal direction. The sixth segment on the right carriageway of the south bank was placed vertically on a jig, and checkerboards were pre-adhered to the right surface of the arch rib. As a geometric metric, the checkerboard center distance can reflect the accuracy of point cloud registration [2,51]. One scanning station was arranged on each side (left and right) of the sixth segment of the arch rib. Then, the segment was scanned using TLS at three resolutions (1.6 mm @ 10 m, 3.1 mm @ 10 m, and 6.3 mm @ 10 m). The point clouds from each station were registered using IC-Surface, classical ICP, and the sphere-target method, respectively. After registration, checkerboard center distances were obtained from both the total station and the laser scanner. Setup-induced errors of the total station at different observation points were avoided by measuring all checkerboard centers from the same total-station setup to obtain the ground-truth distances between centers. The checkerboard center distance errors—computed between the point cloud registrations and the total-station measurements—were used as the accuracy metric for each registration method. The TLS used in this study was a Leica Scan Station P50, and the total station was a Leica TS60 (Heerbrugg, Switzerland). A schematic of the on-site scanning and data acquisition for the sixth arch-rib segment is shown in Figure 9.
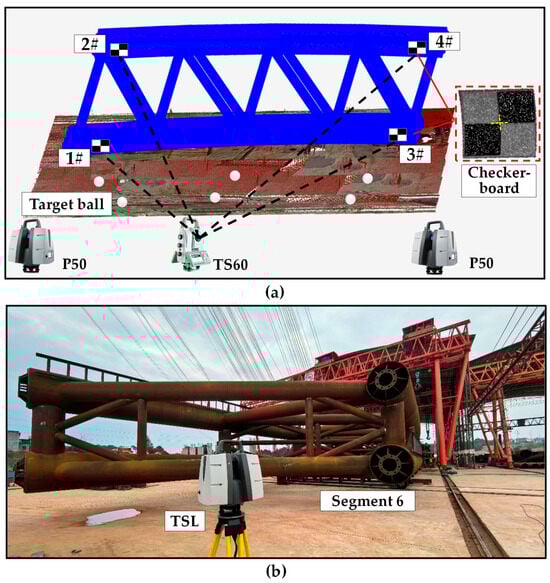
Figure 9.
Point cloud acquisition for the prefabricated arch-rib segment: (a) acquisition layout; (b) field photograph.
- (2)
- Test results
Table 3 presents the deviations of checkerboard-center distances from total-station measurements for registered point clouds produced by the sphere-target method, ICP, and the proposed method across multiple acquisition resolutions. The checkerboard distance index Dij denotes the distance from the i-th checkerboard center to the j-th checkerboard center. The table shows that the proposed IC-Surface method yields a marked improvement in registration accuracy under all conditions. In addition, when the arch-rib segment is scanned at a resolution of 1.6 mm @ 10 m, the point density is high and all three registration methods maintain good accuracy. However, as the resolution is coarsened, the two baseline methods are affected differently. At 3.1 mm @ 10 m, the ICP distance error increases to 1.8 mm, whereas the sphere-target method and the proposed method remain accurate at 0.9 and 0.7 mm, respectively. At 6.3 mm @ 10 m, the ICP error rises to 2.8 mm and the sphere-target error increases to 1.9 mm, indicating a clear degradation in both methods. By contrast, the proposed method still keeps the error within 1.1 mm. These results indicate that the proposed method exhibits better stability for point cloud registration across different resolutions. In summary, the proposed IC-Surface method achieves significantly higher registration accuracy and delivers more stable performance at lower scanning resolutions, making it suitable for point cloud registration of large bridge segments.
Table 3.
Point cloud registration errors for the bridge segment at different acquisition resolutions: proposed method versus other methods.
4.2.2. Validation on the Real Entire Bridge
- (3)
- Bridge overview
The Sujiaba Interchange in Chongqing was used as the test case to evaluate the performance of the IC-Surface algorithm for point cloud registration in a real large-scale scene. Sujiaba is the highest urban ramp bridge in China, with a span of 176 m and a maximum pier height of 72 m. Point clouds were acquired using a Leica ScanStation P50 terrestrial laser scanner. During data acquisition, the measurement range was set to 270 m and the resolution to 3.1 mm @ 10 m. Instrument positions were arranged as shown in Figure 10a,b, and the acquired point clouds are shown in Figure 10c,e. In this experiment, ICP, ICP-P, robust ICP, and sparse ICP were compared against IC-Surface. After coarse registration of the two-station point clouds, residual layering remained, as shown in Figure 11a,b. A bounding-box size of 1 m was then adopted. Boxes were filtered using thresholds on the plane-fitting standard deviation and a minimum in-box point count of 20; boxes that did not meet these criteria were discarded, as shown in Figure 11c. In total, 212 bounding boxes were successfully extracted from the point clouds to be registered, as shown in Figure 11d. For each extracted box, source point cloud PC1 and target point cloud PC2 were used to fit and determine the surface features via random sampling. On plane P1 within each box, 200 regular points were generated and then projected onto plane P2. The rotation matrix and translation vector were solved by minimizing the inter-plane distance. The per-registration runtime in the experiment was 75.77 s.
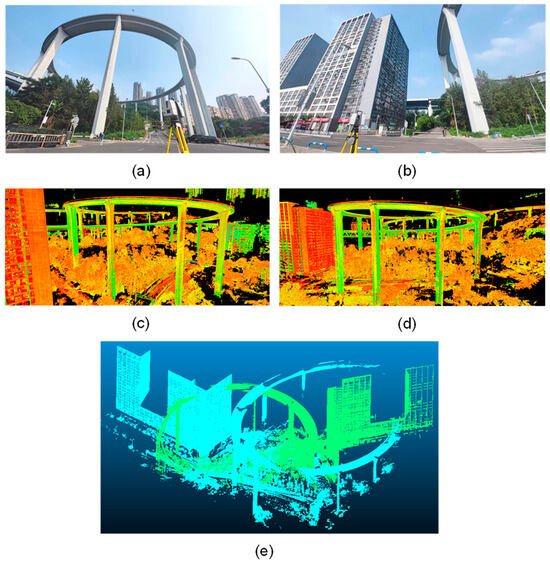
Figure 10.
Point cloud registration experiment at the Sujiaba Interchange: (a) station 1 setup; (b) station 2 setup; (c) station 1 point cloud; (d) station 2 point cloud; (e) pre-registration point clouds.
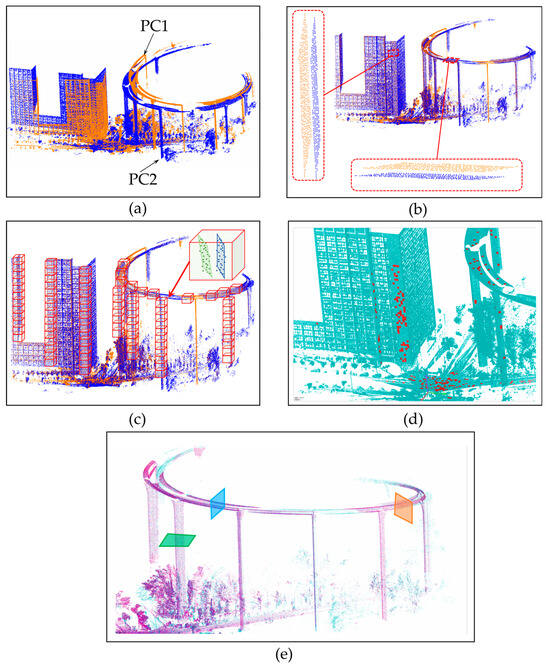
Figure 11.
IC-Surface registration at the Sujiaba Interchange: (a) initial point clouds; (b) coarsely registered point clouds; (c) bounding box layout; (d) selected surface point clouds; (e) registered point clouds.
- (4)
- Application results
Figure 12a presents the registration accuracy of the five methods at the original point cloud density. Overall, all five methods achieve high accuracy at the original density, with the registered point clouds coinciding with the reference cloud and exhibiting no obvious layering. Three local inspection cross sections were specified to facilitate a finer comparison: one at the mid-height of a pier and two along the curved girder at different ranges, as indicated in Figure 11e. Among the methods, ICP shows the largest registration error, with a maximum inter-plane angle error of 0.038 rad and a maximum inter-plane distance error of 0.01 m. The proposed IC-Surface attains the highest accuracy, with inter-plane angle errors below 0.009 rad and neighboring-plane distance errors below 0.001 m. For data-driven ICP, accurate registration becomes difficult—and failures may occur—when the distance between the two station clouds is large. By contrast, IC-Surface achieves accurate registration provided that the distance between the corresponding planes from the two stations is smaller than the bounding-box size.
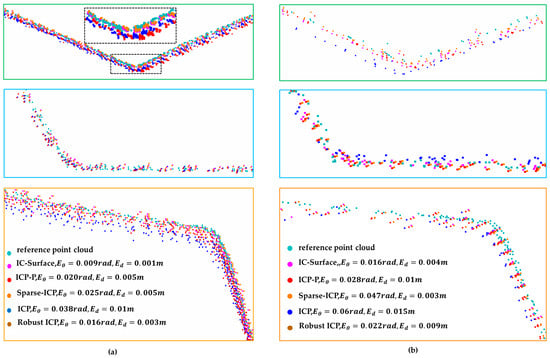
Figure 12.
Comparison of point cloud registration effects among different methods. (a) Point cloud registration effect under the original point cloud density; (b) point cloud registration effect at one-fourth point cloud density.
The point cloud density was reduced to one quarter of the original to further assess robustness. Figure 12b shows local details of the registration outcomes. Overall, the IC-Surface method delivers the best accuracy; although a slight deviation appears at the first cross section, the other two cross sections remain coincident. Robust ICP exhibits slightly inferior performance. The ICP algorithm performs the worst, with pronounced layering observed at all three cross sections. These results indicate that, for bridge-scale large-scene registration, the proposed IC-Surface method enables accurate point cloud registration.
5. Conclusions
A data-driven, high-precision registration algorithm, the Iterative Closest-Surface (IC-Surface) method, is proposed in this study for long-span bridges in large-scale scenes and its effectiveness is validated using synthetic data, full-scale bridge components, and an entire bridge. The main findings are as follows:
- While ICP algorithm establishes correspondences via nearest-neighbor search, the proposed method generates regular points on the fitted plane of the source point cloud within each bounding box and forms high-precision corresponding points based on their projection relationships. This method avoids the lack of exact correspondences in ICP and effectively reduces registration error.
- Based on surface features of bridge structures, the proposed method registers sparse long-span bridge point clouds with improved robustness to outliers and noise. Synthetic-data validation confirms stable accuracy under different outlier levels and overlap ratios.
- Using measured data from a bridge segment and the entire bridge, IC-Surface outperforms the sphere-target method and ICP. The mean neighboring-plane distance decreases from 3 mm to 1 mm at the original density and remains no more than 4 mm when the density is reduced to one quarter, supporting its applicability to large-scale bridge point cloud applications.
- The proposed method performs registration using planar and curved surfaces. These features are widely present on bridge surfaces, which is why the proposed method has good applicability to most bridge types.
- In long-range TLS measurements of large bridge structures, point cloud accuracy tends to decrease and noise may become non-homogeneous as the scanning distance increases, which may affect registration performance. The distance-dependent effects described above have not been systematically investigated in this study. In future work, they will be further examined using real-bridge datasets acquired at long stand-off distances to reveal their influence on registration performance. The resulting findings are also expected to provide guidance for practical trade-offs between the number of instrument positions and the scanning distance per position, thereby improving field survey efficiency while meeting the required registration accuracy.
Author Contributions
Methodology: J.Z. and Y.Z.; software: G.H. and Y.F.; validation: G.H., L.G. and C.L.; writing—original draft preparation: J.Z.; writing—review and editing: J.Z. and Y.Z.; visualization: Y.F., L.G. and S.L.; formal analysis: J.Z. and G.H.; funding acquisition: Y.Z. and Y.F. All authors have read and agreed to the published version of the manuscript.
Funding
This research is funded by the National Key R&D Program of China (Grant No. 2024YFB2605700), the National Natural Science Foundation of China (Grant No. U24A20163), the Science and Technology Project of the Sichuan Provincial Transportation Department (Grant No. 2023-ZL-03), the Chongqing Natural Science Foundation of China (Grant Nos. CSTB2022TIAD-KPX0205 and CSTB2025NSCQ-GPX0835), the Postdoctoral Science Foundation of China (Grant No. 2025M783334) and the Chongqing Municipal Postgraduate Research and Innovation Project (Grant No. CYB25268).
Data Availability Statement
The original contributions presented in this study are included in this article. Further inquiries can be directed to the corresponding authors.
Conflicts of Interest
Author Shengyang Liang was employed by the company CCCC-SHEC Forth Engineering Co., Ltd. The remaining authors declare that the research was conducted in the absence of any commercial or financial relationships that could be construed as a potential conflict of interest.
References
- Mousavi, V.; Rashidi, M.; Mohammadi, M.; Samali, B. Evolution of Digital Twin Frameworks in Bridge Man-agement: Review and Future Directions. Remote Sens. 2024, 16, 1887. [Google Scholar] [CrossRef]
- Zhang, Z.; Liang, D.; Huang, H.; Sun, L. Virtual Trial Assembly of Large Steel Members with Bolted Connec-tions Based on Multiscale Point Cloud Fusion. Comput. Aided Civ. Eng. 2024, 39, 2619–3641. [Google Scholar] [CrossRef]
- Cheng, G.; Liu, J.; Cui, N.; Hu, H.; Xu, C.; Tang, J. Virtual Trial Assembly of Large Steel Members with Bolted Connections Based on Point Cloud Data. Autom. Constr. 2023, 151, 104866. [Google Scholar] [CrossRef]
- Zhou, Y.; Xiang, Z.; Zhang, X.; Wang, Y.; Han, D.; Ying, C. Mechanical State Inversion Method for Structural Performance Evaluation of Existing Suspension Bridges Using 3D Laser Scanning. Comput. Aided Civ. Eng. 2022, 37, 650–665. [Google Scholar] [CrossRef]
- Zhou, Y.; Zhang, H.; Hu, X.; Zhou, J.; Zhu, J.; Xin, J.; Yang, J. Rapid Measurement Method for Cable Tension of Cable-stayed Bridges Using Terrestrial Laser Scanning. Comput. Aided Civ. Eng. 2024, 39, 3269–3288. [Google Scholar] [CrossRef]
- Huang, L.; Xin, J.; Jiang, Y.; Zhou, Y.; Zhang, H.; Zhou, J. A Novel Physics-Informed Deep Learning Method for Predicting Arch Bridge Temperature-Induced Responses. Eng. Struct. 2026, 348, 121750. [Google Scholar] [CrossRef]
- Zhao, L.; Yang, Y.; Xiang, Z.; Zhang, S.; Li, X.; Wang, X.; Ma, X.; Hu, C.; Pan, J.; Zhou, Y.; et al. A Novel Low-Cost GNSS Solution for the Real-Time Deformation Monitoring of Cable Saddle Pushing: A Case Study of Guojiatuo Suspension Bridge. Remote Sens. 2022, 14, 5174. [Google Scholar] [CrossRef]
- Zhou, Y.; Zhu, J.; Zhao, L.; Hu, G.; Xin, J.; Zhang, H.; Yang, J. High-Precision Monitoring Method for Bridge De-formation Measurement and Error Analysis Based on Terrestrial Laser Scanning. Remote Sens. 2024, 16, 2263. [Google Scholar] [CrossRef]
- Xin, J.; Tang, Q.; Zhou, J.; Zhou, Y.; Luo, C.; Jiang, Y. A Novel Method for Calculating the Ultimate Bearing Capacity of In-Service RC Arch Bridges Using Sectional Constitutive Relation. Appl. Math. Model. 2025, 138, 115829. [Google Scholar] [CrossRef]
- Tang, Q.; Xin, J.; Jiang, Y.; Wang, K.; Zhou, J. Efficient Assessment Method for Structural Safety of Long-Span Arch Bridges Using Subset Simulation and Copula Model. Appl. Math. Model. 2026, 154, 116726. [Google Scholar] [CrossRef]
- Xin, J.; Tao, G.; Tang, Q.; Zou, F.; Xiang, C. Structural Damage Identification Method Based on Swin Transformer and Continuous Wavelet Transform. Intell. Robot. 2024, 4, 200–215. [Google Scholar] [CrossRef]
- Li, X.-X.; Deng, E.; Wang, Y.-W.; Ni, Y.-Q. 3D Laser Scanning for Predicting the Alignment of Large-Span Seg-mental Precast Assembled Concrete Cable-Stayed Bridges. Autom. Constr. 2023, 155, 105056. [Google Scholar] [CrossRef]
- Wang, H.; Dai, W.; Yu, W. BDS/GPS Multi-Baseline Relative Positioning for Deformation Monitoring. Remote Sens. 2022, 14, 3884. [Google Scholar] [CrossRef]
- Xin, J.; Mo, X.; Jiang, Y.; Tang, Q.; Zhang, H.; Zhou, J. Recovery Method of Continuous Missing Data in the Bridge Monitoring System Using SVMD-Assisted TCN–MHA–BiGRU. Struct. Control Health Monit. 2025, 2025, 8833186. [Google Scholar] [CrossRef]
- Teo, T.-A.; Mei, K.-H.; Yuen, T.Y.P. A Markerless Photogrammetric Framework with Spatio-Temporal Refinement for Structural Deformation and Strain Monitoring. Buildings 2025, 15, 3584. [Google Scholar] [CrossRef]
- Lee, H.; Oh, J. 3D Displacement Measurement of Railway Bridge According to Cyclic Loads of Different Types of Railcars with Sequential Photogrammetry. Appl. Sci. 2023, 13, 1359. [Google Scholar] [CrossRef]
- Lv, Y.; Kang, C.; Liu, J.; Zhou, H. A Point Cloud Registration Method for Steel Tubular Arch Rib Segments of CFST Arch Bridges Based on Local Geometric Constraints. Buildings 2025, 15, 2130. [Google Scholar] [CrossRef]
- Zeybek, M.; Şanlıoğlu, İ. Accurate Determination of the Taşkent (Konya, Turkey) Landslide Using a Long-Range Terrestrial Laser Scanner. Bull. Eng. Geol. Environ. 2015, 74, 61–76. [Google Scholar] [CrossRef]
- Zhou, Y.; Han, D.; Hu, K.; Qin, G.; Xiang, Z.; Ying, C.; Zhao, L.; Hu, X. Accurate Virtual Trial Assembly Method of Prefabricated Steel Components Using Terrestrial Laser Scanning. Adv. Civ. Eng. 2021, 2021, 9916859. [Google Scholar] [CrossRef]
- Rausch, C.; Nahangi, M.; Perreault, M.; Haas, C.T.; West, J. Optimum Assembly Planning for Modular Construction Components. J. Comput. Civ. Eng. 2017, 31, 04016039. [Google Scholar] [CrossRef]
- Erdélyi, J.; Kopáčik, A.; Kyrinovič, P. Spatial Data Analysis for Deformation Monitoring of Bridge Structures. Appl. Sci. 2020, 10, 8731. [Google Scholar] [CrossRef]
- Guo, Y.; Sohel, F.; Bennamoun, M.; Lu, M.; Wan, J. Rotational Projection Statistics for 3D Local Surface Description and Object Recognition. Int. J. Comput. Vis. 2013, 105, 63–86. [Google Scholar] [CrossRef]
- Xu, Y.; Boerner, R.; Yao, W.; Hoegner, L.; Stilla, U. Pairwise Coarse Registration of Point Clouds in Urban Scenes Using Voxel-Based 4-Planes Congruent Sets. ISPRS J. Photogramm. Remote Sens. 2019, 151, 106–123. [Google Scholar] [CrossRef]
- Dong, Z.; Yang, B.; Liang, F.; Huang, R.; Scherer, S. Hierarchical Registration of Unordered TLS Point Clouds Based on Binary Shape Context Descriptor. ISPRS J. Photogramm. Remote Sens. 2018, 144, 61–79. [Google Scholar] [CrossRef]
- Cai, Z.; Chin, T.-J.; Bustos, A.P.; Schindler, K. Practical Optimal Registration of Terrestrial LiDAR Scan Pairs. ISPRS J. Photogramm. Remote Sens. 2019, 147, 118–131. [Google Scholar] [CrossRef]
- Mellado, N.; Aiger, D.; Mitra, N.J. Super 4PCS Fast Global Pointcloud Registration via Smart Indexing. Comput. Graph. Forum 2014, 33, 205–215. [Google Scholar] [CrossRef]
- Ge, X.; Hu, H.; Wu, B. Image-Guided Registration of Unordered Terrestrial Laser Scanning Point Clouds for Ur-ban Scenes. IEEE Trans. Geosci. Remote Sens. 2019, 57, 9264–9276. [Google Scholar] [CrossRef]
- Zai, D.; Li, J.; Guo, Y.; Cheng, M.; Huang, P.; Cao, X.; Wang, C. Pairwise Registration of TLS Point Clouds Using Covariance Descriptors and a Non-Cooperative Game. ISPRS J. Photogramm. Remote Sens. 2017, 134, 15–29. [Google Scholar] [CrossRef]
- Theiler, P.W.; Wegner, J.D.; Schindler, K. Keypoint-Based 4-Points Congruent Sets–Automated Marker-Less Registration of Laser Scans. ISPRS J. Photogramm. Remote Sens. 2014, 96, 149–163. [Google Scholar] [CrossRef]
- Ge, X. Non-Rigid Registration of 3D Point Clouds under Isometric Deformation. ISPRS J. Photogramm. Remote Sens. 2016, 121, 192–202. [Google Scholar] [CrossRef]
- Ge, X. Automatic Markerless Registration of Point Clouds with Semantic-Keypoint-Based 4-Points Congruent Sets. ISPRS J. Photogramm. Remote Sens. 2017, 130, 344–357. [Google Scholar] [CrossRef]
- Zang, Y.; Lindenbergh, R.C. An Improved Coherent Point Drift Method for TLS Point Cloud Registration of Complex Scenes. Int. Arch. Photogramm. Remote Sens. Spat. Inf. Sci. 2019, 42, 1169–1175. [Google Scholar] [CrossRef]
- Wu, Q.; Liu, J.; Gao, C.; Wang, B.; Shen, G.; Li, Z. Improved RANSAC Point Cloud Spherical Target Detection and Parameter Estimation Method Based on Principal Curvature Constraint. Sensors 2022, 22, 5850. [Google Scholar] [CrossRef]
- Liu, W.I. Novel Method for Sphere Target Detection and Center Estimation from Mobile Terrestrial Laser Scanner Data. Measurement 2019, 137, 617–623. [Google Scholar] [CrossRef]
- Besl, P.J.; McKay, N.D. A Method for Registration of 3-D Shapes. IEEE Trans. Pattern Anal. Mach. Intell. 1992, 14, 239–256. [Google Scholar] [CrossRef]
- Cheng, L.; Chen, S.; Liu, X.; Xu, H.; Wu, Y.; Li, M.; Chen, Y. Registration of Laser Scanning Point Clouds: A Review. Sensors 2018, 18, 1641. [Google Scholar] [CrossRef] [PubMed]
- Fitzgibbon, A.W. Robust Registration of 2D and 3D Point Sets. Image Vis. Comput. 2003, 21, 1145–1153. [Google Scholar] [CrossRef]
- Yang, J.; Li, H.; Jia, Y. Go-ICP: Solving 3D Registration Efficiently and Globally Optimally. In Proceedings of the 2013 IEEE International Conference on Computer Vision, Sydney, Australia, 1–8 December 2013; pp. 1457–1464. [Google Scholar]
- Li, J.; Zhang, Y.; Hu, Q. Robust Estimation in Robot Vision and Photogrammetry: A New Model and Its Applications. ISPRS Ann. Photogramm. Remote Sens. Spat. Inf. Sci. 2021, 1, 137–144. [Google Scholar] [CrossRef]
- Chetverikov, D.; Svirko, D.; Stepanov, D.; Krsek, P. The Trimmed Iterative Closest Point Algorithm. In Proceedings of the 2002 International Conference on Pattern Recognition, Quebec City, QC, Canada, 11–15 August 2002; IEEE: New York, NY, USA, 2002; Volume 3, pp. 545–548. [Google Scholar]
- Bae, K.-H.; Lichti, D.D. A Method for Automated Registration of Unorganised Point Clouds. ISPRS J. Photogramm. Remote Sens. 2008, 63, 36–54. [Google Scholar] [CrossRef]
- Bouaziz, S.; Tagliasacchi, A.; Pauly, M. Sparse Iterative Closest Point. Comput. Graph. Forum 2013, 32, 113–123. [Google Scholar] [CrossRef]
- Bueno, M.; Bosché, F.; González-Jorge, H.; Martínez-Sánchez, J.; Arias, P. 4-Plane Congruent Sets for Automatic Registration of as-Is 3D Point Clouds with 3D BIM Models. Autom. Constr. 2018, 89, 120–134. [Google Scholar] [CrossRef]
- Fischler, M.A.; Bolles, R.C. Random Sample Consensus: A Paradigm for Model Fitting with Applications to Im-age Analysis and Automated Cartography. Commun. ACM 1981, 24, 381–395. [Google Scholar] [CrossRef]
- Xu, L.; Oja, E.; Kultanen, P. A New Curve Detection Method: Randomized Hough Transform (RHT). Pattern Recognit. Lett. 1990, 11, 331–338. [Google Scholar] [CrossRef]
- Zhao, X.; Kargoll, B.; Omidalizarandi, M.; Xu, X.; Alkhatib, H. Model Selection for Parametric Surfaces Approx-imating 3D Point Clouds for Deformation Analysis. Remote Sens. 2018, 10, 634. [Google Scholar] [CrossRef]
- Bonduel, M.; Bassier, M.; Vergauwen, M.; Pauwels, P.; Klein, R. Scan-to-Bim Output Validation: Towards a Standardized Geometric Quality Assessment of Building Information Models Based on Point Clouds. In Proceedings of the 5th International Workshop LowCost 3D-Sensors, Algorithms, Applications, Hamburg, Germany, 28–29 November 2017; Copernicus: Göttingen, Germany, 2017; pp. 45–52. [Google Scholar]
- Li, J.; Hu, Q.; Zhang, Y.; Ai, M. Robust Symmetric Iterative Closest Point. ISPRS J. Photogramm. Remote Sens. 2022, 185, 219–231. [Google Scholar] [CrossRef]
- Chen, Y.; Medioni, G. Object Modelling by Registration of Multiple Range Images. Image Vis. Comput. 1992, 10, 145–155. [Google Scholar] [CrossRef]
- Zhang, J.; Yao, Y.; Deng, B. Fast and Robust Iterative Closest Point. IEEE Trans. Pattern Anal. Mach. Intell. 2021, 44, 3450–3466. [Google Scholar] [CrossRef]
- Becerik-Gerber, B.; Jazizadeh, F.; Kavulya, G.; Calis, G. Assessment of Target Types and Layouts in 3D Laser Scanning for Registration Accuracy. Autom. Constr. 2011, 20, 649–658. [Google Scholar] [CrossRef]
Disclaimer/Publisher’s Note: The statements, opinions and data contained in all publications are solely those of the individual author(s) and contributor(s) and not of MDPI and/or the editor(s). MDPI and/or the editor(s) disclaim responsibility for any injury to people or property resulting from any ideas, methods, instructions or products referred to in the content. |
© 2026 by the authors. Licensee MDPI, Basel, Switzerland. This article is an open access article distributed under the terms and conditions of the Creative Commons Attribution (CC BY) license.