Abstract
The external spatial form and skyline of high-density waterfront iconic building clusters in super-large cities are the most distinctive features of urban image. However, traditional static research methods (such as fixed-point photography) cannot capture the continuous visual experience of people in motion, thereby imposing obvious limitations. This study proposes a dynamic visual quantification method that constructs a linear observation path using the parametric platform Grasshopper. The method calculates two core parameters in real-time: the vertical perspective angle (θ, reflecting the building’s “sense of height”) and the horizontal perspective angle (β, reflecting the “sense of density” of the building cluster), so as to realize the dynamic and continuous quantification of the building cluster’s form. Using Shanghai Lujiazui as a case study, this paper validates the method’s effectiveness. The results show that the visual perception of buildings is not only determined by their absolute height but also influenced by the distance from the observation point and spatial relationships. Furthermore, through variance analysis and an annealing algorithm, this study can identify “visually stable points” (suitable for arranging core landmarks) and “optimal viewing points” (suitable for setting up urban viewing platforms). This method provides a reproducible quantitative tool and specific guidance for the optimization of waterfront building layouts and the planning of urban viewing platforms.
1. Introduction
1.1. The Importance of Iconic Building Clusters in High-Density Waterfront Areas of Super-Large Cities
Currently, iconic building clusters are predominantly located within the high-density waterfront areas of Super-Large Cities and have become significant representatives of both urban and national economic strength.
These waterfront areas, leveraging their superior land-water transportation connectivity and unique locational advantages, accommodate core urban functions and iconic building clusters. These clusters not only serve high economic and political functions but also utilize the distance-regulation function and low spatial occlusion offered by the urban waterfront water bodies to create urban skylines with a strong sense of rhythm [1]. The expansive water body increases the spatial distance between observers and the building clusters, visually diluting the originally overwhelming height of the clusters, thereby rendering the urban form more proportionate from a human perspective [2].
By disseminating recognizable urban imagery of these building clusters, the technical prowess of the city’s waterfront iconic architecture can be showcased, enhancing the city’s international visibility and reputation, and better shaping its frontage, thereby deepening the impression of the urban spatial form in visual perception [3,4].
1.2. The Significance of Linear Dynamic Vision for Urban Landscape Visual Analysis
The visual analysis of urban landscapes through linear movement is intricately linked to the planning characteristics of modern cities and human activity patterns. Currently, most research in this field is still conducted from several static viewpoints, failing to accurately reflect the characteristics of the entire dynamic process as people move through the city, experiencing changing views.
In the mid-16th century, Wen Zhengming’s Record of the Jade Maiden Pool referenced the notion of “pictorial conception”, which can be linked to the “picture-esque” concept in Chinese garden design [5,6]. In the 18th century, the English “Picturesque” style proposed a “circuitous approach” to viewing landscapes, summarizing and attracting people to the process of walking within “picturesque scenery” [7]. This non-direct, meandering linear viewing action incorporates the fourth dimension of time into the three-dimensional static urban space, surpassing traditional static viewing methods.
Taking the iconic super-tall buildings on the convex bank of Shanghai’s Lujiazui as an example—such as the Shanghai Tower, Shanghai World Financial Center, and the Oriental Pearl Tower—their relative positions exhibit constant displacement and overlap as tourists’ viewpoints shift along the observation platforms on the concave bank of the Huangpu River. This dynamic visual effect constitutes a major characteristic that distinguishes it from traditional urban landscape visual analysis.
1.3. Definition of Key Concepts
External Spatial Form: The overall layout, height gradient, building spacing, and skyline contour of waterfront iconic building clusters.
Dynamic Visual Perception: The continuous visual experience of building clusters as observers move.
Vertical Perspective Angle (θ): Reflects the visual prominence of buildings in the vertical dimension.
Horizontal Perspective Angle (β): Reflects the visual spaciousness and distribution density of building clusters in the horizontal dimension.
Visually Stable Points: Building locations where the variance of θ is small and dynamic visual changes are minimal.
Optimal Viewing Points: Observation locations where the β value does not exceed the comfortable range of human eyes, with little building occlusion and a complete, spacious skyline.
1.4. Research Background, Theoretical Foundations, and Research Gaps
Waterfront iconic building clusters in super-large cities (with Shanghai Lujiazui as a typical case in this study) serve as core image carriers of cities. Their waterfront spatial characteristics can alleviate the sense of oppression from high-density development and shape unique skylines. However, existing research struggles to accurately capture dynamic and continuous visual experiences, resulting in a lack of quantitative support for urban design—this constitutes the core background of this study.
The theoretical foundations of this research are as follows: ① Jane Jacobs’ concept of “walkable public spaces” advocates pedestrian friendly urban design and guides the dynamic observation model of linear public spaces [8]; ② The “landmark” theory in Kevin Lynch’s The Image of the City provides a logical basis for the quantification of θ and β, realizing the transformation from qualitative description to quantitative indicators [9]; ③ The “Serial Vision” theory in Gordon Cullen’s Townscape (1961) supplements the critical dynamic dimension for dynamic visual analysis [10]. It emphasizes that urban perception is a continuous narrative unfolding with pedestrian movement, which directly reveals the limitation of static research overlooked by previous theories, and lays a foundational logical basis for the dynamic quantification framework of this study. Gordon Cullen’s theory complements Jacobs’ focus on walkable spaces and Lynch’s landmark-based urban image, forming a holistic theoretical framework covering “pedestrian space carrier”, “perceptual core elements”, and “continuous dynamic experience”.
By sorting out existing relevant research, three core gaps are identified in current research, which are insufficient to meet the needs of dynamic visual analysis: ① Research based on subjective visual preference evaluation (e.g., questionnaires) has strong subjectivity and lacks unified standards [11,12]; ② Research based on multi-viewpoint assessment of urban waterfront skylines (e.g., multi-view photography) tends to lead to fragmented perception of the city [13,14,15]; ③ Traditional dynamic visual quantification research has unclear technical processes and is difficult to replicate [16].
Based on this, the core goal of this study is to construct a reproducible and high-precision dynamic visual quantification method that can identify “landmarks” and accurately optimize the walking experience in public spaces, thereby filling the gaps in existing research.
1.5. Core Research Questions and Research Scope
Based on the aforementioned research background and gaps, this study aims to address the limitations of existing research in dynamic visual analysis of waterfront building clusters by constructing a dynamic visual quantification method. It clarifies the following core research questions and research scope, providing a clear framework for subsequent method construction and case validation.
1.5.1. Core Research Questions
- By constructing a “reproducible, real-time computing, and visually presented” dynamic visual quantification technical framework, it accurately captures the continuous visual experience of observers during linear movement, thereby remedying the shortcomings of traditional static research and vague dynamic research.
- Based on this technical framework, scientifically identify the “visually stable points” in the layout of waterfront building clusters and the “optimal viewing points” along the observation route, providing a quantitative decision-making basis for urban design.
1.5.2. Research Scope
- Research object: Super-tall buildings over 250 m in the core area of Shanghai Lujiazui.
- Observation system: The Bund Riverside Promenade and 9 typical fixed observation points along it.
- Quantification dimension: Focus only on the visual form quantification of θ and β parameters, excluding analysis of other non-visual dimensions.
2. Research Methods
2.1. Current Existing Research Methods
To further clarify the innovative value of the research method proposed in this study, this section provides a detailed breakdown and analysis of the three types of existing research methods identified in Section 1.4, as follows:
2.1.1. Subjective Visual Preference Evaluation Research
This approach usually employs methods such as questionnaires to reflect respondents’ intuitive feelings towards the urban skyline of iconic building clusters based on their subjective judgments [17]. However, this method lacks unified quantitative standards. Respondents from different life backgrounds have varying evaluation criteria, often leading to different assessment results for the same skyline.
2.1.2. Multi-Viewpoint Evaluation of Urban Waterfront Skylines Research
This research typically selects multiple static viewpoints to record and compare the occlusion and visibility relationships of the urban skyline in the form of multi-viewpoint static snapshots [18]. Evidently, this method focuses more on the projection overlap relationships of buildings from a two-dimensional perspective, neglecting the potential depth of architectural space in three dimensions. Furthermore, it ignores the changing relationships of the skyline between viewpoints, fragmenting the human perception of the city defined by iconic building clusters into disjointed segments.
2.1.3. Traditional Dynamic Visual Quantification Analysis Research
This research aims to smooth and continuumize the previously static, slice-by-slice human perception of the city formed by iconic building clusters, and concretizes metrics such as the perspective angle of iconic buildings through charts or graphs [19]. However, these methods often fail to specify the concrete techniques for achieving dynamic simulation, making it difficult to reproduce the methodology across different study objects.
2.2. Research Method Adopted in This Study
To address the limitations of existing research methods identified in Section 2.1 (too subjective, static and fragmented, and irreproducible processes), this study selects Rhino and Grasshopper as the core technical platforms, combined with variance analysis and an annealing algorithm, to construct a dynamic visual quantification analysis framework. The selection is theoretically grounded in parametric design theory, which lays an operable theoretical chain of “perceptual needs—value orientation—technical implementation”. The core principle for selecting this technical combination is to “accurately match research needs and target technical problems”, while fully considering the authenticity of urban landscape visual presentation from a dynamic perspective, rather than pursuing methodological complexity. The specific rationale is as follows:
- Selection logic of Rhino + Grasshopper: Traditional research relies on the model of “on-site photography + manual calculation”, which has problems such as low efficiency and being prone to missing continuous visual data (e.g., dynamic change information in the middle section of the observation route). Quantitative calculation tools represented by Rhino can achieve high-precision scientific support of the 3D form of high-density waterfront building clusters in super-large cities (including core parameters such as building height, spatial coordinates, and contour features). Grasshopper, through parametric programming, realizes the discretization processing of linear observation routes (dense observation points can be generated as needed), and supports real-time calculation of the vertical perspective angle (θ) and the horizontal perspective angle (β), dynamic data visualization, and modular workflow [20]. This combination enables replication across different cases—by replacing the 3D building model and observation route parameters of the target area, it can be repeatedly applied to the analysis of waterfront building clusters in other cities.
- Necessity of applying variance analysis: To identify “visually stable points” in the layout of building clusters, it is necessary to quantify the dynamic change characteristics of the vertical perspective angle (θ) of different buildings. Variance analysis can efficiently screen the building locations with the smallest fluctuations by calculating the degree of dispersion of the θ value sequence of each building, avoiding the subjectivity and inefficiency of traditional manual comparison of massive data.
- Rationality of applying the annealing algorithm: The total length of the linear observation route along the Bund is approximately 5 km. If full-sample traversal is used to screen for “optimal viewing points”, it will require processing an extremely large amount of observation point data, resulting in extremely high computational cost. Through an iterative optimization mechanism, Genetic algorithms, represented by the annealing algorithm, can efficiently lock the optimal observation position where the horizontal perspective angle (β) meets the comfortable threshold of human eyes along the route, balancing computational efficiency and result accuracy [21].
2.2.1. Theory of the Vertical Perspective Angle
The most fundamental constant describing a building in the vertical dimension is its absolute height. However, as the visual perception of iconic buildings is difficult to quantify uniformly and can be interfered with by factors like viewpoint location, we adopt the vertical perspective angle (θ). It is calculated based on the right-angled triangle formed by the elevation of the building’s highest point (H) and the horizontal straight-line distance (D) from the observation point to that highest point [3], with negligible errors from factors such as Earth’s curvature and human eye height being disregarded:
θ = arctan(H/D)
To clarify the operability of parameter calculation, the following standardized calculation steps are formulated based on 3D modeling and parametric programming processes:
- Construct a 3D model of the sample building using the Rhino platform, and extract the elevation of the building’s highest point (H) and the horizontal distance (D) from the observation point.
- Substitute H and D into Formula (1), and automatically calculate the θ value of each point for the target building through the mathematical operation components of Grasshopper, then generate a dynamic change curve that reflects the variation of vertical perspective angle along the observation route.
The value of θ directly reflects the visual prominence of the building in the vertical dimension. Its variation follows the principle of perspective: even if a building has a relatively low absolute height, it may form a larger θ value if it is close to the observation point, which is consistent with human actual visual experience.
2.2.2. Theory of the Horizontal Perspective Angle
Similarly, in the horizontal dimension, the quantitative approach is derived from the observer’s viewing angle. For the horizontal perspective angle (β) of a single building, it is defined as the vector angle between the lines of sight from the observer’s viewpoint (O) to the tangent points (A, B) at its left and right edges:
Combining architectural spatial form and line-of-sight geometric relationship, the following calculation steps based on the parametric platform are formulated:
- Based on the 3D Rhino model, extract the spatial coordinates of the left and right edge tangent points of each building in the horizontal direction (A as the left tangent point, B as the right tangent point), and establish line-of-sight vectors OA (from O to A) and OB (from O to B).
- Use the vector operation components of Grasshopper, substitute into Formula (2), and automatically calculate the included angle between vectors OA and OB, which is the horizontal perspective angle (β) of a single building.
- For the building cluster as a whole, extract the horizontal outer contour of the cluster through the convex hull algorithm, repeat Steps 1–2 to calculate the line-of-sight included angle from each observation point to the outer contour, and define it as the overall horizontal perspective angle (β) of the building cluster.
The value of β reflects the visual spaciousness and distribution density of the building cluster in the horizontal dimension, as well as the occlusion and orientation relationships between buildings.
2.2.3. Comprehensive Quantitative Simulation Methodology Based on the Rhino and Grasshopper Platform
To clarify the reproducibility of the technical process, the working logic and connection relationships of the 5 parametric module groups are broken down as follows, with specific details to be elaborated later:
- Basic data preprocessing module for “Iconic Buildings, Routes, and Viewpoints”;
- “Skyline Visual Landscape” simulation and verification module;
- Dynamic calculation module for “Dynamic Vertical/Horizontal Perspective Angles”;
- Variance analysis module for “Visually Stable Points”;
- Annealing algorithm module for “Optimal Viewing Points”.
This process can be reproduced in other linear areas by replacing building models and route parameters.
2.2.4. Comparison with Existing Research Methods
Table 1 provides a summary of the three aforementioned existing research methods for studying the external spatial form of super-large, high-density waterfront iconic building clusters, and highlights their distinctions from the parametric-based dynamic visual quantification research presented in this paper.

Table 1.
Comparison between existing research methods and the proposed methods.
2.2.5. Technical Roadmap of This Study
Figure 1 serves as the technical roadmap of this study, with brief graphical illustrations of the calculation logic for the vertical and horizontal perspective angles.
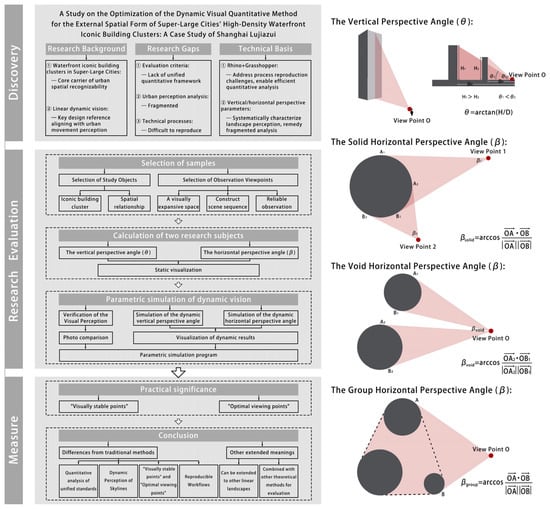
Figure 1.
Technical Roadmap of This Study.
3. Application and Quantification of the Method
3.1. Selection of Study Objects
The super-large urban agglomeration, exemplified by Shanghai’s Lujiazui, serves as a core vehicle and economic node of China’s reform and opening-up. Its development process epitomizes the modern transformation of China’s urbanization, relating directly to the achievement of the nation’s key development strategies and long-term goals [26]. This provides a dual paradigm of both policy and practice for the planning of iconic building clusters.
The area hosts numerous high-rise buildings (Table 2), forming one of China’s most dense skyscraper clusters. Four structures exceeding 400 m create a pinnacle sequence, while the remaining buildings, predominantly under 300 m, form a secondary height echelon. This “stepped gradient” in height differences endows the skyline with a dynamic contour complexity, making it an ideal subject for visual quantification analysis.
Table 2.
Summary List of First Class Iconic High rise Buildings in Lujiazui Area (Excluding Residential Projects).
Furthermore, the western bank of the Huangpu River, known as the Bund, forms a natural concave bank observation belt, which confronts the iconic cluster on the Lujiazui convex bank across the river. This geographical configuration provides a linear and continuous observation path (the Bund Riverside Promenade), capable of fulfilling the continuity requirements of viewpoint movement essential for linear dynamic visual quantification research.
We selected six iconic building samples (totaling seven iconic buildings, as the Shanghai International Finance Centre is a twin-tower complex) corresponding to serial numbers 1–5 and 7 in Table 2 (Figure 2). All are super-tall buildings exceeding 250 m in height. Among them, the Shanghai Information Tower (serial number 6 in Table 2) was excluded because its height (264 m) only places it in the secondary height echelon, and its geographical location is deeper within the hinterland of the Lujiazui area. Consequently, it becomes heavily obscured in the viewing sightlines from the Bund, making it difficult to be clearly observed (i.e., its vertical perspective angle (θ) is relatively small). Unlike pinnacle sequence buildings such as the Shanghai Tower, it cannot leverage a significantly greater building elevation (H) to overcome the diluting effect that the longer horizontal straight-line distance (D) has on the vertical perspective angle (θ).
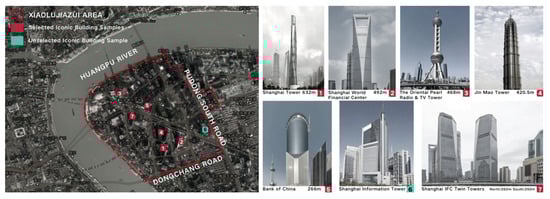
Figure 2.
Selection of iconic building samples for super high-rise buildings.
3.2. Selection of Observation Viewpoints
In The City Shaped [27], Kostof identifies three meaningful categories of urban viewpoints: roadway viewpoints at city entrances, waterfront viewpoints along rivers or coastlines, and elevated viewpoints within the urban landscape.
Building on this framework and adapting it to the specific spatial conditions of Lujiazui, this study selected nine observation points and one linear dynamic observation route (Figure 3) [28]. The observation points are intended to perceive and verify the human visual experience of the building cluster, whereas the linear dynamic observation route is used to obtain a complete and smooth dataset for linear dynamic visual quantification analysis.
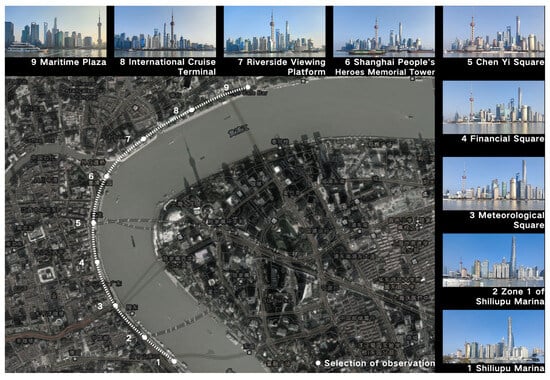
Figure 3.
Selection of observation points and linear dynamic observation route.
The selection followed three principles:
- First, Viewpoints and the observation route must prioritize spaces with high pedestrian flow, suitability for people to stay and view the scenery, and open sightlines [29];
- Second, Adequate spacing between observation points must be ensured to form a sequence of scenes with sufficient variation that avoids redundant information, while the observation route should connect all these points;
- Third, the observation points and the route must be free from external interference, to ensure observational consistency and data reliability.
The final set of nine observation points includes: Shiliupu Marina (1), Zone 1 of Shiliupu Marina (2), Meteorological Square (3), Financial Square (4), Chen Yi Square (5), Shanghai People’s Heroes Memorial Tower (6), Riverside Viewing Platform (7), International Cruise Terminal (8), and Maritime Plaza (9). Among these, points like Shiliupu Dock are waterfront viewpoints, Meteorological Square and others are elevated viewpoints, and Financial Square, etc., are roadway viewpoints; all comply with the second and third principles. This selection of viewpoints not only aligns with Kostof’s classification but also conforms to Lynch’s concept of “the image of the city”—the Bund Riverside Promenade, as a “linear path”, serves as the core carrier for people to perceive urban landmarks, ensuring the selection of observation points has dual theoretical support.
This study strictly standardized the viewpoint locations and climatic conditions to eliminate their interference with the vertical perspective angle and horizontal perspective angle. Accordingly, all observation data were collected on the same day based on fixed parameters: the distance from the observation points to the riverbank was maintained at 10 m ± 1 m, and the data collection height was temporarily set at 1.7 m (simulating the average eye level of adult males) [30]. Subsequent studies can set different collection parameters for diversified population groups, such as children (1.2 m) and the elderly (1.6 m). However, given that the magnitude of eye height differences is significantly smaller than the height of super-tall buildings, variations in eye height among diversified groups are temporarily not considered in this experiment.
Atmospheric conditions can also distort the analysis results. For instance, low visibility blurs building boundaries, introducing errors in the measurement of the horizontal perspective angle (β). To control for atmospheric variables and ensure visibility, outdoor photography was restricted to a single clear day with PM2.5 < 35 μg/m3. Subsequently, visibility data were extracted using the virtual model within the Rhino platform instead of from the actual scene images, thereby minimizing data errors caused by meteorological factors.
3.3. Calculation of the Vertical Perspective Angle for Sample Buildings
The specific calculation involves measuring the elevation of the highest point (H) of each iconic building and the horizontal straight-line distance (D) from each observation point to the highest point of the building, then calculating the vertical perspective angle (θ) of the 7 iconic buildings under the 9 observation points based on Formula (1). The data are arranged in the actual order of the observation points and the descending order of the iconic buildings’ heights, yielding the variation of θ values of buildings with different heights under different observation points (Figure 4).
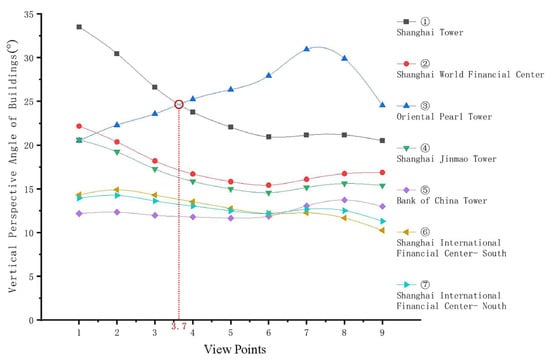
Figure 4.
Changes in vertical perspective angle of each iconic building at 9 observation points.
As can be observed from the figure, the Shanghai Tower, despite being the highest building and the pinnacle structure in the Lujiazui area, exhibits significant variation in its vertical perspective angle as the viewpoint moves from 1 to 9. The sequential order of buildings acting as the visual pinnacle from the observation points does not align with the order of their absolute heights: the Shanghai Tower, possessing the greatest absolute height, is surpassed by the Oriental Pearl Tower (the third tallest by absolute height), starting from viewpoint 4. Meanwhile, the Shanghai World Financial Center, the second tallest by absolute height, consistently fails to become the visual pinnacle at any observation point. Static observations indicate that the θ value of a building is not only determined by the elevation of its highest point (H)—the Shanghai Tower is the visually dominant building in only 33% of the observation route—but also significantly influenced by the horizontal straight-line distance (D).
3.4. Calculation of the Horizontal Perspective Angle for Sample Buildings
The specific calculation involves measuring the vector included angle between the line-of-sight tangent points (A, B) on the left and right edges of each iconic building from the observation point (O), and calculating the horizontal perspective angle (β) of the 7 iconic buildings under 9 observation points based on Formula (2). The data are arranged in the actual order of the observation points, yielding the variation of β values of the iconic building cluster across the 9 observation points (Figure 5). The β value reflects the density of the building cluster: at Observation Point 7, the proportion of gaps is nearly 0, indicating the most severe building occlusion; at Observation Point 2, the β value is the largest (approximately 50°), providing the most spacious field of view.

Figure 5.
Changes in horizontal perspective angle of each iconic building at 9 observation points, and the void between each iconic building solid at 9 observation points.
The calculation of the horizontal perspective angle, similar to that of the vertical perspective angle, is significantly influenced by the horizontal straight-line distance (D). Governed by the principle of visual perspective, for a building of constant width, a greater distance results in a smaller horizontal perspective angle, and vice versa. Furthermore, due to the inevitable foreground–background occlusion relationships between buildings from specific viewpoints, each observation point yields a distinct compositional state of the iconic building cluster and a corresponding overall horizontal perspective angle. Specifically, the external contour of the iconic building cluster at human eye-level collectively forms a building cluster “convex hull.” The vector angle between the lines of sight from any observation viewpoint (O) to the tangent points (A, B) on the left and right edges of this cluster’s convex hull defines the overall horizontal perspective angle for that particular compositional state of the iconic building cluster.
At each observation point, the overall horizontal perspective angle indicates the aggregation and dispersion state of the building cluster [31]: a larger value implies a more scattered distribution; the “angle of the solid” represents the total horizontal line-of-sight occlusion width caused by the iconic buildings at that point; the “angle of the void” denotes the gap width between the iconic buildings; and the frequency of solid-void alternation reflects building occlusion relationships and real visual experiences. The statistical results are presented in Table 3.
Table 3.
Horizontal perspective angle variation data of iconic buildings at 9 observation points.
Based on the data from Table 3, the visualized statistical results are presented in Figure 6. In the figure, the stacked bar chart uses the left axis as its scale, recording the total horizontal perspective angle occupied by the iconic building cluster at each viewpoint. The color gradient from bottom to top corresponds to the counter-clockwise perspective of the building cluster from that viewpoint: “building solid (dark color)—sky void (light color)—building solid (dark color)”. The line graph in the figure uses the axis on the right, representing the proportion of the total sky width (void space) between buildings to the overall horizontal perspective angle at each viewpoint.

Figure 6.
Horizontal perspective angle composition (Left axis) and sky ratio (Right axis) by viewpoint.
Based on measurements from nine static viewpoints, this study reveals that the visual perception of Lujiazui’s iconic building cluster exhibits notable dynamic characteristics. Specifically, although the Shanghai Tower is the tallest structure, it functions as the visual pinnacle along only about half of the observation route. In the latter half, its dominance is superseded by the Oriental Pearl Tower due to variations in spatial distance. At the same time, both the vertical and the horizontal perspective angles change systematically with the movement of the viewpoint—exemplified by the rapid decline in the vertical perspective angle of the Shanghai Tower between Viewpoints 1 and 6. While these statically sampled data can reveal macro trends, they cannot fully reconstruct the true picture of the continuous visual experience. Therefore, the following section will introduce computer-based parametric simulation to obtain continuous datasets, thereby achieving accurate quantification of the linear dynamic visual perception process.
4. Simulation and Verification of the Linear Dynamic Visual Perception for Iconic Buildings
4.1. Quantitative Simulation and Validation Based on the Grasshopper Platform Objects
In previous sections, observation and data calculation were conducted on 9 static observation points of the iconic building cluster on the convex bank of Lujiazui, and the quantitative results have demonstrated the relationship between changes in observation points and the spatial orientation of the building cluster. To ensure the consistency between the quantitative results and human actual visual experiences, this study adopts a “simulated scenes—on-site photographs” comparative verification method (as shown in Figure 7). The specific verification plan is as follows:
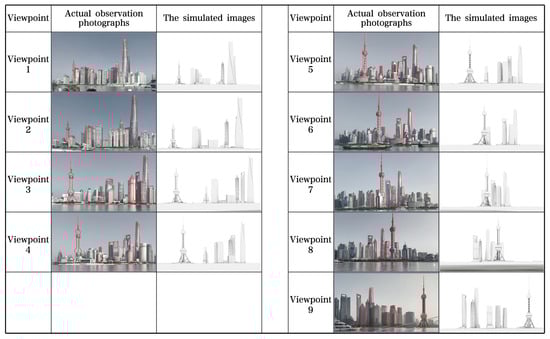
Figure 7.
Validation of simulated architectural landscape against actual photographs based on Grasshopper. (The simulated-target buildings are highlighted in red lines).
- Verification objects: The 9 static observation points mentioned earlier, which cover the start, midpoint, and end of the observation route, ensuring the representativeness of the verification.
- Data collection: Two types of data are synchronously collected at each observation point—① On-site photographs taken under the same angle and lighting conditions (shooting parameters: focal length 50 mm, ISO 100, shutter speed 1/500 s; wide-angle distortion is avoided, and target buildings are highlighted in red lines); ② Visual simulation maps of the building cluster generated based on Grasshopper.
- Verification indicators: Compare the consistency between the simulation maps and on-site photographs from three core dimensions: relative positions of buildings, height proportional relationships, and spatial occlusion status.
- Verification results: Except for slight wide-angle distortion caused by handheld camera photography and other minor influences, the two types of images show a high degree of consistency in the relative positions and height proportions of buildings, with basically consistent spatial occlusion status. This proves that the quantitative method of this study can relatively accurately reproduce human dynamic visual experiences. In addition, the variation laws of θ and β values are consistent with the principle of perspective and human visual perception, further verifying the reliability of the quantitative results.
Within Grasshopper, the specific component groups for the parametric simulation are illustrated in Figure 8. These consist of four main parts: “1 Observation Point Location,” “2 Visual Simulation Circle Generation”, “3 Visual Solid-Void Alternation”, and “4 Visual Simulation Range Coloring”.
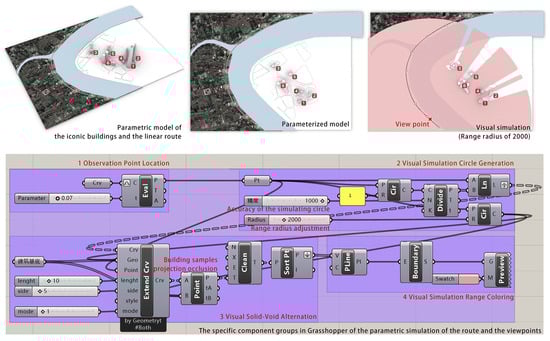
Figure 8.
Parametric simulation program of iconic buildings, routes, and viewpoints.
The “1 Observation Point Location” component group utilizes a slider component to uniformly divide the linear observation route into multiple dense points, allowing for the adjustment of the observation point’s position via the slider. The “2 Visual Simulation Circle Generation” component group generates a circle centered on the observation point. Its radius and segment count can be adjusted via sliders, enabling it to approximate a visual simulation circle with a radius of 2000 m. The “3 Visual Solid-Void Alternation” component group projects the target buildings and computes their intersection with the visual simulation circle, thereby visualizing the solid-void alternation.
The skyline visual landscape simulation component groups are shown in Figure 9, consisting of “1 Observation Point Location” and “5 Visual Lens Simulation.” Within the “5 Visual Lens Simulation” component group, a camera point locks the camera’s orientation, and a slider component adjusts the lens focal length. This allows for the adjustment of the image frame and clarity without altering the positional relationships of the elements within the scene.

Figure 9.
Parametric simulation program of the skyline visual landscape.
4.2. Dynamic Verification of the Quantitative Simulation Results
The close alignment between the simulated and actual photographs confirms the reliability of the Grasshopper platform for conducting dynamic calculations along the observation route for the iconic building cluster. Subsequently, dynamic simulations were conducted for two key visual parameters.
4.2.1. Dynamic Vertical Perspective Angle of Sample Buildings
Figure 10 (left) illustrates the dynamic variation of the vertical perspective angles (θ) for the seven iconic buildings along the entire observation route. Unlike traditional static analysis where the tallest building is presumed to be the constant visually dominant building, the dynamic results reveal a shifting dominance: the Shanghai Tower functions as the visually dominant building for only approximately 32% of the route (from Shiliupu Dock to a section beyond Meteorological Square), whereas the Oriental Pearl Tower occupies this role for the remaining 68% (from a section before Financial Square to Marine Plaza). Although the Shanghai Tower exceeds the Oriental Pearl Tower by over 150 m in height, the latter’s closer proximity to the convex bank edge and shorter spatial distance to the latter half of the observation route result in a greater vertical perspective angle (θ), granting it greater visual prominence.
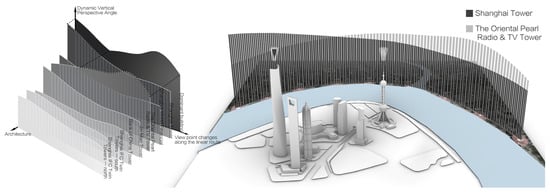
Figure 10.
Parametric simulation of the dynamic building vertical perspective angles, and the visually dominant building along the linear dynamic observation route.
Figure 11 displays the specific Grasshopper component groups for the dynamic vertical perspective angle simulation (using the Shanghai World Financial Center as an example). These consist of two parts: “1 Observation Point Location” and “6 Dynamic Vertical Perspective Angle Simulation”. In the “6 Dynamic Vertical Perspective Angle Simulation” component group, the highest point of the building and its projection point at human eye level are connected to the observation point, and the acute angle formed is calculated. The Data Recorder component records this data frame by frame, generating the dynamic vertical perspective angle curve for the building. The curves for all seven buildings are then overlaid to produce the visualization in Figure 10.
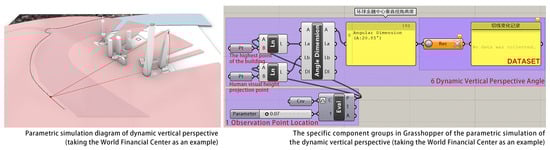
Figure 11.
Parametric simulation program of the dynamic vertical perspective angle (taking the Global Financial Center as an example).
4.2.2. Dynamic Horizontal Perspective Angle of Sample Buildings
The dynamic simulation of the horizontal perspective angle (β), resulting in Figure 12, extends the static findings from Figure 6 by uniformly dividing the linear dynamic observation path into numerous dense, continuous minimal segments and continuously plotting the solid-void alternation for each segment. The left panel of Figure 12 visualizes the continuous variation in the relationship between building solids and interstitial voids along the entire route. The black-and-white banded patterns represent the alternation between building solids (black) and sky voids (white) encountered during a counter-clockwise scan of the overall horizontal perspective at each viewpoint. The red frame and triangular slice in the right panel of Figure 12 demonstrate the correspondence between the simulated horizontal perspective profile and an actual photograph at a specific viewpoint, this method simulates visual perception by analyzing the overlap of building clusters using simplified shapes (rectangular, circular, or linear), where higher visibility is correlated with lower levels of image overlap at selected view points [32]. The white curve, corresponding to the axis on the right, represents the proportion of the total inter-building sky void width to the overall horizontal perspective angle, reflecting the perceived density of the building cluster.
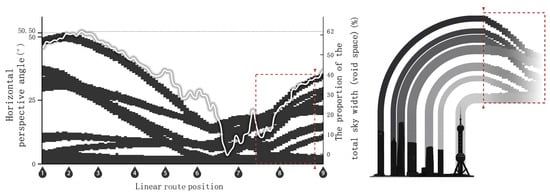
Figure 12.
Parametric simulation of the dynamic building horizontal perspective angle, and the correspondence between simulation and reality. (The red dotted square and red triangles are used to mark the correspondence between the horizontal perspective angle slice and the visual reality).
In the linear dynamic observation simulation of the horizontal perspective angle, the black banded patterns represent the width variation of individual iconic buildings or building units and their positional changes within the overall horizontal perspective. Overlaps or separations occurring in these patterns indicate the occlusion or dispersion between building solids. A greater variation in the width of the banded pattern for the same building indicates a greater change in the straight-line distance between that building and the observation point along the linear dynamic observation route, implying that its layout is relatively unstable with respect to the observation route, and vice versa. The white areas, representing the inter-building voids, indicate the density of the building cluster at that viewpoint: a smaller void width signifies denser buildings. Between viewpoints 6 and 7 in the figure, there is a location where the void width is minimal, and the void proportion approaches zero, meaning that at this viewpoint, the high-rise building cluster appears visually as an aggregated and overlapping distribution.
As shown in Figure 13, the Grasshopper workflow for dynamic horizontal perspective angle analysis comprised two main component groups:
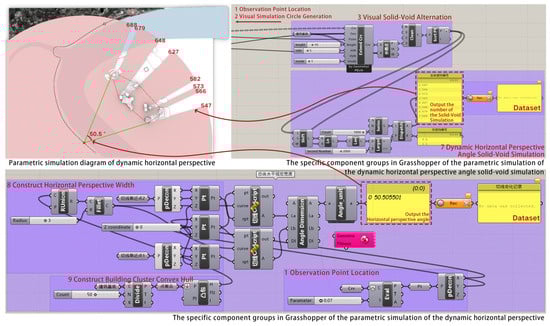
Figure 13.
Parametric simulation program of the horizontal perspective angle.
The “Dynamic Horizontal Perspective Angle Solid-Void Alternation Simulation” component group, which consisted of “3 Visual Solid-Void Alternation” and “7 Dynamic Horizontal Perspective Angle Solid-Void Simulation”. It calculated the actual angular widths of building solids and gaps by identifying the nodes of visual occlusion on the visual simulation circle (approximated as a regular 1000-gon) and recording the data frame by frame.
The “Dynamic Overall Horizontal Perspective Angle Simulation” component group, which consisted of “1 Observation Point Location”, “8 Construct Horizontal Perspective Width”, and “9 Construct Building Cluster Convex Hull”. It dynamically formed the building cluster’s “convex hull” from the external contours at human eye level and recorded the acute angle between the two tangents from the observation point to this convex hull, enabling an intuitive reading of the overall horizontal perspective angle.
The results revealed that the inter-building void width was minimal, and the void proportion approached zero between viewpoints 6 and 7, indicating that the high-rise building cluster appeared visually as an aggregated and overlapping distribution with maximal perceived density at these viewpoints. In contrast, wider gaps observed at other viewpoints produced more dispersed skyline perceptions. These dynamic outcomes provide a more nuanced, continuous, and realistic understanding of urban skyline perception compared to static, fragmentary methods.
5. Discussion
The “visually stable points” and “optimal viewing points” discussed in this chapter are quantitative references for urban design, rather than mandatory requirements mandating fixed site selection. The core goal is to provide a quantitative tool to balance “core recognizability” and “perceptual diversity”. Design and utilization can be carried out based on these two types of points in light of practical needs.
5.1. Selection of “Visually Stable Points” in the Sample Layout Under Linear Dynamic Visual Perception
Based on the aforementioned analysis of the vertical perspective angle and horizontal perspective angle of buildings under linear dynamic vision, the spatial orientation relationship between iconic buildings and observation points exerts a significant influence on their visual perception in the landscape. Therefore, excluding the influences of multiple factors such as functional requirements and municipal engineering, and focusing solely on the research of urban external space, this study aims to identify the “visually stable points” in the sample layout under linear dynamic vision.
In this study, variance calculation was performed on the data source of the vertical perspective angles of the buildings shown in Figure 10. The results indicate that the Bank of China Tower has the smallest variance of vertical perspective angles (1.48), while the Oriental Pearl Tower has the largest (65.93). It can be concluded that among the 7 iconic buildings, the vertical perspective angle of the Bank of China Tower is more stable. Excluding factors such as building occlusion and differences in architectural form, the location of this building can be regarded as a “visually stable point” during observations along the urban linear observation route. Further analysis reveals that the stability of a building’s vertical perspective angle is negatively correlated with the distance change rate between the building and the observation route. As a “visually stable point”, the Bank of China Tower maintains a relatively stable spatial orientation relationship with the observation route, with a distance change rate of 14.5%. In contrast, the Oriental Pearl Tower exhibits a significant change in vertical perspective angle, with a distance change rate of 37.7%.
For planning guidelines, “visually stable points” serve as a “preferential reference” for the layout of core landmarks, rather than the sole criterion. In urban design, approximately 30% of flexible space may be reserved, enabling buildings in non-stable point areas (e.g., the Shanghai World Financial Center) to form “dynamic landmarks” through differences in form and color. These landmarks respond to the perspective changes of moving observers, thereby making “core recognizability and diverse experiences” the goal of spatial design.
5.2. Selection of “Optimal Viewing Points” Under Linear Dynamic Visual Perception
Correspondingly, while considering the “visually stable points” of the urban objects being observed, relative “optimal viewing points” can also be identified along the urban linear observation route. From different viewpoints, the multiple iconic buildings form varying occlusion relationships with each other, and the overall horizontal perspective angle (β) of the iconic building cluster also changes significantly. These factors greatly influence the perception and shaping of the city’s signature skyline and its external spatial landscape.
Therefore, in future urban landscape planning, the design and siting of “urban viewing platforms” constitute an essential component. By cultivating urban landscape viewpoints, such as “social media hotspots for cityscapes,” the iconic skyline can be effectively sculpted, serving the purpose of enhancing the city’s prominence. If the aim at such a viewpoint is to effectively manage the overall horizontal perspective angle (β) of the iconic building cluster, then this overall angle should be closer to the comfortable stereoscopic viewing angle of the human eyes. This allows the view to be perceived as expansive and comfortable without exceeding the natural field of view, thereby allowing this viewpoint to qualify as an “optimal viewing point” along the urban linear observation route.
In this study, based on the observation of Figure 5 and Figure 12, it is found that the overall horizontal perspective angle is largest near viewpoint 2, with the maximum value located between viewpoints 2 and 3, approximately 50.50°. As this angle does not exceed the comfortable binocular visual field and presents a more expansive view, it is most suitable to be considered the “optimal viewing point” within the framework of this research methodology.
Certainly, for the exploration of “optimal viewing points,” especially when the linear observation route is long, reliance solely on an exhaustive search method is impractical. Here, we introduce the annealing algorithm, utilizing the “Optimal Viewing Point Solver” module (Figure 14) to identify the “optimal viewing point” that yields the maximum overall horizontal perspective angle.

Figure 14.
Parametric simulation program of the Annealing Algorithm for Locating the “Optimal Viewing Point”.
In Grasshopper, we utilized the Galapagos plugin as the evolutionary solver platform. The slider component regulating the observation point’s position was set as the genotype (independent variable), and the output port controlling the overall horizontal perspective angle (β) was set as the fitness (dependent variable), with the fitness goal preset to maximize the value while remaining below the maximum stereoscopic viewing angle of the human eyes. In the resultant output, the overall horizontal perspective angle converges and stabilizes around 50.50°, corresponding to a genotype slider value of 0.07. The resulting location of the identified “optimal viewing point” is shown in the corresponding figure.
Applying this to planning guidelines within the urban construction process necessitates the dual-factor coordinated control of the horizontal perspective angle (β) and the horizontal straight-line distance (D). This requires tailoring strategies to local conditions and comprehensively considering the urban context. The aim is to avoid excessive dispersion or overlap of iconic buildings within the human eye’s comfortable field of view, thereby ensuring a high-quality visual experience.
5.3. Conclusions
For planning guidelines, “visually stable points” serve as a “preferential reference” for the layout of core landmarks, rather than the sole criterion. In urban design, approximately 30% of flexible space may be reserved, and “dynamic landmarks” can be formed through differences in form and color. These landmarks respond to the perspective changes of moving observers, realizing “core recognizability” and “perceptual diversity” in urban space.
Consistent with Cullen’s emphasis on “diverse sequential vision”, the non-fixed nature of visual dominance (e.g., the Oriental Pearl Tower surpassing the Shanghai Tower in later sections of the route) also reflects the value of non-fixed urban perception—diverse visual experiences across positions and groups should be respected rather than overly regulated. This aligns with the flexible logic of viewing point planning: the “optimal viewing points” identified via the annealing algorithm (β ≈ 50.50°) serve as a reference for the comfortable threshold in general cases, not a mandatory standard. In practical planning, multiple primary and secondary viewing points can be set, which not only meet the public’s demand for a “comfortable field of view” but also reserve space for observers pursuing personalized experiences, conforming to the need for individualized experiences.
6. Conclusions and Prospects
6.1. Research Conclusions
To address the demand for dynamic visual analysis of waterfront iconic building clusters in megacities, this study takes Lujiazui, Shanghai as a case study and constructs a dynamic visual quantification framework based on Rhino + Grasshopper. The key achievements are as follows:
6.1.1. Methodological Breakthrough: Resolving Three Core Limitations of Traditional Research
This study proposes a standardized process of “3D Modeling—Parameter Calculation—Algorithm Optimization—Result Verification”, which resolves three core limitations of traditional methods: subjectivity, fragmentation, and irreproducibility. By quantifying dynamic visual experiences through θ (vertical perspective angle) and β (horizontal perspective angle) parameters, it screens “visually stable points” via variance analysis and identifies “optimal viewing points” using the annealing algorithm, providing a reproducible methodology for similar studies.
Meanwhile, parametric programming enables automatic data calculation, optimization, and visualization, significantly reducing the costs of manual surveys and data processing. It transforms the “qualitative description” of visual experiences in traditional urban design into “quantitative analysis” of numerical indicators, offering an objective basis for design decision-making.
The methodological breakthrough of this study is also a contemporary quantitative extension of the classic theory in Gordon Cullen’s Townscape [10]. Cullen’s proposed “Serial Vision” concept has long remained at the level of qualitative design principles, while this study, through the Rhino + Grasshopper platform, transforms its “continuous visual experience” into computable and reproducible θ (vertical perspective angle) and β (horizontal perspective angle) parameters, achieving the leap from “qualitative description” to “quantitative tool.” This transformation strengthens the theoretical continuity between contemporary parametric technology and classic urban design theories.
6.1.2. Practical Implementation: Specific Contributions to Three Urban Design Scenarios
Landmark Location Optimization: Excluding economic, political, and other contextual factors, “visually stable points” can serve as preferred locations for core landmarks, avoiding the subjectivity of traditional experience-based site selection. The core value of this method lies not in “solidifying the status of landmarks”, but in identifying “visually stable points” (ensuring core urban recognizability) and “dynamically prominent areas” (accommodating diverse perceptions) through θ/β dynamic curves, thereby achieving a balance between “orderly planning” and “vibrant experience”.
Viewing Platform Planning: “Optimal viewing points” (e.g., between Observation Points 2 and 3) can guide the precise layout of viewing platforms. Integrating human eye-level height and safety standards, this aligns with the quality goal of urban public spaces featuring “leisurely and quality-oriented slow travel”.
Skyline Form Control: The dynamic curves of θ/β values quantify the height gradient of building clusters, which can effectively constrain the height gradient of buildings in core areas and mitigate visual oppression caused by high-density development.
6.2. Research Limitations
While this study has achieved dual breakthroughs in methodology and practice, it exhibits the following objective limitations due to the defined research scope and technical approach:
- Data Dependence Limitation: It relies excessively on high-precision 3D building models, and low-precision data may introduce calculation errors. Meanwhile, the computational speed of the study’s experiments is constrained by hardware performance.
- Population Adaptability Limitation: This study models pedestrian movement trajectories as purely linear and unidirectional motion, while fixing the observation height at 1.7 m, thus failing to account for visual differences across diverse demographic groups (e.g., children and the elderly). Future research should incorporate eye height parameters for different groups (e.g., 1.2 m for children) to correct θ values, avoiding “visual occlusion” for children caused by designs based solely on adult perspectives and making the quantitative results more consistent with the actual visual experiences of all populations. Additionally, subjective perceptual factors such as cultural backgrounds and aesthetic preferences should be integrated to enhance the method’s adaptability to diversified urban populations.
6.3. Future Prospects
- Method Optimization: Integrate with officially recognized standard urban models, incorporate eye height parameters for diverse populations, and further verify the correlation between subjective preferences and θ/β parameters through eye-tracking, VR, and other technologies.
- Scenario Expansion: Extend the technical framework to linear landscapes such as urban streets and park greenways, verifying its applicability across multiple scenarios.
- Implementation Enhancement: Explore the specific thresholds of quantitative indicators such as “visually stable points” and “optimal viewing points” to provide quantitative references for the formulation of planning guidelines; integrate lightweight plugins to lower the application threshold for urban skyline planning and renewal, thereby achieving the goal of “serving urban construction”.
Supplementary Materials
The following supporting information can be downloaded at: https://www.mdpi.com/article/10.3390/buildings16010093/s1.
Author Contributions
Conceptualization, J.Z. and D.C.; Methodology, J.Z. and D.C.; Software, D.C.; Validation, J.Z., D.C. and R.-J.H.; Formal analysis, D.C.; Investigation, D.C.; Resources, J.Z.; Data curation, D.C. and R.-J.H.; Writing—original draft, D.C. and R.-J.H.; Writing—review and editing, J.Z.; Visualization, J.Z. and D.C.; Supervision, J.Z.; Project administration, J.Z.; Funding acquisition, J.Z. All authors have read and agreed to the published version of the manuscript.
Funding
This research received no external funding.
Data Availability Statement
The original contributions presented in this study are included in the article/Supplementary Materials. Further inquiries can be directed to the corresponding author.
Conflicts of Interest
The authors declare no conflicts of interest.
References
- Niu, X.Y.; Li, K.K. Quantitative analysis method of urban skyline based on visual impact. Urban Plan. J. 2013, 3, 99–105. [Google Scholar]
- Wang, J.; Lyu, Z. Historical Process and Experience of Waterfront Development and Construction in World Cities. Urban Plan. 2001, 7, 41–46. [Google Scholar]
- Zheng, H.; Zhang, J. Visual Analysis on Spatial Forms Outside Super High-rise Buildings in Small Lujiazui District, Pudong. Archit. J. 2011, S1, 144–147. [Google Scholar]
- Lynch, K. Good City Form; MIT Press: Cambridge, MA, USA, 1984. [Google Scholar]
- Shao, X.Y. Analysis of the “Pictorial Meaning” Layout Techniques in Jiangnan Gardens during the Late Ming and Early Qing Dynasties. Archit. J. 2023, 9, 102–108. [Google Scholar] [CrossRef]
- Zhang, Z.M.; Liu, S.S.; Huang, X. Pictorial Construction: The Contemporary Practice of Liu Dunzhen’s Rockery Arrangement in the Zhan Garden. Landsc. Archit. 2024, 31, 65–72. [Google Scholar] [CrossRef]
- Dadpour, S.; Pakzad, J.; Khankeh, H. Understanding the Influence of Environment on Adults’ Walking Experiences: A Meta-Synthesis Study. Int. J. Environ. Res. Public Health 2016, 13, 731. [Google Scholar] [CrossRef] [PubMed]
- Li, X.; Xie, D.; Zhou, Z.; Zhang, X.; Li, R.; Li, J.; Chen, Z.; Zhang, J. Visualization analysis of research progress for walkability. Sci. Rep. 2024, 14, 1989. [Google Scholar] [CrossRef] [PubMed]
- Filomena, G.; Verstegen, J.A.; Manley, E. A computational approach to ‘The Image of the City’. Cities 2019, 89, 14–25. [Google Scholar] [CrossRef]
- Cullen, G. Townscape; The Architectural Press: London, UK, 1961. [Google Scholar]
- Heath, T.; Smith, S.G.; Lim, B. Tall Buildings and the Urban Skyline: The Effect of Visual Complexity on Preferences. Environ. Behav. 2000, 32, 541–556. [Google Scholar] [CrossRef]
- Ewing, R.; Handy, S. Measuring the Unmeasurable: Urban Design Qualities Related to Walkability. J. Urban Des. 2009, 14, 65–84. [Google Scholar] [CrossRef]
- Mandelbrot, B.B. The Fractal Geometry of Nature; WH Freeman: New York, NY, USA, 1982. [Google Scholar]
- Cao, Y.C.; Zhang, Y.K. Quantitative analysis of urban skyline based on Fractal Theory. Urban Issues 2013, 12, 32–36. [Google Scholar] [CrossRef]
- Yan, J.; Wang, F.; Cai, A.Z.; Jia, S.G. A quantitative analysis of urban waterfront landscape skyline based on Fractal Theory: A case study of the east coast of Xuanwu Lake, Nanjing. Mod. Urban Res. 2017, 11, 45–50. [Google Scholar]
- Cgeng, S.; Lang, L.J.; Yang, X.Y. Evaluation and Analysis Model Construction of Urban Waterfront Interface Form Based on Crowd Dynamic Visual Attention: A Case Study of Nanjing Youth Olympic Area. Landsc. Archit. 2024, 31, 30–38. [Google Scholar]
- Zhao, M.; Zhang, J.; Cai, J. Visual Preference Evaluation of Urban Spatial Form Dominated by Iconic Buildings: A Case Study of the Oriental Pearl TV Tower in Shanghai. Mod. Urban Res. 2021, 2, 92–97. [Google Scholar]
- Zhang, J.; Luan, W.; Zhang, J. Optimization of Quantitative Evaluation Method for Urban Waterfront Building Cluster Skyline. Buildings 2024, 15, 9. [Google Scholar] [CrossRef]
- Fu, S.; Zhang, N.; Su, C.; Tan, L.; Zhao, X. Linear Landscape Planning of Urban Riverside Super-Tall Buildings: From the Perspective of Dynamic Visual Quantitative Analysis. Urban Probl. 2022, 6, 27–34+46. [Google Scholar]
- Zhang, Z.; Li, Z.; Guo, Z. EEG-based spatial elements optimisation design method. Archit. Intell. 2022, 1, 17. [Google Scholar] [CrossRef]
- Alexakis, K.; Benekis, V.; Kokkinakos, P.; Askounis, D. Genetic algorithm-based multi-objective optimisation for energy-efficient building retrofitting: A systematic review. Energy Build. 2025, 328, 115216. [Google Scholar] [CrossRef]
- Shi, L.; Zhao, H.; Zheng, S.; Yu, T.; Dong, R. Basic concepts and implementation of landscape perception-based ecological planning in urban-rural fringe areas. Acta Ecol. Sin. 2017, 37, 383–390. [Google Scholar]
- Liu, X.F.; Lin, T.; Zhao, Y.; Lin, M.; Cao, X.; Li, Y.; Wu, X.; Zhang, G.; Liu, W. Landscape elements of urban parks and their impact on park activities of different groups. Acta Ecol. Sin. 2020, 40, 168–182. [Google Scholar]
- Zhang, L.; Li, J.W.; Liu, J.Y.; Zuo, Y. Urban green space landscape evaluation and unit governance strategies: Yangpu District, Shanghai as an example. Landsc. Gard. 2025, 42, 4–12+49. [Google Scholar]
- Wu, X.Q.; Mou, S.C.; Kong, L. Dynamic and static sightline analysis of mountain parks based on GIS technology: A case study of the selection of the summit viewpoint of Hushan Mountain in Qixia Mountain. In Proceedings of the 2020 China Urban Planning Annual Conference, Ningbo, China, 13–15 December 2020; China Urban Planning Society, Chengdu Municipal People’s Government, Eds.; Southeast University: Nanjing, China, 2021; pp. 374–387. [Google Scholar]
- Zhao, K.; Huang, H.; Wu, W. Can the establishment of state-level urban agglomeration stimulate enterprise innovation?—Taking Yangtze River Delta and Pearl River Delta as an example. PLoS ONE 2022, 17, e0273154. [Google Scholar] [CrossRef] [PubMed]
- Kostof, S. The City Shaped; Little, Brown and Company: Boston, MA, USA, 1991. [Google Scholar]
- Zhao, M.; Zhang, J.; Cai, J. Influences of new high-rise buildings on visual preference evaluation of original urban landmarks: A case study in Shanghai, China. J. Asian Archit. Build. Eng. 2020, 19, 273–284. [Google Scholar] [CrossRef]
- Zhang, J.; Pan, L. Organization and Shaping of Skyline Landscape in Coastal Mountainous Cities: A Case Study of Yantai Coastal Skyline Landscape Characteristics. Urban Dev. Stud. 2010, 17, 77–84. [Google Scholar]
- Zhang, J.; Wang, Y.; Luo, X.; Luan, W.-L. Multi-Viewpoint Assessment of Urban Waterfront Skylines: Fractal and Spatial Hierarchy Analysis in Shanghai. Buildings 2025, 15, 1407. [Google Scholar] [CrossRef]
- Puspitasari, A.W.; Kwon, J. Analysis of the visual quality of riverfront skyline through the feature of height and spatial arrangement of tall building. Archit. Res. 2019, 21, 91–98. [Google Scholar]
- Puspitasari, A.W.; Kwon, J. Comparison of Spatial Layout of Tall Buildings Clustered in Circular, Rectangular, and Linear Geographical Areas and Impact on Skyline. Buildings 2020, 10, 64. [Google Scholar] [CrossRef]
Disclaimer/Publisher’s Note: The statements, opinions and data contained in all publications are solely those of the individual author(s) and contributor(s) and not of MDPI and/or the editor(s). MDPI and/or the editor(s) disclaim responsibility for any injury to people or property resulting from any ideas, methods, instructions or products referred to in the content. |
© 2025 by the authors. Licensee MDPI, Basel, Switzerland. This article is an open access article distributed under the terms and conditions of the Creative Commons Attribution (CC BY) license.