


Abstract
The cement and concrete industry is one of the primary sources of anthropogenic carbon dioxide (CO2) emissions globally, responsible for nearly 8% of total emissions, making the need for a low-carbon transition urgent. CO2 curing provides both strength enhancement and carbon sequestration, yet the compressive strength of such concrete remains challenging to predict due to limited and strongly coupled experimental factors. This study developed an explainable Automated Machine Learning (AutoML) framework with integrated uncertainty quantification to predict the 28-day compressive strength of CO2-cured concrete. The framework was built using 198 standardized experimental data and trained with four algorithms—Random Forest (RF), Support Vector Regression (SVR), eXtreme Gradient Boosting (XGBoost), and the transformer-based Tabular Prior-Data Fitted Network (TabPFN). To enhance model accuracy and efficiency, stratified cross-validation, hyperparameter optimization, and bootstrap-based uncertainty analysis were applied during training. The results show that TabPFN achieves the highest predictive accuracy (test R2 = 0.959) and maintains a stable 95% prediction interval. SHapley Additive exPlanations (SHAP) indicates that cement content, aggregate composition, water–binder (W/B) ratio, and CO2 curing time are the dominant factors, with an optimal W/B ratio near 0.40. Interaction analysis further reveals synergistic effects between cement content and W/B, and a strengthening coupling between curing time and CO2 concentration at longer durations. The framework enhances predictive reliability and explainability, supporting mixture design and curing optimization for low-carbon concrete development.
1. Introduction
To date, global anthropogenic CO2 emissions have risen to an unprecedented level, reaching approximately 37.8 Gt in 2024 [1]. In the construction sector, the cement and concrete industry—accounting for 7–8% of global anthropogenic CO2 emissions—faces an urgent need for deep decarbonization [2,3]. As a carbon-mineralization pathway that offers emission reduction and performance enhancement, CO2 curing has attracted increasing attention [4]. During carbonation curing, injected CO2 reacts with unhydrated silicate phases and hydration products to form stable carbonates, leading to microstructural densification and pore refinement. Experimental studies report CO2-uptake levels of 10–17% of binder mass and 28-day strength improvements exceeding 60% [5,6], while large-scale carbonation curing of concrete blocks can sequester around 1.5 Mt CO2 annually—approximately 3% of annual emissions from the cement sector [7].
With the rapid development of prefabricated construction, the controlled humidity-temperature environment in precast concrete plants provides ideal conditions for early-age CO2 curing, enabling the simultaneous realization of strength enhancement and carbon-sequestration functionality in industrial production workflows [8,9]. However, the strength development of CO2-cured concrete exhibits significant nonlinear and multiscale characteristics due to the coupled effects of multiple factors, including mix design composition, CO2 concentration and pressure, moisture migration, and carbonation kinetics. [10,11,12]. Although previous studies have advanced the understanding of carbonation-curing reactions, microstructural evolution, and the optimization of curing regimes, systematic and reliable prediction of the compressive strength of CO2-cured concrete remains limited [13].
In recent years, Machine Learning (ML) models have been successfully applied to predict the mechanical properties of various concrete systems, including recycled aggregate concrete [14,15], self-healing concrete [16], high-performance concrete [17], self-compacting concrete [18,19], geopolymer concrete [20], and CO2-cured concrete [21]. For concrete strength prediction, existing ML approaches can generally be categorized into two major groups: individual learners and ensemble learners [22]. Individual learners rely on a single model for prediction, such as RF [23], SVR [24], and Decision Trees (DT) [25]. In contrast, ensemble learners combine multiple weak learners to enhance robustness and predictive accuracy, with Gradient Boosting (GB) [26], eXtreme Gradient Boosting (XGBoost) [27,28], and Categorical Boosting (CatBoost) [29] demonstrating strong performance in forecasting the mechanical behavior of a broad range of concrete systems.
Because machine learning models often possess complex internal structures and decision pathways, their prediction processes are commonly regarded as black boxes. In recent years, the SHAP [30,31] method has been introduced to quantify the contribution of each input feature to the final prediction, thereby enhancing explainability and providing insight into the model’s decision-making process. However, existing explainability methods largely remain limited to feature-importance analysis, and model development still relies heavily on manual algorithm selection and parameter tuning, which restricts their performance in small datasets or strongly coupled material systems and prevents them from fully capturing the underlying mechanisms.
AutoML has emerged as a promising paradigm for reducing expert intervention in algorithm selection and hyperparameter tuning. Early work applying Auto-sklearn to concrete compressive-strength prediction demonstrated that AutoML can autonomously generate competitive models without extensive manual tuning [32]. A subsequent study further introduced an interpretable AutoML framework, highlighting its potential for materials-property prediction [33]. However, AutoML models specifically designed for small-sample tabular data remain relatively limited. Tabular Prior-Data Fitted Network (TabPFN) leverages in-context learning and meta-learning to acquire universal data priors, enabling direct prediction during inference without task-specific design or tuning, offering an efficient solution for small datasets [34]. Despite these advancements, AutoML remains insufficiently explored in concrete science, particularly for CO2-cured concrete, where nonlinear coupling among mixture parameters, curing conditions, and reaction kinetics creates additional modeling challenges. Moreover, uncertainty quantification (UQ) is rarely integrated into existing ML frameworks, even though hybrid model-driven and data-driven methods have shown the importance of UQ in predicting concrete creep [35].
To address these gaps, this study developed a prior-driven, explainable and uncertainty-aware machine learning framework for predicting the 28-day compressive strength of CO2-cured concrete. A unified database of 198 experimental records extracted from peer-reviewed literature was compiled and standardized to ensure consistency in mixture compositions and CO2-curing conditions. Four representative models—RF, SVR, XGBoost, and the prior-driven transformer model TabPFN—were trained and evaluated through stratified cross-validation, calibrated hyperparameters, and bootstrap-based confidence-interval estimation. By integrating SHAP interpretation, nonlinear dependence analysis, and interaction mapping, this study not only established a standardized compressive strength dataset suitable for ML modeling, but also enabled a rigorous comparison between conventional ML and prior-driven AutoML under small-sample conditions, quantified predictive uncertainty, and aligned ML-learned patterns with known carbonation-curing mechanisms. Collectively, these advancements contribute to the development of mechanism-informed and reliable data-driven tools for CO2-cured concrete design and support the broader adoption of carbon-mineralized materials in sustainable construction.
2. Materials and Methods
2.1. Machine Learning Models
2.1.1. Traditional Machine Learning
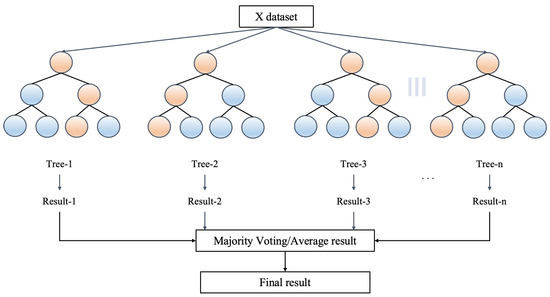
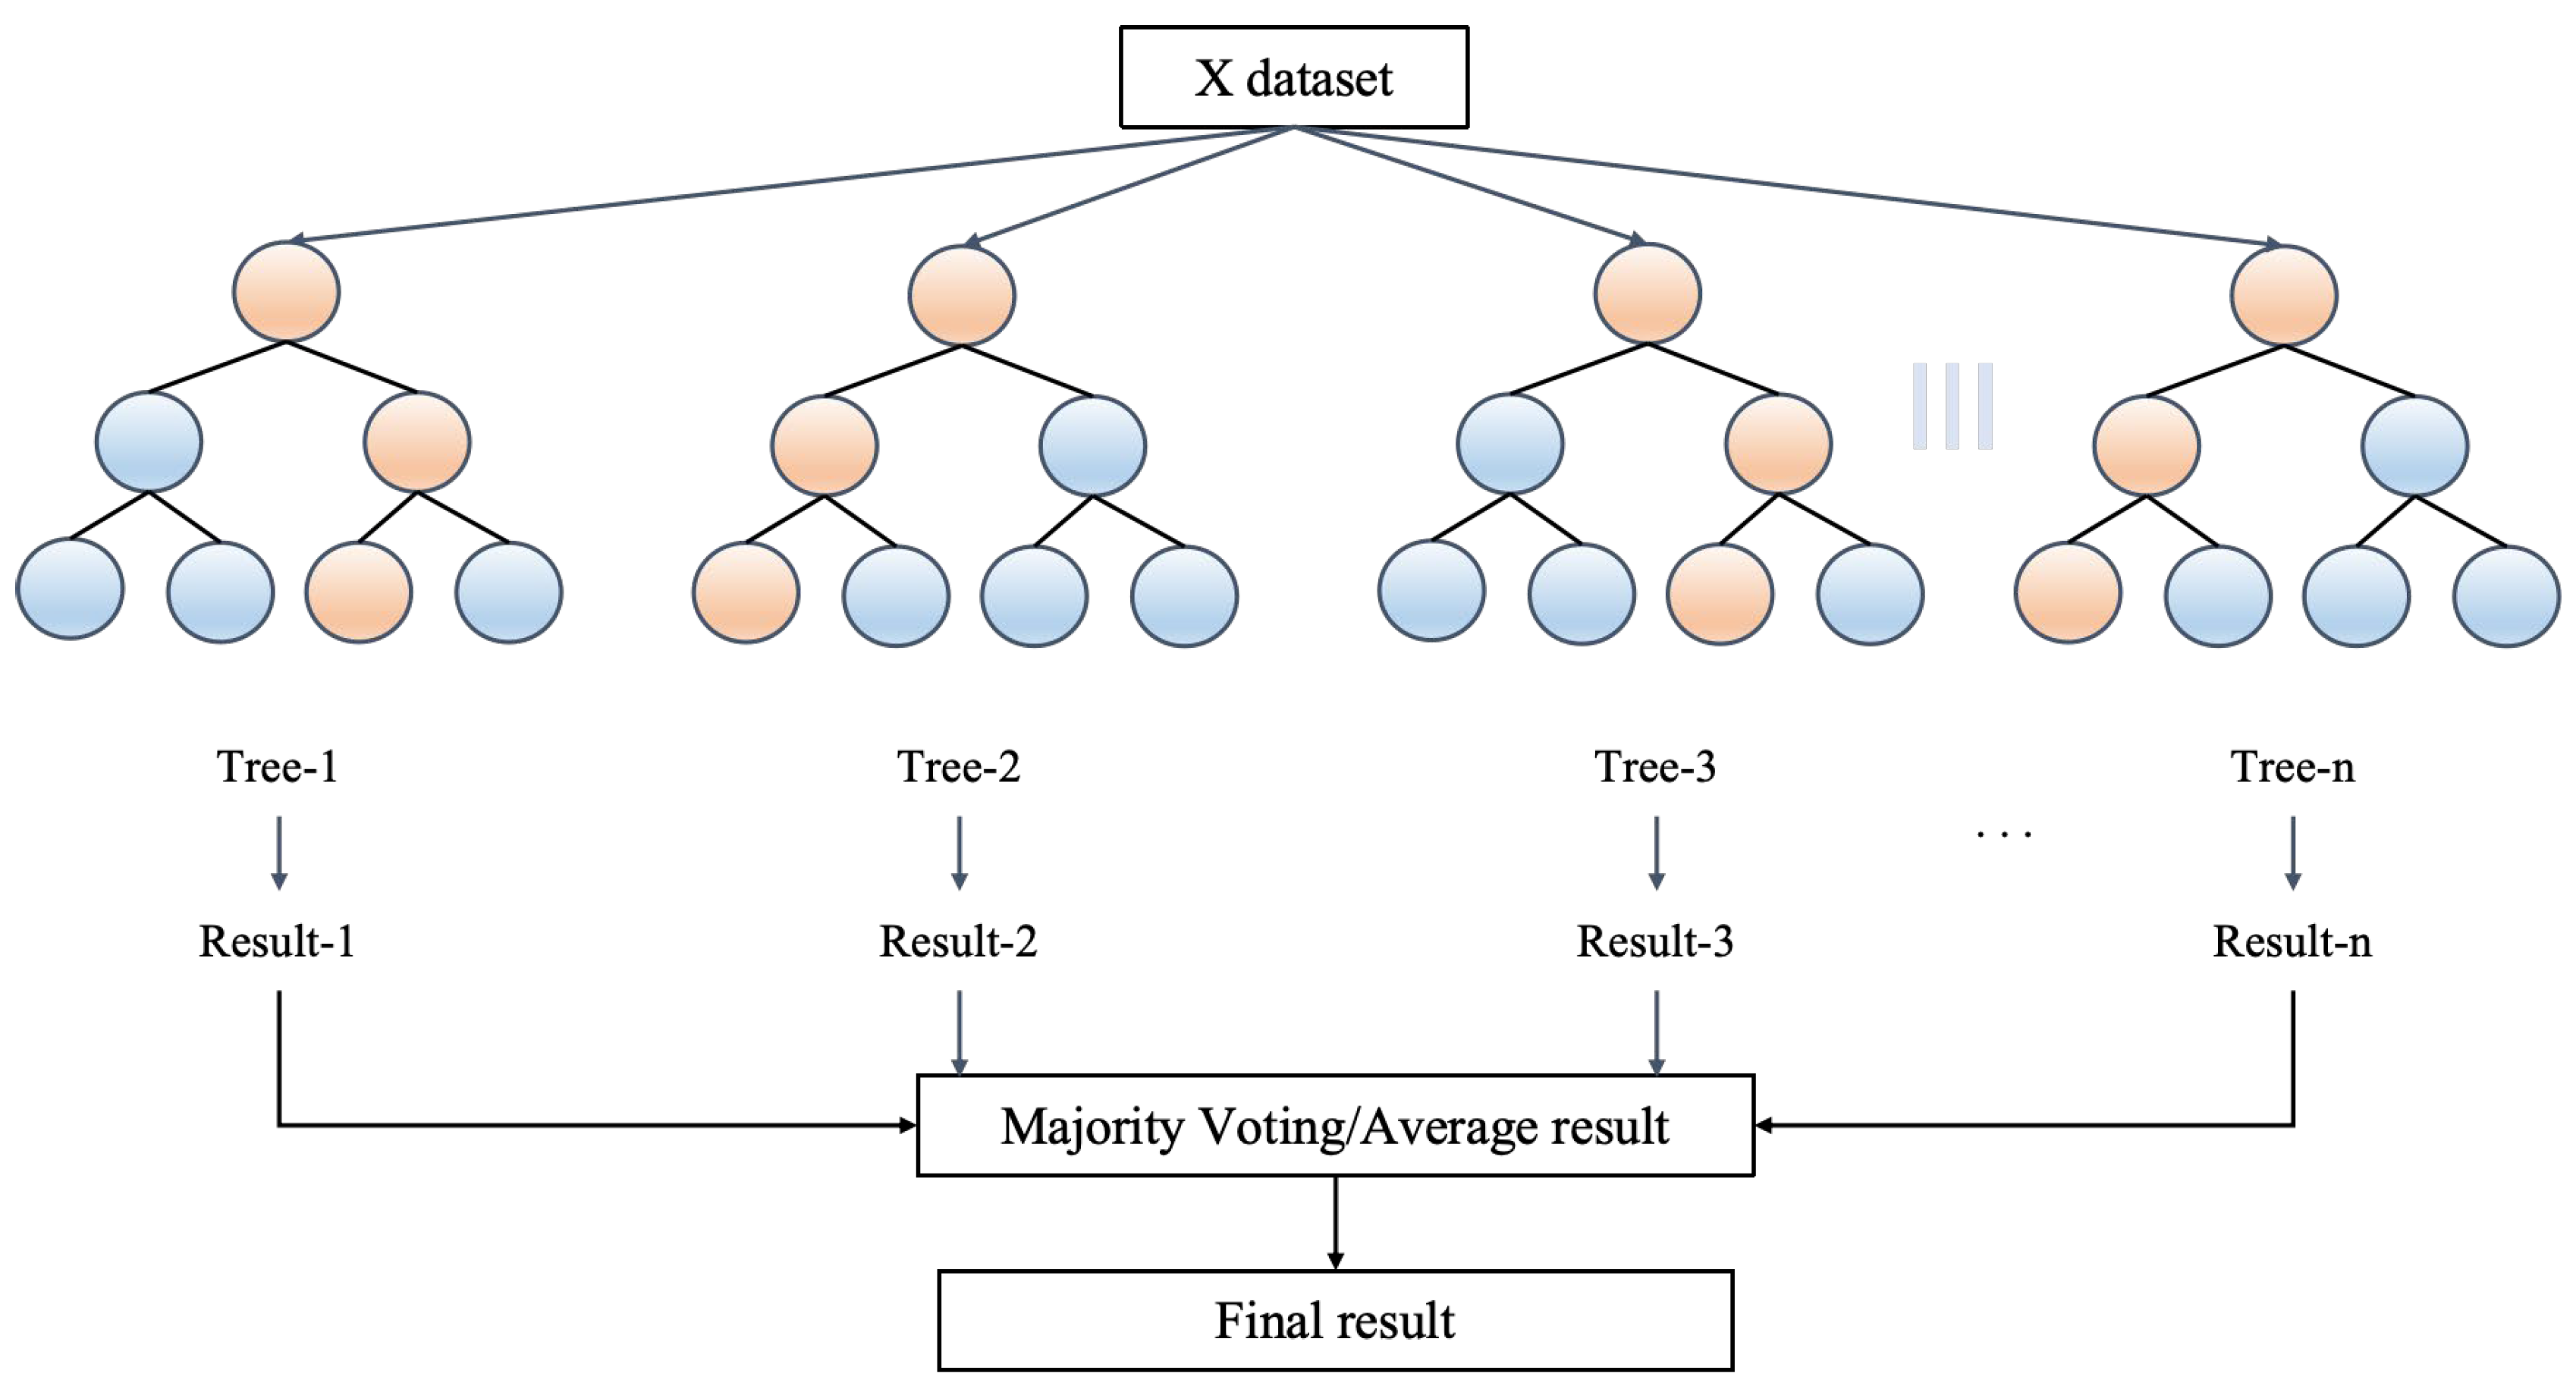
Random Forest (RF) is an ensemble learning method that aggregates multiple decision trees built from bootstrap-sampled subsets of the training data [36]. At each tree split, only a random subset of features is considered, introducing both sample- and feature-level randomness. This dual-randomness mechanism reduces tree correlation, lowers variance, and mitigates overfitting (Figure 1). For regression tasks, RF outputs the average prediction of all trees, providing strong robustness to noise and effective modeling of nonlinear relationships.
Figure 1.
Architecture of RF model.
Support Vector Regression (SVR) builds a regression function with a maximal margin in a high-dimensional feature space [37]. By introducing kernel functions—typically the radial basis function (RBF)—SVR implicitly maps inputs into a nonlinear feature space and fits a linear regressor therein [38]. The penalty parameter C controls the tolerance for deviations, while the kernel width γ determines the smoothness of the mapping. Owing to its convex optimization formulation, SVR provides a globally optimal solution and performs reliably on small-sample and high-dimensional datasets.
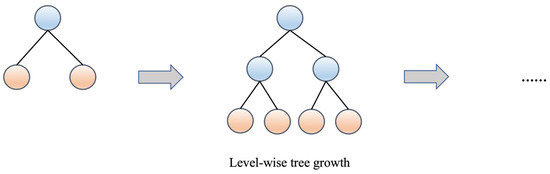
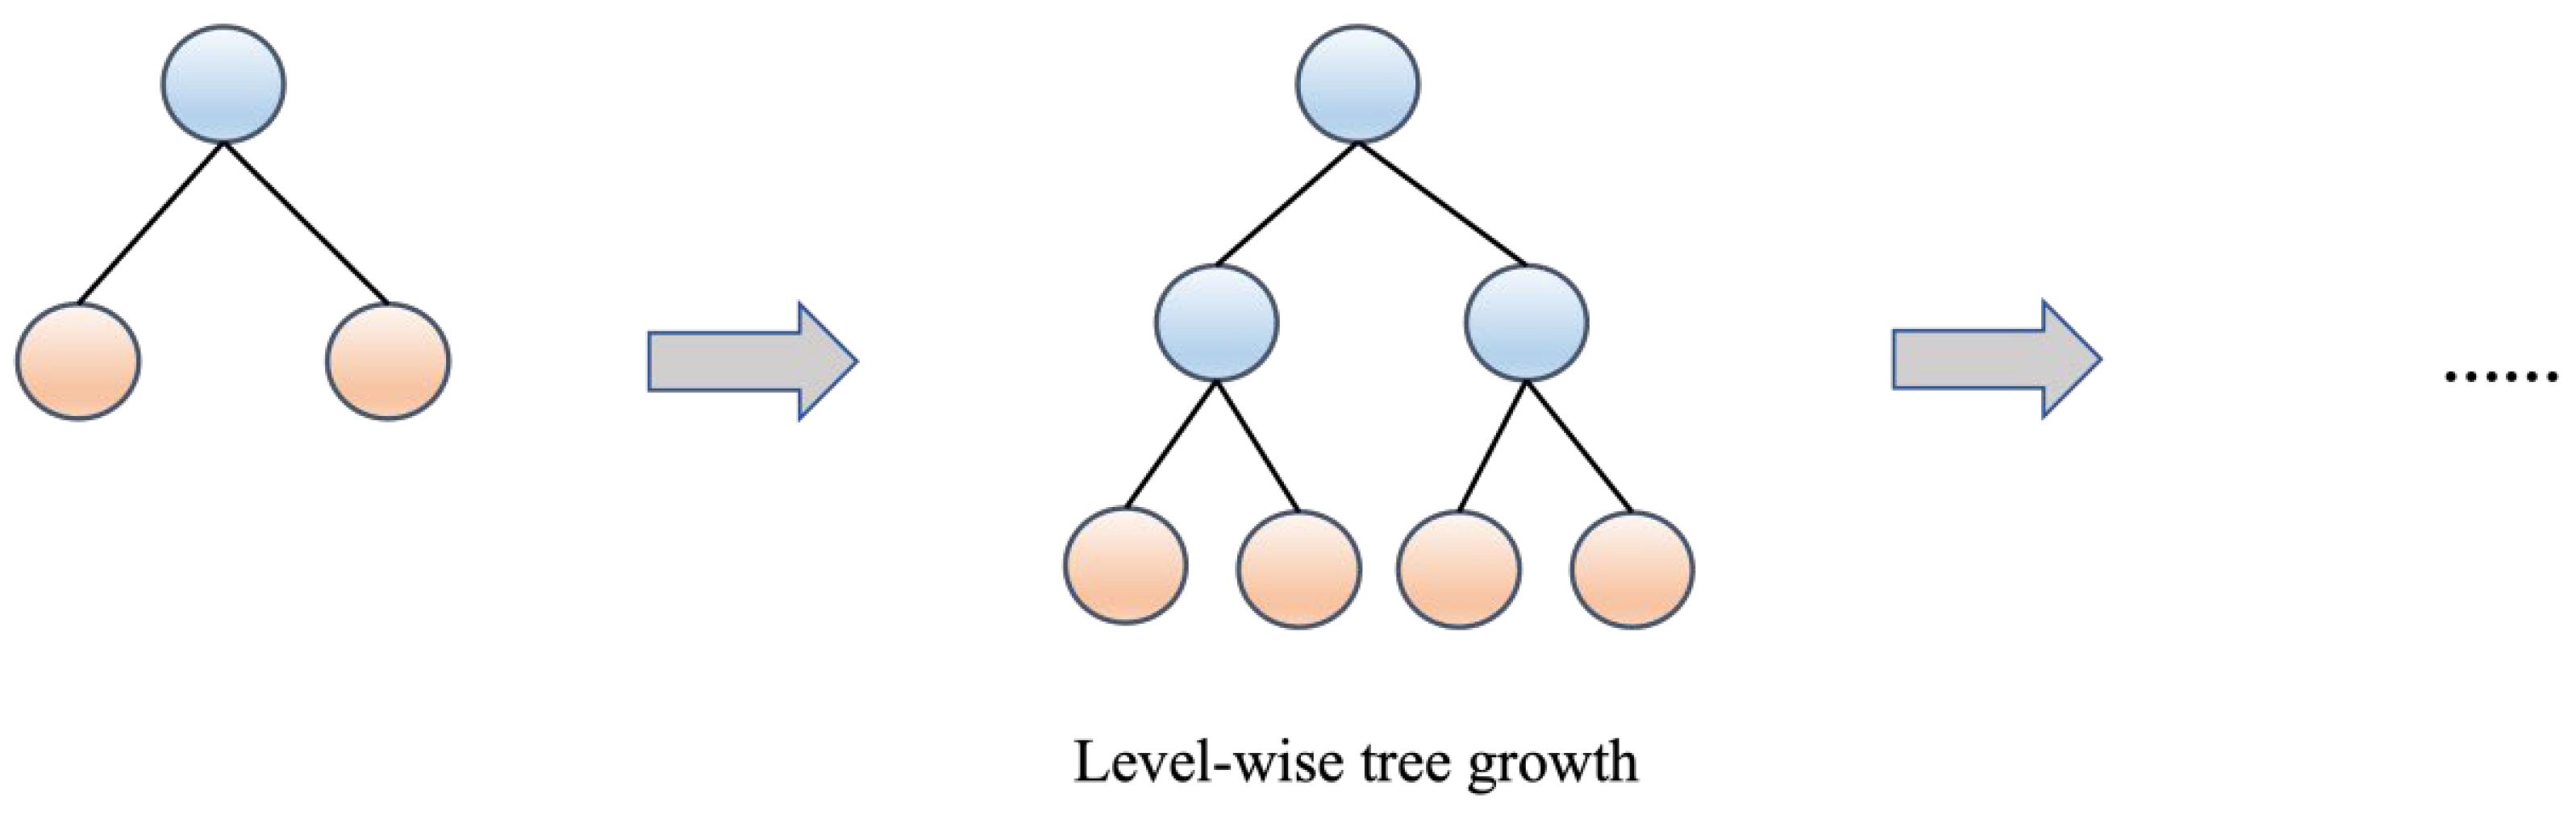
Extreme Gradient Boosting (XGBoost) is a gradient boosting framework that sequentially adds decision trees to minimize the residuals of preceding trees [39]. Its objective function incorporates both the loss term and explicit regularization terms for tree complexity, effectively controlling overfitting. Techniques such as learning-rate shrinkage, row subsampling, and column subsampling further enhance generalization performance (Figure 2). With efficient parallelization and robustness to missing data, XGBoost has become one of the most widely used boosting algorithms for tabular regression tasks.
Figure 2.
Architecture of XGBoost model.
2.1.2. Automated Machine Learning
The Prior-data Fitted Network (PFN) provides an efficient approximation of Bayesian inference by training a neural network on synthetic data sampled from a predefined prior over the hypothesis space [40]. TabPFN, a PFN variant specifically developed for small-scale tabular datasets, enables near-Bayesian-optimal predictions without requiring model selection or hyperparameter tuning [34]. During the offline training stage, TabPFN learns to approximate the posterior predictive distribution (PPD) by mapping inputs, labels, and training data to the integral form of Bayesian prediction:
where xnew denotes the new input instance, ynew is the corresponding output, D represents the training set, and θ ∈ denotes a specific hypothesis from the prior distribution.
Through large-scale pretraining on synthetically generated datasets, the model learns an implicit representation of this Bayesian integration. In the prediction phase, TabPFN performs inference through a single forward pass of the trained network, enabling fast computation, strong generalization, and robust performance on small, highly nonlinear datasets such as those arising in CO2-curing experiments.
2.1.3. Model Evaluation Metrics
To better evaluate the accuracy of the four models, the mean absolute error (MAE), root mean square error (RMSE), mean absolute percentage error (MAPE), and the coefficient of determination (R2) were used to evaluate the performance of the proposed model. The MAE is a metric for assessing the average absolute disparity between the predicted and actual values [41]; the RMSE indicates the average degree of bias between the predicted and actual values; and the MAPE represents the error as a percentage [42]. The closer the values of the MAE, RMSE, and MAPE are to zero, the better the performance of the model. R2 is a measure of how well the data fit; as the value approaches 1, the fit becomes increasingly optimal [43]. These evaluation indicators can be calculated as:
where and are the actual and predicted values for the ith sample, respectively, is the mean value for the ith samples, and n is the number of samples.
2.1.4. Model Uncertainty Assessment
To evaluate model reliability under small-sample conditions, a comprehensive uncertainty quantification procedure was employed. First, a five-fold stratified cross-validation was used to generate multiple independent test-set predictions while maintaining consistent compressive strength distributions across folds, thereby reducing distribution-induced variability. Hyperparameters were optimized using the GridSearchCV function within this cross-validation framework to ensure stable and reproducible model configurations [44].
Following cross-validation, predictive uncertainty was estimated through bootstrap resampling [45]. Specifically, bootstrap samples (n = 1000) were generated by resampling, with replacement, the set of predictions obtained for all test samples, thereby constructing an empirical predictive distribution. The 2.5th and 97.5th percentiles of the resulting empirical distribution were taken as the bounds of the 95% confidence interval (CI), while the confidence interval width quantified prediction uncertainty and the mean of the bootstrap distribution represented the expected prediction performance.
This procedure provided a rigorous basis for evaluating both robustness and accuracy. Model selection followed a combined criterion: when test-set R2 values differed by less than 0.01, the model with the narrower CI was preferred, ensuring that the final choice achieved high predictive accuracy and low uncertainty.
2.2. Model Explainability and Interaction Analysis
To interpret the internal decision processes of the predictive models and quantify the relative contribution of each input variable, this study adopted a multi-layered explainability framework combining global, local, and interaction-level analyses.
2.2.1. Global SHAP-Based Feature Importance Analysis
Global SHAP values were used to quantify the marginal contribution of each feature to the model predictions. Based on cooperative game theory, SHAP computes the additive contribution of a feature by averaging its effect across all possible subsets of input variables [46]. For sample i and feature j, the Shapley value ϕi, j is defined as:
where F denotes the full feature set; S is any subset of features not including j; and f (xi, S) represents the model prediction for sample i when only features in subset S are included.
The global importance of feature xj is then obtained by averaging the absolute Shapley values across all samples:
where Ij is the global importance of feature j; N is the total number of samples; and ϕi, j is the Shapley value of feature j for sample i, representing its marginal contribution to the prediction.
This metric provides a model-agnostic, additive, and consistent quantification of feature influence over the entire dataset, forming a transparent and traceable foundation for subsequent explainability analyses.
2.2.2. SHAP Dependence Plots
To explore nonlinear feature-response relationships, SHAP dependence plots were generated. These plots jointly visualized the raw feature values and corresponding Shapley contributions, thereby capturing threshold behavior, nonlinear trends, and heterogeneity in mixture and curing variables [47]. Background density histograms were overlaid to preserve the empirical distribution of the training data, ensuring that the learned nonlinear responses were interpreted in the context of actual data support.
2.2.3. Nonlinear Effects Analysis Using PDP and ICE Curves
Partial Dependence Plots (PDPs) were used to examine the global marginal effect of feature xj on the predicted compressive strength while averaging out the influence of other variables [48]. The partial dependence function was defined as:
where PDj(xj) is the partial dependence function of feature j; xj is the evaluated value of feature j; xi,−j denotes all other features of sample i except feature j; f (xj, xi,−j) is the model prediction when feature j is fixed at xj and other features take their observed values; and Exi,−j[⋅] represents the expectation over the empirical distribution of all remaining features.
To reveal local heterogeneity masked by PDP averaging, Individual Conditional Expectation (ICE) curves were computed for each instance following [49]:
where ICEi(xj) is the individual conditional expectation curve of sample i for feature j; xj is the value assigned to feature j; xi,−j denotes all remaining features of sample i held fixed during ICE computation; and f (xj, xi,−j) is the predicted output for sample i when only feature j is varied and all other features stay at their observed values.
ICE curves allowed investigation of sample-specific behavior and local nonlinear patterns, offering a complementary perspective to the global PDP analysis.
2.2.4. Interaction Effect Analysis
To characterize the coupled effects among mixture design variables and curing conditions, SHAP interaction values were calculated. These values decompose the joint contribution of a feature pair (j, k) into main effects and interaction components:
where ϕi, jk represents the joint Shapley value of features (j, k), and ϕi, j and ϕi, k denote the first-order Shapley values (main effects).
To obtain a global measure of interaction compressive strength, a Mean Effective Interaction (MEI) index was defined as [46]:
where MEIj, k is the Mean Effective Interaction index between features j and k, representing their average interaction strength across the dataset; N denotes the total number of samples.
Higher MEI values indicate stronger synergistic or antagonistic relationships, enabling the identification of key coupled mechanisms—such as the interplay between binder content and water–binder ratio or between curing duration and CO2 concentration.
2.3. Data Sources and Preprocessing
As CO2 curing technology is still in the experimental research stage and has not yet been widely adopted in practical construction, available data primarily stem from laboratory-based investigations. The present study utilizes a compiled dataset reported in the literature [50,51,52,53,54,55], consisting of 198 validated experimental entries that capture mixture proportions, CO2 curing parameters, and 28-day compressive strength measurements.
During the data collection process, several measures were implemented to ensure consistency among datasets sourced from different publications [21]: (1) Standard testing method: All datasets reporting the 28-day compressive strength of CO2-cured concrete were obtained from studies employing consistent and procedure-based testing protocols (e.g., ASTM standards); (2) Unit normalization: Compressive strength values originally reported in imperial units were converted to SI units (MPa); (3) Data cleansing criteria: Records with incomplete information—such as missing mixture compositions or CO2-curing parameters—were removed to ensure that only fully documented and traceable samples were retained.
The finalized dataset contains the key input and output variables required for predictive modeling. The input features include cement (C), coarse aggregate (CA), fine aggregate (FA) contents (kg/m3), water-to-binder ratio (W/B), CO2 curing time (T), pressure (P), and concentration (CC). The output variable is the 28-day compressive strength (CS). These variables form the complete and unified feature set supporting subsequent model training, evaluation, and explainability analysis. Table 1 presents detailed statistical information for each variable, including the type, name, unit, label, maximum and minimum values, and mean and standard deviation (SD).
Table 1.
Input and output variables in the dataset.
3. Results and Discussion
3.1. Model Performance Evaluation
3.1.1. Data Preprocessing
A comprehensive database of 198 datasets was first compiled from previously published experimental investigations on CO2-cured concrete. After systematic preprocessing, the CO2-cured concrete dataset was cleaned by removing incomplete and anomalous records, and the remaining samples still covered a wide range of mixture compositions (C, CA, FA, W/B) and CO2-curing conditions (T, P, CC), preserving variability in compressive strength levels. The dataset was then split into training and testing subsets using an 80:20 ratio for model fitting and independent validation. In addition, stratification based on five quantile intervals of compressive strength was applied to ensure that each fold in the five-fold cross-validation retained a consistent CS distribution, thereby reducing distributional bias between training and testing subsets and improving the reliability of model evaluation.
3.1.2. Hyperparameter Optimization
Based on the nested cross-validation and grid search procedures (except for TabPFN), each model obtained its optimal hyperparameter configuration as summarized in Table 2. The Random Forest model selected n_estimators = 400 and max_depth = 12; SVR adopted an RBF kernel with C = 50 and ε = 0.1; XGBoost obtained n_estimators = 300, learning_rate = 0.05, max_depth = 6, and subsample = 0.85. TabPFN completed its configuration through its internal auto-tuning mechanism (num_iter = 32, batch_size = 64).
Table 2.
Optimal hyperparameters for the ML models.
3.1.3. Quantitative Model Evaluation
The results in Table 3 show clear differences between the traditional machine learning models and the AutoML approach. The traditional models (RF, SVR, and XGBoost) exhibit high levels of predictive agreement for the test set, with RF and XGBoost achieving test-set R2 values of 0.928 and 0.937, respectively. These ensemble-based tree models rely on hierarchical splitting rules that enable them to capture nonlinear interactions among mixture components and CO2-curing parameters. In contrast, SVR yields a lower test-set R2 of 0.872, consistent with the limited expressive capacity of kernel-based methods when modeling highly coupled material parameters.
Table 3.
Performance metrics of different models on training and test sets.
In comparison, TabPFN—operating under an AutoML paradigm—demonstrates more consistent predictive performance. Its prior-driven architecture and internal auto-tuning mechanism allow the model to incorporate structural priors learned from large collections of synthetic tasks, enabling it to effectively model the nonlinear relationships between mixture design, CO2-curing conditions, and compressive strength, even with a moderately sized dataset. As a result, TabPFN achieves the highest test-set R2 (0.959) and lower RMSE and MAE values without explicit grid search. The comparison between traditional ML and TabPFN indicates that AutoML approaches, by leveraging prior information and automated parameter adaptation, are better suited for material systems characterized by complex variable interactions and limited experimental data.
3.1.4. Model Prediction Validation
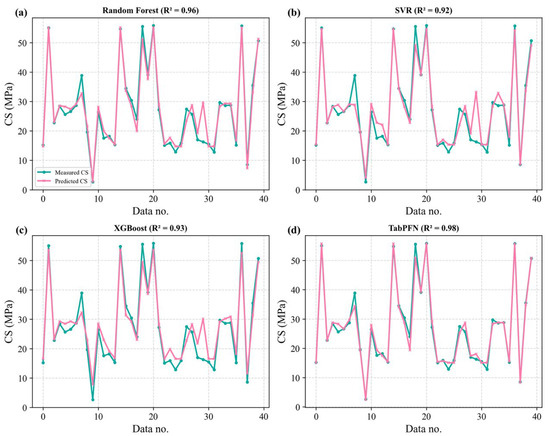
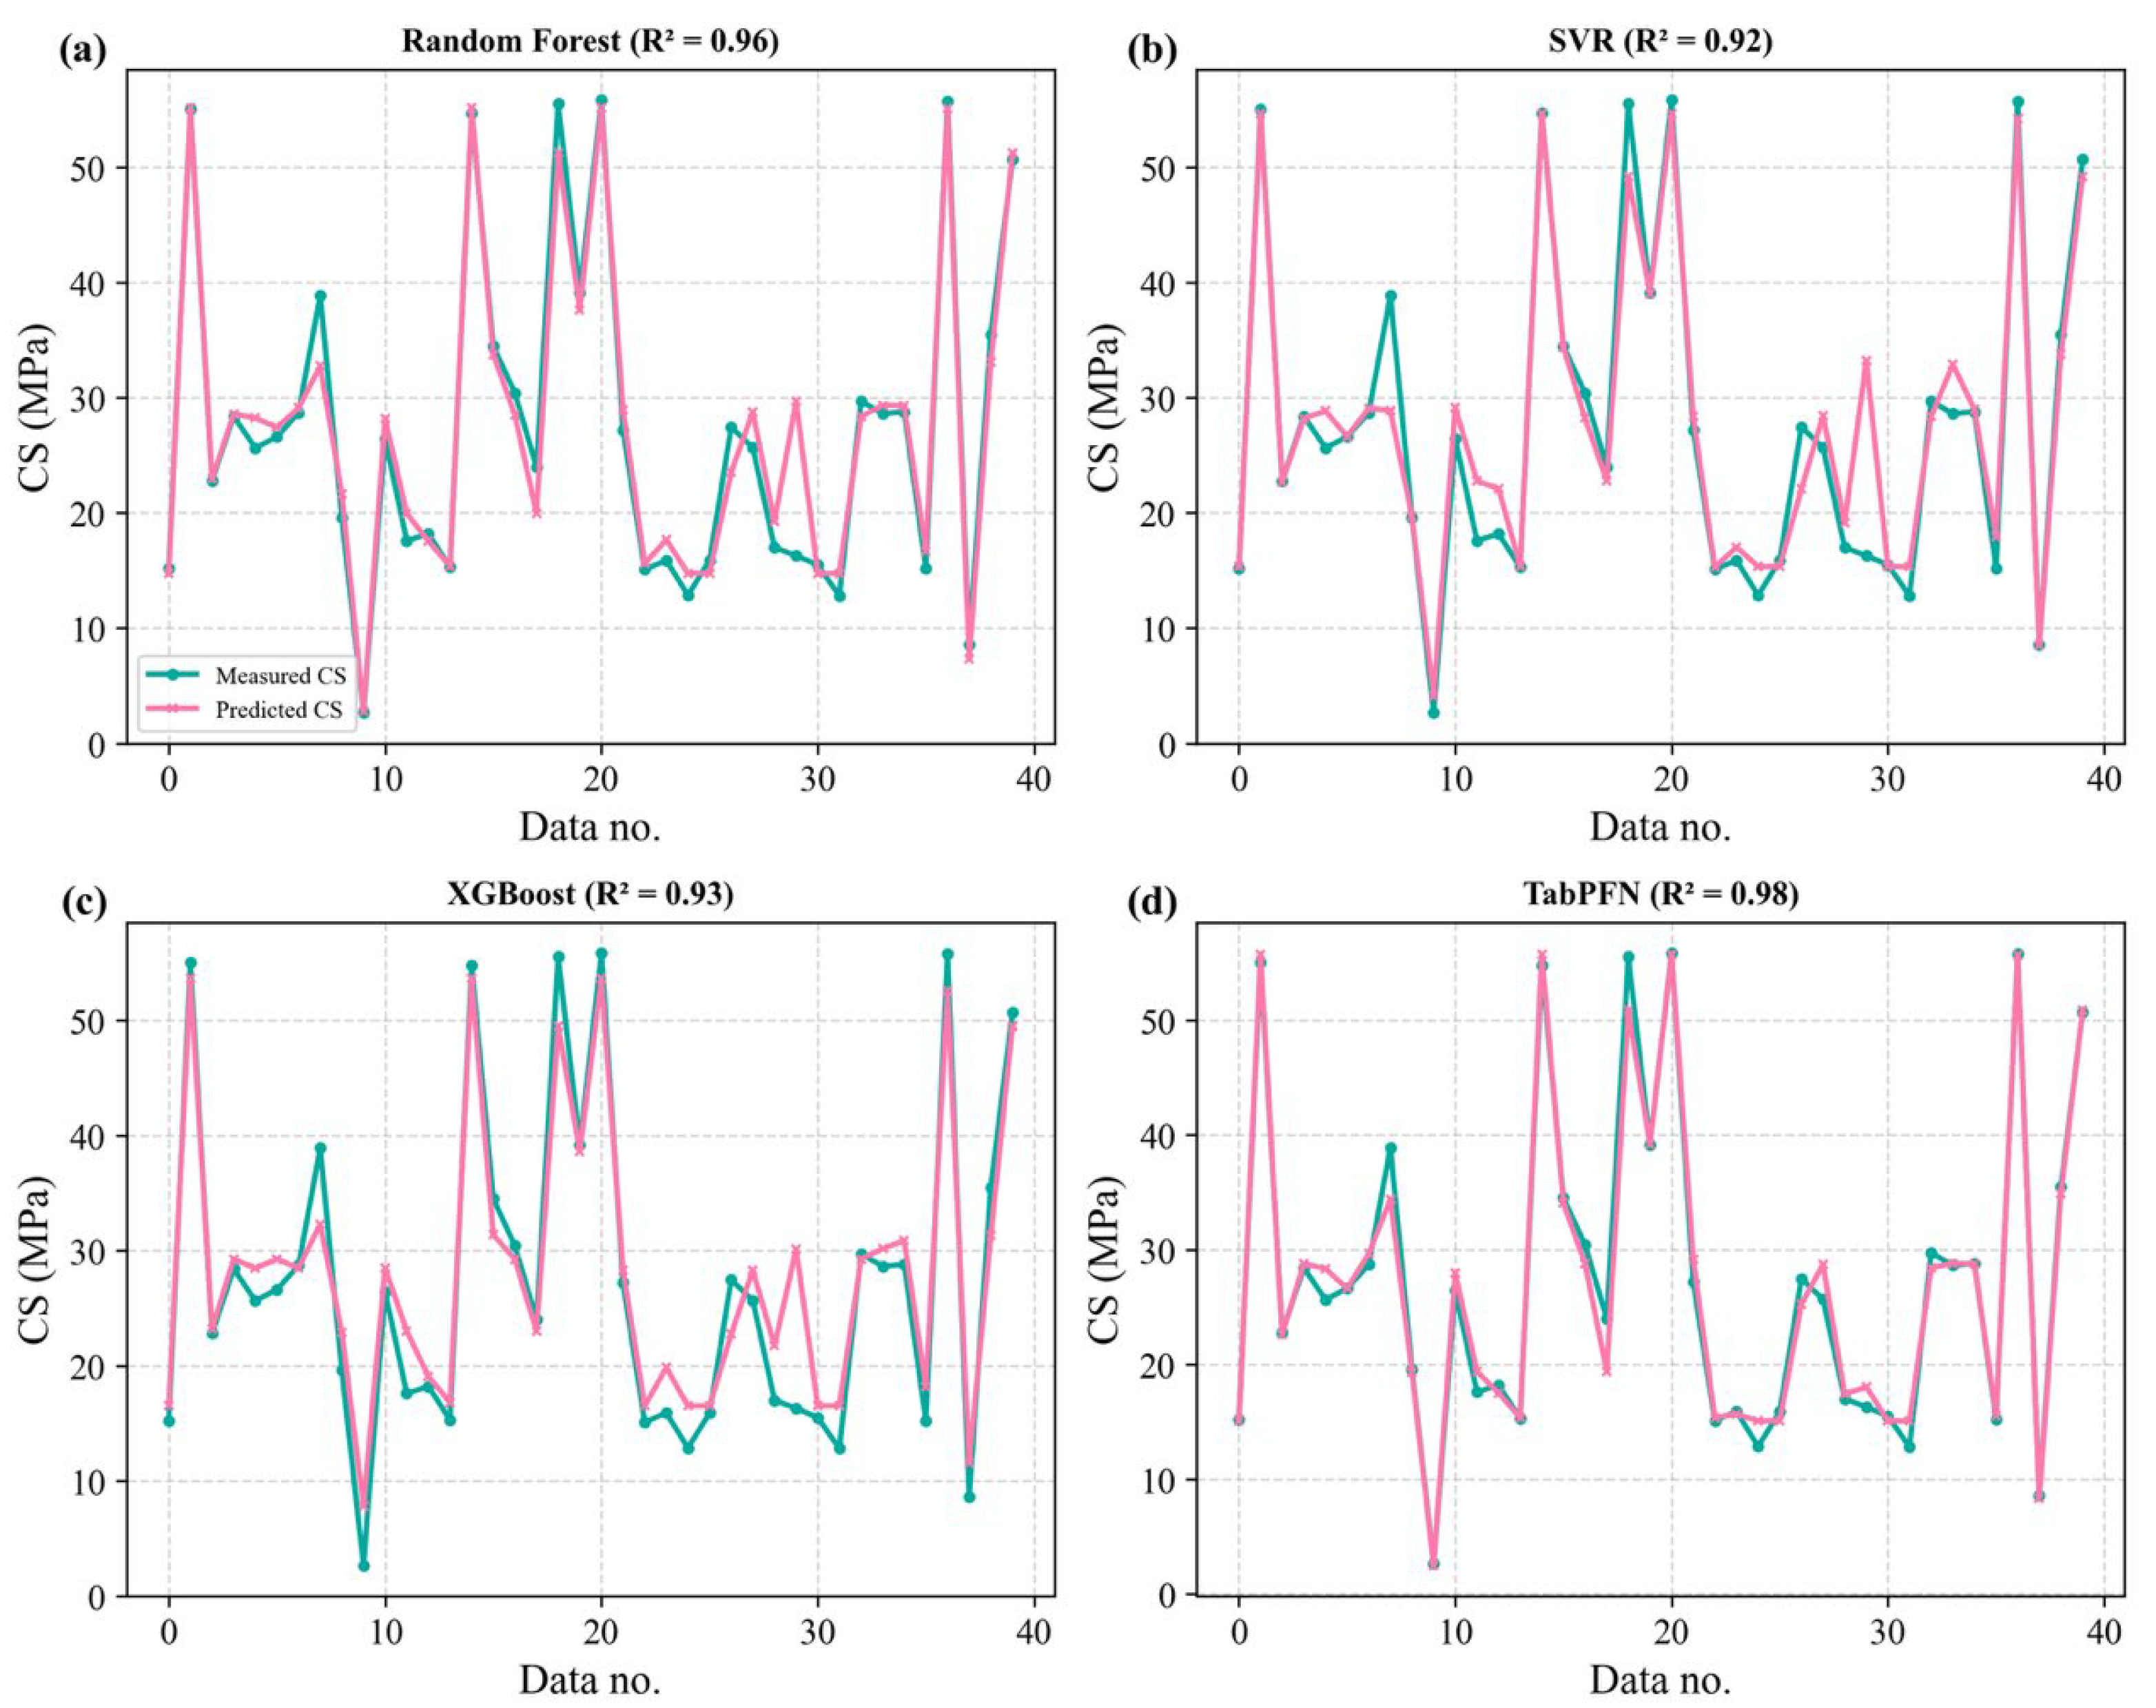
Figure 3 illustrates the point-by-point prediction performance of the four models on the test set. The comparison between the measured and predicted compressive strength values provides a direct visual assessment of each model’s ability to reproduce local variations. Random Forest and XGBoost (Figure 3a,c) capture the major peaks and troughs reasonably well, although deviations appear at several abrupt compressive strength transitions. SVR (Figure 3b) shows more pronounced discrepancies, particularly at higher-strength points where both underestimation and overestimation occur. TabPFN (Figure 3d) exhibits the closest alignment with the measured sequence, with the predicted curve overlapping more consistently across the full range of compressive strength variations, consistent with its higher test-set R2 reported in Table 3. This figure complements the aggregate performance metrics by highlighting the models’ ability to reproduce localized fluctuations and identifying where prediction errors tend to occur.
Figure 3.
Measured vs. predicted compressive strength for four models on the test set. (a) Random Forest; (b) Support Vector Regression; (c) XGBoost; (d) TabPFN.
3.2. Model Uncertainty and Robustness Analysis
3.2.1. Quantitative Model Uncertainty Evaluation
Model-level predictive uncertainty was quantified using a bootstrap-based procedure applied to the test-set predictions. For each model, 1000 bootstrap resamples were drawn and the distribution of the resampled predicted compressive strengths was summarized by the 95% confidence interval (CI), including the lower bound, upper bound, mean, and interval width, as well as the average training time per cross-validation fold (Table 4).
Table 4.
Model uncertainty and robustness metrics derived from bootstrap resampling.
Across the four models, the bootstrap CI means are very similar (≈31–33 MPa), with RF, SVR, and XGBoost all yielding CI_mean ≈ 31.8 MPa, and TabPFN giving CI_mean ≈ 32.5 MPa. This indicates that, at the aggregate level, all models reproduce a comparable central tendency of the predicted compressive strength distribution. The 95% CI bounds span roughly 3–8 MPa at the lower end (CI_lower = 3.379–8.284 MPa) and about 66–70 MPa at the upper end (CI_upper = 66.914–69.914 MPa), reflecting coverage of the full range of strength levels present in the dataset rather than concentration in a narrow prediction band.
The CI widths are of the same order of magnitude for all models, ranging from 58.630 MPa (RF and XGBoost) to 65.205 MPa (SVR) and 66.444 MPa (TabPFN)—showing that none of the models is overly sensitive to bootstrap resampling. The slightly wider interval of TabPFN is consistent with its ability to capture finer local variations rather than reduced robustness, highlighting its stronger responsiveness to the underlying data structure. In terms of computational cost, the average per-fold training time during cross-validation remains well below one second for all models. RF shows the longest training time (0.628 s), followed by XGBoost (0.230 s) and TabPFN (0.123 s), whereas SVR is the fastest (0.022 s). These results confirm that both the conventional machine-learning models and the AutoML-based TabPFN can be trained efficiently, enabling uncertainty-aware model evaluation without meaningful computational overhead
3.2.2. Model Uncertainty Prediction Validation
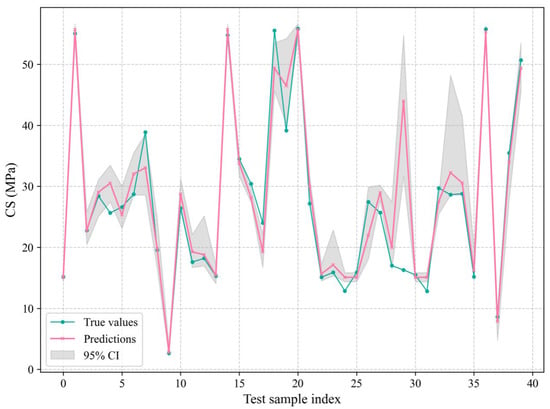
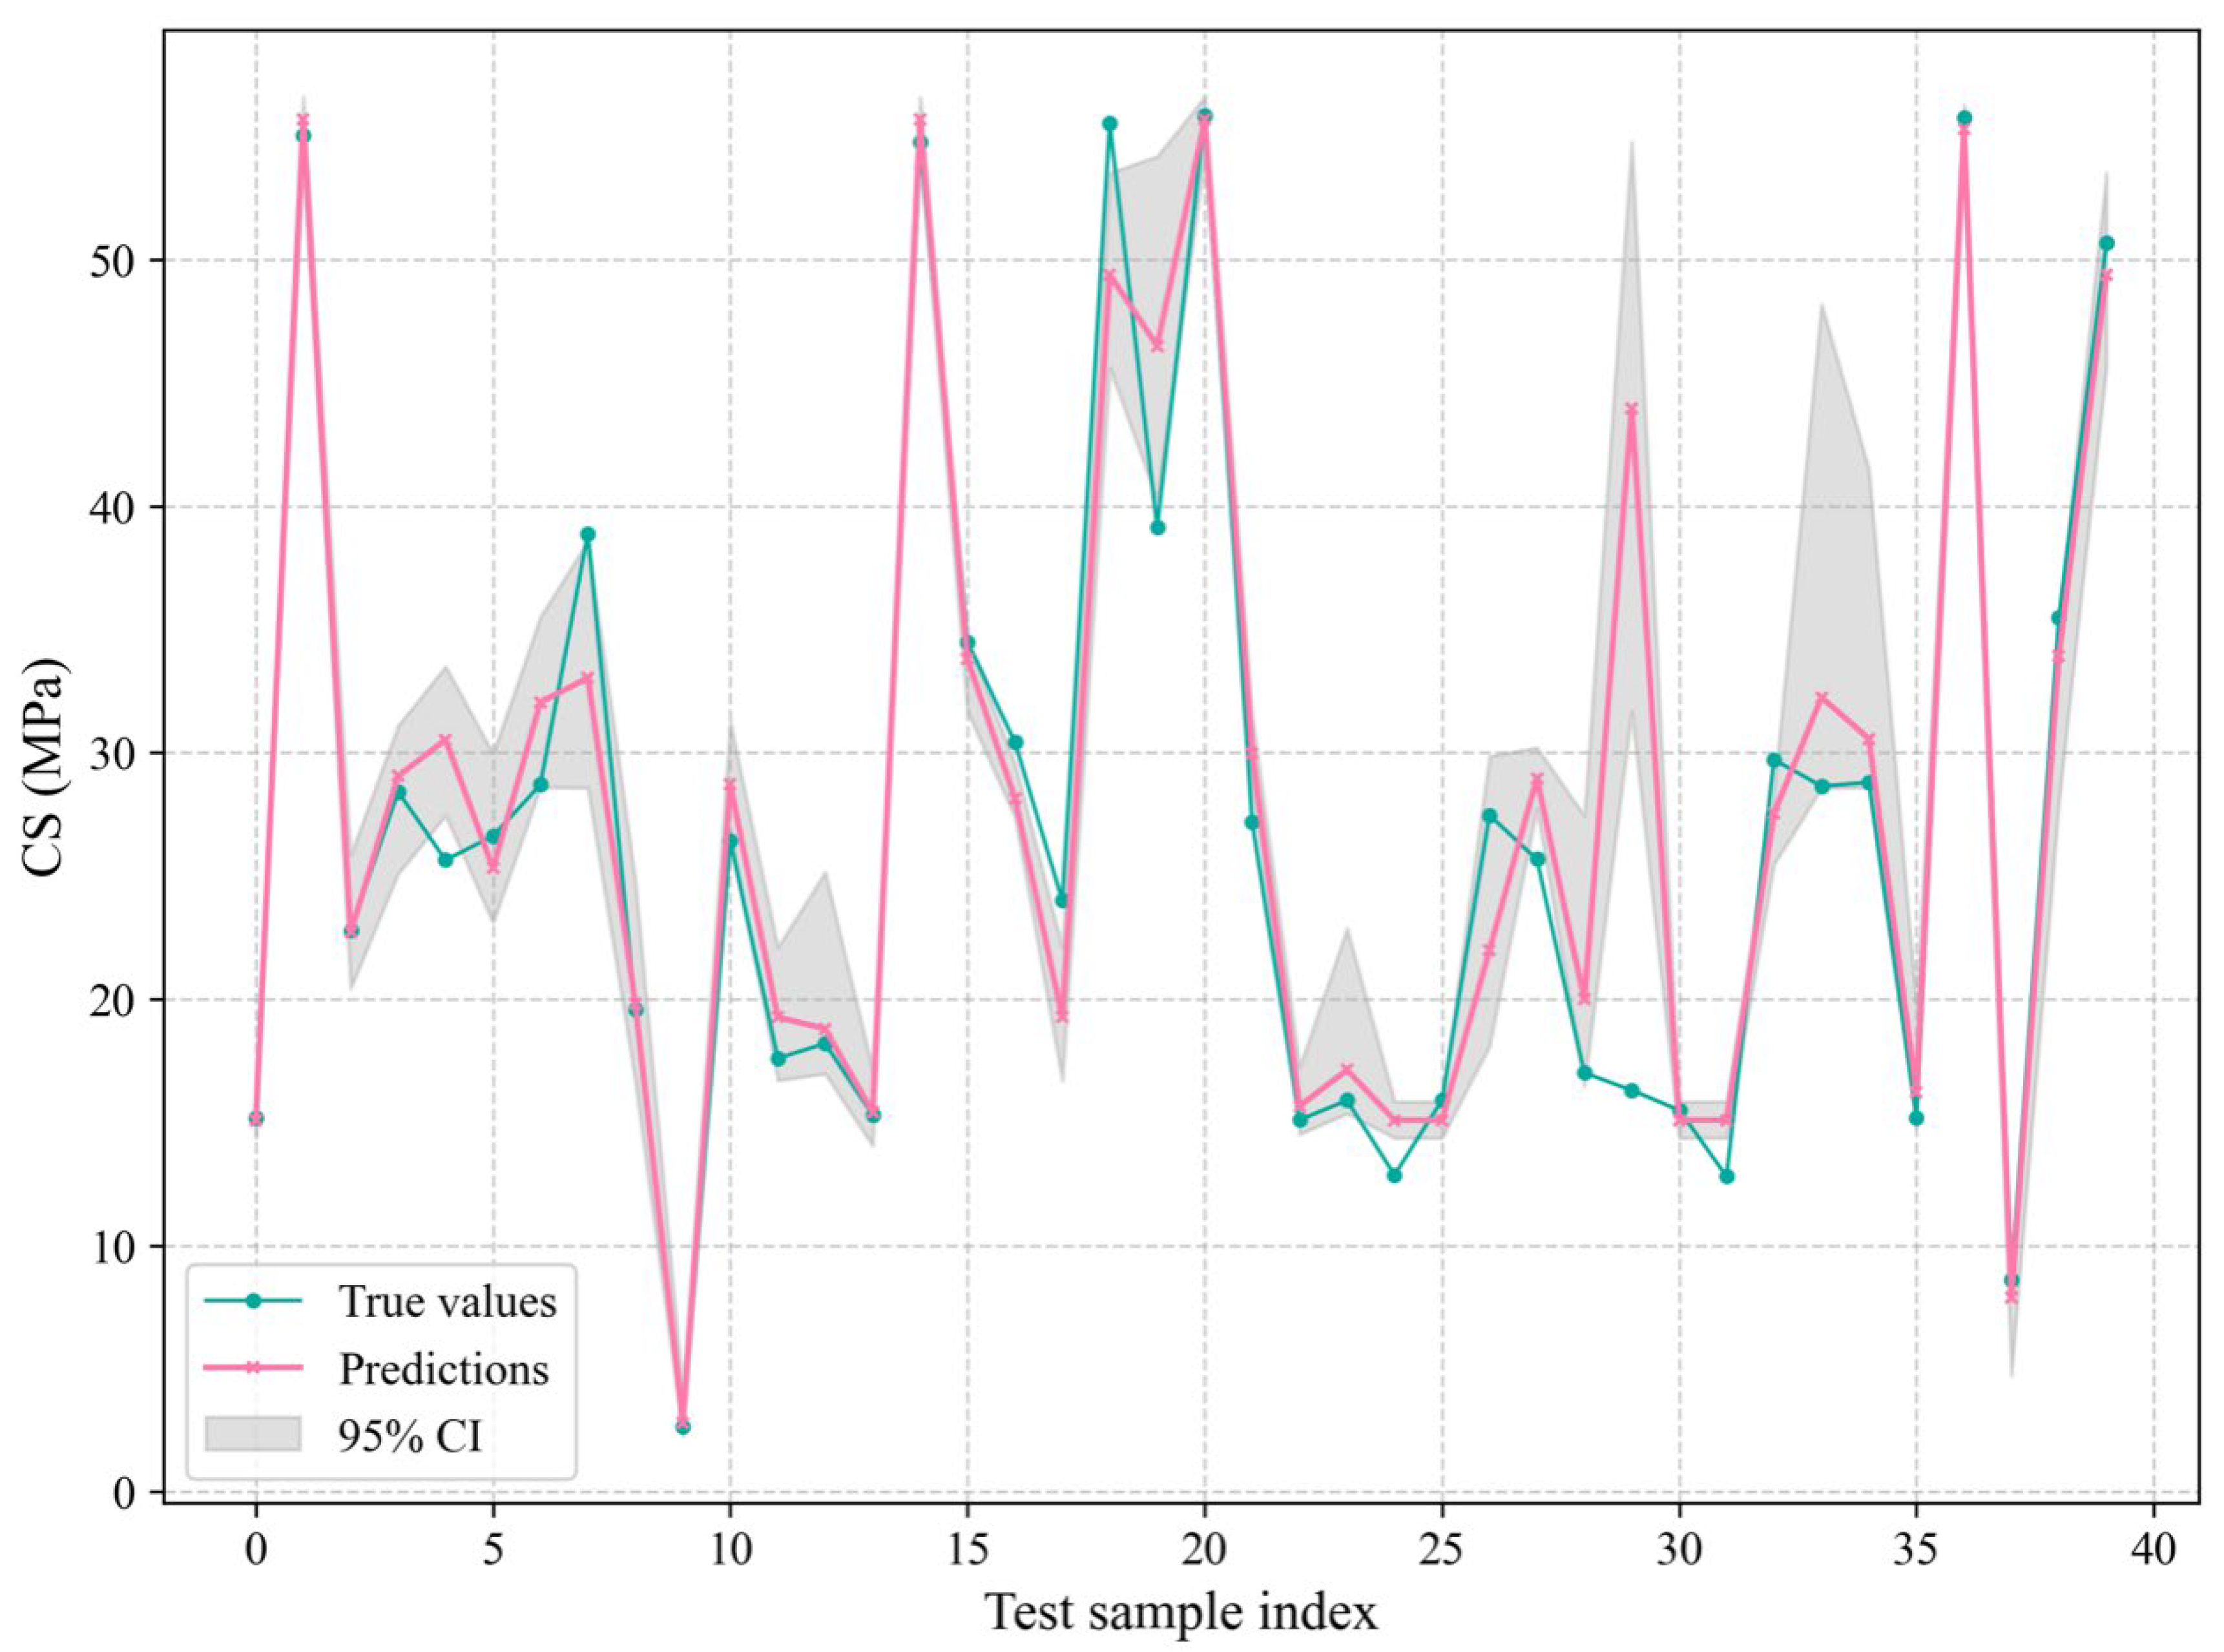
Figure 4 illustrates the pointwise prediction behavior of the best-performing model, TabPFN, along with its bootstrap-derived 95% confidence intervals. The predicted values closely follow the measured compressive strength across the entire test set, including regions with sharp fluctuations (e.g., sample indices 0–10, 15–22, and 30–40). This alignment indicates that the model effectively captures the nonlinear and rapidly varying strength responses associated with mixture compositions and CO2-curing parameters.
Figure 4.
Predicted and measured compressive strength with 95% CI for the TabPFN model.
The gray confidence band varies in width in accordance with local compressive strength dynamics, slightly widening in high-variability regions while remaining narrower in moderate-strength intervals. This pattern demonstrates that model uncertainty is data-dependent yet overall well contained. Importantly, the majority of measured values fall within the 95% CI, reflecting both stable predictive behavior and strong robustness. These results reinforce the suitability of TabPFN as the best-performing predictor for CO2-cured concrete compressive strength under limited datasets and interacting material-curing parameters.
3.3. Explainability of ML Models
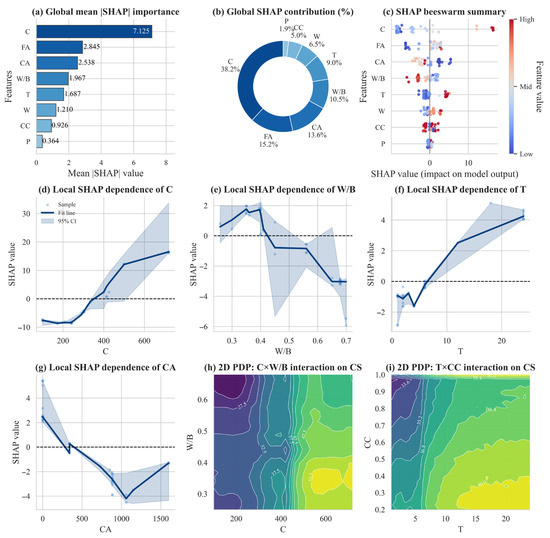
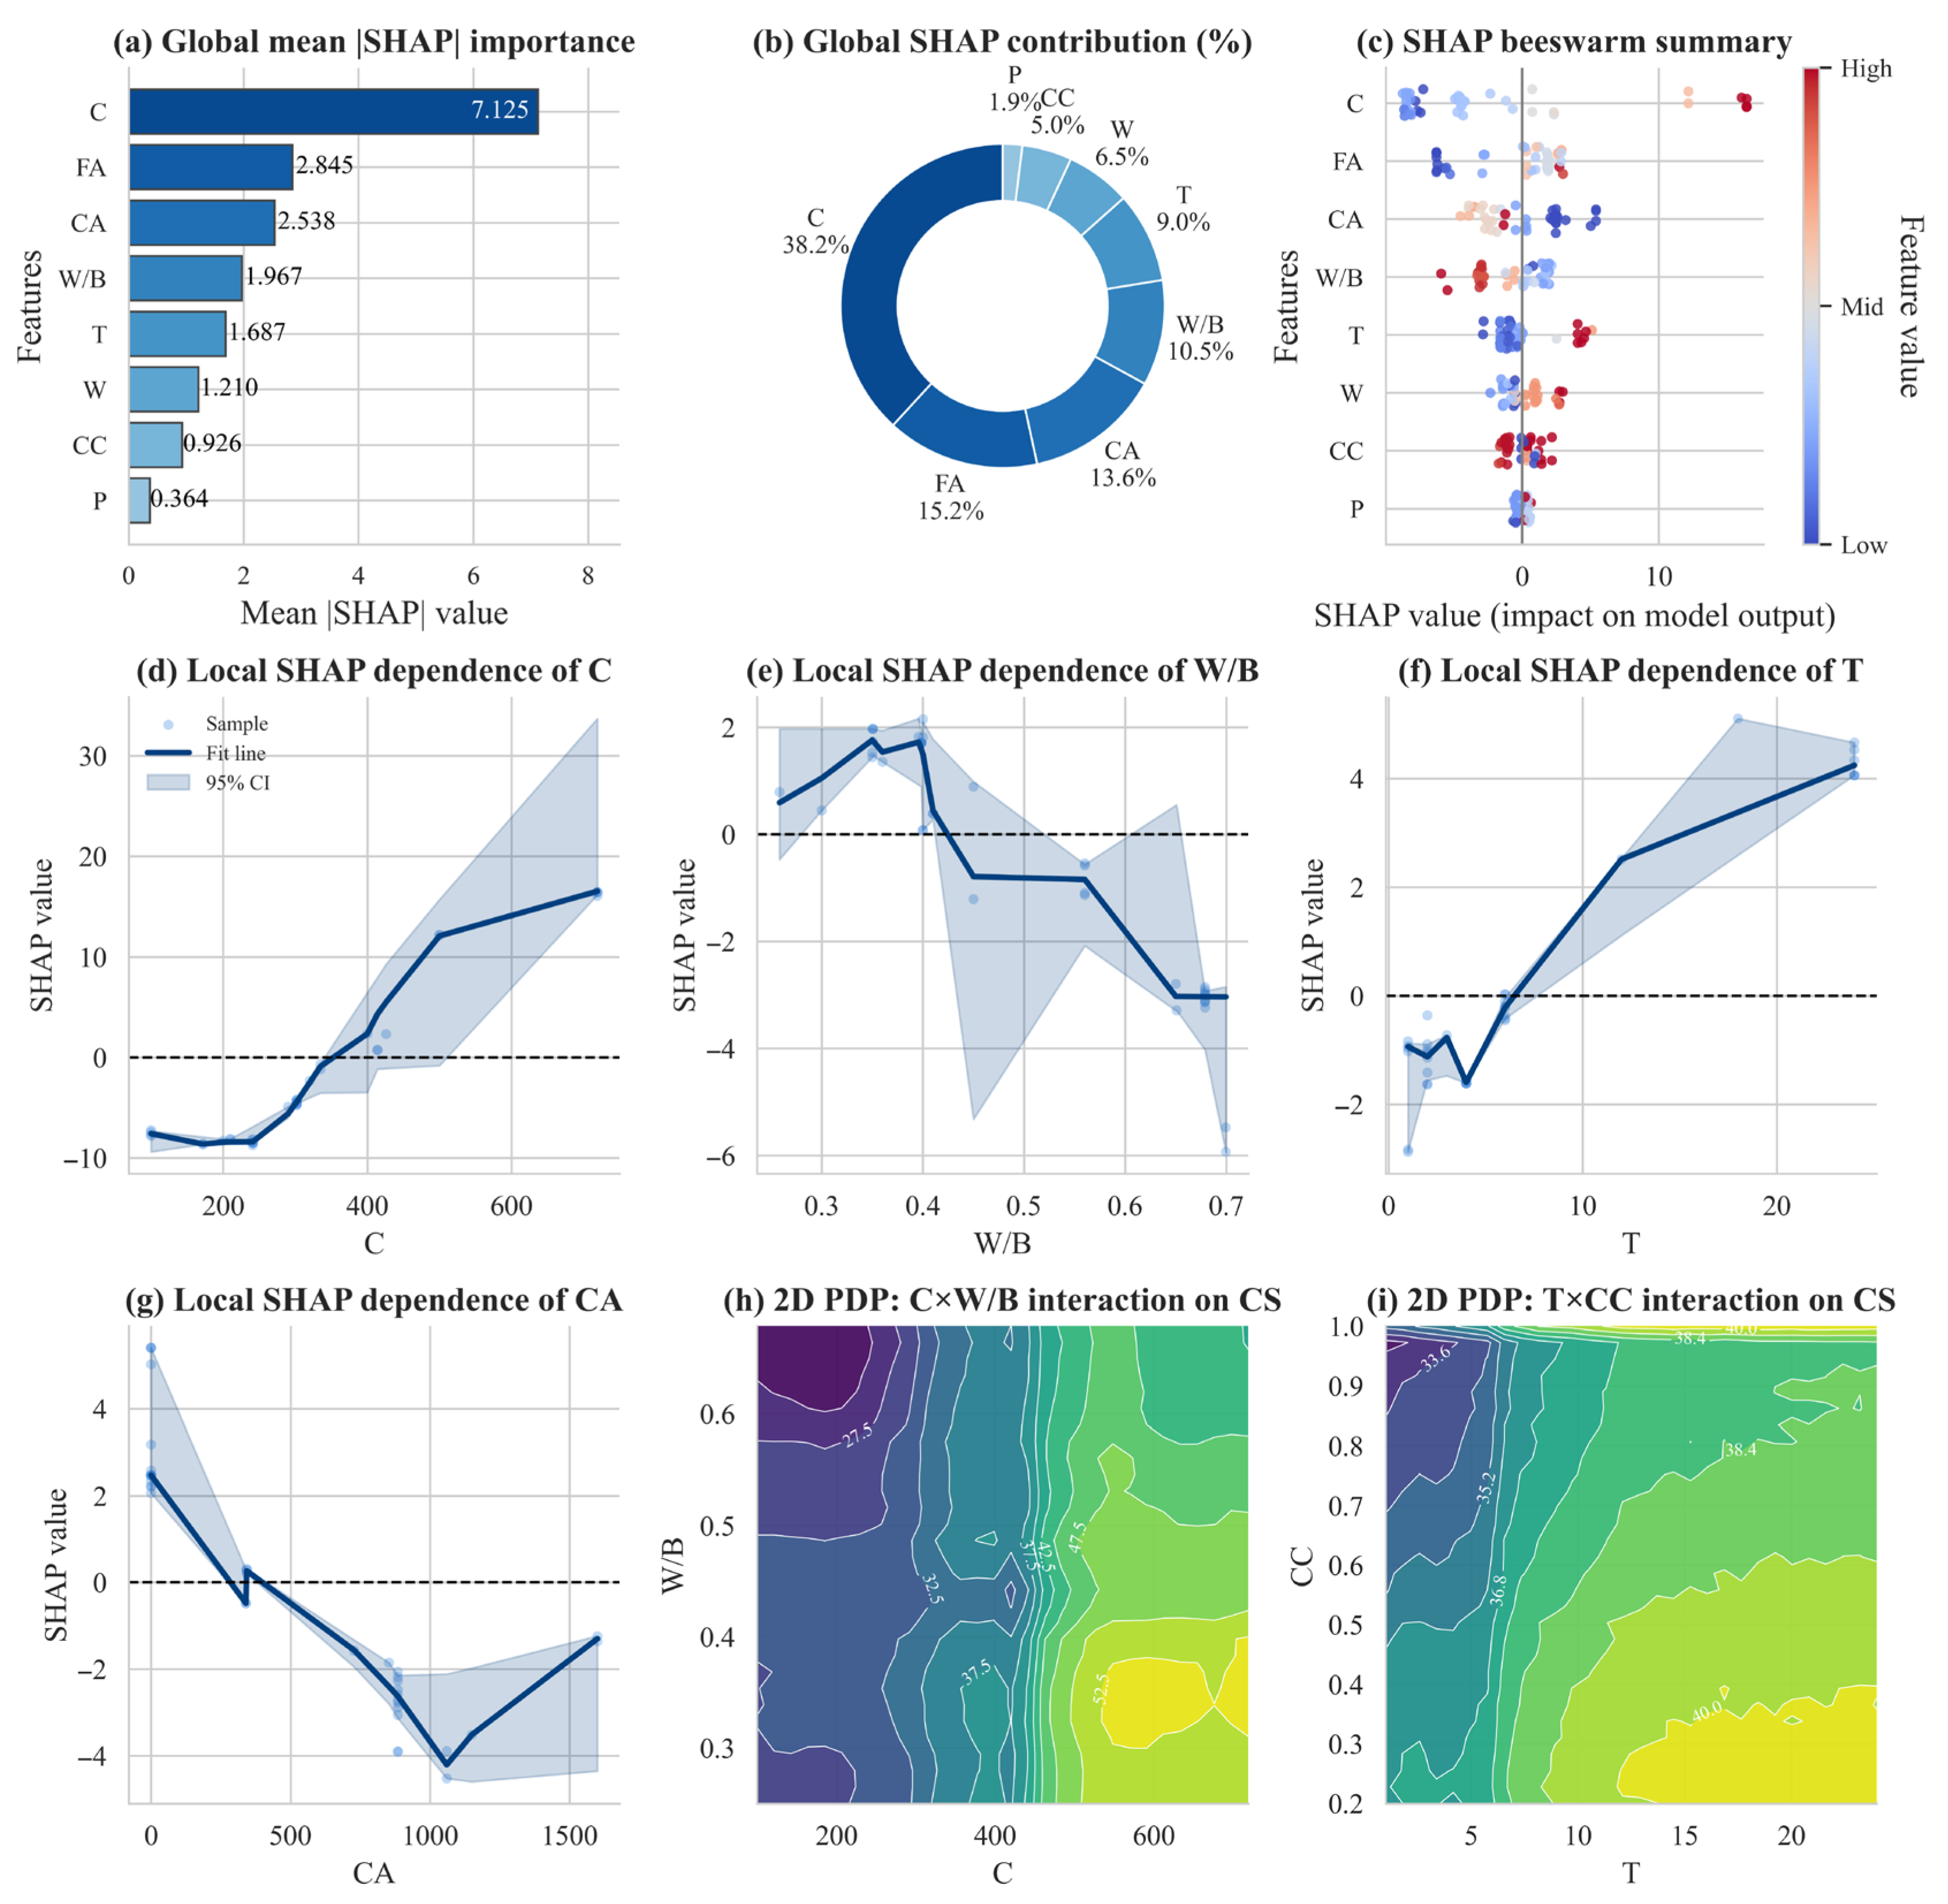
Figure 5a–c shows the global explainability of the Tabular Prior-Data Fitted Network (TabPFN). Cement (C) content exhibits the largest mean absolute SHAP value, contributing approximately 38% of the total importance, which confirms its primary role in governing compressive strength in CO2-cured concrete. Fine aggregate (FA) and coarse aggregate (CA) follow as secondary contributors, reflecting their influence on particle packing, pore connectivity, and the interfacial transition zone (ITZ). Medium-level contributions for the water–binder ratio (W/B) and curing time (T) indicate their dual roles in regulating moisture availability, CO2 transport, and reaction kinetics. By contrast, CO2 concentration (CC) and pressure (P) show smaller contributions, consistent with their narrow ranges in the dataset.
Figure 5.
SHAP-based global feature importance and dependence analysis of the TabPFN model.
These patterns are physically consistent with established CO2 curing mechanisms. The nearly monotonic positive effect of C reflects the increased availability of calcium-bearing hydration products that participate in carbonation and promote CaCO3 precipitation and matrix densification. The peak-shaped W/B pattern captures the competing influences of moisture availability and porosity: low W/B restricts CO2 diffusion, while high W/B increases capillary porosity and reduces carbonate filling efficiency. The approximately linear increase with curing time corresponds to progressive carbonation and pore refinement. The mild inverted-U tendency of CA suggests that excessive aggregate disrupts ITZ continuity and hinders CO2 penetration.
The SHAP dependence plots (Figure 5d–g) reveal both monotonic and non-monotonic effects. Increasing cement (C) content produces a nearly monotonic rise in SHAP values, indicating a positive contribution to compressive strength through the increased availability of carbonatable calcium-bearing phases. In contrast, the water-to-binder ratio (W/B) exhibited a pronounced peak-shaped nonlinear relationship, with an optimal range centered around W/B ≈ 0.40. This behavior reflects a balance between transport and reaction mechanisms: low W/B limits pore connectivity and CO2 diffusion, whereas high W/B increases capillary porosity and matrix dilution, both resulting in negative SHAP contributions.
Curing time (T) shows an approximately linear positive SHAP trend, indicating that prolonged CO2 exposure progressively enhances carbonation degree, pore refinement, and strength development. Coarse aggregate content (CA) presents a mild inverted-U pattern, suggesting that moderate aggregate levels support effective stress transfer and matrix stability. However, excessive aggregate proportions disrupt paste continuity and interfacial uniformity, thereby impeding CO2 penetration into the cementitious phase and reducing carbonation efficiency.
The interaction maps in Figure 5h,i provide additional mechanistic insight into the coupled effects of mixture design and carbonation conditions. The C × W/B contour plot reveals a pronounced synergistic region, where high cement content combined with moderate W/B ratios yields the maximum predicted compressive strengths. This pattern aligns with the fundamental mechanisms of CO2 curing: higher cement content increases the supply of carbonatable hydration products, while a moderate W/B maintains sufficient moisture and pore connectivity for CO2 diffusion and CaCO3 nucleation. Excessively low W/B restricts ionic transport, whereas excessively high W/B increases capillary porosity, both of which reduce carbonation efficiency—hence the clear ridge of optimum synergy visible in the contour map.
The T × CC concentration map shows that the positive influence of CO2 concentration (CC) intensifies at longer curing durations. This trend reflects the time-dependent nature of carbonation: prolonged exposure allows deeper CO2 penetration, progressive CaCO3 precipitation, and continued pore refinement, enabling higher CO2 concentrations to exert greater enhancement effects. At short curing durations, however, carbonation depth is limited, so CO2 concentration plays a smaller role—consistent with the flatter contours observed near early ages.
Together, these interaction structures demonstrate that compressive strength development in CO2-cured concrete is controlled by the cooperative behavior of paste volume, moisture-porosity balance, and carbonation kinetics. The ability of TabPFN to reproduce these physically meaningful interaction patterns confirms that the model is not only statistically accurate but also mechanistically consistent with established CO2 curing theory.
3.4. Feature Interaction Network Analysis
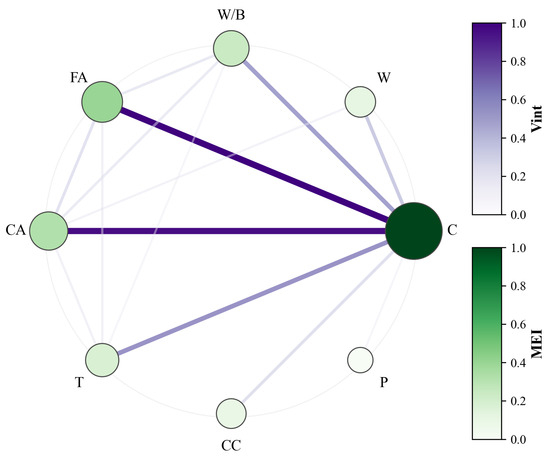
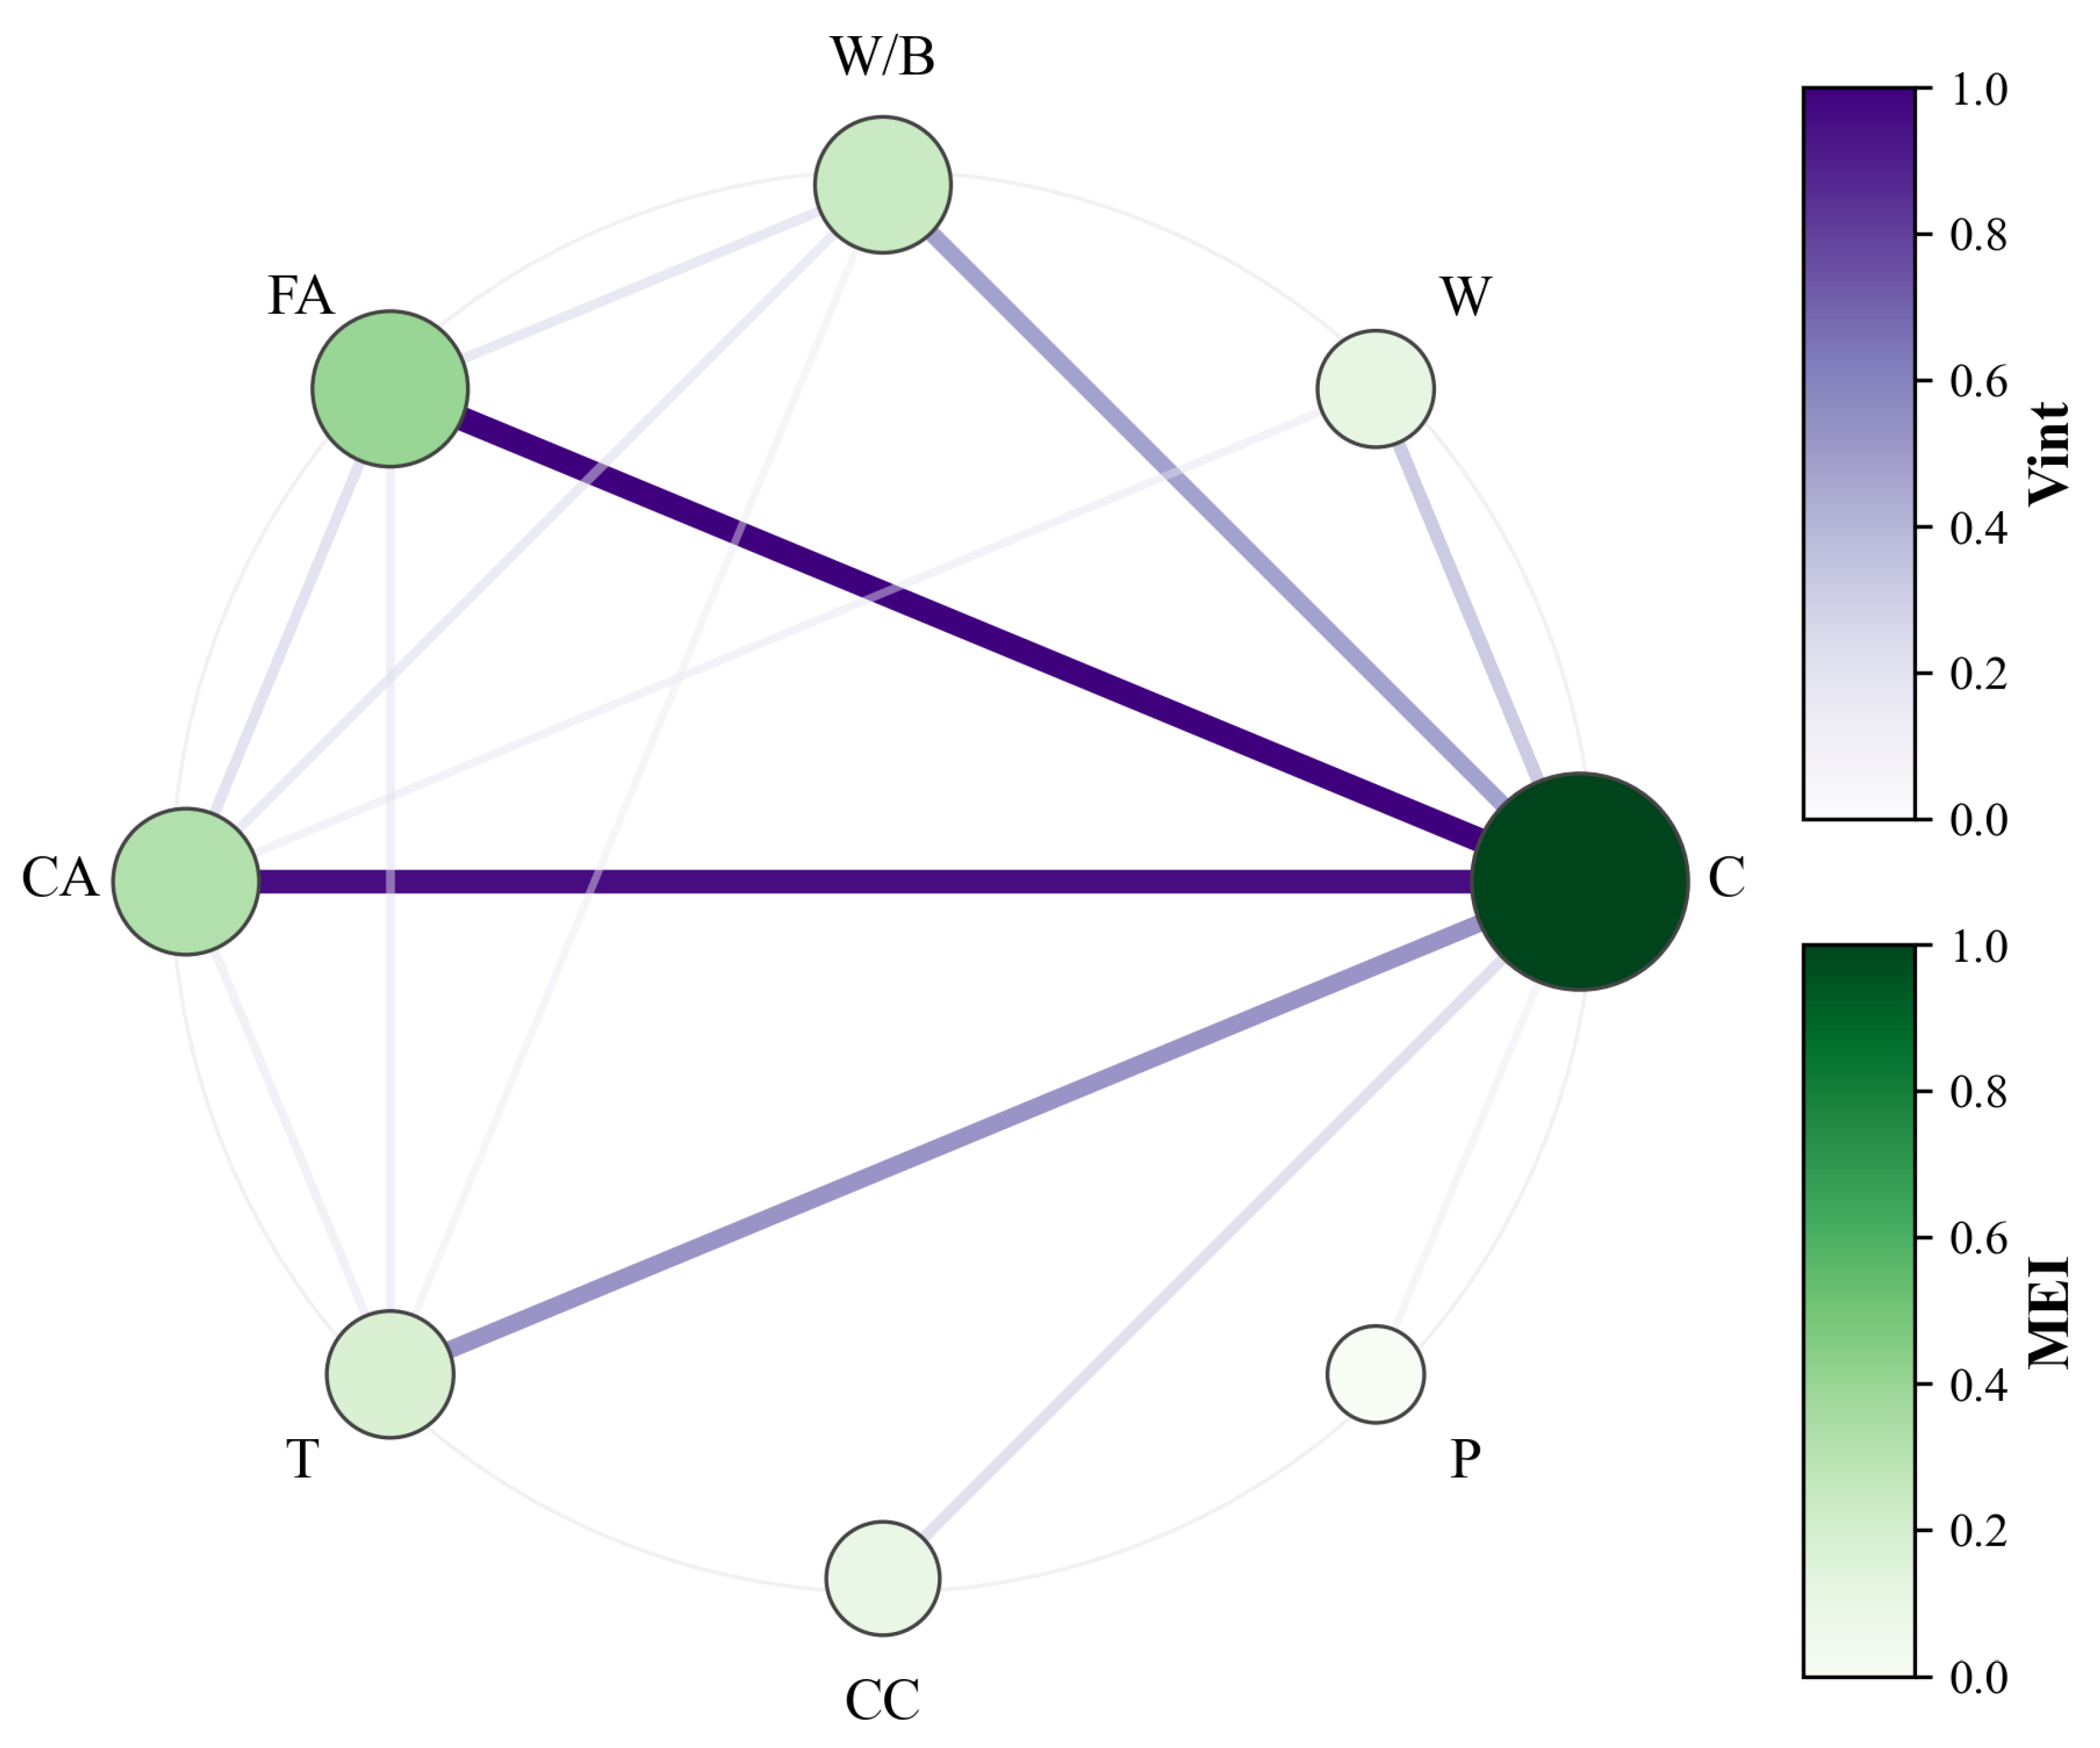
Figure 6 presents the SHAP-based feature interaction network, in which node size represents the marginal effect importance (MEI) and edge thickness indicates the normalized interaction strength (V_int). Cement (C) content emerges as the dominant hub, consistent with its fundamental role in providing carbonatable phases that drive CaCO3 precipitation and matrix densification during CO2 curing.
Figure 6.
SHAP-based feature interaction network for CO2-cured concrete.
The strongest interactions occur between C-FA and C-CA, forming the two thickest edges in the network. These patterns reflect the coupled influence of paste volume and aggregate skeleton structure on carbonation kinetics. Higher cement content supplies more Ca(OH)2 and C-S-H for carbonation, while aggregate gradation governs pore connectivity, CO2 diffusion pathways, and ITZ continuity. Thus, the strong C-aggregate interactions capture the balance between reactive paste availability and the geometrical constraints imposed by particle packing—both of which control carbonation depth and strength formation.
Moderate interactions in the C-W/B and C-T pairs highlight two additional mechanisms: (1) water availability regulates ionic mobility and CO2 transport, and (2) carbonation duration determines the time window for CaCO3 nucleation and pore refinement. These interactions demonstrate that cement carbonation efficiency is jointly governed by moisture-porosity balance and time-dependent diffusion-reaction behavior. By contrast, the limited interactions associated with CO2 concentration (CC) and pressure (P) suggest that, within their narrow experimental ranges, these variables primarily modulate reaction rates rather than reshape the governing multi-scale mechanisms of pore-structure evolution.
Overall, the interaction network indicates that compressive strength development in CO2-cured concrete arises from the cooperative effects among paste volume, aggregate packing, moisture transport, and carbonation kinetics, with cement content functioning as the central regulator in this multivariate system.
4. Conclusions
This study developed an interpretable AI framework for predicting the compressive strength of CO2-cured concrete by combining traditional machine learning models with a prior-driven TabPFN architecture. A unified database of 198 experimental samples was compiled from published studies, enabling robust modeling under small-sample conditions and diverse mixture and curing parameters.
The results demonstrate that TabPFN consistently outperforms conventional learners, providing not only superior predictive accuracy but also locally stable, confidence-aware estimates that enhance the reliability of strength prediction in engineering contexts. The explainability analyses reveal strength-governing mechanisms that align closely with carbonation-curing chemistry. Cement content emerges as the dominant contributor, while water–binder ratio, aggregate proportions, and curing duration introduce characteristic nonlinear and synergistic effects. The interaction network further uncovers coupled pathways—such as C-W/B, C-aggregate pairs, and T-CO2 concentration—that are seldom quantified in the existing literature, offering new insights into multivariable behavior in CO2 curing. These consistent mechanistic patterns indicate that the prior-informed TabPFN model captures physically meaningful relationships beyond statistical correlations.
From an engineering application perspective, the framework translates prediction results directly into a basis for decision-making. When multiple mix design schemes have similar predicted strengths, the scheme with a narrower prediction interval is prioritized to enhance reliability under experimental and process fluctuations. Conversely, a wider prediction interval indicates higher risk, necessitating additional testing or conservative design. Meanwhile, identifying key and interactive parameters through SHAP enables engineers to make targeted adjustments to core variables, reducing trial-and-error costs and integrating uncertainty and interpretability into engineering decision-making.
Overall, the proposed framework integrates high predictive accuracy, explicit uncertainty quantification, and mechanism-consistent explainability, offering a reliable data-driven approach for optimizing mix design and curing strategies in carbon-mineralized concrete. Future work will further expand the dataset to include larger sample sizes, a broader range of supplementary cementitious materials, and more diverse CO2 curing conditions, which is expected to enhance model generalizability and robustness. In addition, future studies will incorporate microstructural descriptors and develop uncertainty-aware multi-objective optimization to support the design of next-generation low-carbon cementitious materials.
Author Contributions
Conceptualization, L.W., Y.W., C.S. and Y.L.; Methodology, L.W. and Y.W.; Software, L.W.; Validation, L.W., B.M., B.Z., S.X., X.C. and X.L.; Formal analysis, L.W. and Y.W.; Investigation, L.W.; Resources, B.Z.; Data curation, L.W., B.Z. and S.X.; Writing—original draft, L.W.; Writing—review & editing, Y.W., C.S. and B.M.; Visualization, L.W., X.C. and X.L.; Supervision, Y.W.; Project administration, Y.W., C.S. and Y.L.; Funding acquisition, Y.W. All authors have read and agreed to the published version of the manuscript.
Funding
The research presented in this article is supported by the Joint Scientific Research Project Funding by the National Natural Science Foundation of China (52361165660) and the Macao Science and Technology Development Fund (FDCT-NSFC 0096/2023/AFJ).
Institutional Review Board Statement
Not applicable.
Informed Consent Statement
Not applicable.
Data Availability Statement
The raw data supporting the conclusions of this article will be made available by the authors on request.
Conflicts of Interest
The authors declare no conflicts of interest.
References
- Hasan, M.; Eiti, H.T.; Hossain, M.S.; Amin, M.B.; Rahaman, M.A.; Oláh, J. Evaluating the Role of Renewable Energy and Government Consumption in Reducing CO2 Emissions: A Dynamic Panel Data Analysis. Sustain. Horiz. 2026, 17, 100164. [Google Scholar] [CrossRef] [Scilit]
- Celik, K.; Meral, C.; Gursel, A.P.; Mehta, P.K.; Horvath, A.; Monteiro, P.J. Mechanical properties, durability, and life-cycle assessment of self-consolidating concrete mixtures made with blended Portland cements containing fly ash and limestone powder. Cem. Concr. Compos. 2015, 56, 59–72. [Google Scholar] [CrossRef] [Scilit]
- Wu, S.; Shao, Z.; Andrew, R.M.; Bing, L.; Wang, J.; Niu, L.; Liu, Z.; Xi, F. Global CO2 Uptake by Cement Materials Accounts 1930–2023. Sci. Data 2024, 11, 1409. [Google Scholar] [CrossRef] [Scilit] [PubMed]
- Min, Q.; Gu, T.; Zhao, D.; Wu, L.; Zhang, G.; Zhang, L.; Liu, L. Synergistic effects of CO2 mixing and CO2 curing on the properties and carbon sequestration capacity of Portland cement paste containing calcium carbide slag. Constr. Build. Mater. 2025, 493, 143254. [Google Scholar] [CrossRef] [Scilit]
- Xian, X.; Zhang, D.; Lin, H.; Shao, Y. Ambient pressure carbonation curing of reinforced concrete for CO2 utilization and corrosion resistance. J. CO2 Util. 2022, 56, 101861. [Google Scholar] [CrossRef] [Scilit]
- Lu, B.; Drissi, S.; Liu, J.; Hu, X.; Song, B.; Shi, C. Effect of temperature on CO2 curing, compressive strength and microstructure of cement paste. Cem. Concr. Res. 2022, 157, 106827. [Google Scholar] [CrossRef] [Scilit]
- Li, S.; Lv, Y.; He, C.; Hou, S.; Ma, W.; Wen, X.; Dan, J.; Mei, J.; Chi, L.; Li, X. Study on properties and CO2 emission of self-pulverizing calcium sulfoaluminate (SPCSA) after carbonization curing. J. Environ. Chem. Eng. 2024, 12, 114472. [Google Scholar] [CrossRef] [Scilit]
- Zhang, D.; Shao, Y. Early age carbonation curing for precast reinforced concretes. Constr. Build. Mater. 2016, 113, 134–143. [Google Scholar] [CrossRef] [Scilit]
- Han, X.; Yan, J.; Huo, Y.; Chen, T. Effect of carbonation curing regime on 3D printed concrete: Compressive strength, CO2 uptake, and characterization. J. Build. Eng. 2024, 98, 111341. [Google Scholar] [CrossRef] [Scilit]
- Liu, Z.; Meng, W. Fundamental understanding of carbonation curing and durability of carbonation-cured cement-based composites: A review. J. CO2 Util. 2021, 44, 101428. [Google Scholar] [CrossRef] [Scilit]
- Ahmad, S.; Assaggaf, R.A.; Maslehuddin, M.; Al-Amoudi, O.S.B.; Adekunle, S.K.; Ali, S.I. Effects of carbonation pressure and duration on strength evolution of concrete subjected to accelerated carbonation curing. Constr. Build. Mater. 2017, 136, 565–573. [Google Scholar] [CrossRef] [Scilit]
- Xuan, D.; Zhan, B.; Poon, C.S. A maturity approach to estimate compressive strength development of CO2-cured concrete blocks. Cem. Concr. Compos. 2018, 85, 153–160. [Google Scholar] [CrossRef] [Scilit]
- Zhang, D.; Ghouleh, Z.; Shao, Y. Review on carbonation curing of cement-based materials. J. CO2 Util. 2017, 21, 119–131. [Google Scholar] [CrossRef] [Scilit]
- Pan, L.; Wang, Y.; Zhang, B.; Guo, X.; Shi, C.; Liu, Y.; Wang, L.; Xue, S.; Chang, X. Intelligent optimization of FAH concrete mix ratio design considering the carbon emission allocation principles of by-products and critical transportation distances. J. Clean. Prod. 2025, 490, 144656. [Google Scholar] [CrossRef] [Scilit]
- Zhang, B.; Pan, L.; Chang, X.; Wang, Y.; Liu, Y.; Jie, Z.; Ma, H.; Shi, C.; Guo, X.; Xue, S.; et al. Sustainable mix design and carbon emission analysis of recycled aggregate concrete based on machine learning and big data methods. J. Clean. Prod. 2025, 489, 144734. [Google Scholar] [CrossRef] [Scilit]
- Ramadan Suleiman, A.; Nehdi, M.L. Modeling self-healing of concrete using hybrid genetic algorithm-artificial neural network. Materials 2017, 10, 135. [Google Scholar] [CrossRef] [Scilit]
- Zhang, Y.; Ren, W.; Chen, Y.; Mi, Y.; Lei, J.; Sun, L. Predicting the compressive strength of high-performance concrete using an interpretable machine learning model. Sci. Rep. 2024, 14, 28346. [Google Scholar] [CrossRef] [Scilit]
- Miao, Q.; Gao, Z.; Zhu, K.; Guo, Z.; Sun, Q.; Zhou, L. Interpretable machine learning model for compressive strength prediction of self-compacting concrete with recycled concrete aggregates and SCMs. J. Build. Eng. 2025, 102, 112965. [Google Scholar] [CrossRef] [Scilit]
- Inqiad, W.B.; Siddique, M.S.; Alarifi, S.S.; Butt, M.J.; Najeh, T.; Gamil, Y. Comparative analysis of various machine learning algorithms to predict 28-day compressive strength of Self-compacting concrete. Heliyon 2023, 9, e22036. [Google Scholar] [CrossRef] [Scilit]
- Ahmad, A.; Ahmad, W.; Aslam, F.; Joyklad, P. Compressive strength prediction of fly ash-based geopolymer concrete via advanced machine learning techniques. Case Stud. Constr. Mater. 2022, 16, e00840. [Google Scholar] [CrossRef] [Scilit]
- Chu, J.; Guo, B.; Zhong, T.; Guan, Q.; Wang, Y.; Niu, D. Explainable machine learning model for predicting compressive strength of CO2-cured concrete. Case Stud. Constr. Mater. 2025, 22, e04589. [Google Scholar] [CrossRef] [Scilit]
- Wang, S.; Xia, P.; Chen, K.; Gong, F.; Wang, H.; Wang, Q.; Zhao, Y.; Jin, W. Prediction and optimization model of sustainable concrete properties using machine learning, deep learning and swarm intelligence: A review. J. Build. Eng. 2023, 80, 108065. [Google Scholar] [CrossRef] [Scilit]
- Han, Q.; Gui, C.; Xu, J.; Lacidogna, G. A generalized method to predict the compressive strength of high-performance concrete by improved random forest algorithm. Constr. Build. Mater. 2019, 226, 734–742. [Google Scholar] [CrossRef] [Scilit]
- Chou, J.S.; Pham, A.D. Smart artificial firefly colony algorithm-based support vector regression for enhanced forecasting in civil engineering. Comput.-Aided Civ. Infrastruct. Eng. 2015, 30, 715–732. [Google Scholar] [CrossRef] [Scilit]
- Amar, M. Comparative use of different AI methods for the prediction of concrete compressive strength. Clean. Mater. 2025, 15, 100299. [Google Scholar] [CrossRef] [Scilit]
- Hilloulin, B.; Tran, V.Q. Using machine learning techniques for predicting autogenous shrinkage of concrete incorporating superabsorbent polymers and supplementary cementitious materials. J. Build. Eng. 2022, 49, 104086. [Google Scholar] [CrossRef] [Scilit]
- El Mahdi Safhi, A.; Dabiri, H.; Soliman, A.; Khayat, K.H. Prediction of self-consolidating concrete properties using XGBoost machine learning algorithm: Part 1-Workability. Constr. Build. Mater. 2023, 408, 133560. [Google Scholar] [CrossRef] [Scilit]
- Sobuz, M.H.R.; Kabbo, M.K.I.; Alahmari, T.S.; Ashraf, J.; Gorgun, E.; Khan, M.M.H. Microstructural behavior and explainable machine learning aided mechanical strength prediction and optimization of recycled glass-based solid waste concrete. Case Stud. Constr. Mater. 2025, 22, e04305. [Google Scholar] [CrossRef] [Scilit]
- Bashir, A.; Gupta, M.; Ghani, S. Machine intelligence models for predicting compressive strength of concrete incorporating fly ash and blast furnace slag. Model. Earth Syst. Environ. 2025, 11, 129. [Google Scholar] [CrossRef] [Scilit]
- Ebrahimzadeh, M.; Mahmoudian, A.; Tajik, N.; Taleshi, M.M.; Ashtari, M.; Shakiba, M.; Bazli, M. Interpretable machine learning models for predicting flexural bond strength between FRP/steel bars and concrete. Structures 2025, 74, 108587. [Google Scholar] [CrossRef] [Scilit]
- Wijesundara, S.; Wijesundara, K.; Bandara, S. Machine learning approach for predicting the compressive strength of ultra-high performance fiber reinforced concrete (UHPFRC). Structures 2025, 75, 108704. [Google Scholar] [CrossRef] [Scilit]
- Shi, M.; Shen, W. Automatic modeling for concrete compressive strength prediction using auto-sklearn. Buildings 2022, 12, 1406. [Google Scholar] [CrossRef] [Scilit]
- Kamarthi, A.; Kaliyamoorthy, B. An interpretable automated optimized machine learning for predicting concrete compressive strength. Expert Syst. Appl. 2025, 235, 129656. [Google Scholar] [CrossRef] [Scilit]
- Hollmann, N.; Müller, S.; Purucker, L.; Krishnakumar, A.; Körfer, M.; Hoo, S.B.; Schirrmeister, R.T.; Hutter, F. Accurate predictions on small data with a tabular foundation model. Nature 2025, 618, 123–128. [Google Scholar] [CrossRef] [Scilit]
- Yang, Y.; Zhou, C.; Peng, J.; Cai, C.; Tang, H.; Zhang, J. Hybrid model-driven and data-driven method for predicting concrete creep considering uncertainty quantification. Front. Struct. Civ. Eng. 2024, 18, 1524–1539. [Google Scholar] [CrossRef] [Scilit]
- Breiman, L. Random forests. Mach. Learn. 2001, 45, 5–32. [Google Scholar] [CrossRef] [Scilit]
- Awad, M.; Khanna, R. Efficient Learning Machines: Theories, Concepts, and Applications for Engineers and System Designers; Springer: Berlin/Heidelberg, Germany, 2015. [Google Scholar] [CrossRef] [Scilit]
- Li, Q.; Yang, B.; Li, Y.; Deng, N.; Jing, L. Constructing support vector machine ensemble with segmentation for imbalanced datasets. Neural Comput. Appl. 2013, 22, 249–256. [Google Scholar] [CrossRef] [Scilit]
- Chen, T.; Guestrin, C. XGBoost: A Scalable Tree Boosting System. In Proceedings of the 22nd ACM SIGKDD International Conference on Knowledge Discovery and Data Mining (KDD 2016), San Francisco, CA, USA, 13–17 August 2016; ACM: New York, NY, USA, 2016; pp. 785–794. [Google Scholar] [CrossRef] [Scilit]
- Khanmohammadi, S.; Cruz, M.; Perrakis, D.; Alexander, M.E.; Arashpour, M. Using AutoML and generative AI to predict the type of wildfire propagation in Canadian conifer forests. Ecol. Inform. 2024, 82, 102711. [Google Scholar] [CrossRef] [Scilit]
- Moreno, S.R.; Seman, L.O.; Stefenon, S.F.; Coelho, L.d.S.; Mariani, V.C. Enhancing wind speed forecasting through synergy of machine learning, singular spectral analysis, and variational mode decomposition. Energy 2024, 292, 130493. [Google Scholar] [CrossRef] [Scilit]
- Yu, B.; Li, J.; Liu, C.; Sun, B. A novel short-term electrical load forecasting framework with intelligent feature engineering. Appl. Energy 2022, 327, 120089. [Google Scholar] [CrossRef] [Scilit]
- De Lima Nogueira, S.C.; Och, S.H.; Moura, L.M.; Domingues, E.; Coelho, L.; Mariani, V.C. Prediction of the NOx and CO2 emissions from an experimental dual fuel engine using optimized random forest combined with feature engineering. Energy 2023, 280, 128066. [Google Scholar] [CrossRef] [Scilit]
- Bergstra, J.; Bengio, Y. Random search for hyper-parameter optimization. J. Mach. Learn. Res. 2012, 13, 281–305. [Google Scholar]
- Tibshirani, R.J.; Efron, B. An Introduction to the Bootstrap; Chapman & Hall/CRC: New York, NY, USA, 1993. [Google Scholar] [CrossRef] [Scilit]
- Lundberg, S.M.; Lee, S.-I. A Unified Approach to Interpreting Model Predictions. In Advances in Neural Information Processing Systems 30 (NeurIPS 2017); Curran Associates, Inc.: Red Hook, NY, USA, 2017; pp. 4765–4774. [Google Scholar]
- Lundberg, S.M.; Erion, G.G.; Lee, S.I. Consistent Individualized Feature Attribution for Tree Ensembles. arXiv 2018, arXiv:1802.03888. [Google Scholar]
- Molnar, C.; Freiesleben, T.; König, G.; Herbinger, J.; Reisinger, T.; Casalicchio, G.; Wright, M.; Bischl, B. Relating the Partial Dependence Plot and Permutation Feature Importance to the Data Generating Process. In Proceedings of the World Conference on Explainable Artificial Intelligence, Lisbon, Portugal, 26–28 July 2023; Springer Nature Switzerland AG: Cham, Switzerland, 2023; pp. 456–479. Available online: https://link.springer.com/chapter/10.1007/978-3-031-44064-9_24 (accessed on 15 June 2025).
- Goldstein, A.; Kapelner, A.; Bleich, J.; Pitkin, E. Peeking inside the black box: Visualizing statistical learning with plots of individual conditional expectation. J. Comput. Graph. Statist. 2015, 24, 44–65. [Google Scholar] [CrossRef] [Scilit]
- Shao, Y.; Rostami, V.; Jia, Y.; Hu, L. Feasibility Study on Replacing Steam by Carbon Dioxide for Concrete Masonry Units Curing. In Masonry 2014; ASTM International: West Conshohocken, PA, USA, 2014; pp. 1–17. [Google Scholar] [CrossRef] [Scilit]
- Li, Z.; He, Z.; Chen, X. The Performance of Carbonation-Cured Concrete. Materials 2019, 12, 3729. [Google Scholar] [CrossRef] [Scilit]
- Chen, T.; Gao, X. Use of carbonation curing to improve mechanical strength and durability of pervious concrete. ACS Sustain. Chem. Eng. 2020, 8, 3872–3884. [Google Scholar] [CrossRef] [Scilit]
- Sharma, D.; Goyal, S. Effect of accelerated carbonation curing on near surface properties of concrete. Eur. J. Environ. Civ. Eng. 2022, 26, 1300–1321. [Google Scholar] [CrossRef] [Scilit]
- Wang, Y.C.; Lee, M.G.; Wang, W.C.; Kan, Y.C.; Kao, S.H.; Chang, H.W. CO2 curing on the mechanical properties of Portland cement concrete. Buildings 2022, 12, 817. [Google Scholar] [CrossRef] [Scilit]
- Zhang, S.; Chen, W.; Xu, J.; Xie, T. Use of interpretable machine learning approaches for quantificationally understanding the performance of steel fiber-reinforced recycled aggregate concrete: From the perspective of compressive strength and splitting tensile strength. Eng. Appl. Artif. Intell. 2024, 137, 109170. [Google Scholar] [CrossRef] [Scilit]

Disclaimer/Publisher’s Note: The statements, opinions and data contained in all publications are solely those of the individual author(s) and contributor(s) and not of MDPI and/or the editor(s). MDPI and/or the editor(s) disclaim responsibility for any injury to people or property resulting from any ideas, methods, instructions or products referred to in the content. |
© 2025 by the authors. Licensee MDPI, Basel, Switzerland. This article is an open access article distributed under the terms and conditions of the Creative Commons Attribution (CC BY) license.