


Abstract
Grouted corrugated duct connections offer advantages of simplicity and cost-effectiveness over alternative connection methods. Seismic damage investigations have revealed that severe out-of-plane damage can occur in shear walls, a vulnerability that is markedly exacerbated when single-row connection configurations are used. To evaluate their out-of-plane seismic performance, low-cycle reversed loading tests were conducted on six full-scale specimens comprising four precast walls (with vertical bar layout and axial load ratio varied as single-/double-row and 0/0.12) and two cast-in-place reference walls. The results indicate that all specimens failed in flexure, with precast walls exhibiting stiffness degradation patterns similar to their cast-in-place counterparts. Under an axial load ratio of 0.12, both wall types demonstrated hysteretic behavior with significant pinching. Although the bearing capacity of precast walls was reduced by up to 14% compared to cast-in-place walls, their ductility was markedly enhanced: displacement ductility coefficients reached 3.92 (double-row) and 5.37 (single-row), considerably exceeding the value of 2.73 for the cast-in-place wall. Under zero axial load, no strength degradation was observed at the test termination. The single-row connected specimen exhibited pronounced rocking behavior, with rocking displacement accounting for 49% of the total displacement. This resulted in severely pinched hysteresis loops and a cumulative energy dissipation capacity of less than 40% of that of the corresponding cast-in-place specimen. These findings necessitate the implementation of structural enhancement measures for single-row connections under low axial load ratios.
1. Introduction
Precast shear wall structures are widely used as primary load-bearing systems, particularly in seismic regions [1,2], due to advantages such as rapid construction, high component quality, and reduced on-site labor. The seismic performance of these structures is primarily governed by their vertical connections, which govern the tensile, shear, and flexural capacities of the walls. Therefore, understanding the behavior of vertical connections is critically important for engineering practice.
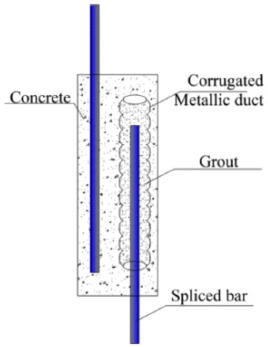
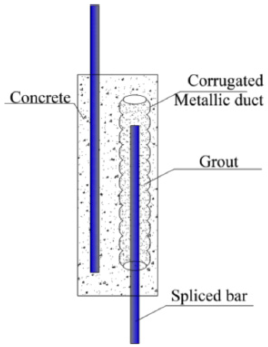
Precast shear walls primarily utilize three types of vertical connections: grouted sleeve splices, bolted connections, and grouted lap splices. Among these, grouted sleeve connections are widely adopted in practice due to their reliable force transfer and stable performance, despite requiring relatively complex grouting procedures and skilled execution. Bolted connections offer advantages in ease of installation and quality control but see limited application owing to higher costs. Grouted lap splices, another prevalent solution, are formed by inserting lapped reinforcement into pre-embedded ducts in the precast panel and injecting cement-based grout to create a continuous bar connection [3,4]. This method, as shown in Figure 1, is widely adopted in practice due to its simplicity, dependable performance, and cost efficiency.
Figure 1.
Configuration of Grouted Corrugated Metallic Duct Lap Splice.
The grouted corrugated duct splice represents the most prevalent form of grouted lap splice in engineering practice. Current research on its seismic performance has primarily focused on in-plane behavior. Guo, Z. et al. [5,6] conducted seismic performance tests on full-scale precast shear walls using grouted corrugated duct splices. Their results demonstrated that when upper and lower vertical reinforcements are connected with one-to-one aligned corrugated duct splices, the in-plane seismic performance of precast walls is equivalent to cast-in-place walls, but this comprehensive one-to-one connection method requires numerous splices, leading to construction complexity and higher costs. To enhance construction efficiency and reduce costs, Xue, W. et al. [7,8,9] proposed an optimized corrugated duct configuration by designing shear walls with single-row, double-row, and hybrid connection layouts. Low-cycle reversed loading test results demonstrated that the modified precast walls achieved equivalent seismic performance, confirming the high reliability and suitability of grouted corrugated duct connections for in-plane seismic performance.
However, under seismic action, shear walls are subjected not only to in-plane loads but may also experience damage due to out-of-plane forces. Through systematic analysis of damage patterns from eight major earthquakes worldwide, Xu, P. et al. [10] observed that although failure modes in shear walls are predominantly in-plane, significant out-of-plane damage has been identified in certain walls during specific seismic events. Sevket M.S. et al. [11]. assessed the typical failure modes of precast industrial buildings after the Pazarcık and Elbistan earthquakes, and their findings highlight the importance of the out-of-plane performance of shear walls.
Extensive research has been conducted on the out-of-plane performance of cast-in-place concrete shear walls. Numerous studies [12,13,14,15] have demonstrated that severe cracking and crushing in reinforced concrete shear walls can lead to out-of-plane failure triggered by uneven deformation. Such failures tend to occur suddenly and can significantly compromise the wall’s in-plane load-carrying capacity, thereby posing a threat to the overall seismic safety of the structure. Through low-cycle reversed loading tests and mechanical analysis on typical cast-in-place concrete shear walls, Cheng Y et al. [16] demonstrated a marked disparity between their in-plane and out-of-plane seismic performance. The study quantified the out-of-plane bearing capacity at only 1/20 to 1/15 of its in-plane counterpart. Furthermore, wall thickness and aspect ratio were established as the primary parameters governing the seismic response in both directions. Furthermore, Arsalan N et al. [17] demonstrated that walls with low axial compression ratios and enhanced ductility detailing exhibit superior out-of-plane seismic performance.
Vertical connections in precast concrete shear walls are a critical factor influencing their seismic performance. Hassan T.K., Frankl B., and colleagues [18,19] have extensively investigated the out-of-plane flexural behavior of composite shear walls under lateral loading, with their focus primarily on the overall structural performance and thermal insulation properties of such walls. Gu Q et al. [20] conducted experimental research on the out-of-plane mechanical performance of single-side composite shear walls with horizontal joints, finding that an increase in the axial compression ratio significantly enhanced the out-of-plane bearing capacity of these walls while markedly reducing their ductility. Fu Q et al. [21], by reasonably simplifying support boundary conditions and performing theoretical analysis, established a verification method for assessing the out-of-plane stability of assembled monolithic shear walls with unconnected vertical distributed reinforcement under different support conditions. Studies Xue W et al. [22] and Cao Z et al. [23] revealed that when single-row connection reinforcement is arranged along the central axis of the wall section, the neutral axis shifts toward the compression side under out-of-plane horizontal action, which adversely affects the out-of-plane bearing capacity of the precast wall. Xue W et al. [24] further conducted seismic performance tests on precast shear walls with grouted sleeve connections, finding that the axial compression ratio significantly influences the out-of-plane deformation capacity, and that specimens with double-row connections exhibited superior energy dissipation capacity compared to those with single-row connections. However, systematic research on the out-of-plane seismic performance of the grouted corrugated duct lap splice, a typical connection type, remains limited. Moreover, current design codes and standards, both domestic and international, provide only general provisions for the design and detailing of such connections, lacking specific guidance for out-of-plane loading scenarios [3,4,25]. To address this gap, low-cycle reversed loading tests were conducted on six full-scale precast shear wall specimens with grouted corrugated duct connections. The study aims to systematically evaluate their seismic performance and provide experimental data and theoretical support to inform future engineering applications.
2. Experimental Program
2.1. Specimen Design
This study designed four precast concrete shear wall specimens with grouted corrugated duct connections (GCD), focusing on the critical boundary element region. Specimens PSW1 and PSW3 featured double-row connections, while PSW2 and PSW4 featured single-row connections. These were tested alongside two cast-in-place specimens (RW1, RW2) from reference [24] for comparison. All specimens had identical dimensions, concrete grade was C35, reinforcement was HRB400, and embedded steel plates were Q235. The test matrix comprised two groups, designated as Group 1 and Group 2 with ACRs of 0.12 and 0, respectively. The corresponding parameters are provided in Table 1.
Table 1.
Details of Shear Wall Specimens.
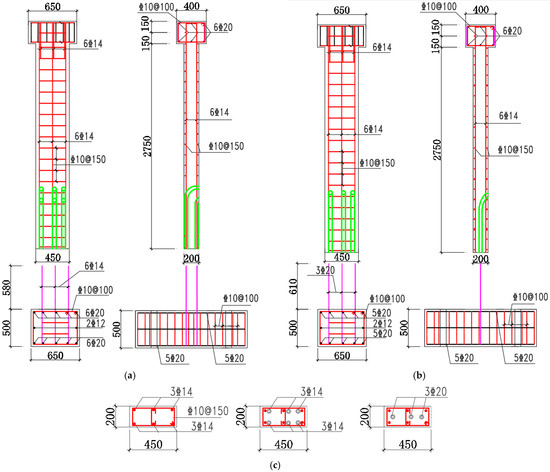
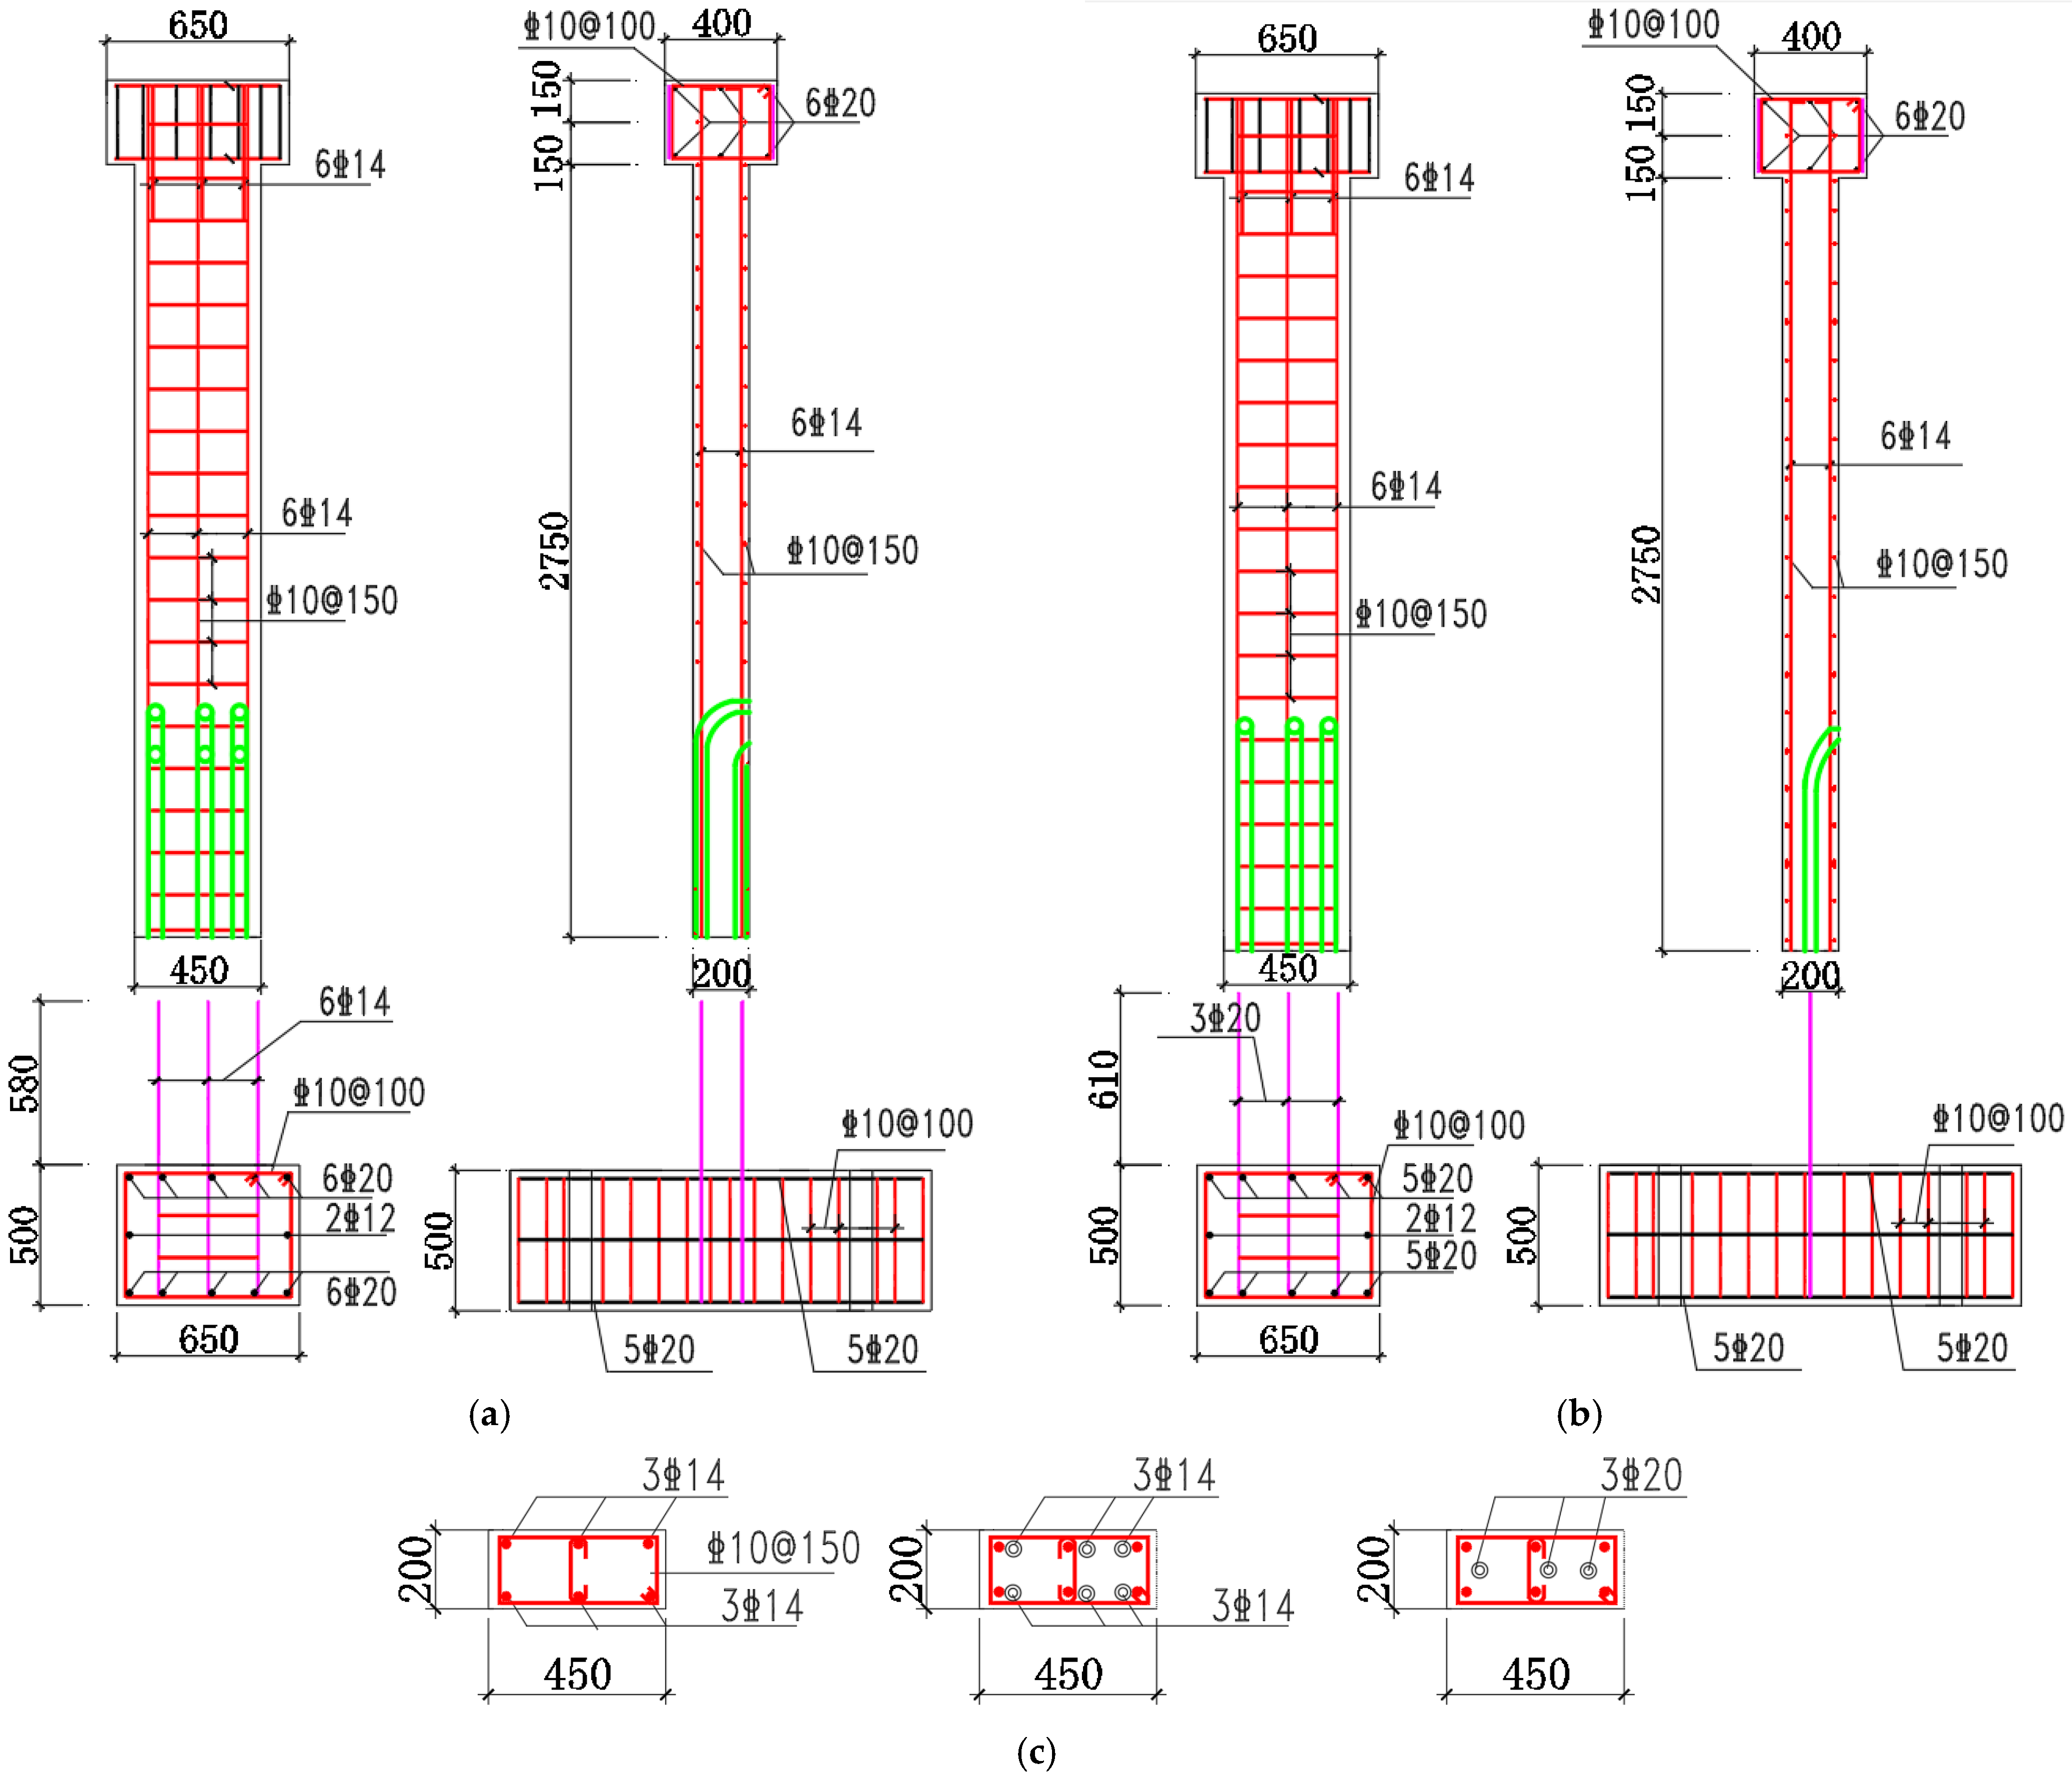
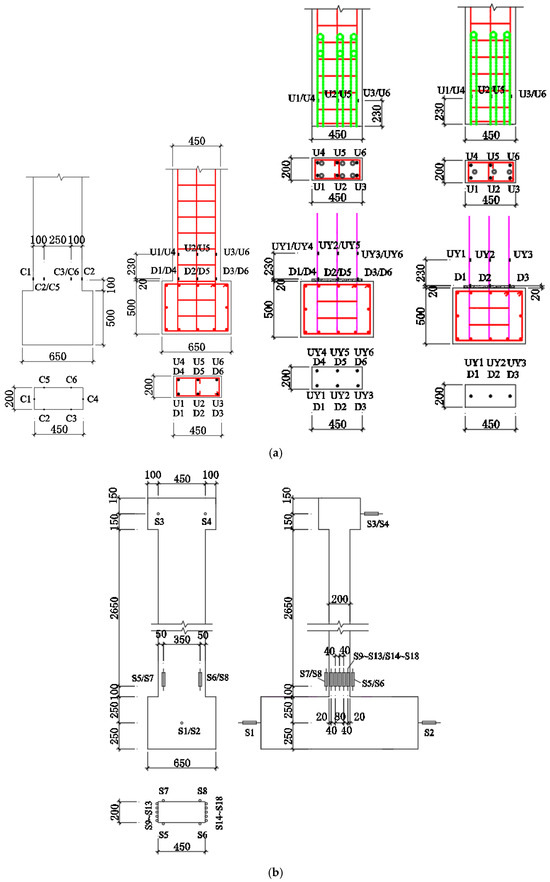
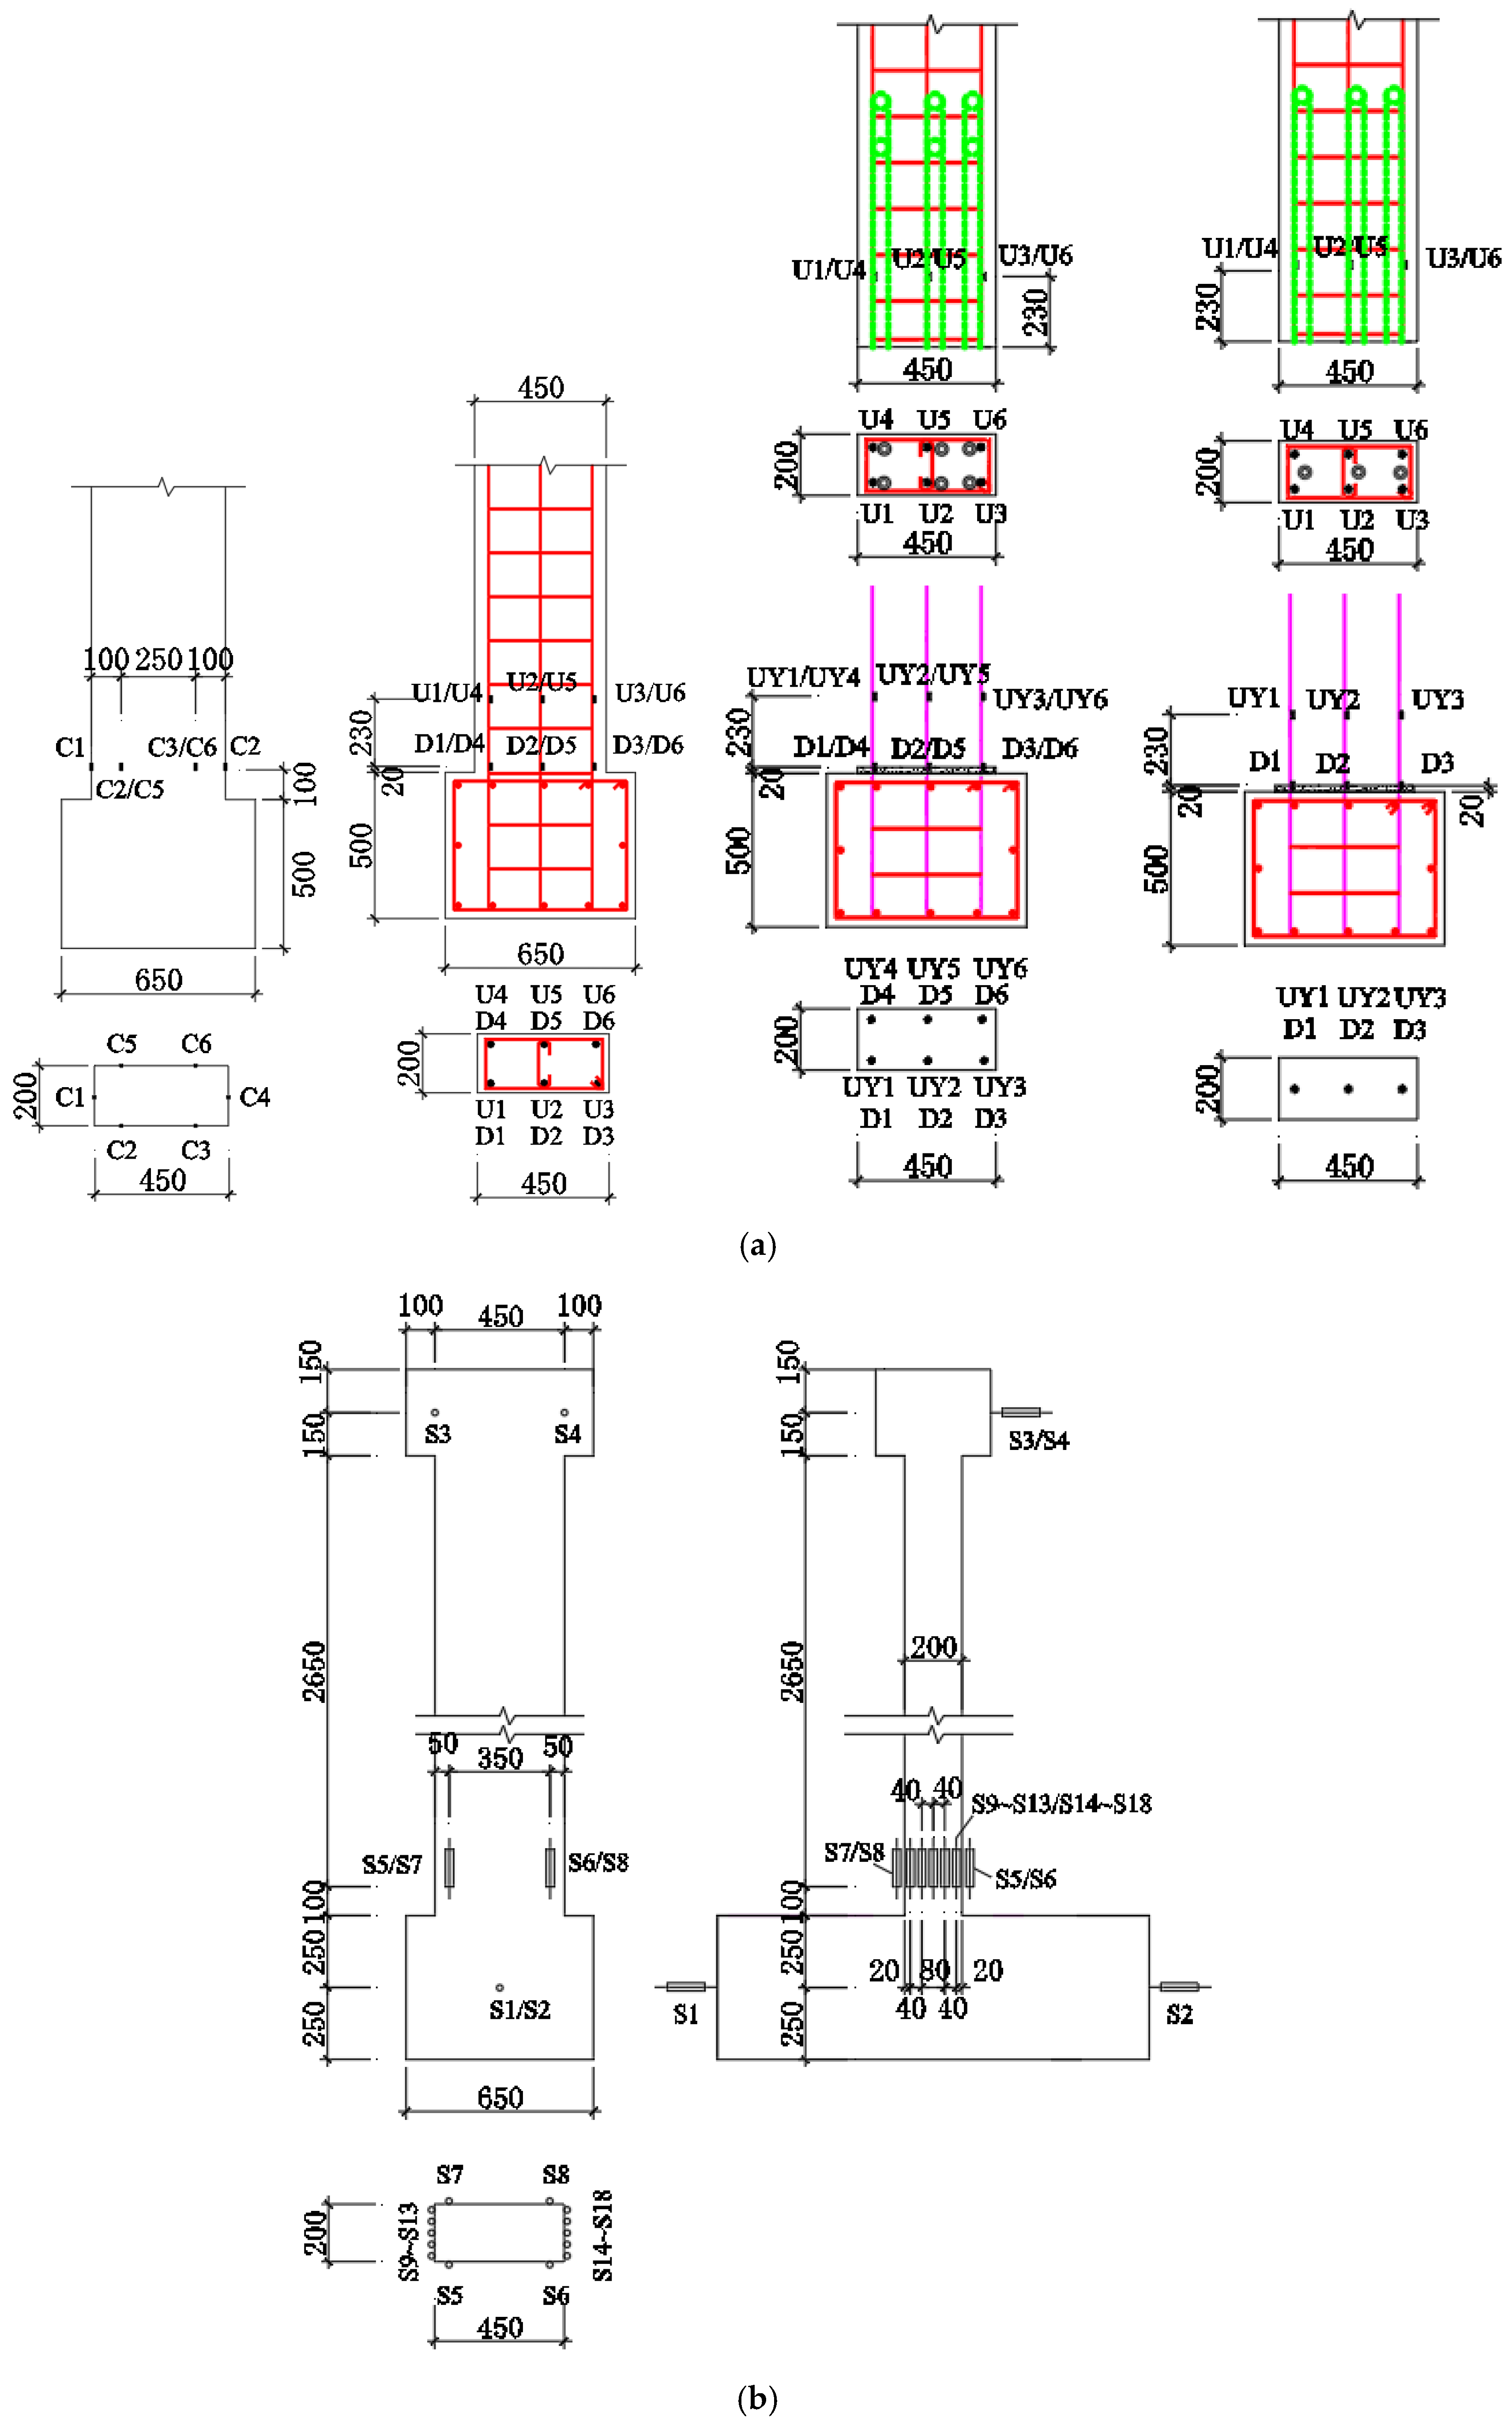
Reinforcement details in the wall panels were identical for precast and cast-in-place specimens. The dimensions and reinforcement of specimens are shown in Figure 2. The layout of displacement transducers and strain gauges is shown in Figure 3. A double-row connection was defined as the vertical bars in the foundation beam and wall being aligned and connected via grouted corrugated ducts (Jiangsu Zhongnan Construction Group Co., Ltd., Nantong, Jiangsu, China). Single-row connection involves adding connection bars along the central axis of the wall section for grouted corrugated duct splices, while the longitudinal bars of the wall are not connected to the foundation beam. The total cross-sectional area of the connection bars in the single-row connection was equivalent to that in the double-row layout.
Figure 2.
Dimensions and Reinforcement of Specimens (units: mm). (a) Double-row Connections; (b) Single-row Connections; (c) Section Details (Cast-in-place, Double-row Precast, Single-row Precast).
Figure 3.
Layout of Displacement Transducers and Strain Gauges on the Specimens (units: mm). (a) Layout of Strain Gauges (Concrete Strain Gauge, Strain Gauge on Reinforcement in Cast-in-place Specimens, Strain Gauge on Reinforcement in Double-row Precast, Strain Gauge on Reinforcement in Single-row Precast); (b) Layout of Displacement Transducers.
2.2. Specimen Fabrication
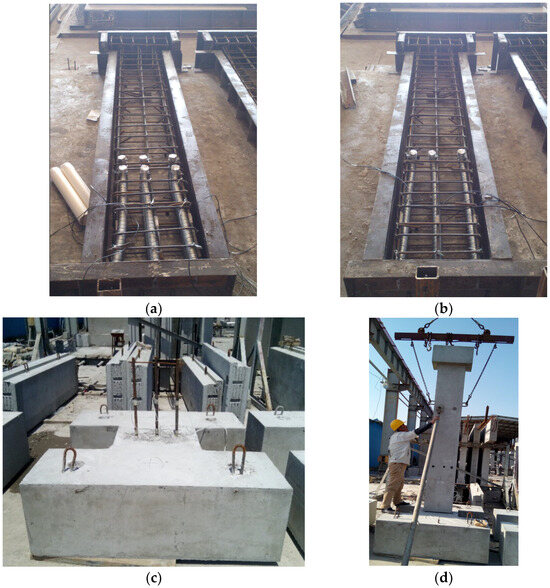
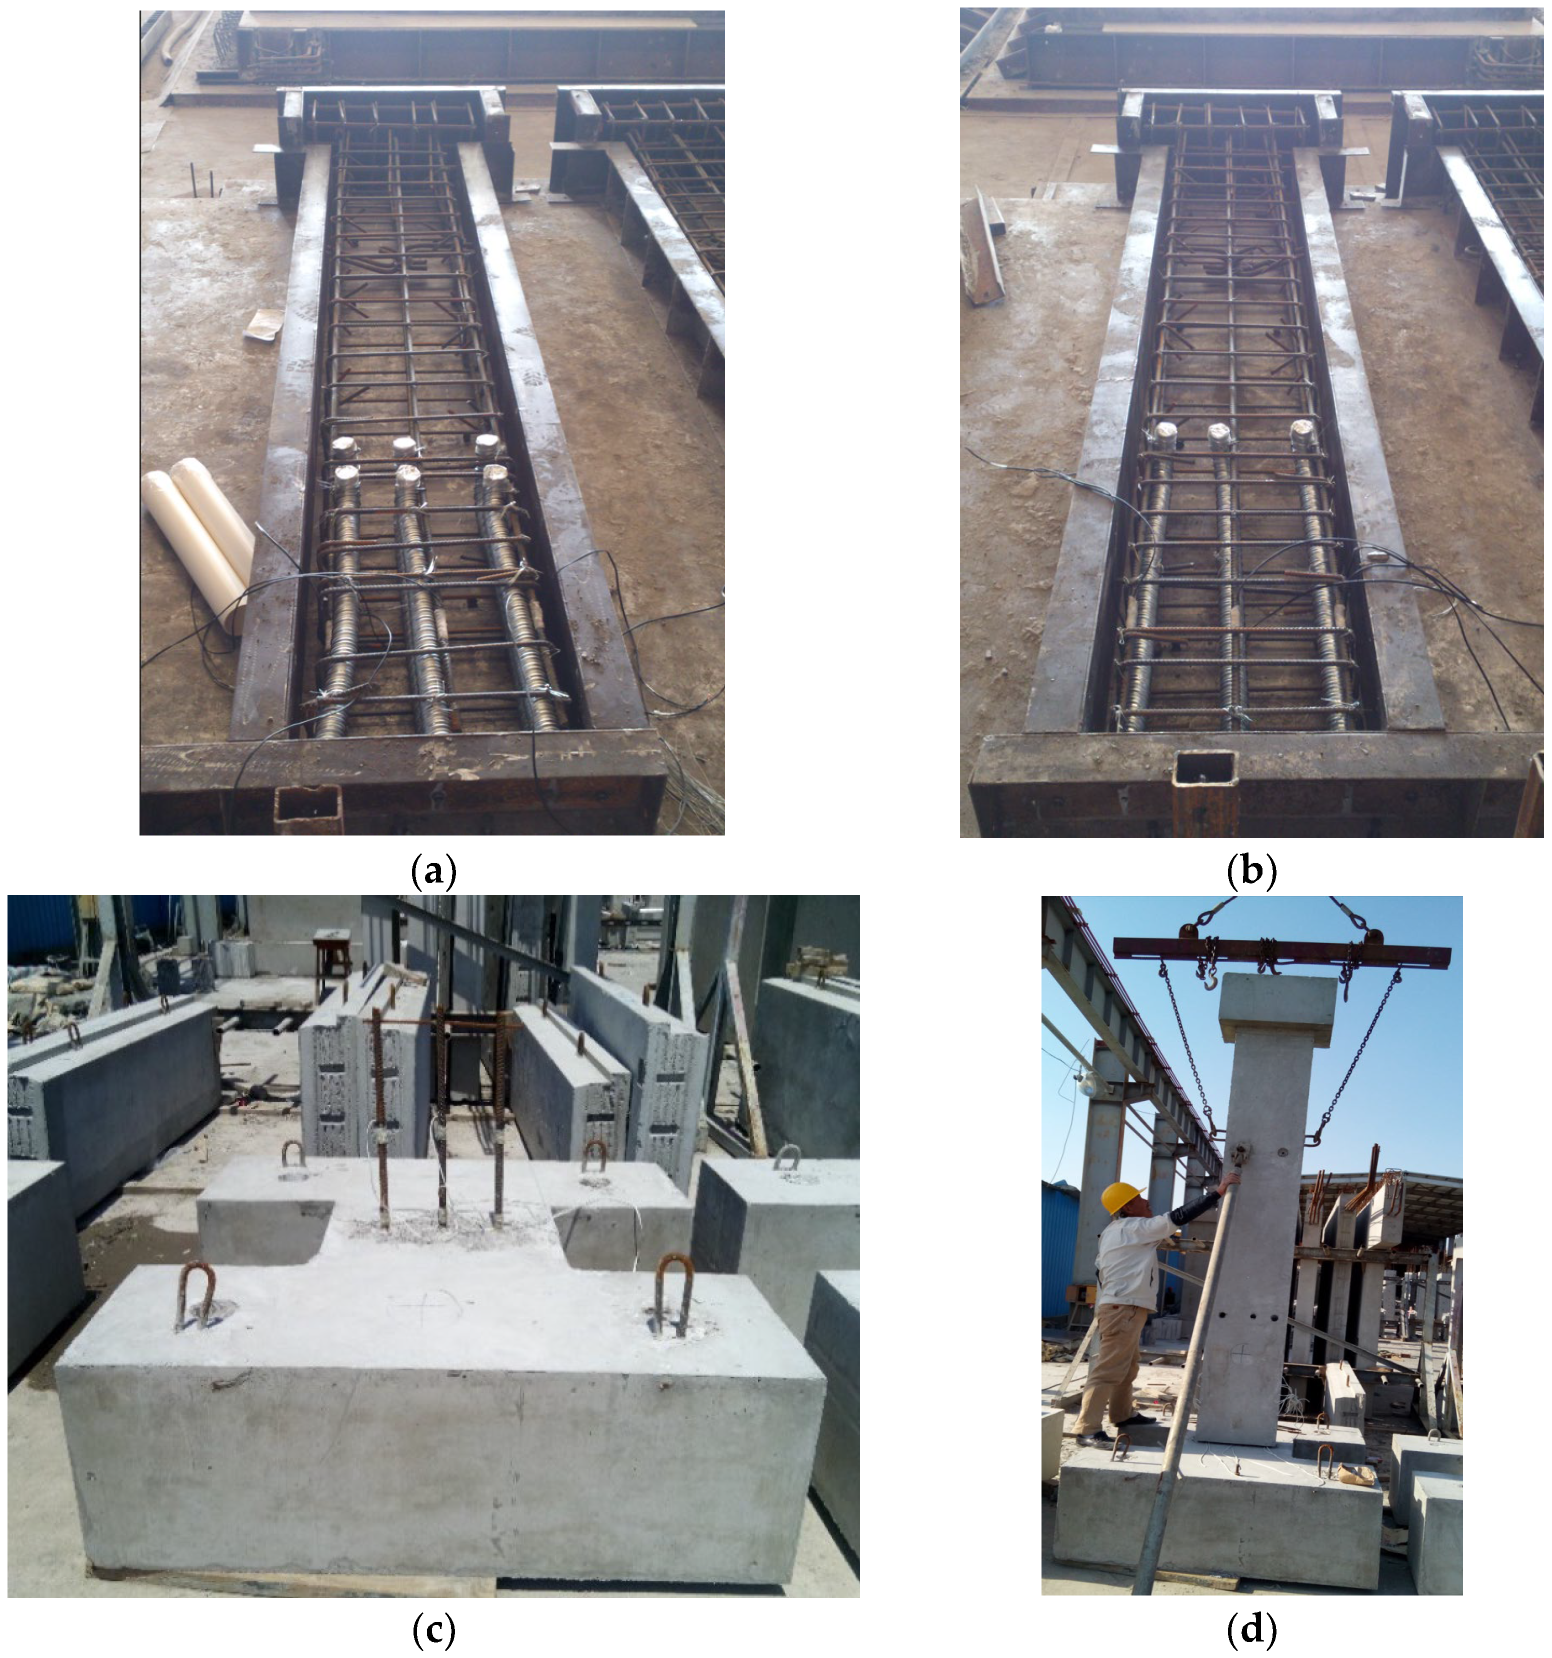
All specimens were fabricated in a plant. The precast components were produced as follows: the wall and top beam were cast monolithically, with corrugated ducts pre-embedded in the lower part of the wall (Figure 4a,b); the foundation beam was cast separately with pre-embedded connection bars (Figure 4c). After 28 days of curing under standard conditions, the components were assembled (Figure 4d). Following vertical alignment correction, C80 grout was injected to complete the connections. Cast-in-place specimens were integrally cast in one pour, including the wall, foundation beam, and top beam.
Figure 4.
Specimen Fabrication Process: (a) Double-row Wall and Top Beam; (b) Single-row Wall and Top Beam; (c) Foundation Beam; (d) Assembly.
2.3. Mechanical Properties of Materials
Mechanical property tests were carried out on the reserved concrete test blocks and steel bar specimens. The test results are shown in Table 2 and Table 3, respectively.
Table 2.
Measured Concrete Mechanical Properties.
Table 3.
Measured Steel Reinforcement Mechanical Properties.
2.4. Test Setup
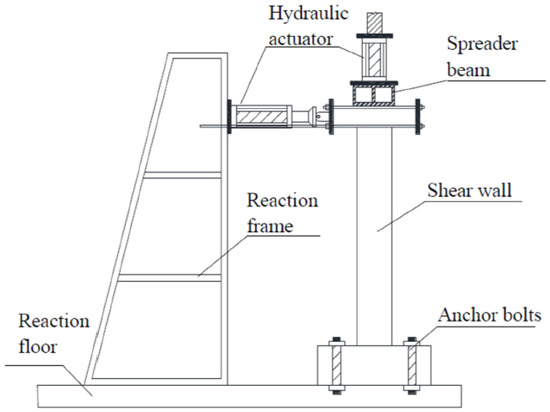
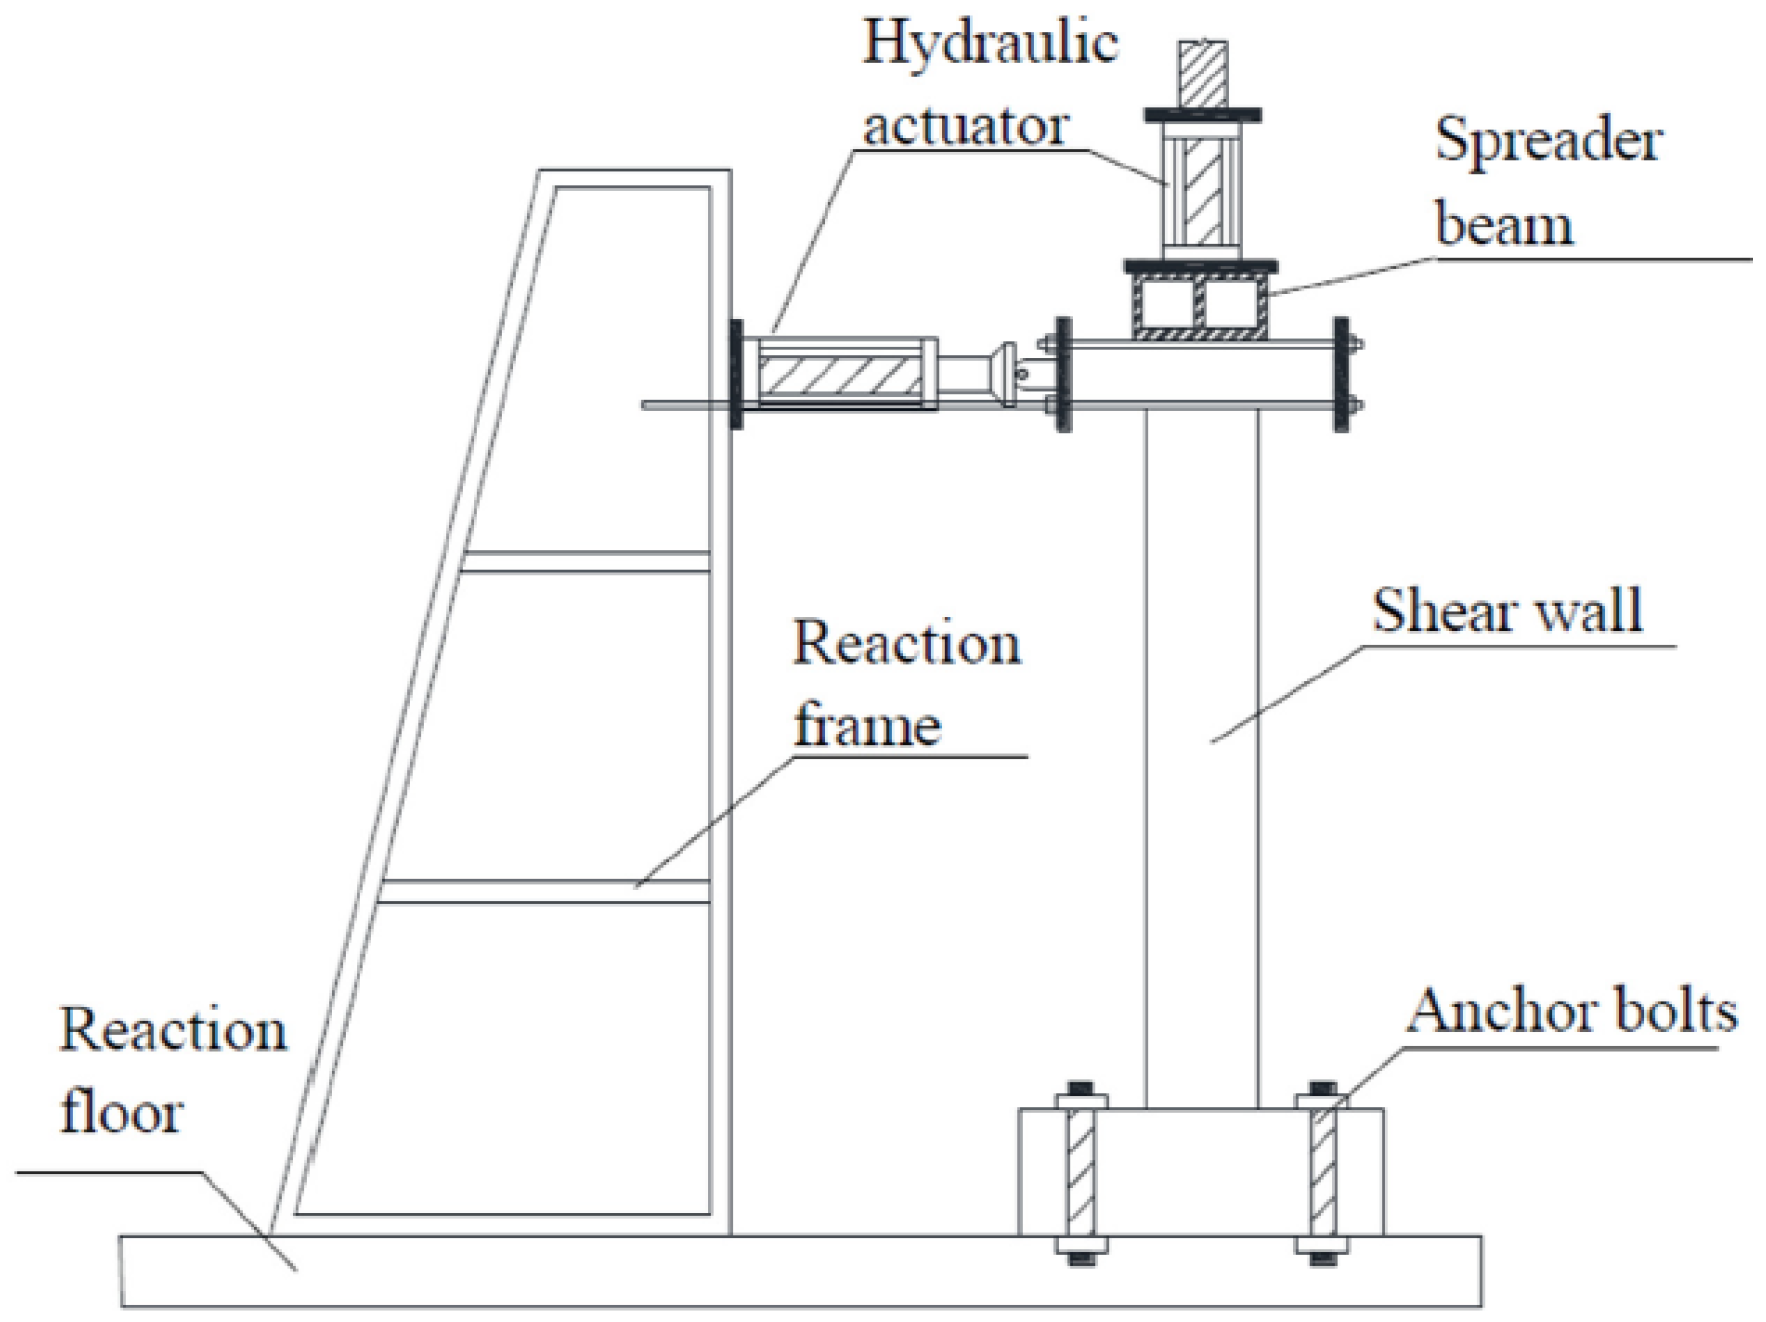
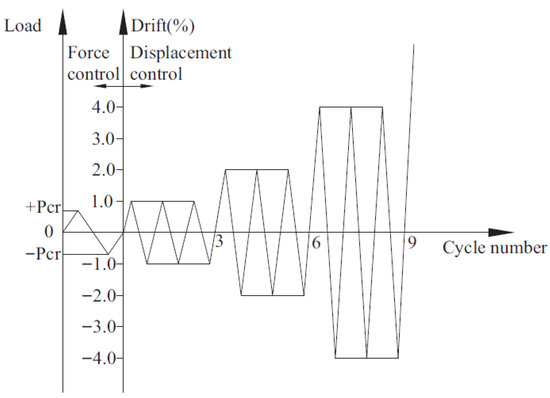
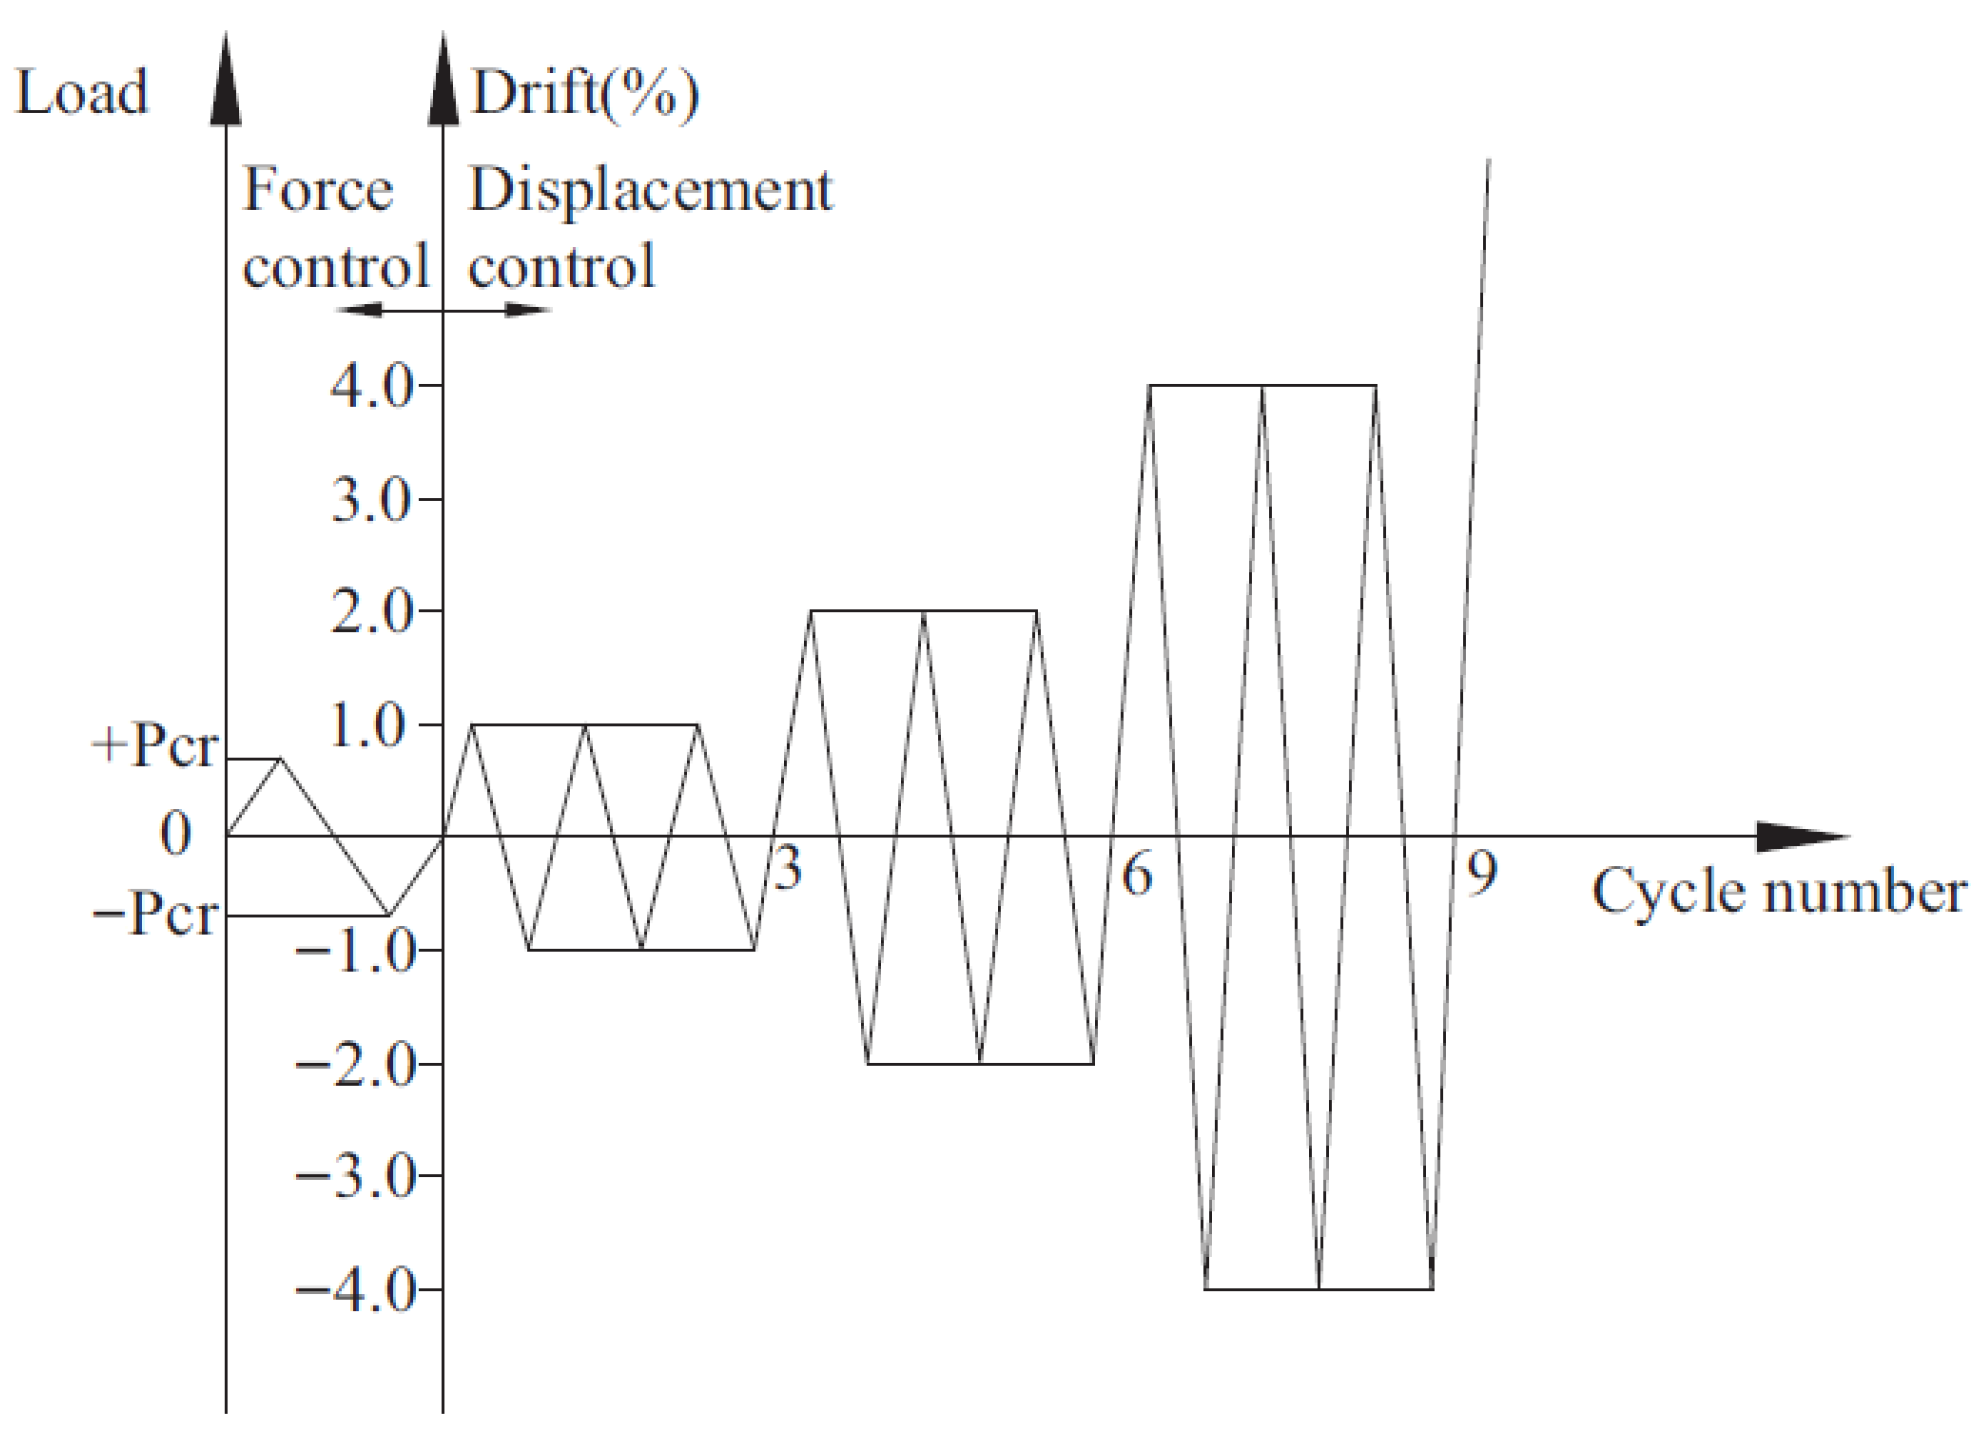
The experimental setup, schematically represented in Figure 5, employed a 2000 kN jack to apply the vertical load, which incorporated a tracking device to preserve vertical alignment. The quasi-static reversed cyclic horizontal loading was then imposed under displacement control through a servo-controlled 500 kN actuator. A force-displacement hybrid loading protocol was adopted in this study. During the displacement-controlled phase, each loading amplitude was set at 29 mm (corresponding to a drift ratio of 1%), with three fully reversed cycles applied at each amplitude. The testing continued until the load capacity dropped below 85% of the peak value or until excessive damage prevented further loading, as illustrated in Figure 6. Test data was continuously captured via a data acquisition system at a 1 s time interval.
Figure 5.
Loading Configuration.
Figure 6.
Horizontal Displacement Loading History.
3. Experimental Results and Analysis
3.1. Load Response and Failure Patterns
For Group 1 (ACR = 0.12), the specimens generally exhibited distinct behavioral phases: cracking, yielding, ultimate load, and failure. Specimens with no axial load experienced cracking and yielding, reaching their ultimate stage before the test was terminated due to the loading apparatus reaching its maximum stroke, at which point their capacity had not yet begun to degrade.
Cracking Stage: The initial cracking was observed at lateral loads of 9–10 kN for Group 1 specimens, and at significantly lower loads of 1.5–2.5 kN for those with no axial load. Cracking was concentrated within 0–30 cm from the wall base across all specimens, at a drift ratio of 0.2–0.4%. Furthermore, single-row connected specimens demonstrated reduced cracking resistance and wider crack widths (approx. 0.06 mm) relative to their cast-in-place (0.02 mm) and double-row connected (0.04 mm) counterparts.
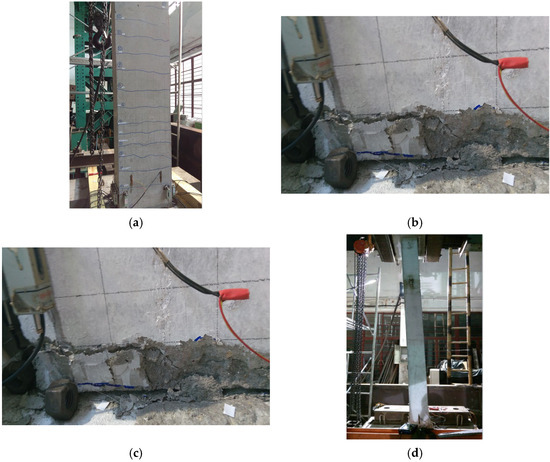
Yielding Stage: Specimens RW1, PSW1, and PSW2 experienced yielding of the tensile reinforcement at drift ratios between 0.62% and 1.06%, with corresponding lateral loads between 12.25 kN and 16.6 kN. Specimens RW2, PSW3, and PSW4 (zero axial load) yielded at higher drift ratios of 2% to 3.9%, with lateral loads between 10.17 kN and 12.95 kN. During this stage, wall cracks were predominantly horizontal and parallel, with maximum widths reaching 1.4 mm. Typical crack patterns are shown in Figure 7a.
Figure 7.
Typical Failure Process of Specimens: (a) Wall Cracking; (b) Concrete Crushing; (c) Wall Uplift; (d) Wall Flexural Deformation.
Peak Load: Specimens with ACR = 0.12 attained their maximum capacity of 15.2–17.8 kN at drift ratios of 1.35–1.91%, and minor concrete compression damage was observed for single-row connected specimens. In contrast, after yielding, the load-carrying capacity of the zero axial load specimens plateaued, remaining stable with increasing displacement. The test was terminated at the actuator’s stroke limit (203 mm, or 7.0% top drift), at which point no significant strength degradation had occurred, although cracks in the tension zone near the base joint exceeded 2 mm in width.
Failure Stage: The failure criterion for specimens RW1, PSW1, and PSW2 was defined as a drop in load capacity to 85% of the peak load, with the failure state characterized by observable crushing of the concrete in the compression zone (Figure 7b) and measurable uplift at the wall-foundation interface (Figure 7c). The maximum uplift measured at the specimen edges was approximately 7.55 mm, 5.79 mm, 10.76 mm, and 13.79 mm for PSW1, PSW2, PSW3, and PSW4, respectively.
The failure process indicated that all specimens failed in an identical flexural manner, as shown in Figure 7d. The number of connection rows had a negligible influence on the failure morphology. The presence of axial load, however, enhanced the overall structural integrity by increasing friction at the wall-foundation interface, which consequently restrained slip in the connection bars and reduced the ultimate uplift at failure.
The specimens with zero axial compression ratio did not fail by the end of the test, which can likely be attributed to wall uplift and the substantial post-yield deformation of the connecting reinforcement, resulting in a rocking wall mechanism. The ratios of rocking displacement to total displacement for specimens RW2, PSW3, and PSW4 were 29%, 31%, and 49%, respectively. Notably, the rocking displacement of specimen PSW4 accounted for nearly half of its total displacement, indicating a pronounced effect.
3.2. Load–Displacement Hysteretic Curves
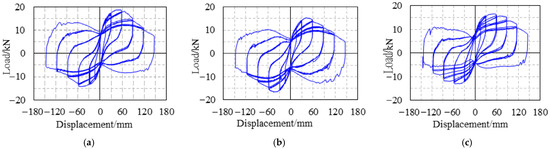
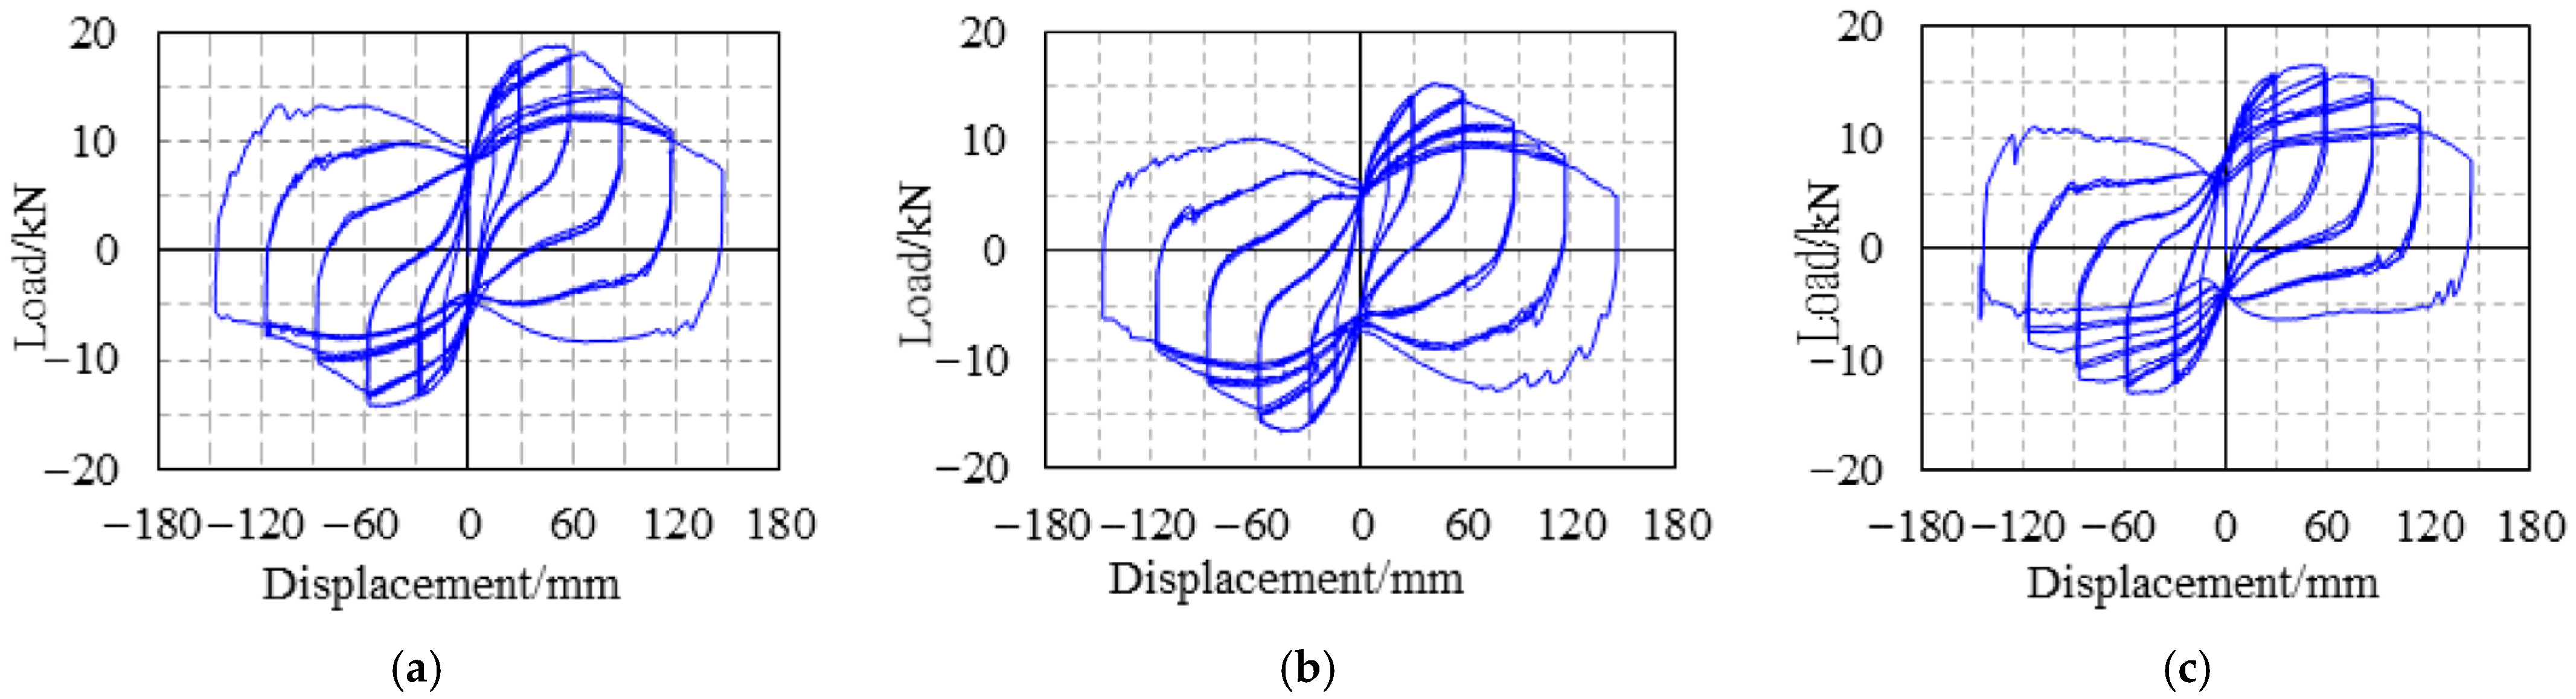
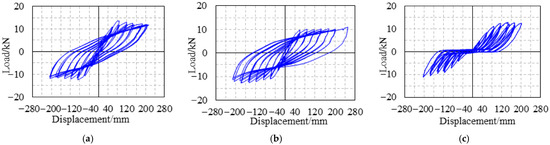
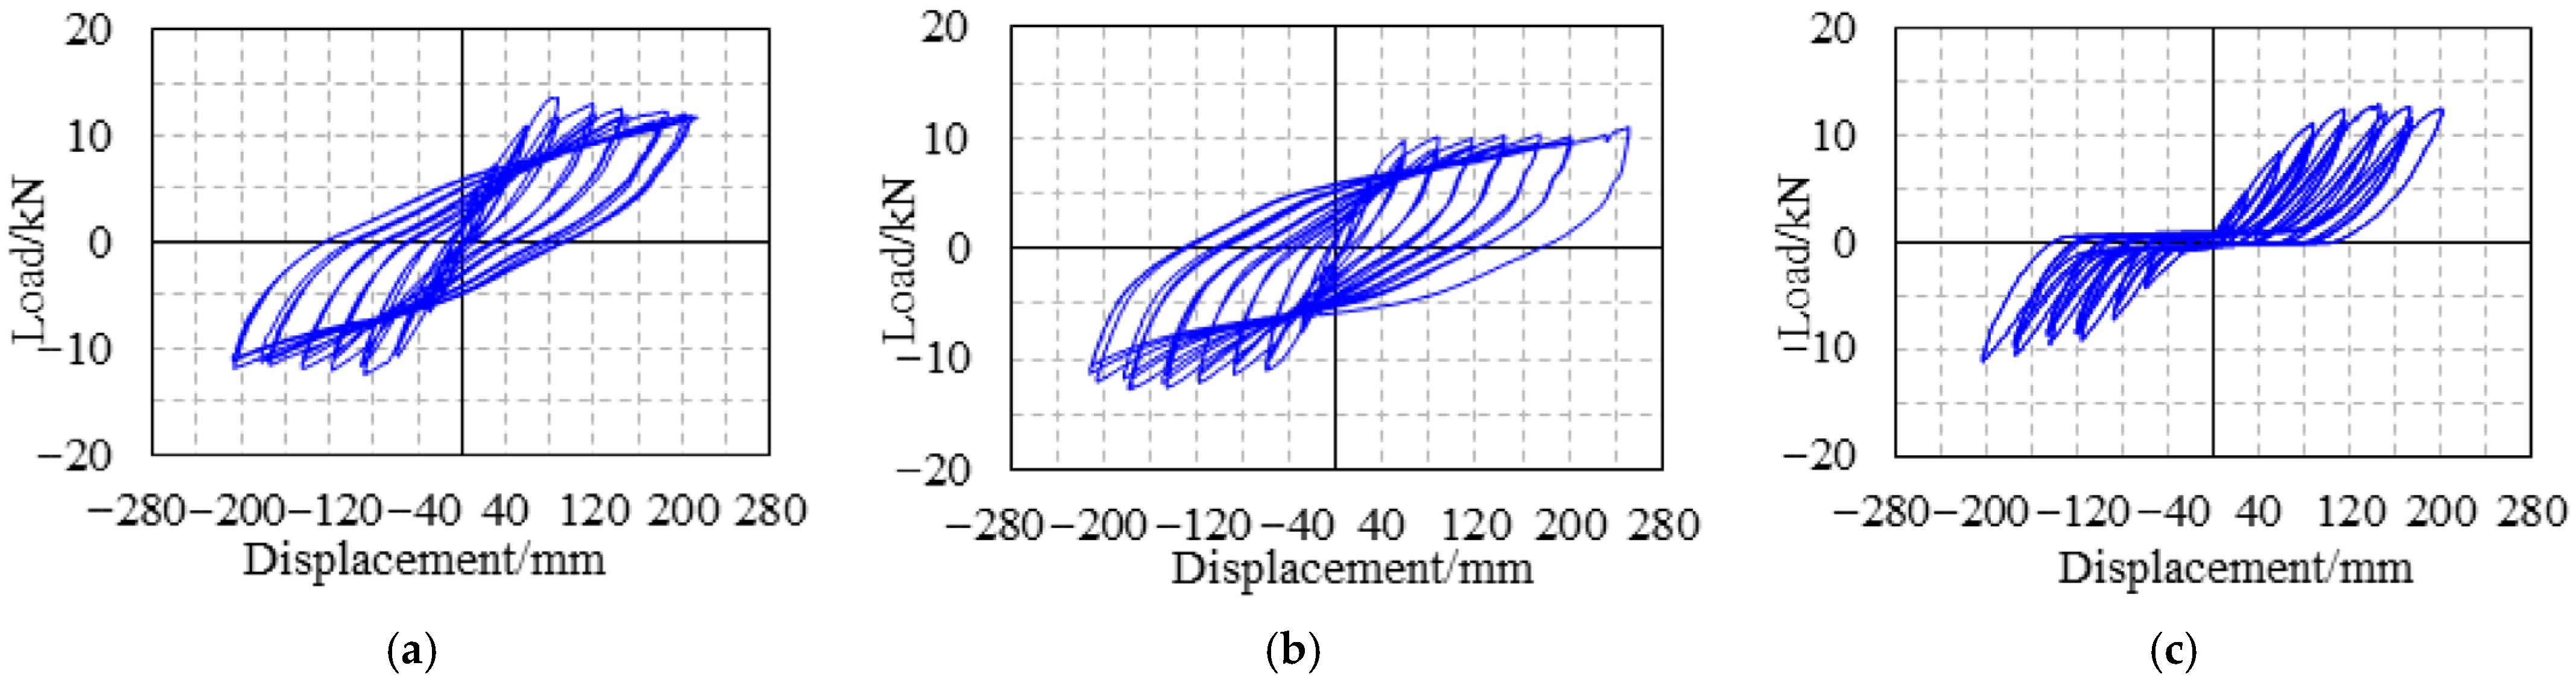
Hysteretic curves are crucial for evaluating the seismic performance of structures, particularly their energy dissipation capacity. The hysteretic loops for the six shear wall specimens are shown in Figure 8 and Figure 9.
Figure 8.
Hysteretic Curves for Specimens (ACR = 0.12): (a) Specimen RW1; (b) Specimen PSW1; (c) Specimen PSW2.
Figure 9.
Hysteretic Curves for Specimens (ACR = 0): (a) Specimen RW2; (b) Specimen PSW3; (c) Specimen PSW4.
As shown in the figures, the area enclosed by the hysteretic loops increased progressively as lateral displacement increased, beginning from a very small size at low displacement levels. The hysteretic curves for Group 1 specimens were very similar in shape, exhibiting significant pinching in the later loading stages. This pinching is attributed to yielding of vertical reinforcement, concrete crushing, and slight bond-slip of the connection bars. The out-of-plane energy dissipation capacities for both types of specimens were relatively similar. All specimens exhibited significant residual deformations upon unloading.
The shear wall specimen with zero axial compression ratio exhibited a markedly distinct hysteretic response compared to its axially loaded counterparts, despite not reaching failure upon test termination. Specimens RW2 and PSW3 displayed full, spindle-shaped hysteresis loops, indicative of stable plastic deformation and negligible reinforcement slip. In contrast, Specimen PSW4 exhibited severely pinched, inverse S-shaped loops, which signify significant bond-slip behavior.
Residual deformation is employed to analyze the evolution of energy dissipation capacity and stiffness degradation throughout the loading history. The residual deformation ratio is defined as Rr = Δr/Δm. The residual deformation ratios for both positive and negative loading directions at each displacement level are summarized in Table 4.
Table 4.
Residual Deformation Ratios of Walls.
As shown in Table 4, the specimens in Group 1 exhibited a consistent pattern in residual deformation development: the residual deformation rate increased rapidly and approached 1.0 at an early stage. Although the specimens in Group 2 did not experience ultimate failure by the end of the test, significant differences were observed in the progression of their residual deformation ratios. Specifically, the residual deformation rates of specimens SW2 and PSW3 at the first loading level were 0.21 and 0.24, respectively. These values increased progressively with loading, reaching cumulative increments of 152% and 158% by the conclusion of the test. In contrast, specimen PSW4 had an initial residual strain rate of 0.48, which was 2.29 and 2.0 times that of SW2 and PSW3, respectively. However, its rate of increase was extremely limited, rising by only 27% throughout the entire process.
By synthesizing the hysteresis loop characteristics and the development patterns of the residual deformation rates, the following conclusions can be drawn:
The cast-in-place specimens and those with double-row connections under axial load exhibited a significant P-Δ effect, which exacerbated concrete damage and reinforcement slip, resulting in pronounced pinching in the hysteresis loops. Their residual deformation was also substantially greater than that of the Group 2 specimens under comparable conditions.
The specimens with single-row connections experienced significantly more severe damage during the initial loading stage compared to those with double-row connections and the cast-in-place specimens. This is likely attributable to the fact that the single-row connection configuration concentrated the entire load on a single row of reinforcement, leading to stress concentration in this region and causing premature bond-slip of the reinforcement.
The residual deformation of specimen PSW4 at the first displacement level was significantly higher than that of SW2, PSW3, and even PSW2, indicating that notable horizontal displacement occurred during the early loading phase. This phenomenon can be attributed to the insufficient horizontal friction resistance at the wall-foundation beam interface under zero axial load. In PSW4, the horizontal load was primarily resisted by the shear capacity of the connection reinforcement, and the wall underwent global horizontal displacement due to the dowel action of the bars. In contrast, in the double-row connected specimens SW2 and PSW3, this horizontal force was mainly carried by the tensile and compressive reinforcement. The single-row connected specimen PSW2 under axial load effectively suppressed such displacement due to higher interfacial friction. The significant slip behavior observed in the initial hysteresis loops of PSW4 further confirms this mechanism.
Furthermore, compared to SW2 and PSW3, the residual strain development in PSW4 was relatively slow, indicating that no severe damage accumulation occurred in the subsequent loading stages. The deformation mechanism of the wall was primarily governed by a global rocking behavior, rather than continuous material degradation.
3.3. Skeleton Curves
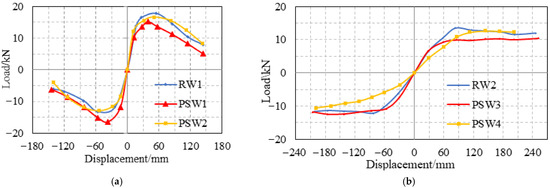
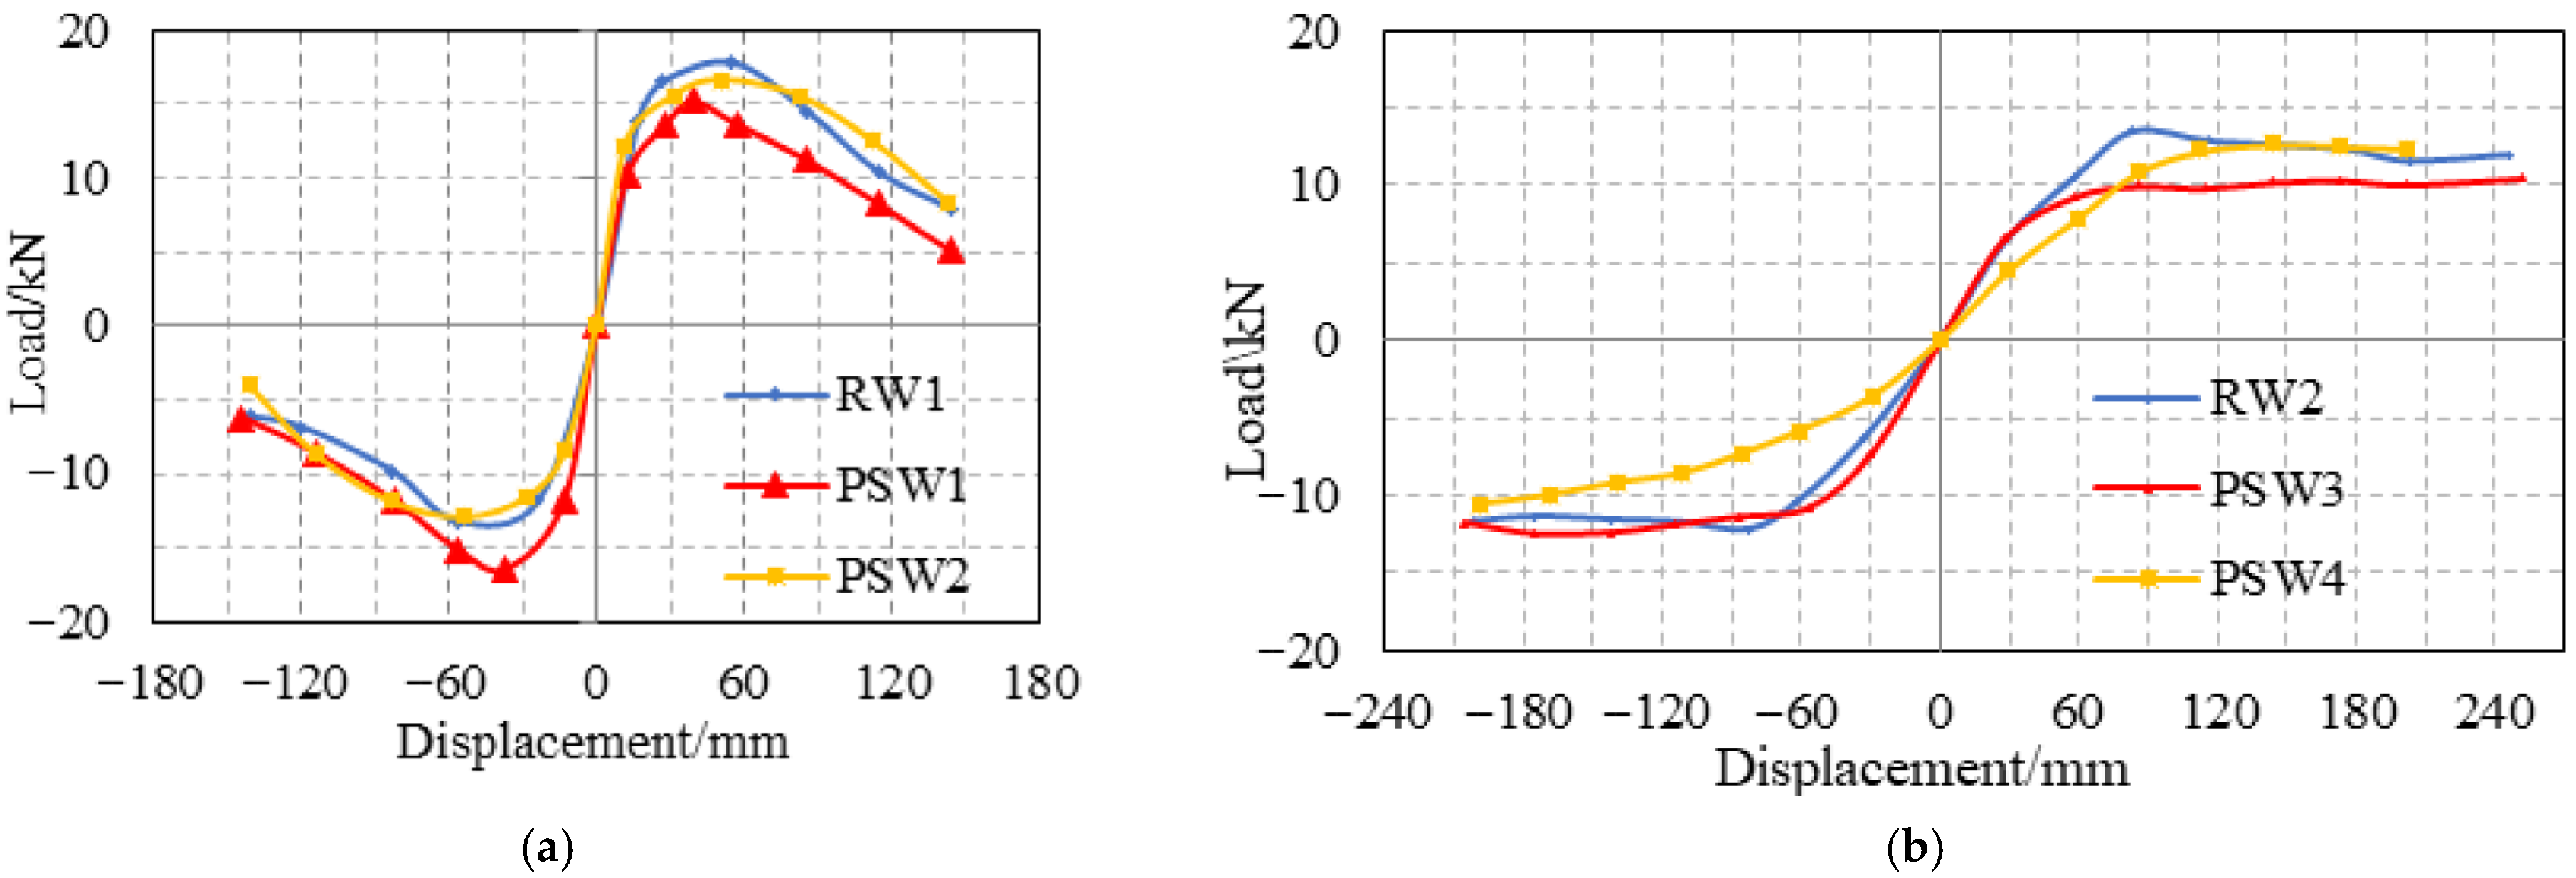
The skeleton curves for the six shear wall specimens are illustrated in Figure 10.
Figure 10.
Specimen Skeleton Curves: (a) Group 1 (ACR = 0.12); (b) Group 2 (ACR = 0).
As can be seen from Figure 10:
- (1)
- Specimens with ACR = 0.12 exhibited distinct phases: cracking, yielding, peak load attainment, and failure. During the initial elastic phase, the skeleton curves for all specimens were approximately linear. After cracking, the increase in lateral load lagged behind the top displacement, indicating reduced stiffness. After yielding, stiffness degradation became more pronounced.
- (2)
- Under an axial load ratio of 0.12, the measured bearing capacities during positive and negative loading were as follows: SW1: 17.8 kN/13.9 kN; PSW1: 15.2 kN/16.5 kN; PSW2: 16.6 kN/12.9 kN. The positive bearing capacity of SW1 exceeded its negative capacity by approximately 21.9%, while PSW2 showed a similar trend with the positive capacity being 22.2% higher than the negative capacity. This asymmetry is attributed to the reduction in overall stiffness due to cracking induced during positive loading, which subsequently compromised the load resistance in the reverse direction. For specimen PSW1, the positive bearing capacity was 14% lower than that of SW1, whereas its negative capacity surpassed that of SW1 by approximately 15.7%, even exceeding its own positive loading capacity. This can be attributed to the fact that the grouting vents of the double-row corrugated ducts in specimen PSW1 were arranged on the same side (i.e., the concrete compression side under forward loading). During the grouting process, the ducts on this side likely experienced a voiding effect, which significantly reduced the load-bearing capacity under forward loading.
- (3)
- Specimens with zero axial load behaved similarly to cantilever columns. After yielding, their load capacity remained essentially constant with increasing displacement, showing no degradation.
- (4)
- While specimens with ACR = 0 displayed an extended plastic plateau in their post-yield response, those with an axial load ratio of 0.12 exhibited a pronounced negative slope in their skeleton curves shortly after yielding, indicating significant P-Δ effects. The additional moment generated by the vertical load acting through the lateral displacement accelerated the degradation of both strength and stiffness.
3.4. Displacement Ductility and Deformation Capacity
Ductility serves as a crucial parameter for assessing the seismic performance of structures in structural seismic engineering, typically quantified by the ductility coefficient μ = Δu/Δy [26]. Since the specimens under zero axial load did not attain a defined failure displacement, the displacement at the termination of the test was adopted as the ultimate displacement for calculating the displacement ductility coefficients. The resulting displacement ductility coefficients are given in Table 5.
Table 5.
Characteristic Values and Ductility of Walls.
As summarized in Table 4, the precast specimens demonstrated significantly superior out-of-plane ductility compared to the cast-in-place counterparts. This enhanced performance is due to the local confinement effect from the corrugated ducts and grouting material in the joint region, which delayed concrete crushing and failure at the wall base edges, thereby improving overall ductility. Furthermore, the single-row connected wall exhibited higher ductility than the double-row connected one, likely due to the increased local reinforcement ratio at the wall base resulting from the concentration of connecting bars near the sectional centroid, which further improved the deformation capacity.
3.5. Stiffness Degradation
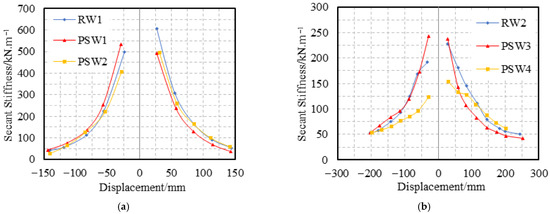
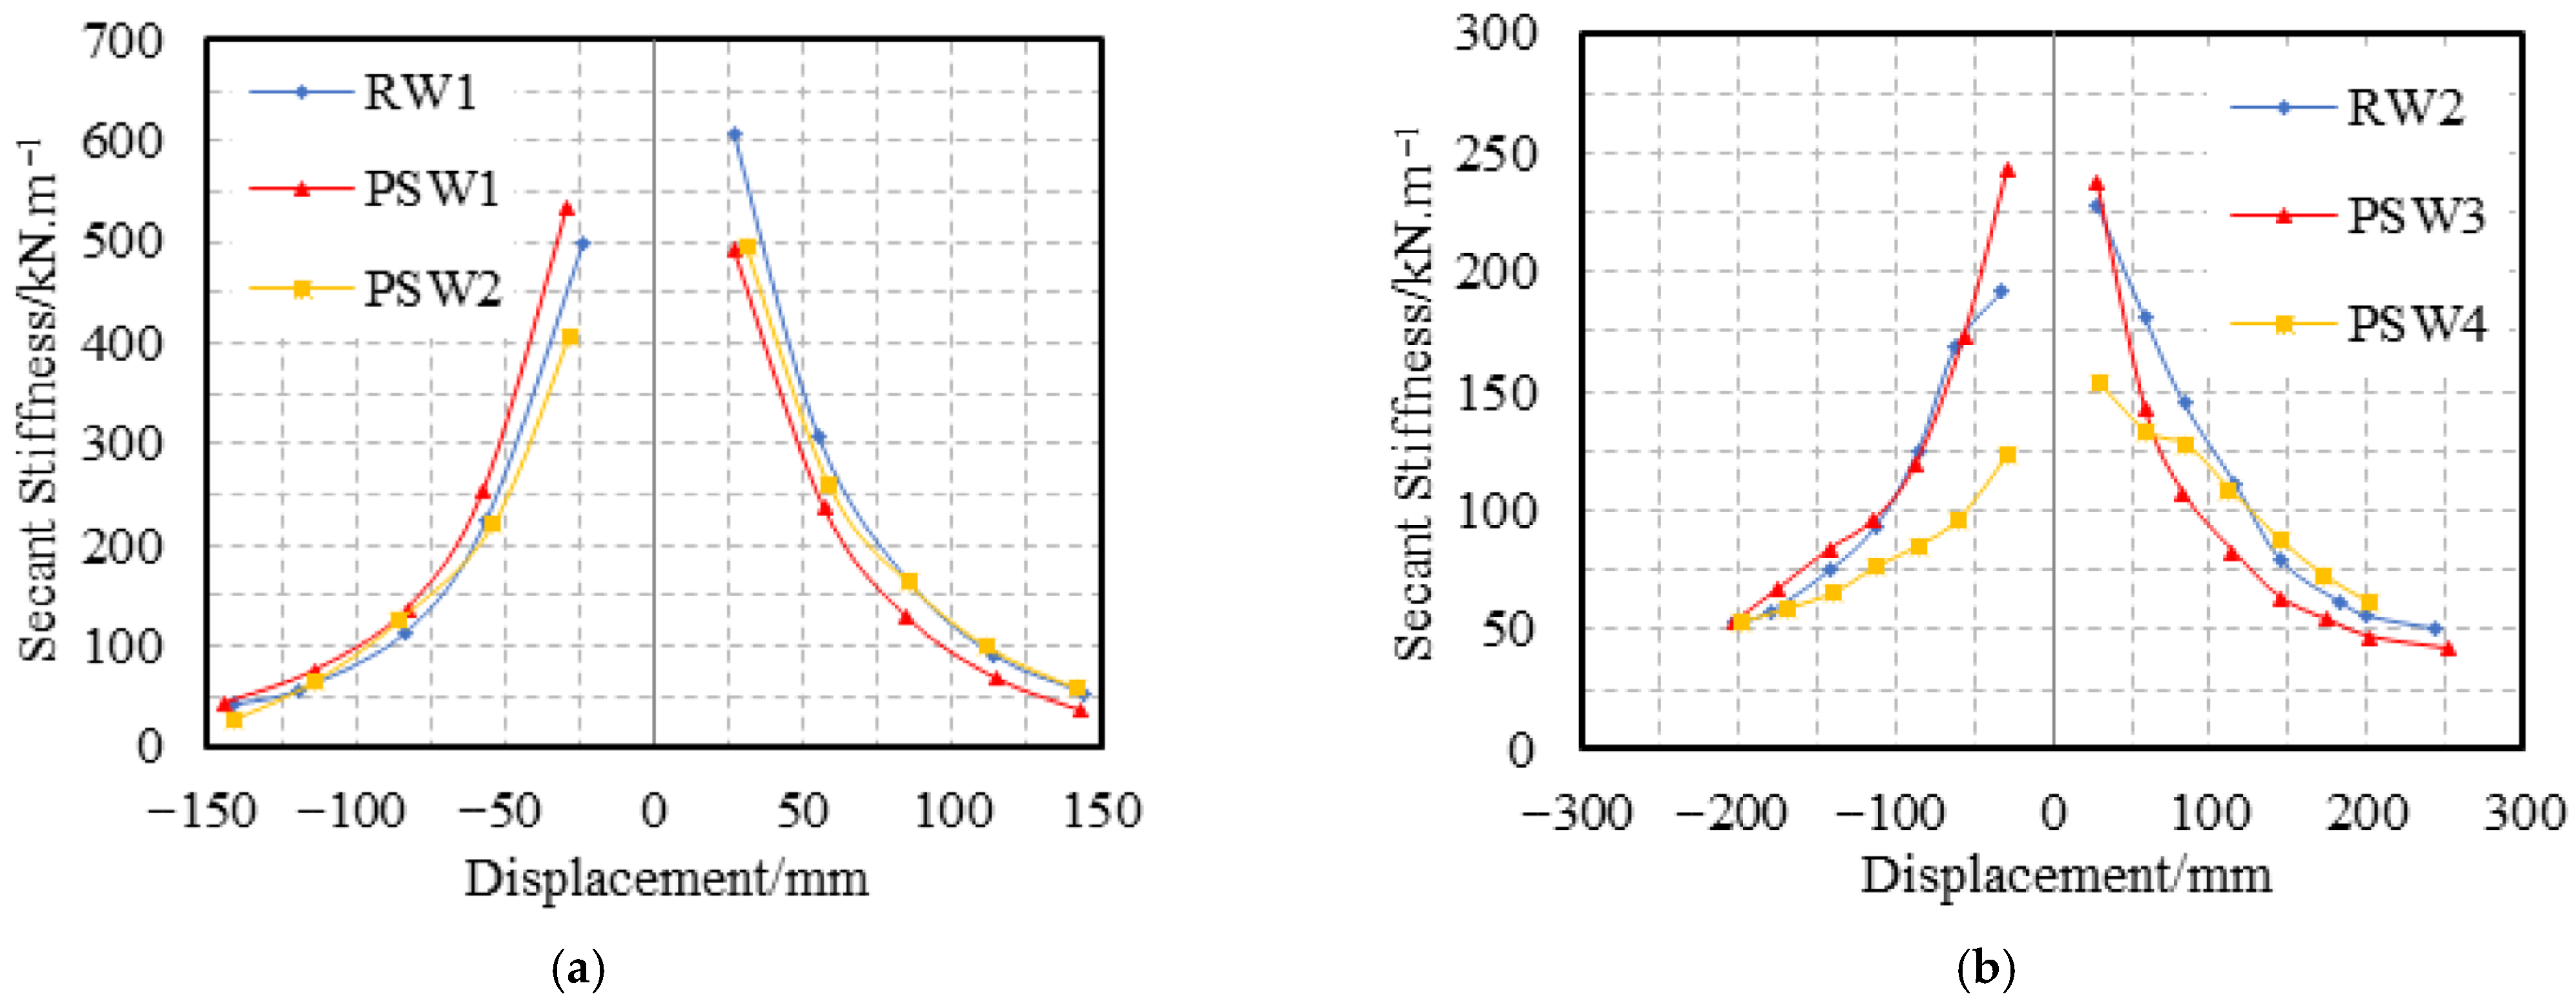
Stiffness degradation is characterized by the reduction in stiffness with an increasing number of load cycles under varying displacement amplitudes. The degree of degradation is represented by the reduction in cyclic secant stiffness Kj, as shown in Figure 11.
Figure 11.
Specimen Stiffness Degradation Curves: (a) Group Ι (ACR = 0.12); (b) Group ΙΙ (ACR = 0).
As shown in the figure, the out-of-plane stiffness of both precast and cast-in-place shear walls progressively degraded with increasing displacement due to accumulated damage during cyclic loading. The two systems exhibited similar stiffness degradation patterns, as evidenced by the parallel trajectories of their curves. A rapid stiffness reduction occurred immediately after cracking, coinciding with the phase of concentrated crack initiation and propagation. Subsequently, the degradation rate slowed considerably following yielding, as few new cracks developed
3.6. Energy Dissipation
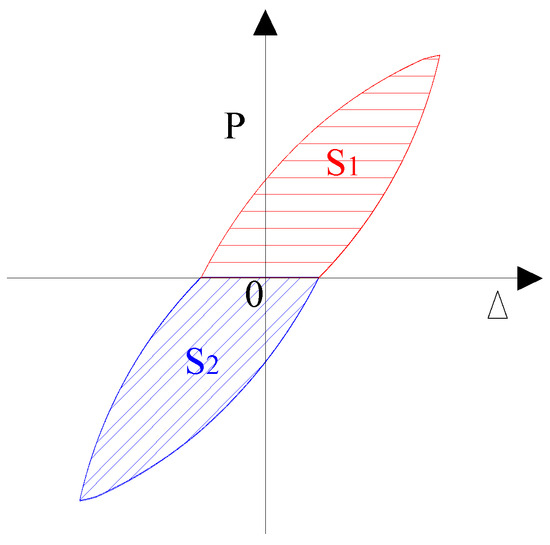
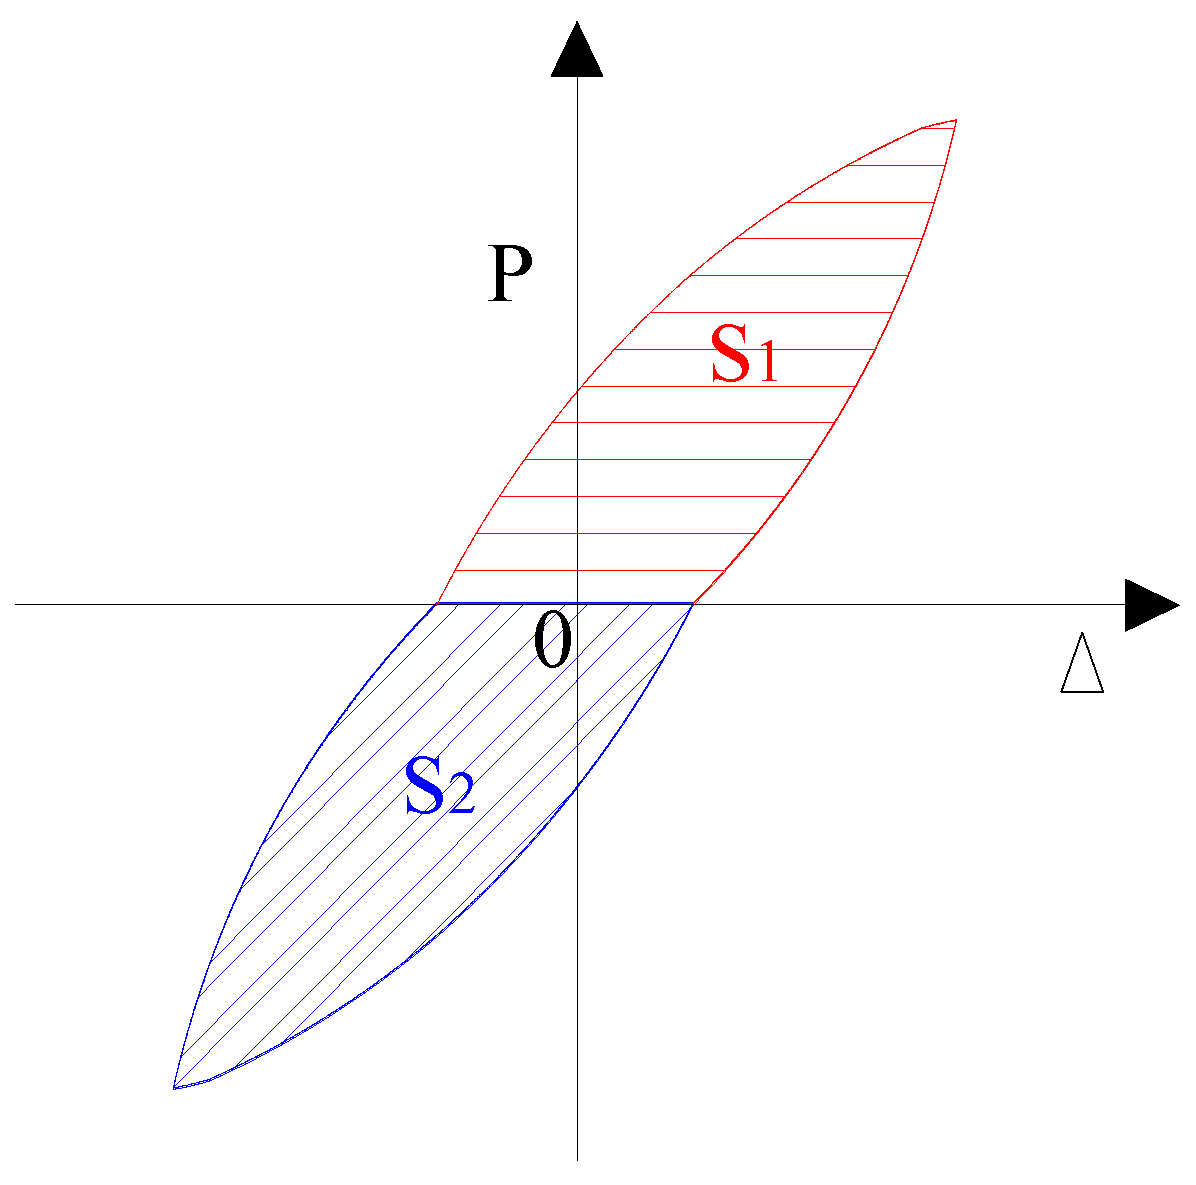
Energy dissipation during the elastic and inelastic deformation stages was analyzed based on the hysteretic curves. The energy dissipated in the positive loading-unloading cycle is denoted by area S1, and in the negative cycle by area S2, as shown in Figure 12.
Figure 12.
Energy Dissipation Calculation.
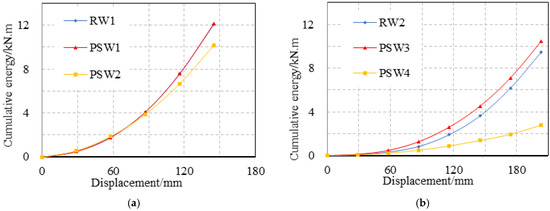
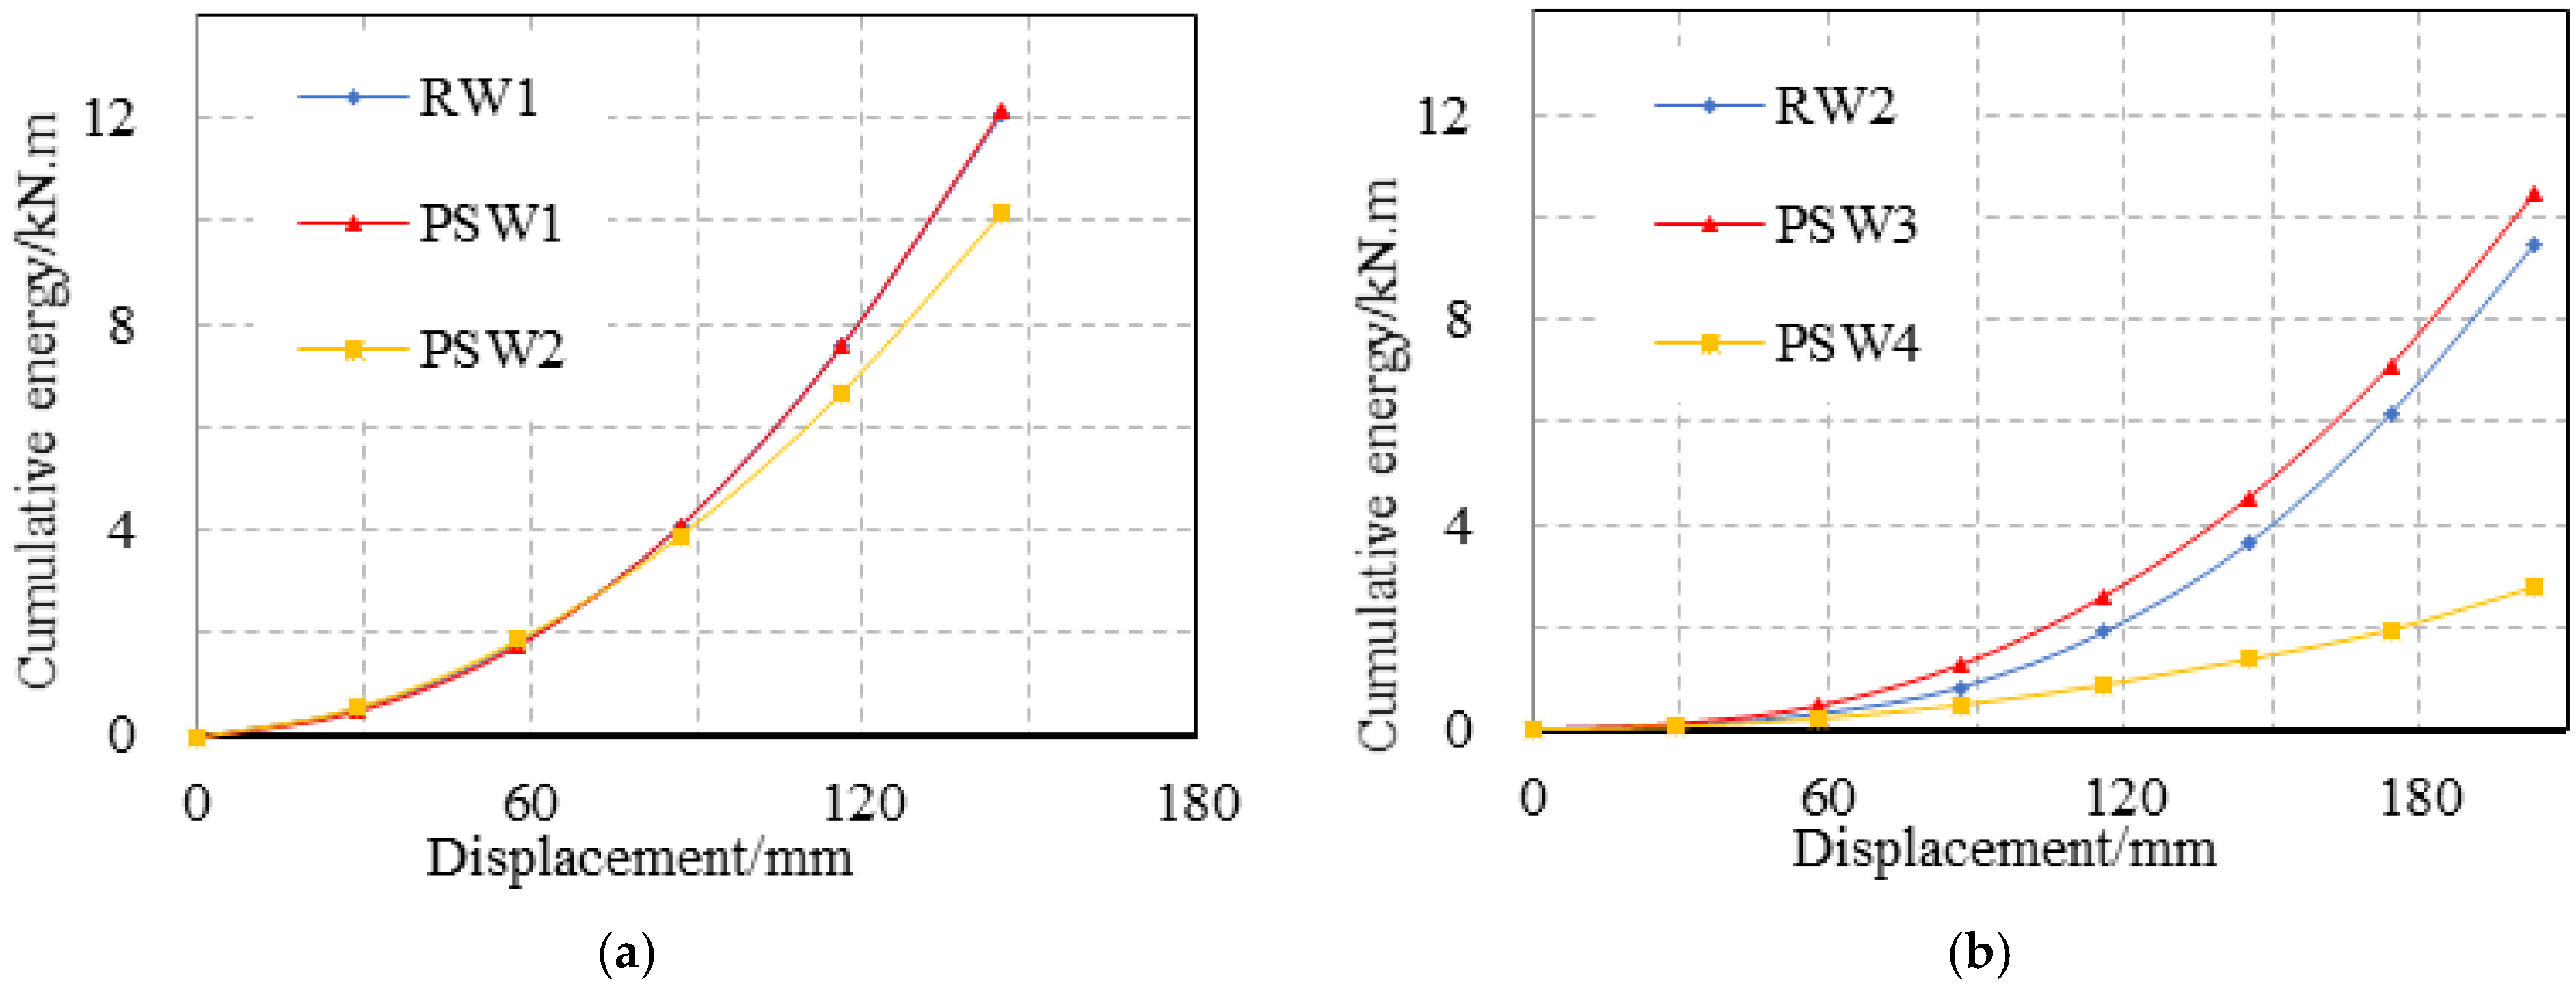
The cumulative energy dissipation, obtained by summing the energy dissipated per displacement level, is plotted for the specimens in Figure 13.
Figure 13.
Specimen Cumulative Energy Dissipation Curves: (a) Group 1 (ACR = 0.12); (b) Group 2 (ACR = 0).
Figure 13 shows that:
- (1)
- Before cracking, all specimens remained essentially elastic, exhibiting minimal energy dissipation. As lateral displacement increased and cycle numbers rose, the shear walls entered the inelastic stage, and their energy dissipation capacity increased markedly. For the specimens with ACR = 0.12, during the failure stage, despite ongoing concrete damage and decreasing load, the significant increase in displacement substantially elevated the total energy dissipated.
- (2)
- The double-row connected precast specimens demonstrated energy dissipation capacity comparable to the cast-in-place counterpart under the same ACR, demonstrating that the grouted corrugated duct connection provides robust energy dissipation capability.
- (3)
- The single-row connected specimens exhibited significantly reduced energy dissipation capacity after yielding compared to the cast-in-place specimens. Under the 0.12 axial load ratio, the cumulative energy dissipation of specimen PSW2 was 11.8% lower than that of reference specimen RW1. This performance reduction stems from two primary mechanisms: ① While double-row connections enable full sectional participation in plastic deformation through balanced reinforcement distribution, the single-row configuration concentrates plastic energy dissipation within the localized zone surrounding the central reinforcement, preventing effective engagement of concrete at the wall edges. ② The single-row connection induces notable stress concentration in the central reinforcement layer, accelerating bond stress attainment at the steel-grout interface and consequently triggering premature bond-slip.
Under zero axial load conditions, specimen PSW4 demonstrated a greater reduction in energy dissipation degradation, with its capacity falling below 40% of that of RW2. This marked reduction occurs because the absence of axial load promotes a rocking wall mechanism in the single-row connected specimen, where lateral loading primarily induces rigid body displacement rather than generating substantial material-level energy dissipation.
3.7. Discussion
This study presents an experimental evaluation of the out-of-plane seismic performance of precast concrete shear walls with grouted corrugated duct connections, particularly those with single-row layouts. The experimental results indicate that both precast and cast-in-place walls failed in flexure, a mode unaffected by the number of connection rows. However, the out-of-plane strength of precast walls was slightly lower than that of cast-in-place walls. While the double-row connected precast walls exhibited energy dissipation and deformation capacities comparable to those of the cast-in-place counterparts, their single-row counterparts demonstrated considerable deformation capacity but reduced energy dissipation due to rocking behavior.
The hysteretic performance of all specimens was evaluated according to the NEHRP [27] guidelines. Specimens satisfying all criteria are therefore considered to exhibit equivalent performance to cast-in-place construction, with detailed results listed in Table 6.
Table 6.
Performance Evaluation of Specimens.
The table indicates that all precast specimens, except the single-row connected specimen under zero axial load, can be considered to have equivalent seismic performance. The seismic performance of single-row connected walls under no axial load was significantly inferior. Therefore, structural strengthening measures should be implemented for single-row connected precast shear walls when anticipated axial loads are low.
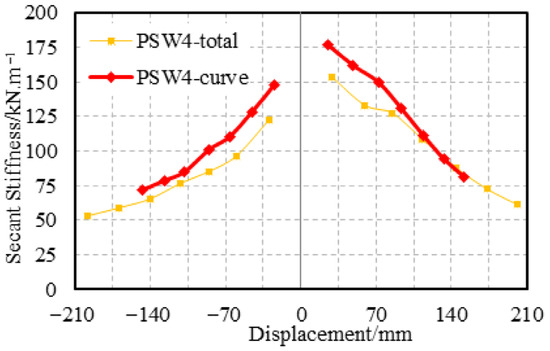
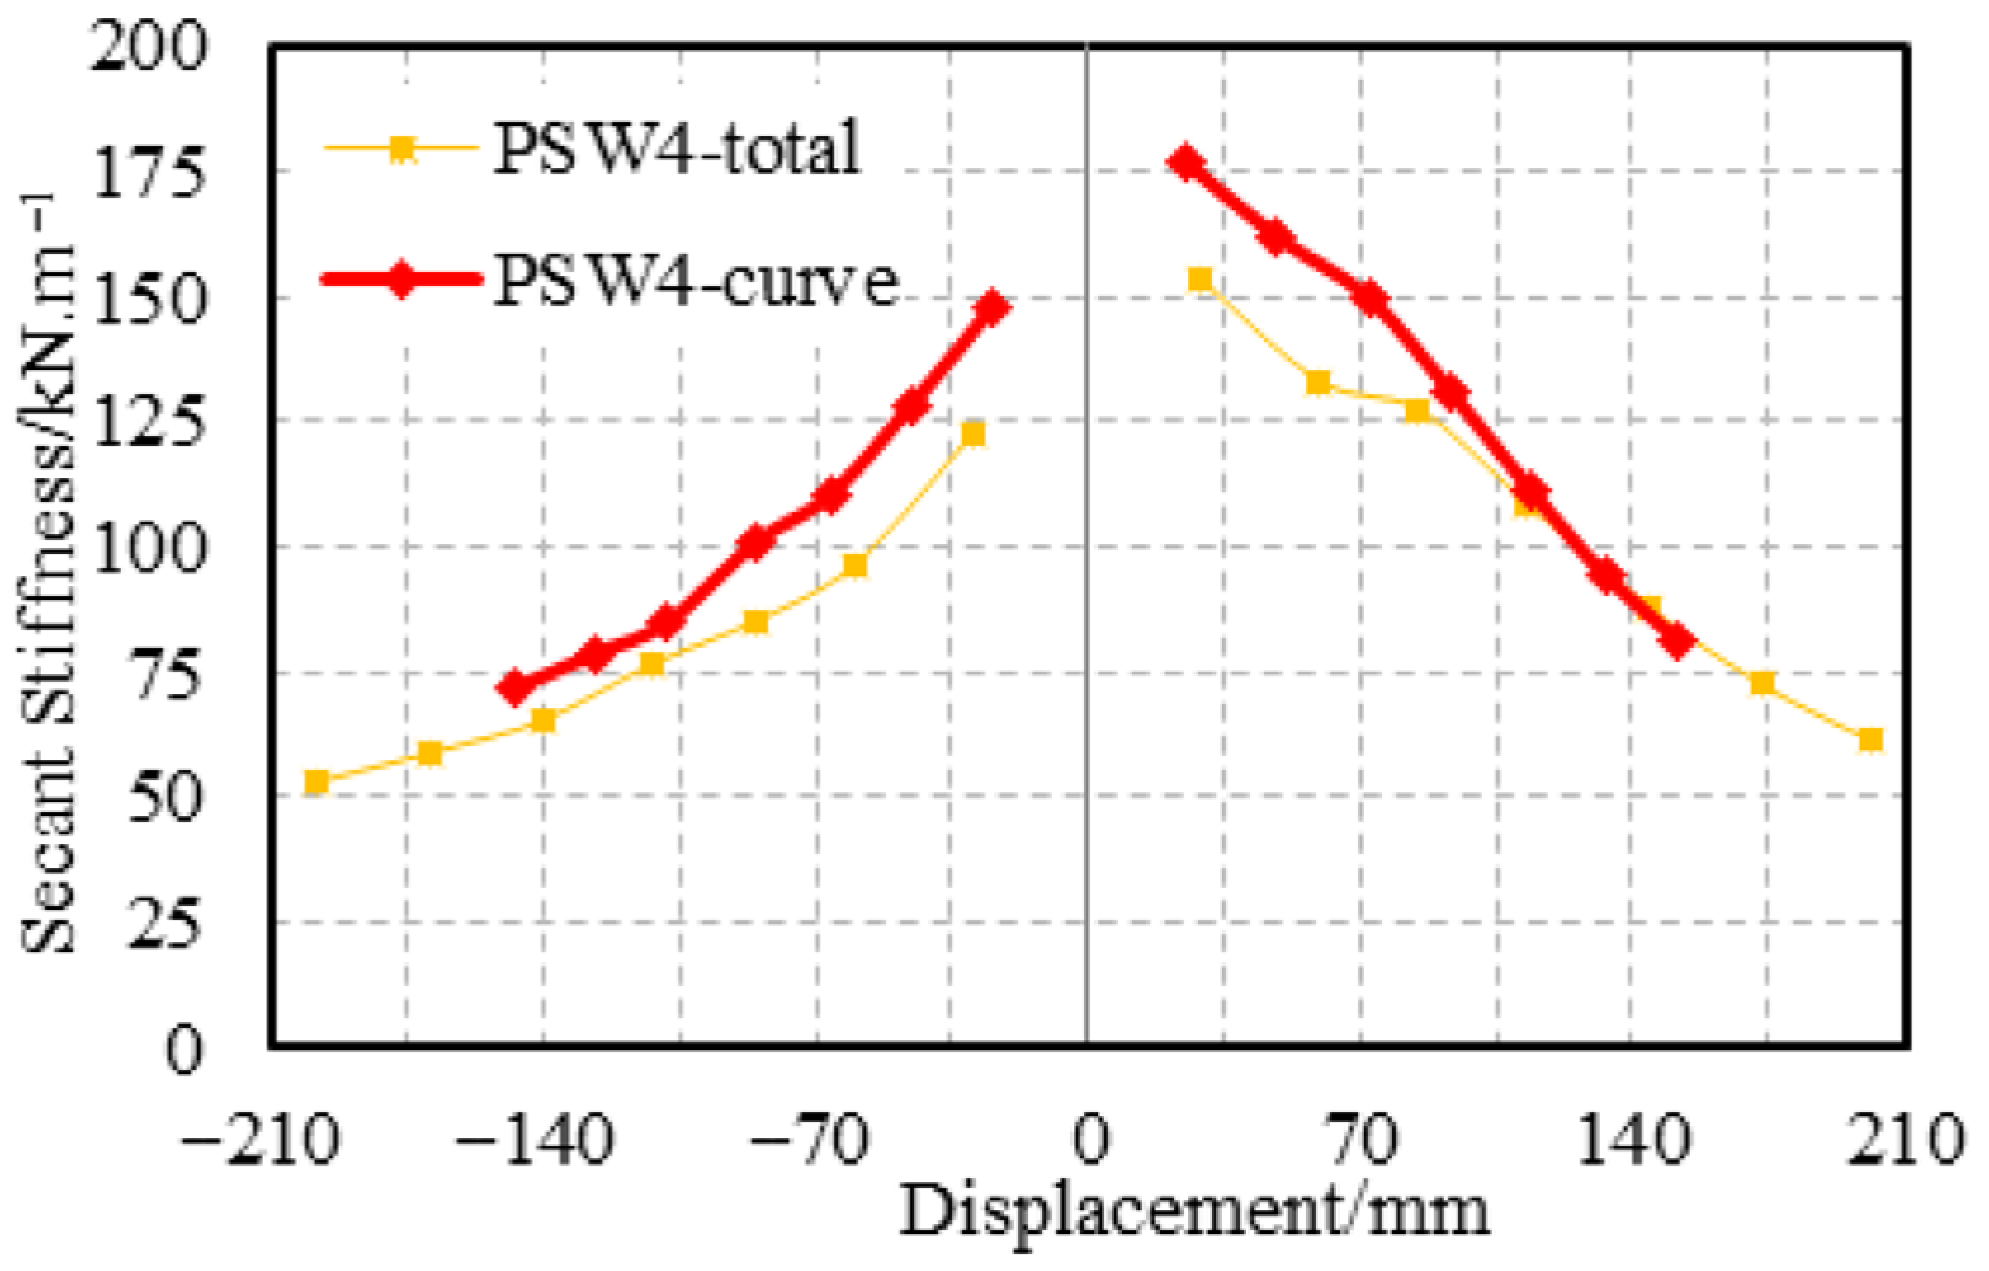
Under zero axial load, the maximum uplift at the edge of the single-row connected precast specimen PSW4 during the failure stage was approximately 13.79 mm. The lateral displacement of the wall comprises two components: flexural displacement and rocking displacement. By converting the uplift displacements measured by displacement transducers on both sides of the wall, the rocking displacement was determined. The flexural displacement was then obtained by subtracting the rocking displacement from the total displacement, enabling the derivation of the stiffness degradation curve under flexural displacement. A comparison between the stiffness degradation curves under total displacement and those under flexural displacement is presented in Figure 14.
Figure 14.
Comparison of stiffness degradation curves for Specimen PSW4.
The results indicate that rocking significantly adversely affects the stiffness of the single-row connected precast specimen under zero axial load. During the cracking stage, the reduction in wall stiffness due to rocking displacement was approximately 13.4% in the positive loading direction and 17.1% in the negative loading direction. As loading progressed, this effect became more pronounced, with the stiffness reduction attributable to rocking displacement reaching approximately 25% in the later loading phase.
4. Conclusions
This study provides the first systematic experimental investigation into the out-of-plane seismic performance of precast concrete shear walls with grouted corrugated duct connections. The key findings are as follows:
- (1)
- All specimens failed in flexure, characterized by tensile yielding of the vertical reinforcement followed by concrete crushing at the wall base. The number of connection rows had a negligible influence on the final failure mode, whereas the presence of axial load significantly altered the damage accumulation process and hysteretic behavior.
- (2)
- Under an axial compression ratio of 0.12, both the precast and cast-in-place specimens exhibited noticeable pinching in their hysteresis loops, primarily attributable to reinforcement yielding, concrete damage, and slight bond-slip of the connecting bars. The cumulative energy dissipation capacity of the precast specimens with double-row connections was comparable to that of the cast-in-place specimens, and their stiffness degradation patterns were generally consistent. Although the positive bearing capacity of the precast specimens was up to 14% lower than that of the cast-in-place specimen, their ductility was significantly superior. The ductility coefficients of the double-row and single-row connected specimens reached 3.92 and 5.37, respectively, far exceeding the value of 2.73 for the cast-in-place specimen. This suggests that the joint region, formed by the corrugated ducts and grouting material, provided effective confinement and delayed the concrete crushing process.
- (3)
- Under zero axial load, none of the specimens exhibited degradation in bearing capacity by the end of the test. The precast specimens with double-row connections maintained energy dissipation and deformation capacities similar to those of the cast-in-place specimens. In contrast, the single-row connected specimen (PSW4) demonstrated a significant rocking mechanism, with the rocking displacement accounting for 49% of the total lateral displacement. Its hysteresis loops showed severe inverse S-shaped pinching, and the cumulative energy dissipation was less than 40% of that of the cast-in-place specimen, exhibiting a characteristic of “high deformability but low energy dissipation”.
- (4)
- The performance evaluation confirms that precast shear walls with double-row grouted corrugated duct connections can achieve seismic performance equivalent to cast-in-place construction, validating their use in emulative design. However, single-row connections under low axial load ratios exhibit inadequate performance due to excessive rocking and poor energy dissipation. Therefore, for practical applications where low axial loads are anticipated, single-row connections require supplementary detailing measures (e.g., enhanced local reinforcement, high-performance grout, or mechanical anchors) to mitigate rocking and improve energy dissipation capacity.
Recommendations for Future Research:
To improve the performance of single-row connected walls, the following measures are recommended:
- (1)
- Local reinforcement enhancement near the wall-foundation interface to mitigate stress concentration;
- (2)
- Use of high-performance grouting materials with improved bond-slip properties;
- (3)
- Optimization of the single-row layout with supplemental mechanical anchors or shear keys.
Future studies should also consider the following aspects:
- (1)
- Quantification of reinforcement slip using advanced measurement techniques such as digital image correlation (DIC) or fiber optic sensors;
- (2)
- Development of analytical models that explicitly account for rocking and slip mechanisms;
- (3)
- Parametric studies investigating the effects of wall aspect ratio, reinforcement ratio, and duct geometry.
Limitations of the Study:
This study has several limitations that should be addressed in future work:
- (1)
- The test was terminated due to the actuator stroke limit for specimens under zero axial load, preventing observation of their complete failure process and accurate determination of their ultimate deformation capacity.
- (2)
- Slip behavior in the grouted connections, particularly for the single-row specimen under no axial load, was clearly observed but not quantitatively measured, limiting the mechanistic interpretation of bond-slip effects.
- (3)
- The total energy dissipation calculated in this study from the area enclosed by the load–displacement hysteresis loops represents a combined effect of various mechanisms within the specimen, including concrete behavior, reinforcement response, and interfacial bond-slip. The proportional energy dissipation contributed by steel and concrete, respectively, has not been precisely quantified.
Author Contributions
Conceptualization, W.X.; Methodology, W.X. and Y.L.; Validation, X.G.; Formal analysis, Z.X.; Investigation, Z.X.; Data curation, Z.X.; Writing—original draft, X.G.; Supervision, W.X. and Y.L.; Project administration, W.X.; Funding acquisition, W.X. All authors have read and agreed to the published version of the manuscript.
Funding
This research was funded by the National Key R&D Program of China, grant number 2022YFC3801400, and the National Natural Science Foundation of China, grant number 52208181.
Data Availability Statement
The datasets in the current study are available from the corresponding author upon reasonable request.
Conflicts of Interest
The authors declare that there are no conflicts of interest.
References
- Xue, W.; Hu, X. Research on Structural Systems of Precast Concrete Residential Buildings in Shanghai. Hous. Sci. 2014, 34, 5–9. [Google Scholar]
- Smith, B.J.; Kurama, Y.C.; McGinnis, M.J. Behavior of Precast Concrete Shear Walls for Seismic Regions: Comparison of Hybrid and Emulative Specimens. J. Struct. Eng. 2013, 139, 1917–1927. [Google Scholar] [CrossRef] [Scilit]
- JGJ1-2014; Technical Specification for Precast Concrete Structures. China Architecture & Building Press: Beijing, China, 2014.
- GB/T 51231-2016; Technical Standard for Precast Concrete Buildings. China Architecture & Building Press: Beijing, China, 2016.
- Chen, Y.; Liu, J.; Guo, Z.; Zhang, J. Seismic Performance Test on Horizontal Joint with Grouted Lap Splice for Precast Shear Walls. J. Harbin Inst. Technol. 2013, 45, 83–89. [Google Scholar]
- Wu, D.; Liang, S.; Guo, Z.; Xiao, Q. Calculation of Compression-Bending Bearing Capacity for Improved Grouted Lap-Spliced Precast Shear Walls. J. Harbin Inst. Technol. 2015, 47, 112–116. [Google Scholar]
- Xue, W.; Huang, Q.; Gu, X. Hysteretic Behavior of Precast Concrete Shear Walls with Steel Sleeve–Corrugated Metallic Duct Hybrid Connections. Structures 2022, 38, 820–831. [Google Scholar]
- Xue, W.; Yang, J.; Hu, X. Experimental and Theoretical Research on Precast Concrete Sandwich Insulation Walls; Tongji University: Shanghai, China, 2013; pp. 35–190. [Google Scholar]
- Xue, W.; Hu, X.; Xu, Z. Experimental Study on Seismic Performance of Precast Concrete Shear Walls Based on New Reinforcement Connection Scheme; Tongji University: Shanghai, China, 2016; pp. 23–99. [Google Scholar]
- Xu, P.; Huang, J.; Chen, F. Shear Wall Structural Damage in Past 50 Years and Its Enlightenment to Seismic Design. J. Build. Struct. 2017, 38, 1–13. [Google Scholar]
- Senel, S.M.; Kayhan, A.H.; Palanci, M. Assessment of Damages in Precast Industrial Buildings in the Aftermath of Pazarcık and Elbistan Earthquakes. J. Earthq. Eng. 2024, 29, 1–30. [Google Scholar] [CrossRef] [Scilit]
- Su, R.K.; Wong, S.M. Seismic Behaviour of Slender Reinforced Concrete Shear Walls under High Axial Load Ratio. Eng. Struct. 2007, 29, 1957–1965. [Google Scholar] [CrossRef] [Scilit]
- Singhal, V.; Rai, D.C. In-Plane and Out-of-Plane Behavior of Confined Masonry Walls for Various Toothing and Openings Details and Prediction of Their Strength and Stiffness. Earthq. Eng. Struct. Dyn. 2016, 45, 2551–2569. [Google Scholar] [CrossRef] [Scilit]
- Rosso, A.; Almeida, J.P.; Beyer, K. Stability of Thin Reinforced Concrete Walls under Cyclic Loads: State-of-the-Art and New Experimental Findings. Bull. Earthq. Eng. 2016, 14, 455–484. [Google Scholar] [CrossRef] [Scilit]
- Rosso, A.; Jiménez-Roa, L.A.; de Almeida, J.P.; Zuniga, A.P.G.; Blandón, C.A.; Bonett, R.L.; Beyer, K. Cyclic Tensile-Compressive Tests on Thin Concrete Boundary Elements with a Single Layer of Reinforcement Prone to Out-of-Plane Instability. Bull. Earthq. Eng. 2018, 16, 859–887. [Google Scholar] [CrossRef] [Scilit]
- Cheng, Y.; He, H.; Sun, H.; Cheng, S. Experimental Study and Mechanical Mechanism Analysis on Out-of-Plane Seismic Performance of Reinforced Concrete Shear Walls. J. Vib. Eng. 2025, 38, 1599–1615. [Google Scholar]
- Arsalan, N.; Stefano, P.; Rajesh, P.D. Seismic Behavior of Rectangular Reinforced Concrete Walls Prone to Out-of-Plane Shear-Axial Failure under Bidirectional Loading. Am. Soc. Civ. Eng. 2022, 148, 04022166. [Google Scholar] [CrossRef] [Scilit]
- Hassan, T.K.; Rizkalla, S.H. Analysis and Design Guidelines of Precast, Prestressed Concrete, Composite Load-Bearing Sandwich Wall Panels Reinforced with CFRP Grid. PCI J. 2010, 55, 147–162. [Google Scholar] [CrossRef] [Scilit]
- Frankl, B. Structural Behavior of Insulated Precast Prestressed Concrete Sandwich Panels Reinforced with CFRP Grid; University of North Carolina: Chapel Hill, NC, USA, 2008. [Google Scholar]
- Gu, Q.; Huang, R.; Zhang, Y.; Deng, Q.; Ke, Y. Experimental Study on Out-of-Plane Mechanical Performance of Single-Side Composite Shear Wall with Horizontal Joints. Build. Struct. 2021, 51, 73–80. [Google Scholar]
- Fu, Q.; Ding, T.; Zhu, T.; Zhang, S. Out-of-Plane Stability Analysis of Assembled Monolithic Shear Walls with Unconnected Vertical Distributed Reinforcement. Build. Struct. 2023, 53, 24–29. [Google Scholar]
- Xue, W.; Huang, Q.; Li, Y. Experimental Study of Precast Concrete Shear Walls with Spiral-Confined Lap Connections under Cyclic Loads. J. Build. Eng. 2022, 52, 104467. [Google Scholar] [CrossRef] [Scilit]
- Cao, Z.; Li, Q. Effect of Connection Deficiency on Seismic Performance of Precast Concrete Shear Wall-Frame Structures. J. Earthq. Tsunami 2019, 13, 1940005. [Google Scholar] [CrossRef] [Scilit]
- Xue, W.; Huang, Q.; Xu, Z. Out-of-Plane Response of Prefabricated Concrete Shear Walls Connected via Grouted Sleeves. Struct. Concr. 2024, 25, 3570–3582. [Google Scholar] [CrossRef] [Scilit]
- Precast/Prestressed Concrete Institute (PCI). PCI Design Handbook: Precast and Prestressed Concrete, 8th ed.; The Donohue Group, Inc.: Chicago, IL, USA, 2017. [Google Scholar]
- Park, R. Evaluation of Ductility of Structures and Structural Assemblages from Laboratory Testing. Bull. N. Z. Natl. Soc. Earthq. Eng. 1989, 22, 155–166. [Google Scholar] [CrossRef] [Scilit]
- National Earthquake Hazards Reduction Program (NEHRP). Recommended Seismic Provisions for New Buildings and Other Structures; Building Seismic Safety Council: Washington, DC, USA, 2020. [Google Scholar]

Disclaimer/Publisher’s Note: The statements, opinions and data contained in all publications are solely those of the individual author(s) and contributor(s) and not of MDPI and/or the editor(s). MDPI and/or the editor(s) disclaim responsibility for any injury to people or property resulting from any ideas, methods, instructions or products referred to in the content. |
© 2025 by the authors. Licensee MDPI, Basel, Switzerland. This article is an open access article distributed under the terms and conditions of the Creative Commons Attribution (CC BY) license.