Abstract
In university campus design, the relationship between spatial elements and students’ sense of belonging has attracted growing interest. However, existing research tends to examine isolated space types rather than the integrated psychological experience of the campus as a whole. To holistically understand how campus space influences belonging, it is essential to investigate how—and to what extent—campus spatial satisfaction shapes students’ sense of belonging. The prevalent semi-enclosed management model of most Chinese university campuses offers a distinct context for examining how satisfaction with functional spaces affects this sense of belonging. This study investigates the relationship between students’ satisfaction with functional spaces and their sense of campus belonging through a multidimensional evaluation framework and comparative quantitative analysis. The findings demonstrate that (1) campus belonging is influenced not by the simple accumulation of satisfaction with individual space types but by four underlying behavioral dimensions—diversity of extended activities, residential comfort, learning convenience, and transportation comfort—which collectively explain approximately 50% of the variance in belonging; (2) the overall campus spatial layout significantly moderates the satisfaction–belonging relationship, with integrated residential-activity configurations promoting spontaneous use and strengthening belonging; and (3) among personal attributes, behavioral factors such as internet usage and physical activity patterns exhibit stronger effects than demographic variables. These results highlight the importance of a holistic, behavior-oriented approach to campus planning to enhance students’ psychological adaptation and sense of belonging.
1. Introduction
As China’s higher education enters the stage of massification, the psychological well-being and campus adaptation of college students have become issues of growing concern. According to the National Mental Health Development Report (2023–2024) released by the Institute of Psychology of the Chinese Academy of Sciences, mental health problems among Chinese college students aged 15–26 are prominent, with nearly half at risk for anxiety and over 20% at risk for depression [1]. In response, a growing body of research has begun to explore the relationship between the university campus environment and students’ mental health [2,3]. This focus is particularly relevant in the Chinese context, where most higher education institutions adopt a semi-closed or fully closed management model—a distinctive feature that sets them apart from the open campuses typical of many Western countries [4]. Most of the students’ daily activities, including studying, dining, and even purchasing daily necessities and medical services, take place within the clearly defined campus boundaries. This characteristic reached its peak during the COVID-19 pandemic, when students were prohibited from leaving campus for several months.
As a critical indicator of the emotional bond between students and their campus, a sense of belonging demonstrates significant value on multiple fronts. Individually, it directly impacts students’ psychological well-being and academic performance [5,6]. Collectively, it engages in a positive feedback loop with campus culture: a rich cultural heritage enhances students’ sense of belonging, which in turn motivates them to identify with and carry forward that culture [4]. Ultimately, this dynamic forms a core competitive advantage for higher education institutions, providing endogenous momentum for their sustainable development [7].
Research on the sense of belonging can be traced back to Maslow’s hierarchy of needs, specifically the need for belongingness and love, which reflects humans’ innate desire to establish emotional connections [8]. The concept was later introduced into the educational context, where it was defined as the degree to which students feel accepted, respected, supported, and included in the school environment, termed “school belongingness” [9]. Subsequent studies have indicated that school belongingness depends on perceived social support within the campus [10], satisfaction with social connections and interactions [11], and active engagement with peers, teachers, and campus activities [12]. At the individual level, factors such as academic performance [13], social skills [14], mental health [15], and gender [16] influence this sense of belonging. In contrast, at the institutional level, it is related to policy environment, cultural atmosphere [17,18], and teacher–student relationships [18]. Among these factors, the physical campus environment plays a significant role [19,20].
Existing research predominantly focuses on how various subsystems of campus space directly impact students’ sense of belonging. For example, one study simplified the influence of campus space on students’ satisfaction with the natural environment, planning layout, and campus greening, purification, and beautification, examining their effects on belongingness [6]. Another line of argument posits that satisfaction with extracurricular activity environments affects belongingness [21], while other research has emphasized students’ satisfaction with facilities and venues [22]. The impact of physical living spaces, such as dormitories, apartments, and halls, has also been highlighted [23]. It is evident that most scholars agree that campus space influences students’ sense of belonging primarily through their functional experiences within these environments. Methodologically, research often employs questionnaires to quantify students’ satisfaction with functional spaces, thereby measuring these experiential factors.
Studies on campus space satisfaction generally fall into two categories. The first evaluates the overall or parts of the campus environment through dimensions such as students’ sense of security and comfort, focusing on the quality of specific functional services and their influencing factors. Examples include how microclimate conditions affect outdoor spatial activities [24,25] or how enclosure and security facilities influence perceived safety [26]. It has been observed that physical factors in learning spaces affect learner satisfaction [27], and a significant positive correlation between facility layout and learning efficiency has been demonstrated [28]. The second category investigates how specific functional spaces or facilities affect overall or localized satisfaction. For instance, well-designed library environments can strengthen students’ identification with academic zones [29], and landscape elements along with spatial arrangement patterns significantly impact outdoor campus environments [30,31]. Collectively, these studies affirm that university spatial environments should accommodate diverse student activities and enhance the experiential quality of these activities. However, Maslow’s hierarchy of needs [32] places functional satisfaction at the foundational level, while the sense of belonging pertains to higher-level psychological needs. Given that much spatial satisfaction is evaluated from a functional perspective, the extent to which it influences a sense of belonging remains unclear.
Furthermore, students’ sense of belonging to their university is a holistic concept. In contemporary universities, the relationship between functional spaces and behavioral activities is not strictly one-to-one, although it may have been in early campus designs. Chinese university planning has its roots in a direct inheritance from 19th- and 20th-century U.S. and Soviet models, characterized by clear functional zoning—typically into teaching, student living, and faculty residential areas—and the symmetrical axial arrangement of main buildings. These principles profoundly shaped campus design in China prior to the reform and opening-up era [33]. Since the early 1990s, Chinese university campus planning has exhibited a trend toward partial functional integration [34], exemplified by teaching complexes primarily dedicated to instruction or experimentation, with other functions serving as supplementary facilities [35]. Additionally, spaces such as dormitories, dining halls, student activity areas, and commercial zones have been integrated into comprehensive living communities [36]. Consequently, a specific functional space within a campus may support one or more particular behavioral activities; however, this does not preclude other activities occurring within the same space. This complexity indicates that overall satisfaction with campus functional spaces cannot be reduced to the sum of satisfaction levels for individual, decomposed functional zones.
Since research on campus belongingness predominantly originates from psychology and sociology, there is a lack of detailed analysis of the campus spatial environment. Conversely, in the field of architecture, given significant differences across campus functional spaces, studies tend to focus on the isolated impact of specific space types on student satisfaction. Consequently, the nature of the relationship between students’ satisfaction with different campus functional spaces and their sense of campus belonging remains an area requiring further in-depth investigation.
This study, therefore, seeks to address the following research questions:
- (1)
- As a foundational issue, is students’ overall satisfaction with campus space merely an additive result of their satisfaction with individual functional zones?
- (2)
- As the core focus, to what extent and how does students’ satisfaction with campus functional spaces influence their sense of campus belonging?
- (3)
- As an applied objective, what planning and design implications can be derived from the findings to enhance campus spatial layouts and student belonging?
2. Materials
2.1. Study Sample
This survey aims to gather opinions and experiences regarding the impact of campus function satisfaction on campus belongingness among Chinese university students. The study employs an online questionnaire to investigate three geographically distant universities in Fujian Province, Hainan, and Heilongjiang: HQ University, HN University, and HE University. The campuses vary in size, with HQ covering approximately 7.14 hectares, HN approximately 18 hectares, and HE approximately 12.56 hectares. The campuses of these three universities were constructed in the 1950s, 1980s, and early 21st century, respectively, aligning with three peak periods of university development in China. They reflect distinct planning and layout characteristics: influenced by the Soviet model, shaped by Western modernism following the reform and opening-up, and adopting a more flexible and open approach in the new century. Additionally, two of these three institutions are classified as “Project 211” universities in China, while the other is a Tier 1 institution that recruits students nationwide and internationally, with its student body coming from various regions across the country. This gives the sample data collected in this study a relatively broad geographical representativeness. Satellite imagery and functional distribution maps of the campuses will be provided in subsequent sections.
2.2. Questionnaire and Participants
The problem formulation comprises three components.
(1) Data collection on individual social attributes and campus living environment characteristics:
This section is designed to collect data on individual social attributes and campus living environment characteristics, with variable selection grounded in the existing literature. The duration of enrollment is included, as extended residence has been shown to strengthen social integration and a sense of belonging in community settings [37,38]. Students’ daily living expenses are recorded as a proxy for socioeconomic background, reflecting the documented—though complex—relationship between income and community attachment [39,40]. Internet usage frequency is incorporated due to its dual role: while it supports campus engagement through information access, excessive use may weaken offline social ties [41,42]. Dormitory conditions, including occupancy density and desk availability per student, are assessed based on evidence linking perceived crowding to belongingness [43]. Additionally, sports participation type and frequency are surveyed as indicators of social integration.
A total of 399 valid questionnaires were collected across the three institutions: 164 from HQ University, 127 from HN University, and 108 from HE University. Demographic characteristics of the respondents are summarized in Table 1. Informed consent was obtained from all participants prior to the survey. The study complies with the Declaration of Helsinki and China’s “Ethical Review Measures for Life Science and Medical Research Involving Humans” (National Health Science Education Development [2023] No. 4), meets the criteria for ethical exemption, and has received formal exemption approval.

Table 1.
Basic demographic data of respondents.
(2) Data collection on the frequency of use and satisfaction with various functional spaces on campus:
To explore the relationship between functional spaces and campus belonging, it is necessary to categorize campus spaces. As specialized communities, university campuses can adopt urban planning classifications that divide city functions into residential, recreational, work, and transportation categories [44]. Teaching functions resemble urban work zones, while recreational functions include leisure, sports, and group activity spaces. Based on this, campus functional spaces are classified into six categories (Table 2):
Table 2.
Distribution of various functional spaces on campus corresponding to actual functional buildings.
Initially, students estimate their usage frequency of these spaces. Subsequently, they evaluate overall satisfaction and rate the spaces across eleven specific aspects. The questionnaire development involved expert panel discussions to assess the need to comprehensively evaluate each functional space, leading to the screening and refinement of questions to streamline the survey instrument (Table 3).
Table 3.
Questionnaire design for assessing satisfaction with the utilization of various functional spaces on campus.
(3) Data Collection on University Students’ Sense of Campus Belonging
This study developed a questionnaire based on existing research on campus belongingness [45,46,47], comprising four dimensions: a sense of ownership towards the university, recognition and affection for the institution, fulfillment of social needs, and fulfillment of esteem needs, totaling 16 items (Table 4).
Table 4.
Index system of the sense of belonging to the campus.
2.3. Data Collection and Indicator Selection
The questionnaire data are first examined for validity using the KMO measure and Bartlett’s test in SPSS 28.0; a KMO coefficient above 0.70 indicates high construct validity. Following this, factor analysis is applied to assess the dimensional structure of the campus sense of belonging items, informing revisions to the questionnaire. The KMO value for the campus belonging scale is 0.968 (Table 5), and since all validity tests were passed, factor analysis was conducted.
Table 5.
KMO test for the satisfaction evaluation of functional spaces in three schools.
Factor analysis employing principal component analysis is conducted on the sense of belonging evaluation indicators within an exploratory four-dimensional framework (Table 6). The analysis reveals that Item 1, initially hypothesized to load with Items 2 and 3 in a single dimension, actually loads onto separate principal components, leading to the removal of these items. Furthermore, Item 8 (“The school’s life service platform is relatively well-developed”) demonstrates high cross-loadings across two principal components. In contrast, Item 10 (“In this school, I perceive a rich diversity among teachers and students”) shows similar loadings across three components. This pattern suggests ambiguous respondent interpretations of these statements, and consequently, both items are excluded from the subsequent analysis.
Table 6.
Results of principal component analysis for the first attributional sense evaluation metric.
Factor analysis is performed on the remaining 13 items. The results show a KMO value of 0.957 and a significant Bartlett’s test result, both exceeding the threshold of 0.9, confirming that the questionnaire retains construct validity following the removal of the previous items. As presented in Table 7, the principal component analysis yields components that align with the predefined four-dimensional structure.
Table 7.
Results of principal component analysis for the second sense of belongingness evaluation index.
Subsequently, the weights of individual indicators are determined by calculating the influence coefficients of the dominant factors within each principal component, followed by renumbering (Table 8). Based on these weights, a comprehensive evaluation score for each sample across various dimensions is computed for subsequent analysis. The final distribution of students’ sense of belonging across different dimensions in each institution is presented in Table 9.
Table 8.
Evaluation index system and weights for college students’ sense of belonging on campus after screening.
Table 9.
Mean and standard deviation of perceived sense of belonging across all dimensions in the three schools.
2.4. Procedure
To address the three research questions in a logically structured manner, this study employs a sequential, exploratory analytical approach, given the complexity of the relationship between spatial satisfaction and campus belonging. The statistical procedures are designed to build upon prior results, rather than being predetermined.
Step 1: Aggregation and Validation of Spatial Satisfaction Indicators
To examine whether overall spatial satisfaction is merely an additive outcome of satisfaction with individual functional zones, factor analysis with weighting methods is applied to aggregate satisfaction scores for each space type. The distribution of these aggregated scores is then compared with the direct survey-based overall satisfaction scores. The measure exhibiting lower dispersion is selected for subsequent analysis, ensuring a more robust and representative satisfaction indicator.
Step 2: Control Variable Analysis
Before modeling the core relationship between satisfaction and belonging, t-tests and ANOVA are used to assess the potential influence of personal social attributes and campus living environments on both satisfaction and belongingness. This step helps identify and account for significant background variables prior to further regression modeling.
Step 3: Core Relational Modeling
Correlation and multiple regression analyses are employed to evaluate the extent to which functional space satisfaction influences sense of belonging. Importantly, principal component analysis (PCA) is not applied universally; it is only used when significant partial correlations are detected among satisfaction variables, indicating potential multicollinearity. In such cases, PCA is performed on overall satisfaction data—incorporating spatial distribution and usage frequency—to derive interpretable components that are then used as predictors in the regression model. This conditional use of PCA ensures dimensionality reduction is both meaningful and context-driven.
Step 4: Comparative Spatial Analysis
Finally, a comparative analysis is conducted across the three case universities to examine relationships among spatial layouts, satisfaction patterns, and belonging outcomes. This analysis is informed by Lynchian mapping [48] to interpret spatial configurations and their perceptual impacts. However, as translating analytical findings into concrete design practice requires more complex interdisciplinary reasoning and falls outside the core scope of this study, this step is presented in the discussion rather than as a primary analytical phase. This synthesis directly supports the applied objective of deriving planning and design implications for campus spatial optimization.
3. Results
3.1. Evaluation Metrics Weights for University Students’ Campus Space Satisfaction and Overall Satisfaction Calculation
Although the overall satisfaction of university students with various functional spaces has been directly assessed through questionnaire surveys, a more precise characterization of overall satisfaction requires consideration of the contributions of factors influencing each functional space. Given differences in the actual layouts and compositions of spaces across the three institutions, this study calculates the weights for space satisfaction indicators for each university to account for these variations. For each space, data are standardized, weights are derived via factor analysis, and overall satisfaction scores for each functional space are computed. The mean and standard deviation of these results are presented in Table 10.
Table 10.
Mean and standard deviation of overall satisfaction scores for functional spaces across the three institutions.
The three-school data are consolidated, and the overall satisfaction levels for various spatial categories, calculated using the aforementioned methods, are compared with those obtained from student surveys (Table 11). The analysis reveals that, aside from teaching and sports spaces, the mean rankings of the two datasets show minimal differences. This indicates that both the scores obtained through direct questionnaire assessment and the overall scores calculated through optimization demonstrate a high degree of credibility. Additionally, the standard deviations of the computed data are generally smaller than those of the survey data, indicating greater convergence in the calculated results. Consequently, the overall satisfaction scores derived from the computational method are used for subsequent analyses.
Table 11.
Comparison of overall satisfaction metrics with survey data.
3.2. Analysis of the Impact of Individual Social Attributes on Campus Life Environment
The influence of individual attributes on satisfaction with functional spaces and campus belonging is analyzed using t-tests and ANOVA (see Appendix A and Appendix B for details). Analysis reveals no significant differences based on students’ campus residence duration or monthly living expenses. However, gender shows a significant effect on transportation space satisfaction, with male students reporting slightly higher satisfaction. Internet usage time also exhibits a notable influence: as daily usage increases, overall satisfaction declines. Students who use the internet for less than four hours daily maintain stable satisfaction levels, while those who exceed eight hours report the lowest satisfaction levels. Physical activity preferences also correlate with satisfaction. Students who prefer indoor exercise report lower satisfaction with educational, transportation, and sports facilities than those who favor outdoor or mixed activities. Higher exercise frequency is associated with decreased satisfaction in these domains. In living spaces, fewer occupants correlate with higher satisfaction, which declines markedly when the number of desks per person exceeds 1.33.
Regarding campus belonging, no significant differences are identified across gender, living expenses, or dormitory occupancy levels. However, the duration of enrollment shows an association with school recognition and affection, which rise initially before declining, peaking among students enrolled for three years. Internet usage time again emerges as a significant factor: all dimensions of campus belonging generally decrease as daily online time increases. The fulfillment of respect needs varies with the average number of desks per person in dormitories, showing an initial rise followed by a decline. Social need fulfillment differs by physical activity preferences: students who favor outdoor or mixed activities report higher social fulfillment than those who prefer indoor-only exercise. Furthermore, as exercise frequency decreases, average scores for school ownership, social need fulfillment, and respect need fulfillment also decline.
Overall, demographic characteristics such as gender and age have limited influence on spatial satisfaction or sense of belonging, whereas factors that directly shape daily behaviors—such as internet usage patterns, physical activity preferences, and living conditions—emerge as stronger predictors.
3.3. The Impact of Overall Satisfaction with Campus Functional Spaces on Campus Sense of Belonging
3.3.1. Correlation Analysis Between Overall Satisfaction with Campus Functional Spaces and Campus Sense of Belonging
As shown in Table 12, Table 13 and Table 14, the satisfaction levels across various functional spaces in the three universities are significantly correlated with the four dimensions of campus sense of belonging. This provides direct evidence that students’ satisfaction with campus functional spaces influences their sense of belonging to the university.
Table 12.
Correlation analysis between overall satisfaction with functional spaces and sense of belonging to campus at HQ University.
Table 13.
Correlation analysis between overall satisfaction with functional spaces and sense of belonging to campus at HN University.
Table 14.
Correlation analysis between overall satisfaction with functional spaces and sense of belonging to campus at HE University.
Given the high intercorrelation observed among satisfaction levels across different functional spaces, it becomes methodologically challenging to identify which specific space type most strongly influences sense of belonging through simple comparison of correlation coefficients. This multicollinearity among predictor variables necessitates a more integrated analytical approach. Therefore, principal component analysis (PCA) is employed to derive composite indicators from the overall satisfaction data, reducing dimensionality while preserving essential information from the interrelated spatial satisfaction variables.
3.3.2. Principal Component Analysis of Overall Satisfaction with Campus Functional Spaces
As shown in Table 15, the overall satisfaction data for various functional spaces at each university passed the Kaiser–Meyer–Olkin (KMO) test, confirming the suitability for PCA. Additionally, exploratory attempts revealed that when extracting four principal components from the overall satisfaction data, the cumulative variance explained exceeded 90%. Consequently, in SPSS, four components were extracted using the maximum variance (varimax) rotation method. The resulting principal component matrices and total variance explained for each university are presented in Table 16, Table 17 and Table 18.
Table 15.
KMO test for overall satisfaction with functional spaces at the three universities.
Table 16.
Principal component matrix of overall satisfaction with functional spaces at HQ University.
Table 17.
Principal component matrix of overall satisfaction with functional spaces at HN University.
Table 18.
Principal component matrix of overall satisfaction with functional spaces at HE University.
Based on the definition of functional spaces as the spatial environments where functional activities occur, the derived principal components should be interpreted as composite constructs of interrelated functional space groupings. This intrinsic link can be understood from two perspectives: First, in practical scenarios, a single space may accommodate multiple activities, for example, a cafeteria serving both as a leisure area and a social interaction space among students. Therefore, when different types of functional spaces spatially overlap significantly, they may be grouped into a single component. Second, many student activities involve a sequence of interactions across multiple functional spaces; even spatially separated functions can be associated through common behavioral patterns, collectively forming the spatial context of specific activity experiences.
The order of the principal components reflects their relative influence on students’ satisfaction with campus functional spaces, with the loadings indicating the degree to which each functional space contributes to that component. For clarity, factor loadings below 0.45 have been omitted in the tables.
Among the three institutions, the first principal component derived from the analysis is predominantly influenced by satisfaction with the sports and recreational spaces, with additional contributions from group activity spaces. These three functional space categories encompass the majority of behavioral activities beyond accommodation, study, and transportation, thereby exemplifying the diversification of campus spatial functions. In the case of HE University, the influence coefficient of transportation space satisfaction within the first principal component ranges from 0.4 to 0.5, indicating that although transportation space is not the primary factor, it exerts a significant impact. A comparative analysis of the spatial distribution of leisure, sports, and group activity areas across the three universities reveals that HE University allocates a substantial proportion of its campus to these spaces, with a relatively uniform distribution. This results in a high degree of spatial overlap with transportation corridors, facilitating students’ access to leisure, sports, or group activity spaces from any main campus thoroughfare—whether by visual contact or physical entry. Figure 1, Figure 2 and Figure 3 present a visual representation of the spatial locations and frequencies mentioned in the questionnaire. Although it does not reflect the actual frequency of such activities in space, it can still roughly indicate the spatial locations where they occur. Consequently, the first principal component across all three institutions can be characterized as representing the expansion of activity diversity.
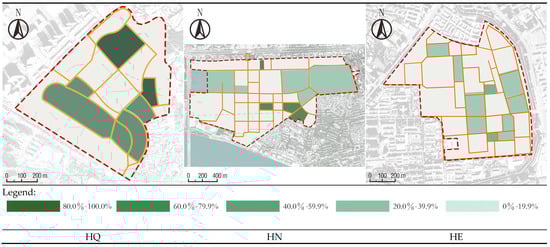
Figure 1.
Comparison of recreation space layout and frequency among the three universities.
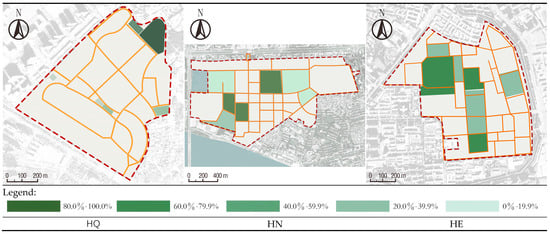
Figure 2.
Comparison of sports space layout and frequency among the three universities.
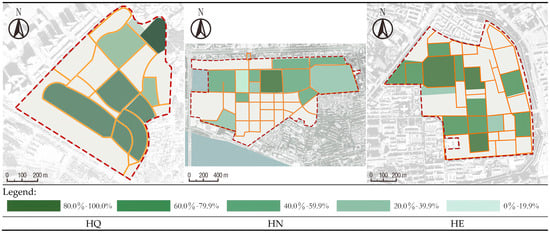
Figure 3.
Comparison of group activity space layout and frequency among the three universities.
In the principal component analysis of HQ School’s Component 2, HE School’s Component 3, and HN School’s Component 2, residential space satisfaction exerts an overwhelmingly dominant influence. Notably, in HQ School’s Component 2, the influence coefficient of leisure space satisfaction exceeds 0.5, indicating a substantial association between leisure spaces and this component. Consequently, this component can be characterized as reflecting aspects related to recreational and entertainment activities within the residential environment. Therefore, these principal components can be defined as indicators of residential comfort.
Furthermore, Principal Component 4 of HQ School, Principal Component 2 of HN School, and Principal Component 3 of HE School are primarily driven by satisfaction with teaching spaces. Specifically, in HN School’s Component 2, the influence coefficients for satisfaction with transportation and sports spaces range from 0.4 to 0.5. Although these factors do not dominate this component, their impact is notably significant. After analyzing the functional-area spatial layouts of these three schools, it was found that on the HN School campus, the route students take from their dormitories to the teaching buildings is the longest. Most students will pass through the main sports areas on their way to the learning facilities (Figure 4 and Figure 5). This phenomenon in HN School’s Component 2 can be interpreted as a consequence of learning-related commuting behaviors linking these spaces. These components can thus be characterized as indicators of the convenience of learning activity.
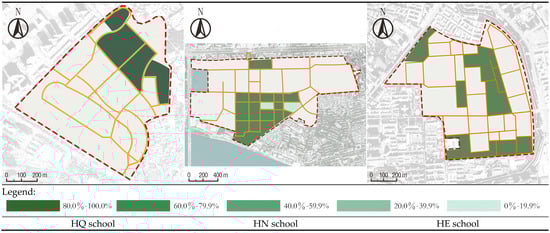
Figure 4.
Comparison of living space layout and frequency among the three universities.
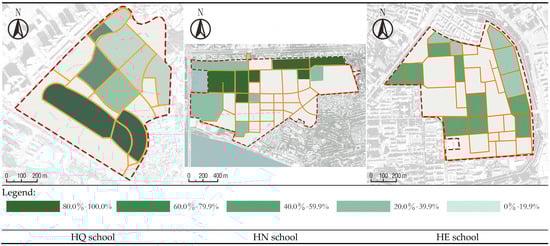
Figure 5.
Comparison of teaching space layout and frequency among the three universities.
The third principal component of HQ School and the fourth principal component of HN and HE Schools are predominantly characterized by transportation spatial satisfaction. Notably, in the third principal component of HQ School, the influence coefficient of leisure space satisfaction exceeds 0.5. A separate analysis of leisure space satisfaction at HQ School reveals high influence coefficients across Principal Components 1, 2, and 3, which may be attributed to the relatively uniform distribution of leisure spaces, preventing any single component from dominating but still exerting significant influence. Consequently, the third principal component of HQ School and the fourth principal component of HN and HE Schools are defined as indicators of transportation behavior comfort.
The analyses in Section 3.3.1 and this subsection demonstrate that students’ overall satisfaction with campus spaces is not a simple summation of satisfactions across functional types but is defined by the collective capacity of these spaces to support four critical dimensions: diverse activities, residential comfort, learning convenience, and transportation efficiency.
3.3.3. Regression Analysis of Overall Satisfaction with Campus Functional Spaces on Sense of Belonging
Based on the principal component analysis results from the previous step, the factor scores for each of the three schools were calculated separately, as shown in Formula (1).
where Sj represents the score of the sample on the j-th principal component of functional space satisfaction, and Aji represents the influence coefficient of the j-th functional space satisfaction on the i-th principal component. Xi represents the value of the i-th functional space satisfaction, and n represents the number of functional space satisfaction types, that is, n = 6.
Furthermore, regression analysis is performed to examine the relationships between the principal components of functional space satisfaction and the four dimensions of sense of belonging, as well as their total composite score. This includes both a combined analysis of the three universities’ data and separate regression analyses for each institution.
The results for the total sense of belonging score are presented in Table 19. For the combined dataset, the regression model yields an R2 value of 0.451, suggesting that while satisfaction with campus functional spaces is not the sole determinant of campus belonging, it does show a substantial relationship and accounts for 45.1% of the variance in belongingness. Among the predictors, the diversity of extended activities shows the largest absolute coefficient, followed by residential comfort, learning convenience, and, finally, transportation comfort. This order reflects the relative influence of each principal component on campus belonging. This pattern remains consistent in the regression results for both HN University and HE University. However, HQ University presents a different pattern, with residential comfort exhibiting the largest coefficient among the components.
Table 19.
Regression analysis coefficient of the total value of college students’ sense of belonging to campus.
The analysis of the sense of belonging and school ownership is presented in Table 20. Overall, the regression results indicate that the diversity coefficient of extracurricular activities has the greatest impact across all three schools; however, the rankings of the other coefficients vary. For HQ and HE schools, residential comfort has a greater influence on behavioral factors than other variables, whereas for the HN school, transportation comfort exerts a greater influence than the other two variables.
Table 20.
Regression coefficients for the sense of belonging and ownership among university students within the campus environment.
The analysis of school recognition and affinity, as shown in Table 21, indicates that for HN and HE schools, the regression results identify the diversification of extracurricular activities as the most significant factor influencing sense of belonging. Conversely, for HQ school, residential comfort has a greater impact than the variety of extracurricular activities.
Table 21.
Regression coefficients for campus belongingness, institutional recognition, and affinity among university students.
The analysis of social belongingness needs, as presented in Table 22, indicates that the diversity of extracurricular activities at HN and HE schools significantly enhances students’ sense of campus belonging. Conversely, for students at HQ school, the comfort of the residential environment exerts a greater influence on their sense of belonging than the variety of extracurricular activities.
Table 22.
Regression coefficients for the realization of social needs related to campus belongingness among university students.
The analysis of the realization of the need for a sense of belonging, as shown in Table 23, indicates that the regression results still demonstrate the highest coefficient for residential comfort at HQ School. Conversely, HN School and HE School exhibit the highest coefficients in the diversity of extracurricular activities.
Table 23.
Regression coefficients for the realization of university students’ campus belongingness and respect needs.
Based on the comprehensive analyses in Section 3, this study provides a definitive answer to Research Question 2 regarding the extent to which students’ satisfaction with campus functional spaces influences their sense of campus belonging.
The regression analyses demonstrate that satisfaction with campus functional spaces explains 45.1% of the variance in students’ overall sense of campus belonging (R2 = 0.451), representing a substantial though not deterministic relationship. This influence manifests through four principal components, with extended activity diversity emerging as the strongest predictor across the combined dataset and two of the three institutions, followed by residential comfort, learning convenience, and transportation comfort.
However, in the comparative analysis of the three universities, the relationship between functional space satisfaction and overall campus sense of belonging, as well as scores across various dimensions of campus belonging, is more pronounced at HE University than at the other two institutions, with HQ University and HN University following. Among the four factors of functional space satisfaction, although the diversity of expansion activities generally exerts a greater influence on campus belonging than the other three factors across the overall data, in the case of HQ University, the regression analyses of overall belonging, as well as “school recognition and affection,” “social needs fulfillment,” and “respect needs fulfillment,” reveal that the coefficient for “residential comfort” exceeds those of the other factors. In the regression analyses of other campus belonging dimensions, the influence rankings of the four satisfaction factors vary across universities. This contextual variation indicates that the mechanism through which spatial satisfaction translates into belonging is institution-specific, potentially reflecting differences in campus design, student demographics, or institutional culture.
4. Discussion and Conclusions
4.1. Enlightenment Based on Association with Spatial Imagery
Given the minimal variation in the actual facilities across the three universities, a plausible hypothesis is that distinct functional layout patterns exert a significant influence on the relationship between functional space satisfaction and the sense of belonging on campus.
We have systematically identified the corresponding functional buildings and facilities on campus and accompanied them with a schematic map (Figure 6) that illustrates their spatial distribution. The map categorizes zones by the primary function of each area: service centers, academic spaces, residential spaces, and sports facilities—a classification method commonly used in Chinese university campus planning [49]. Among them, green spaces, regardless of their size, are generally regarded as transitional areas between the main land use and other functional areas within the land. Therefore, they are not included in the functional structure. Some of the more significant landscape green spaces usually appear in an axial form. Therefore, in this diagram, the axial lines of the landscapes are represented by dotted lines.
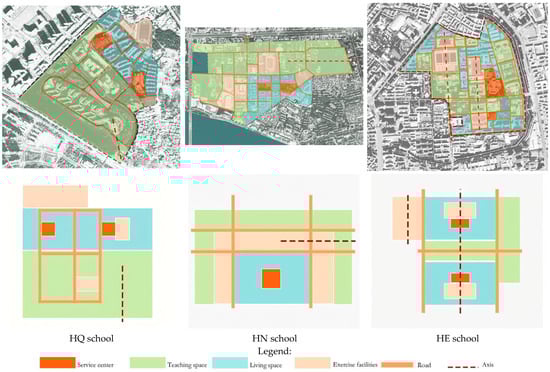
Figure 6.
Campus function distribution plan and function structure analysis diagram.
The campus of HQ University is characterized by a concentration of sports facilities within a designated zone, with a minority dispersed throughout residential and academic areas. Three main thoroughfares traverse the residential and academic zones, two of which pass through the service center and intersect with zonal main roads, forming a grid pattern. One primary arterial road originates from the Student Services Center, passing through the residential and academic zones to reach the main entrance, thereby establishing the institution’s principal visual axis.
The campus layout of HN University features a centralized sports facility zone, with a service hub at its core, extending outward in concentric layers that comprise residential, sports, and educational areas. The main thoroughfares effectively delineate functional zones while extending within each area to form a grid pattern. Green spaces and lake views are strategically positioned on the eastern and western sides of the educational area, with the larger eastern lakeside facilities, including the library, closely integrated to create a primary landscape feature that mirrors the campus’s eastern main entrance.
HE University has significantly more athletic facilities than both HQ and HN Universities. The campus organization centers around a sports field and an adjacent service center, forming two relatively autonomous community-like functional clusters around the sports area. The primary teaching zones are situated between these clusters and traversed by a main thoroughfare, which, together with two peripheral roads, forms an H-shaped network. Research laboratory clusters are located on the western side of this network, while the eastern side features a concentrated array of sports facilities that constitute the main athletic zone. This zone aligns along the axis of the campus’s historic main buildings, establishing it as a central landscape element.
Multivariate regression results indicate that at HQ University, “residential comfort” demonstrates the strongest impact coefficients on overall campus belonging and its dimensions, a pattern not observed at HN and HE Universities. This phenomenon is attributed to HQ University’s campus layout, in which activity facilities are not fully integrated into students’ daily pathways, potentially limiting spontaneous participation in extended activities and, consequently, affecting both satisfaction and belonging. In contrast, HN University’s design facilitates student passage through activity facilities when moving between residential and academic zones, increasing interaction opportunities and positively influencing spatial satisfaction. HE University employs a cluster-based layout that centrally positions activity facilities within groups, enhancing accessibility during daily activities and potentially boosting satisfaction. As Japanese architect Fumihiko Maki proposes in his concept of “uncertain space,” spatial design should accommodate human behavioral factors—including incidental and random behaviors—by stimulating new activities through spatial planning, thereby creating multifunctional environments that are more vibrant and dynamic.
Furthermore, at HE University, the diversity of extension activities significantly influences students’ overall sense of belonging and its various dimensions more than other factors, a distinctive phenomenon not observed at the other two institutions. This suggests that the campus’s overall functional layout shapes students’ perceptions of campus identity, consequently affecting their sense of belonging. As Kevin Lynch establishes in his seminal work, the five fundamental elements—paths, boundaries, districts, nodes, and landmarks—play crucial roles in constructing mental maps of environments, with equal applicability to campus settings. HE University’s north–south axial layout, integrating residential, academic, and extension zones, fosters close connections among these areas, enhancing students’ perceptions of key campus imagery and strengthening a sense of belonging. Conversely, HN University’s layout, centered on the east gate, East Slope Lake, and the library, shows insufficient connectivity among other functional zones, resulting in weaker inter-zone links. Similarly, HQ University’s south gate and academic zone-centered layout exhibits limited integration with other functions. These variations in axial orientation and the integration of extension facilities distinctly influence students’ campus belonging.
4.2. Conclusions
The key insights derived from this study are as follows:
(1) The sense of campus belonging among university students requires consideration of the mobility characteristics inherent to the student community. During the selection of indicators for the campus sense of belonging questionnaire, it was found that items such as “I am proud to belong to this university,” “The campus service platform is relatively comprehensive,” and “Within this university, I perceive teachers and students as highly diverse” are unsuitable for measuring university campus belonging. This may be due to the unique community nature of university campuses, characterized by high mobility; students typically graduate after a four- to five-year period, and such frequent personnel turnover may impact the development of a sense of belonging.
(2) This study confirms that satisfaction with campus functional spaces accounts for approximately 50% of the variance in students’ overall campus belonging, indicating a close relationship between functional space quality and belonging. These four dimensions significantly influence both the overall and individual dimensions of campus belonging, with regression analyses showing that each dimension’s explanatory power exceeds that of the overall belonging measure, illustrating that the psychological process from functional space satisfaction to campus belonging is holistic; the absence of any dimension may trigger a “bucket effect.” And the pivotal link connecting campus spatial satisfaction with a sense of belonging lies in four sets of behavioral needs among students. This is reflected not only in the widespread covariance among various types of spatial satisfaction but also in the greater influence of behavioral characteristics within personal social attributes on the sense of belonging.
(3) Based on the comparative analysis of functional space distribution across the three universities, it is further proposed that the overall campus layout should prioritize proximity or integration of residential areas with expansion facilities. Such arrangements facilitate spontaneous participation in activities, increase utilization rates, and enrich students’ extracurricular life. Additionally, academic zones and transportation infrastructure should be linked with activity facilities to enable convenient access during daily movement, thereby encouraging more frequent engagement and social interaction. Integrating expansion facilities with campus visual axes or core areas—such as sports fields and student activity centers—can reinforce their role within campus culture and daily life, enhancing the environment’s vitality and cohesion.
4.3. Limitations and Future Perspectives
Although prior research has extensively examined the impact of specific space types—such as residential areas, green landscapes, and libraries—on user satisfaction, and established connections between spatial elements and psychological perceptions to inform design strategies, we believe spatial satisfaction serves only as a precursor to belonging, thus positioning this study’s core focus on the relationship between satisfaction and belonging rather than on physical space alone. Accordingly, this investigation aligns more closely with psychological research, while its implications for spatial design are drawn primarily from questionnaire-based findings.
Unlike studies that correlate isolated functional spaces with satisfaction, this study underscores the role of campus space as an integrated system. Practically, it suggests that campus planning should adopt a systematic approach to layout and optimization based on behavioral needs. However, following this line of thinking, could the relationship between the university campus and its external environment also influence students’ spatial satisfaction and sense of belonging? For instance, aspects such as campus spatial openness and the relationship with surrounding urban functions warrant consideration. During the COVID-19 pandemic, numerous studies indicated that the closure of community spaces led to various psychological challenges [50,51]. Although the pandemic has subsided, the degree of campus openness remains a relevant factor. Furthermore, many urban functions surrounding campuses provide services that support students’ daily lives or academic activities. These external amenities may be internalized into students’ perceptions of the school.
Several limitations should be noted. First, the sample is restricted to three geographically dispersed Tier 1 universities in China, thereby excluding elite institutions such as Tsinghua University and Peking University. While Tier 1 enrollment generally reflects stronger academic preparedness and socioeconomic background, and no current evidence ties academic ability directly to spatial perception, this potential influence warrants further study. Moreover, regional cultural and lifestyle variations across sample sites may affect belonging, a factor not controlled for in the analysis.
Methodologically, the reliance on questionnaires, though flexible for exploratory analysis, offers limited granularity for examining specific spatial attributes. This study does not conduct detailed correlation analyses among spatial elements, structural features, and belonging, thereby limiting its utility for generating concrete design strategies. Nonetheless, a deeper understanding of the psychological pathway from spatial satisfaction to belonging remains essential for developing targeted design approaches. This study provides directional guidance for incorporating quantitative analytical techniques, such as space syntax, to conduct more detailed spatial analysis, thereby charting a path for methodological refinement in future research.
Author Contributions
Conceptualization, H.O. and Z.Z.; methodology, H.O. and M.H.; software, C.B.; validation, Z.Z. and C.B.; formal analysis, Y.O. and M.Y.; investigation, H.O. and Y.O.; resources, H.O. and M.Y.; data curation, C.B.; writing—original draft preparation, H.O.; writing—review and editing, Z.Z. and C.B.; visualization, C.B.; project administration, H.O. and M.H. All authors have read and agreed to the published version of the manuscript.
Funding
This work was supported by the 2024 National Social Science Fund for Research on Ideological and Political Theory Courses in Universities (24VSZ146) and the 2025 Annual Social Sciences Fund Project of Fujian Province (FJ2025B004).
Institutional Review Board Statement
The study was conducted in accordance with the Declaration of Helsinki and Ethical Review Measures for Human Life Sciences and Medical Research in China (State Health and Education Development Document No. 4 [2023]), and obtained the ethical review exemption certificate from the Medical Ethics Committee of Huaqiao University and the Information Science and Engineering College of Huaqiao University. (Approval date: 30 July 2024).
Informed Consent Statement
Informed consent was obtained from all individual participants included in the study.
Data Availability Statement
The data presented in this study are available upon request from the corresponding author.
Conflicts of Interest
The authors declare no conflict of interest.
Appendix A. The Impact on Satisfaction Levels with Various Functional Spaces Within the Campus
The influence of individual attributes on satisfaction with various functional spaces on campus was determined through t-tests and analysis of variance. The data are organized and presented in Table A1 and Table A2. It is evident that there are no significant differences in overall satisfaction with various functional spaces among university students with different durations of on-campus residence and varying living expenses. However, a significant gender difference exists in overall satisfaction with transportation spaces, with male students reporting slightly higher satisfaction levels than female students. Internet usage time has a notable impact on overall satisfaction across all functional spaces. As illustrated in Figure A1, the average satisfaction scores tend to decline with increasing daily internet usage. Specifically, students who use the internet for less than four hours per day exhibit relatively stable satisfaction levels across different spaces. Those with usage between four and six hours, and six to eight hours, show no significant difference in satisfaction. Conversely, students with daily internet usage exceeding eight hours report the lowest overall satisfaction across all space categories.
Table A1.
Differences in overall satisfaction scores of various functional spaces across genders.
Table A1.
Differences in overall satisfaction scores of various functional spaces across genders.
| Results of the t-Test Analysis | ||||
|---|---|---|---|---|
| Space Type | Gender (Mean ± Standard Deviation) | t | p | |
| Male (Sample Size = 205) | Female (Sample Size = 194) | |||
| ES | 3.79 ± 0.68 | 3.68 ± 0.64 | 1.674 | 0.095 |
| TS | 3.82 ± 0.62 | 3.66 ± 0.61 | 2.493 | 0.013 * |
| RSS | 3.64 ± 0.73 | 3.56 ± 0.66 | 1.117 | 0.264 |
| RCS | 3.83 ± 0.73 | 3.71 ± 0.73 | 1.636 | 0.103 |
| SS | 3.84 ± 0.70 | 3.78 ± 0.66 | 0.818 | 0.414 |
| CAS | 3.81 ± 0.70 | 3.77 ± 0.63 | 0.627 | 0.531 |
* p < 0.05 ** p < 0.01.
Table A2.
Differences in overall satisfaction indicators of various functional spaces across different personal and social attributes.
Table A2.
Differences in overall satisfaction indicators of various functional spaces across different personal and social attributes.
| Results of the ANOVA Analysis | |||||||
|---|---|---|---|---|---|---|---|
| Space Type | Time Spent in School | Living Expenses | Time Spent on the Internet | Indoor or Outdoor Sports | Frequency of Exercise | Number of People | Number of People per Table |
| ES | 0.106 | 0.201 | 0.015 * | 0.004 ** | 0.031 * | 0.931 | 0.380 |
| TS | 0.291 | 0.116 | 0.001 ** | 0.004 ** | 0.003 ** | 0.762 | 0.294 |
| RSS | 0.551 | 0.068 | 0.019 * | 0.204 | 0.212 | 0.003 ** | 0.000 ** |
| RCS | 0.116 | 0.344 | 0.001 ** | 0.023 * | 0.207 | 0.479 | 0.160 |
| SS | 0.051 | 0.086 | 0.000 ** | 0.019 * | 0.048 * | 0.750 | 0.240 |
| CAS | 0.156 | 0.064 | 0.030 * | 0.085 | 0.111 | 1.000 | 0.506 |
* p < 0.05 ** p < 0.01.

Figure A1.
Mean overall satisfaction with related spatial environment across different internet usage durations.
The propensity for indoor versus outdoor physical activity influences various aspects such as education, transportation, rest, and sports facilities. Notably, the difference between those favoring outdoor activities and those comfortable with both indoor and outdoor options is minimal. However, university students who exclusively prefer indoor exercise report lower overall satisfaction with the relevant functional spaces (Figure A2). Additionally, the average satisfaction levels for educational, transportation, and sports spaces tend to decline with increasing frequency of physical activity (Figure A3).

Figure A2.
The average value of the overall satisfaction in spatial domains for different movement tendencies.

Figure A3.
The average value of the overall satisfaction in spatial domains for different exercise frequencies.
Student accommodation, the number of occupants per room and the average number of desks per person significantly influence overall satisfaction with the living space. Interestingly, fewer residents correlate with higher overall satisfaction, aligning with expectations (Figure A4). However, the average number of desks per person exhibits a significant decline when exceeding 1.33 desks per individual (Figure A5).

Figure A4.
Average value of overall satisfaction with living space, different number of students per room.

Figure A5.
Average value of overall satisfaction with living space, different number of desks per room.
Appendix B. The Impact on Students’ Sense of Belonging Within the Campus Environment
The influence of individual attributes on satisfaction across various dimensions of campus belonging was determined through t-tests and analysis of variance. The data were organized and presented in the following tables, Table A3 and Table A4.
Table A3.
Gender-based differences in campus sense of belonging.
Table A3.
Gender-based differences in campus sense of belonging.
| Results of the t-Test Analysis | ||||
|---|---|---|---|---|
| Dimensions | Gender (Mean ± Standard Deviation) | t | p | |
| Male (Sample Size = 205) | Female (Sample Size = 194) | |||
| A sense of ownership in the school | 3.92 ± 0.81 | 3.86 ± 0.77 | 0.773 | 0.440 |
| Recognition and affection for school | 3.84 ± 0.87 | 3.76 ± 0.75 | 0.938 | 0.349 |
| Fulfillment of social needs | 3.86 ± 0.89 | 3.84 ± 0.79 | 0.252 | 0.801 |
| Fulfillment of needs to be respected | 3.93 ± 0.80 | 3.85 ± 0.76 | 0.960 | 0.337 |
Table A4.
Differences in sense of belonging to campus across other personal social attributes.
Table A4.
Differences in sense of belonging to campus across other personal social attributes.
| Results of the ANOVA Analysis | |||||||
|---|---|---|---|---|---|---|---|
| Dimensions | Time Spent in School | Living Expenses | Time Spent on the Internet | Indoor or Outdoor Exercise | Sports Frequency | Number of People | People per Table |
| A sense of ownership in the school | 0.171 | 0.384 | 0.000 ** | 0.182 | 0.003 ** | 0.978 | 0.104 |
| Recognition and affection for school | 0.042 * | 0.256 | 0.002 ** | 0.208 | 0.067 | 0.882 | 0.119 |
| Fulfillment of social needs | 0.301 | 0.060 | 0.043 * | 0.033 * | 0.013 * | 0.066 | 0.206 |
| Fulfillment of needs to be respected | 0.309 | 0.222 | 0.046 * | 0.138 | 0.009 ** | 0.238 | 0.035 * |
* p < 0.05 ** p < 0.01.
The above findings indicate that there are no significant differences in students’ sense of belonging to the campus across varying genders, living expenses, and dormitory occupancy levels.
Additionally, the levels of school recognition and affection differ according to the duration of enrollment, exhibiting a trend of initial increase followed by decline, with students enrolled for three years demonstrating significantly higher levels compared to other durations (Figure A6).
Furthermore, internet usage duration exerts a significant influence on all dimensions of campus belongingness. As shown in Figure A7, the average scores of campus sense of belonging generally decline with increasing internet usage time.

Figure A6.
Average of recognition and affection for school across different time spent in school.

Figure A7.
Average of sense of belonging to campus across different time spent on the Internet.
From Figure A8, it can be observed that the realization of respect demand reaches its peak at an average of 1.33 tables per person, declines to its lowest point at 1.5 tables per person, and slightly recovers at 2 tables per person. However, the sample size at 1.5 tables per person is relatively small, making it susceptible to outliers. Consequently, the relationship between respect demand realization and the average number of tables per person generally exhibits an initial increase followed by a decrease.

Figure A8.
Average value of the needs to be respected in terms of the number of desks per capita in dormitories.
The realization of social needs varies primarily with preferences for indoor versus outdoor activities. As shown in Figure A9, students who favor outdoor sports or are open to both indoor and outdoor activities achieve the highest average scores in social need fulfillment, compared to those who prefer only indoor sports. Additionally, there are differences in the frequency of sports participation concerning school ownership sense, social need fulfillment, and respect needs, with average scores generally decreasing as participation frequency diminishes (Figure A10).

Figure A9.
Average values of fulfillment of social needs across different preferences of exercise.

Figure A10.
Average values of the sense of ownership of the school, fulfillment of social needs, and fulfillment of respect needs across different frequency of exercise.
References
- Sun, X.; Jiang, Y.; Cheng, X.F. Mental Health Blue Book: Report on National Mental Health Development in China (2023–2024); Social Sciences Academic Press: Beijing, China, 2025. [Google Scholar]
- Fei, L. Study on the Relationship between College Students’ Family Environment and Negative Perfectionism. J. Wuhan Polytech. 2012, 11, 4. [Google Scholar] [CrossRef]
- Baig, M.; Ahmad, Y.; Shahzad, A.; Naseem, A. Impact of Campus Environment and Personality Traits on the Academic Performance and Psychological Well-Being of Engineering Undergraduates: The Mediating Role of Engineering Self-Efficacy. IEEE Trans. Educ. 2025, 68, 140–151. [Google Scholar] [CrossRef]
- Wang, L. Analysis of Factors Influencing University Students’ Sense of Belonging: Satisfaction with Campus Culture. Ideol. Political Educ. Res. 2016, 32, 121–125. [Google Scholar] [CrossRef]
- Bao, K.; Xu, Q. Preliminary Study on School Belonging of School Students. Psychol. Explor. 2006, 26, 51–54. [Google Scholar]
- Liu, Y.; Liu, Y. A Case Study on Psychological Health Intervention for Vocational College Students Based on Enhancing School Sense of Belonging. Occupation 2020, 2, 30–31. [Google Scholar]
- Zhang, M. Research on the Construction of University Cultural Carriers Based on Core Competitiveness. Heilongjiang Educ. (Res. Eval. High. Educ.) 2013, 5, 3–4. [Google Scholar]
- Maslow, A.H. Motivation and Personality: Motivation and Personality: Unlocking Your Inner Drive and Understanding Human Behavior by Ah Maslow; Prabhat Prakashan: New Delhi, India, 2023. [Google Scholar]
- Goodenow, C.; Grady, K.E. The Relationship of School Belonging and Friends’ Values to Academic Motivation among Urban Adolescent Students. J. Exp. Educ. 1993, 62, 60–71. [Google Scholar] [CrossRef]
- Strayhorn, T.L. College Students’ Sense of Belonging: A Key to Educational Success for All Students; Routledge: London, UK, 2018. [Google Scholar]
- Pascarella, E.T.; Terenzini, P.T. How College Affects Students: A Third Decade of Research; ERIC: Indianapolis, IN, USA, 2005; Volume 2.
- Astin, A.W. Student Involvement: A Developmental Theory for Higher Education. In College Student Development and Academic Life; Routledge: London, UK, 2014; pp. 251–262. [Google Scholar]
- Sari, M. Sense of School Belonging among Elementary School Students. Çukurova Üniversitesi Eğitim Fakültesi Derg. 2012, 41, 1–11. [Google Scholar]
- Davis, K. Friendship 2.0: Adolescents’ Experiences of Belonging and Self-Disclosure Online. J. Adolesc. 2012, 35, 1527–1536. [Google Scholar] [CrossRef]
- Jose, P.E.; Ryan, N.; Pryor, J. Does Social Connectedness Promote a Greater Sense of Well-Being in Adolescence Over Time? J. Res. Adolesc. 2012, 22, 235–251. [Google Scholar] [CrossRef]
- Anderman, E.M. School Effects on Psychological Outcomes During Adolescence. J. Educ. Psychol. 2002, 94, 795. [Google Scholar] [CrossRef]
- McKenzie, C.S.; Farmer, A.Y.; Chear, C. Campus Climate and Sense of Belonging: Implications for the Mental Health Outcomes of Asian American Graduate Students. J. Am. Coll. Health 2024, 72, 3515–3525. [Google Scholar] [CrossRef] [PubMed]
- Xue, M. How Teachers’ Enthusiasm Influences Chinese Students’ School Belonging: The Mediation Role of Teaching Practices. Int. J. Educ. Res. 2024, 124, 102310. [Google Scholar] [CrossRef]
- Davis, A. The Effects that Spaces and Places of Campus Have on Undergraduate Students. Master’s Thesis, Rowan University, Glassboro, NJ, USA, 2023. [Google Scholar]
- Slaten, C.D.; Elison, Z.M.; Lee, J.Y.; Yough, M.; Scalise, D. Belonging on Campus: A Qualitative Inquiry of Asian International Students. Couns. Psychol. 2016, 44, 383–410. [Google Scholar] [CrossRef]
- Allen, K.; Kern, M.L.; Vella-Brodrick, D.; Hattie, J.; Waters, L. What Schools Need to Know About Fostering School Belonging: A Meta-analysis. Educ. Psychol. Rev. 2018, 30, 1–34. [Google Scholar] [CrossRef]
- Waters, S.; Cross, D.; Shaw, T. Does the Nature of Schools Matter? An Exploration of Selected School Ecology Factors on Adolescent Perceptions of School Connectedness. Br. J. Educ. Psychol. 2010, 80, 381–402. [Google Scholar] [CrossRef]
- Ahn, M.Y.; Davis, H.H. Four Domains of Students’ Sense of Belonging to University. Stud. High. Educ. 2020, 45, 622–634. [Google Scholar] [CrossRef]
- Li, K. Microclimate Evaluation Model Optimization Research of the External Communication Space of Subtropical University Campus Based on Urban Diversity Map. Master’s Thesis, South China University of Technology, Guangzhou, China, 2019. [Google Scholar] [CrossRef]
- Jiang, J.; Mei, H.; Han, P. Research on the Evaluation and Optimization Strategy of External Space Wind Environment of University Campus in Cold Regions. Contemp. Archit. 2022, 5, 35–39. [Google Scholar]
- Ma, X. Sense of Belonging to School: Can Schools Make a Difference? J. Educ. Res. 2003, 96, 340–349. [Google Scholar] [CrossRef]
- Zhang, Z.; Jiang, F. An Investigative Study on the Impact of Learning Spaces on University Students’ Learning Satisfaction: A Perspective Based on Environmental Psychology. Res. Teach. 2020, 43, 10–21. [Google Scholar]
- Lou, H.; Ou, D.; Kang, S. Study on Indoor Environmental Quality Evaluation of University Buildings Based on Learning Efficiency. Build. Sci. 2017, 33, 9–15. [Google Scholar] [CrossRef]
- Zheng, Z.; Zeng, M.; Huang, W.; Sun, N. The Influence of University Library Environment on Student Interactions and College Students’ Learning Engagement. Humanit. Soc. Sci. Commun. 2024, 11, 14. [Google Scholar] [CrossRef]
- Ju, Q. The Practice of Narrative Interactive Landscapes in Campus Green Space Design. Contemp. Hortic. 2023, 46, 64–66. [Google Scholar]
- Li, F.; Huang, X. A Study on Green Campus Key Points Basing on the Satisfaction Survey. Des. Community 2020, 3, 29–38. [Google Scholar]
- Huitt, W. Maslow’s hierarchy of needs. Educ. Psychol. Interact. 2007, 23. [Google Scholar]
- Zhang, J. Research on Campus Planning and Design Strategies Based on Campus Cultural Construction. Master’s Thesis, Southeast University, Nanjing, China, 2020. [Google Scholar] [CrossRef]
- Wu, G. New Trends in University Campus Planning: Campus Space Planning Based on Development Strategies; China Architecture & Building Press: Beijing, China, 2022. [Google Scholar]
- Zhao, Y. Research on the Planning and Layout of Complex University Campus Based on Symbiosis Theory. Master’s Thesis, South China University of Technology, Guangzhou, China, 2023. [Google Scholar] [CrossRef]
- Chen, H. Research on the Architecture Space Mode of University Campus Complex. Master’s Thesis, Zhejiang Gongshang University, Hangzhou, China, 2021. [Google Scholar] [CrossRef]
- Shin, J.; Yang, H.J. Does Residential Stability Lead to Civic Participation?: The Mediating Role of Place Attachment. Cities 2022, 126, 103700. [Google Scholar] [CrossRef]
- Bolan, M. The Mobility Experience and Neighborhood Attachment. Demography 1997, 34, 225–237. [Google Scholar] [CrossRef]
- Tsurumi, T.; Imauji, A.; Managi, S. Relative Income, Community Attachment and Subjective Well-Being: Evidence from Japan. In Wealth, Inclusive Growth and Sustainability; Routledge: London, UK, 2019; pp. 167–194. [Google Scholar]
- Wu, F. Neighborhood Attachment, Social Participation, and Willingness to Stay in China’s Low-Income Communities. Urban Aff. Rev. 2012, 48, 547–570. [Google Scholar] [CrossRef]
- Xi, W.; Yu, Y.; Chen, M. The Relationship between College Students’ Sense of School Belonging and Subjective Well-being. Chin. J. Public Health 2016, 32, 1550–1552. [Google Scholar]
- Strayhorn, T.L. Exploring the Impact of Facebook and Myspace Use on First-Year Students’ Sense of Belonging and Persistence Decisions. J. Coll. Stud. Dev. 2012, 53, 783–796. [Google Scholar] [CrossRef]
- Yang, Y.; Zhang, Y.; Shen, J. Research on the Influence of University Students’ Indoor Environment on Subjective Well-being, School-like Sense and Interpersonal Communication. Chin. J. Ergon. 2018, 24, 48–53. [Google Scholar] [CrossRef]
- Gold, J.R. Creating the Charter of Athens: CIAM and the functional city, 1933-43. Town Plan. Rev. 1998, 69, 225–247. [Google Scholar] [CrossRef]
- Shan, J. The Community Attachment and China Urban Community’s Construction. J. Univ. Chin. Acad. Soc. Sci. 2006, 6, 125–131. [Google Scholar]
- Li, H. The Urbanite’s Community Satisfaction and Its Impact on Community Attachment: A Survey of 411 Urbanites in Wuhan City. Master’s Thesis, Huazhong University of Science & Technology, Wuhan, China, 2005. [Google Scholar]
- Cao, G.; Yao, B. Development and Validation of a Questionnaire Measuring University Students’ Sense of Belonging to Their School. In Proceedings of the 12th National Conference on Psychological Science; Taiyuan Command College of the Armed Police Force: Taiyuan, China, 2009; pp. 462–463. [Google Scholar]
- Lynch, K. The Image of the City; MIT Press: Cambridge, MA, USA, 1960. [Google Scholar]
- He, J. Contemporary University Campus Planning and Design; China Architecture & Building Press: Beijing, China, 2006. [Google Scholar]
- Martins, T.B.; Branco, J.H.; Martins, T.B.; Santos, G.M.; Andrade, A. Impact of social isolation during the COVID-19 pandemic on the mental health of university students and recommendations for the post-pandemic period: A systematic review. Brain Behav. Immun. Health 2025, 43, 100941. [Google Scholar] [CrossRef] [PubMed]
- Choi, J.; Kim, Y.S.; Son, G.; Choi, K.H.; Kim, J.; Park, S. Longitudinal trajectories of social isolation and loneliness across the lifespan during the COVID-19 pandemic in South Korea. Sci. Rep. 2025, 15, 43337. [Google Scholar] [CrossRef] [PubMed]
Disclaimer/Publisher’s Note: The statements, opinions and data contained in all publications are solely those of the individual author(s) and contributor(s) and not of MDPI and/or the editor(s). MDPI and/or the editor(s) disclaim responsibility for any injury to people or property resulting from any ideas, methods, instructions or products referred to in the content. |
© 2025 by the authors. Licensee MDPI, Basel, Switzerland. This article is an open access article distributed under the terms and conditions of the Creative Commons Attribution (CC BY) license.