Abstract
L-shaped concrete-filled steel tubular (CFST) columns have attracted increasing attention in recent years due to their favorable seismic performance and their ability to reduce column protrusions into interior wall surfaces. Existing studies on L-shaped CFST columns have mainly focused on a specific cross-section form, and the mechanical behavior of L-shaped CFST columns with different limb length ratios and inter-limb angles has not yet been sufficiently investigated. To further examine the axial compressive performance of L-shaped CFST columns, this study designed and tested eight L-shaped CFST columns by considering the cross-section form, limb-length ratio, and inter-limb angle as key parameters. In addition, a simplified formula for predicting the axial load capacity of L-shaped CFST columns was proposed based on the unified theory. The test results indicated that the cross-section form significantly affects both load-carrying capacity and ductility. For the equal-limb specimens, the peak load of the C-type specimen was 8% and 9% higher than that of the A-type and B-type specimens, respectively, whereas the displacement ductility coefficient of the A-type specimen was 48% and 47% higher than that of the B-type and C-type specimens, respectively. Compared with the unequal limb specimens, the equal limb specimens exhibited an increase in peak load of more than 20%; moreover, the displacement ductility coefficients of the A-type and B-type specimens increased by 48% and 61%, respectively. Increasing the inter-limb angle enhanced the peak load but reduced the ductility, and it led to a gradual shift in the failure mode from local buckling of the steel tube to overall bending. The findings of this study contribute to a more comprehensive understanding of the mechanical behavior of L-shaped CFST columns and can provide reference for their design and optimization.
1. Introduction
Concrete-filled steel tubular members are an efficient means of achieving green and low-carbon construction due to their good assembly performance, which successfully avoids issues like excessive wet operations and significant environmental impact in traditional cast-in situ concrete structures [1]. Traditional square vertical components tend to protrude from the wall in practical engineering, particularly in high-rise building designs, which has a detrimental effect on the interior aesthetics of the building. Moreover, the protruding parts may cause potential installation difficulties for indoor pipeline equipment. By adopting L- or T-shaped CFST columns, the columns can be embedded in walls, producing a flush wall surface and improving space efficiency.
The steel tube in a CFST column imposes transverse confinement on the concrete, and the concrete in turn supports the tube to postpone local buckling, collectively leading to superior seismic performance [2]. In recent years, researchers have investigated the mechanical behavior of CFST members under various loading conditions. Montuori et al. [3,4] examined the performance of eight CFT specimens subjected to cyclic bending, thereby providing further clarification of the flexural response of CFT members. In addition, they conducted pure bending tests on eight square CFT specimens with different width-to-thickness ratios, and employed detailed finite element modeling to achieve accurate predictions of energy dissipation.
In addition to circular and square steel tubes, several researchers have proposed novel cross-section configurations to meet construction constraints and functional requirements. Wang et al. [5] developed a new composite column and assessed its axial compressive response using experimental testing and FE modeling. Liu et al. [6,7] developed a CFST column with a circular multi-cell cross-section and investigated the effects of chamber layout, axial compression ratio, and aspect ratio on its seismic performance. Moreover, machine learning approaches have been introduced to predict the strength of CFST columns. Xie et al. [8] established a database comprising 66 experimental tests and 134 finite element models. Based on the database, five machine learning techniques were employed to predict the ultimate axial capacity of SRCFT stub columns with good accuracy. Isleem et al. [9] combined finite element simulation with machine learning to predict the axial load capacity and ultimate confining strain of FRP-confined double-skin tubular columns, and further developed an open-source GUI based on GB to assist engineers in selecting design schemes.
To meet the increasing demand for improving the utilization of indoor space, some researchers have proposed the use of special-shaped CFST columns as edge or corner columns in high-rise buildings [10,11,12,13,14,15,16,17,18]. Zheng et al. [18] conducted parametric studies on L-shaped and T-shaped CFST columns using finite element analyses and proposed calculation models for axial compressive strength and stiffness. Yang et al. [19] performed axial compression tests and fire tests on six L-shaped CFST stub columns, and found that the slenderness ratio, column thickness, and eccentricity ratio significantly affect the fire resistance of L-shaped CFST columns. Lei et al. [20] carried out experimental and theoretical studies on the structural behavior of L-shaped CFST columns and beam-columns, and proposed corresponding design methods for slender steel tube beam-columns.
In addition, irregular and multi-cell L-shaped CFST columns have also been investigated. Zheng’s et al. [21] found that rib-stiffened L-shaped CFST columns exhibit good axial–flexural performance under a range of loading angles. Liu et al. [22] proposed a novel irregular L-shaped CFST column (L-ICFSTC) and studied its axial and eccentric compression behavior through experiments and finite element simulations. The results indicated that the column height, limb length, and steel tube wall thickness have pronounced effects on the stability of the L-ICFSTC. Shen et al. [23] investigated the mechanical behavior of multi-cell L-shaped CFST columns under biaxial eccentric compression via tests and parametric finite element analyses, and further developed practical formulas for predicting the load-carrying capacity.
From the above review, it can be seen that although substantial progress has been made in understanding the mechanical behavior of L-shaped CFST columns, most existing studies have focused on L-shaped CFST columns with a specific cross-section form. Consequently, the influence of different cross-sectional configurations on the axial compressive performance of L-shaped CFST columns has not yet been fully clarified. Moreover, the axial behavior of L-shaped CFST columns with various limb-length ratios and inter-limb angles, which commonly occur in engineering, still requires further investigation.
To achieve a thorough understanding of the mechanical behavior of L-shaped CFST columns, our research team investigated specimens with various cross-section forms, as illustrated in Figure 1. By conducting axial compression tests on eight L-shaped CFST columns, this study investigated inter-limb angle, cross-section form, and limb length ratio on the axial compression behavior, stiffness, ductility, and bearing capacity of the columns. In addition, the axial compressive capacity of the above specimens was evaluated using various design codes to assess their applicability to the L-shaped CFST columns investigated herein. Furthermore, within the framework of the unified theory, a calculation formula for the axial compressive capacity of L-shaped CFST columns is proposed.
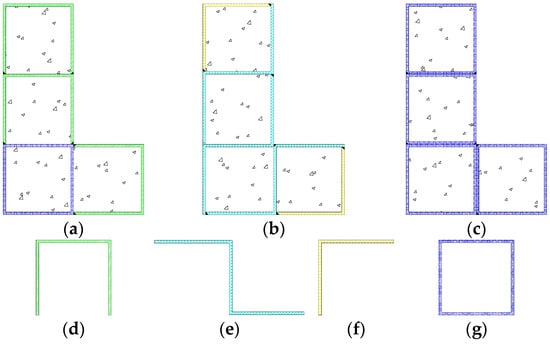
Figure 1.
Specimen types: (a) A-type; (b) B-type; (c) C-type; (d) component 1; (e) component 2; (f) component 3; (g) component 4.
The results of this study are expected to enrich the available experimental database for L-shaped CFST columns and facilitate a more comprehensive understanding of their mechanical behavior. The findings can provide reference data for the design and optimization of special-shaped CFST columns, and also offer benchmark evidence for the validation of future machine learning-based predictive models.
2. Test Program
2.1. Specimen Design
Eight specimens were fabricated in this study. The schematics and specific dimensions of the specimens are shown in Figure 2 and Figure 3, respectively, and the detailed information for each specimen is provided in Table 1. As seen from Figure 3 and Table 1, the eight specimens cover three cross-section forms—A, B, and C. The length of the long limb was fixed at 300 mm for all specimens, whereas the short limb took two values, 200 mm and 300 mm. By varying the short-limb length, the influence of different limb length ratios on mechanical performance was investigated. To further examine the effect of special inter-limb angles on the failure modes of L-shaped CFST columns, additional specimens with angles of 60° and 135° were also prepared.
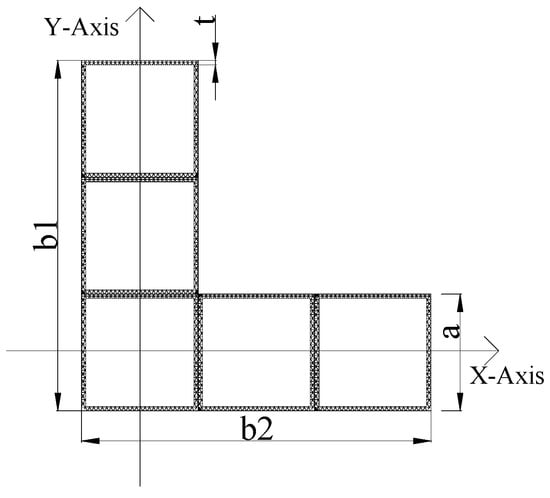
Figure 2.
Schematic diagram of the specimens.
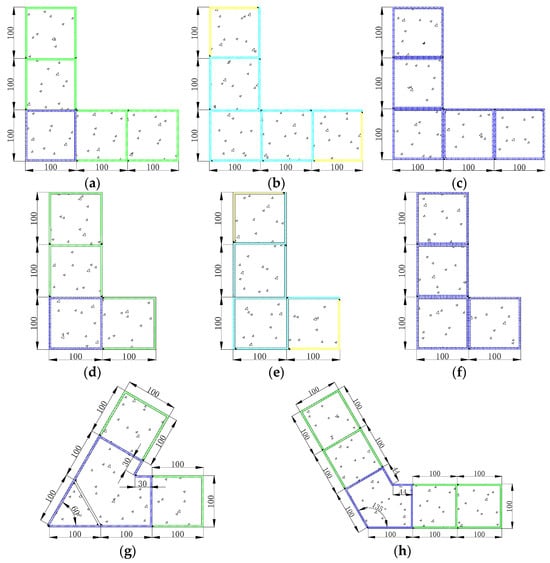
Figure 3.
Processing diagram of each specimen: (a) A1; (b) B1; (c) C1; (d) A2; (e) B2; (f) C2; (g) A3; (h) A4.

Table 1.
Detailed parameters of the specimens.
2.2. Properties of Materials
The specimen for the test is made of C35 concrete (Fangsen Concrete Co. Ltd., Kunming, China), whose cube compressive strength fcu is 33.6 MPa evaluated through material properties tests. Steel pipe is made of Q235 steel (Kunming Iron and Steel Group Co. Ltd., Kunming, China). In accordance with the relevant provisions of the Chinese codes [25,26], samples were taken separately from Components 1–4, and the mechanical test results for each component are summarized in Table 2.
Table 2.
Test results of components 1–4.
2.3. Loading Device and Measurement
Axial loading was applied using a 1000 t compression testing machine (Shijin Group Co. Ltd., Jinan, China). The axial displacement was monitored and recorded by a displacement transducer mounted at the loading end. The loading setup is shown in Figure 4. To measure the strain in the steel tube wall, transverse and longitudinal strain gauges were installed at mid-height on each specimen, with the gauge layout and numbering given in Figure 5.
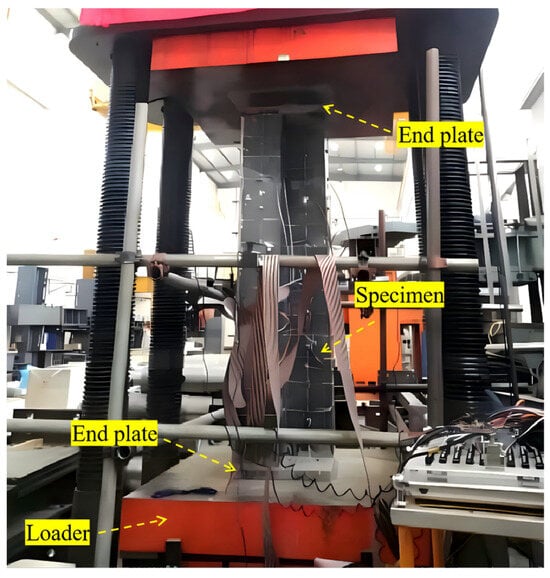
Figure 4.
Loading equipment.
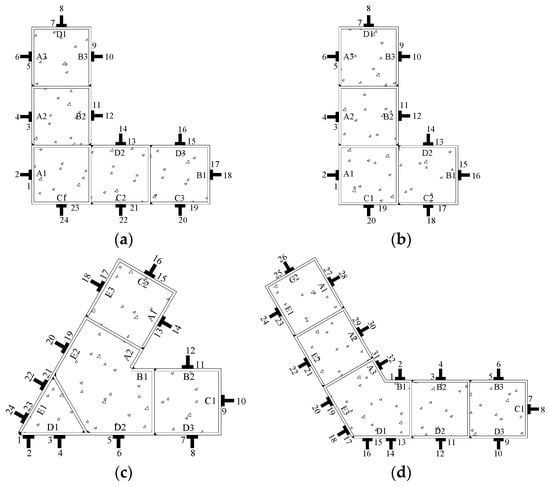
Figure 5.
Measuring point layout: (a) specimen with a limb length ratio of 1; (b) specimen with a limb length ratio of 1.5; (c) 60° specimen; (d) 135° specimen.
After connecting the testing equipment, preload it with 20% of the specimen’s estimated maximum bearing capacity and modify its location according to the read data to ensure that the centroid of the specimen aligns with the loading center. The test adopted a graded loading procedure, with each level of stress representing approximately 1/10 of the projected axial compression bearing capacity and lasting for 2 min. After reaching the yield strength of the specimen, the load range should be reduced to 1/15 of its axial compression bearing capacity. Continue slowly loading when approaching the anticipated maximum load, and once the bearing capacity drops to 60% of the maximum bearing capacity or when there is noticeable deformation, the loading procedure stops.
3. Test Phenomena and Failure Mode
3.1. Specimens with a Limb Length Ratio of 1.5
Figure 6 depicts the failure modes of each unequal limb specimen. No visible damage occurred from the start of loading to near 80% of the peak load, indicating an elastic response. However, as the load increased to about 95% of the peak load, the steel pipe attached to the end plate started to bulge locally. Finally, after reaching the peak load, the load quickly started to decrease. Multiple bulging bands gradually formed on multiple surfaces of the steel pipe, and the specimen entered the failure stage. Weld seam ripping was evident in A2 and B2 specimens. As shown in Figure 6, all specimens failed due to local buckling of the steel tube, indicating a strength-dominated failure mode, which is consistent with the findings reported by Wang [5]. For clarity, the definition of the peak load is given in Section 4.1.
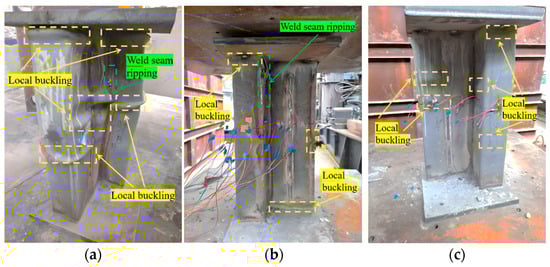
Figure 6.
Failure modes of each unequal-limb specimen: (a) A2; (b) B2; (c) C2.
3.2. Specimens with a Limb Length Ratio of 1
Figure 7 depicts the failure modes of each equal limb specimen. The specimens were in the elastic stage at the beginning of the loading, and there was no significant damage to the specimens. When loaded to about 95% of the peak load, there is slight bulging on the surface of the end part of the specimens. After that, the bulging at the ends of each side of the specimens continued to grow and gradually spread to its middle and upper parts. Weld seam ripping occurred in several areas of the B-type specimen, and welding slag detached from the A-type specimen during the continuous loading procedure. After loading, the predominant failure mode of the specimens is local buckling of the steel pipe, featuring strength failure.
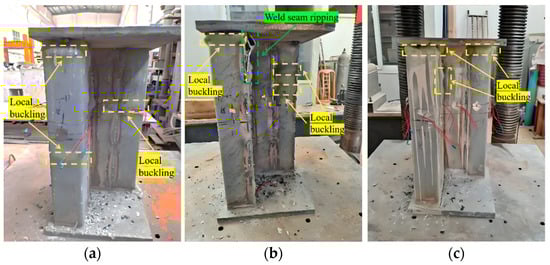
Figure 7.
Failure modes of each equal limb specimen: (a) A1; (b) B1; (c) C1.
3.3. Specimens A3 and A4
The failure modes of specimens A3 and A4 are shown in Figure 8.
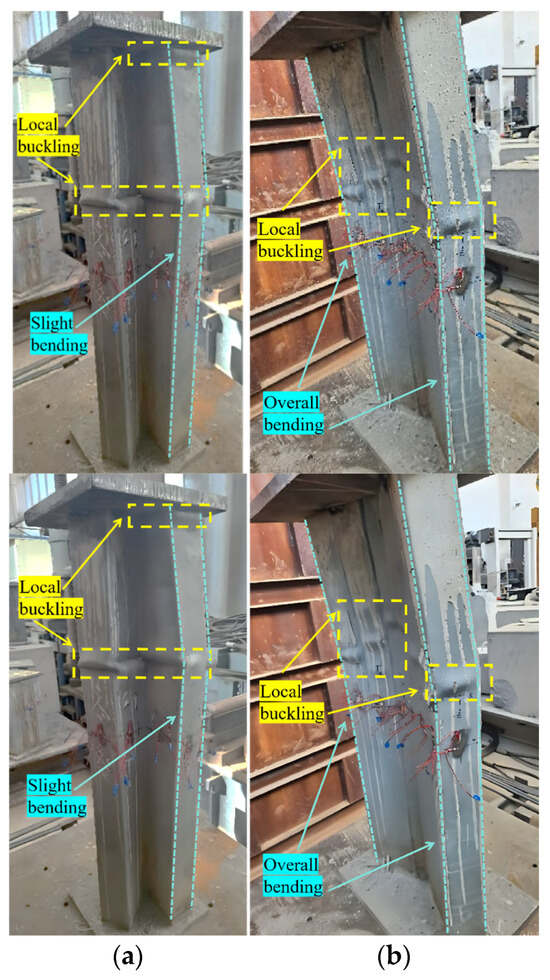
Figure 8.
Failure modes of specimens A3 and A4: (a) A3; (b) A4.
For specimen A3, after loading to the peak load, bulging bands formed in the cavity enclosed by surfaces C1, B2, D3, and the cavity enclosed by surfaces A1, C2, and E3. After that, three cavities on the E surface formed bulging bands at the same location. With further loading, weld seam ripping occurred at the joining point between surfaces D1 and E1. After loading, slight bending was observed, but the predominant failure mode remained local buckling of the steel tube, characteristic of strength-controlled failure.
For specimen A4, slight local buckling occurred at the end of the outer steel pipe as the load approached the ultimate bearing capacity. Due to the severe local buckling in the later stages of loading, it is unable for the steel pipe to confine the specimen along its weak axis, which causes substantial bending deformation and a quick loss in bearing capacity. The failure mode of this specimen includes local buckling and overall bending, featuring both strength failure and overall bending failure.
4. Test Results and Discussion
4.1. Load–Displacement Curves
The force condition of the specimen during loading can be more accurately reflected through the load–displacement curve. Appropriate curves for each group of specimens were drawn based on various design factors. The test results are displayed in Table 3. A comparison of the initial stiffness of all specimens is shown in Figure 9.
Table 3.
Summary of test results.
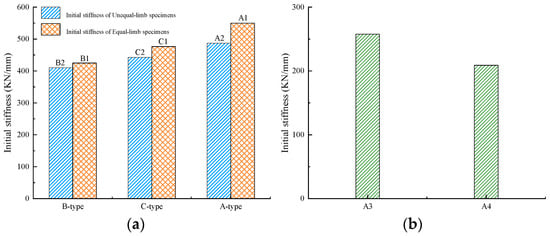
Figure 9.
Initial stiffness of the specimens: (a) Specimens with different cross-section form; (b) A3 and A4.
- (1)
- Influence of cross-section form in unequal limb specimens
Figure 10a compares the load–displacement curves of specimens A2, B2, and C2 to examine the influence of cross-section form on the axial compression behavior of unequal-limb specimens. As presented, the three types of specimens exhibited comparable initial stiffness, indicating that different cross-section forms have minimal effect on the initial stiffness in unequal limb specimens.
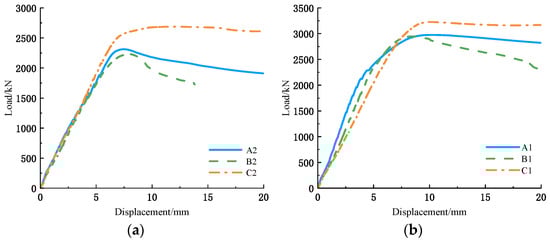
Figure 10.
Influence of cross-section form: (a) Unequal limb specimens; (b) Equal limb specimens.
During the later loading stage, both specimens A2 and B2 experienced a decline in bearing capacity. The degradation in Specimen B2 was characterized by a distinct stepwise drop, a phenomenon that correlates well with the fracture of the corner weld observed during the test. The specimen C2 entered the consolidation stage after passing the peak value, and its bearing capacity slightly decreased when the displacement reached 16 mm, indicating that the C-type combination method can improve the bearing capacity by increasing the constraint on the core concrete.
- (2)
- Influence of cross-section form in equal limb specimens
Figure 10b compares the load–displacement curves of specimens A1, B1, and C1, thus investigating the influence of cross-section form on the axial compression performance of equal limb specimens. The initial stiffness of the three cross-section forms differed more visibly than in the unequal limb group, reflecting the changed stiffness distribution due to the variation in limb geometry and steel arrangement.
After the curve reached the inflection point, the bearing capacity of specimen C1 gradually stabilized, whereas that of A1 decreased uniformly. Notably, the bearing capacity of B1 decreased abruptly due to the corner crack of the specimen. After that, the rate of decrease in bearing capacity accelerated until it approached the failure displacement, and the corner crack intensified, resulting in a secondary dramatic decrease in bearing capacity.
The observations demonstrate that the C-type cross-section not only attains a higher peak load but also maintains a more favorable and stable post-peak response, while the B-type configuration is more sensitive to weld quality and corner cracking.
- (3)
- Influence of limb-length ratio
Figure 11a–c illustrate the influence of limb length ratio on the axial compression performance of the specimens. In all three groups (A-type, B-type, and C-type), the equal limb specimens (limb length ratio = 1) possessed higher initial stiffness and peak load than their unequal limb counterparts (limb length ratio = 1.5), which indicates that a more balanced distribution of limb lengths enhances the overall stiffness and load-carrying capacity of L-shaped CFST columns.
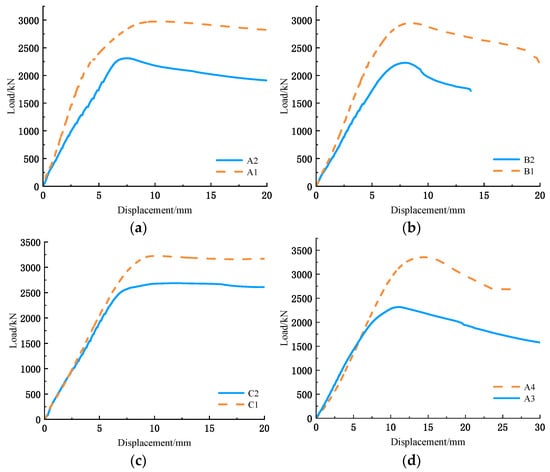
Figure 11.
Influence of limb length ratio (inter-limb angle): (a) A-type specimens; (b) B-type specimens; (c) C-type specimens (d) A3 and A4.
For A-type and B-type specimens, the load–displacement curves of the unequal limb specimens showed a steeper and more pronounced post-peak decline, while the equal limb specimens exhibited a more gradual reduction in bearing capacity, indicating improved deformation capacity. For C-type specimens, the post-peak decline was not obvious within the tested displacement range, and the curves remained relatively flat, which suggests that the C-type configuration can effectively delay the onset of significant strength degradation, especially when combined with a balanced limb length ratio.
- (4)
- Influence of inter-limb angle
Figure 11d shows the influence of inter-limb angle on the axial compression performance of the specimens. The initial stiffness of the specimens exhibited a decreasing trend with the increase in the inter-limb angle, which is attributed to the reduced geometric compactness and increased bending susceptibility around the weak axis for larger inter-limb angles.
During the later stage of loading, the bearing capacity of A4 tended to stabilize after a significant decrease, while that of A3 rapidly decreased with a stepped decrease in the process, which is caused by weld cracking at the external corner.
4.2. Influence Coefficient of Bearing Capacity
The test results demonstrated that the peak load is sensitive to the cross-section form, limb length ratio, and inter-limb angle. To evaluate the magnitude of change in the peak load, an index SI is proposed, with its definition given below.
where NK,max is the peak load of the reference specimen, for specimens with an inter-limb angle of 90°, specimen B2 was taken as the reference. For specimens A3 and A4, specimen A3 was used as the reference; Nmax is the peak load of the specimen.
The SI values of all specimens are listed in Table 3, and Figure 12 presents a comparison of the SI values among the specimens. For specimens with different cross-section forms, the peak load of specimens A2 and C2 increased by 4% and 20% compared to specimen B2, respectively. Similarly, the peak load of A1 and C1 was about 1% and 13% higher than that of B1. The comparisons clearly show that, under both equal limb and unequal limb conditions, the C-type specimens exhibit the highest peak load, followed by the A-type, while the B-type specimens have the lowest capacity.
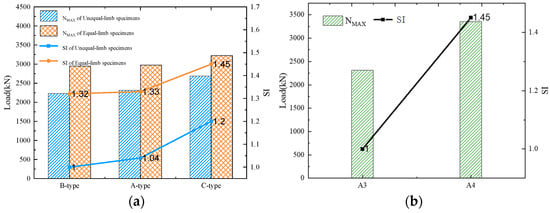
Figure 12.
Influence coefficient of bearing capacity: (a) Specimens with different cross-section form; (b) A3 and A4.
The higher peak load of the C-type specimens can be mainly attributed to the following reasons. The C-type specimens were assembled from multiple intact square steel tubes, making them less sensitive to welding imperfections and providing stronger confinement to the infilled concrete. In addition, the C-type specimens had a higher steel ratio in the cross-section, which further enhanced their peak load.
For specimens with different limb length ratios, the peak load of A1, C1, and B1 increased by 29%, 32%, and 25% compared to A2, C2, and B2, respectively. This confirms that a limb length ratio of 1.0 is more favorable for achieving higher axial compressive capacity than a ratio of 1.5 for all three cross-section forms.
Among the specimens with non-90° inter-limb angles, specimen A4 (135°) exhibited a 45% increase in bearing capacity compared with specimen A3 (60°). The primary reason for this phenomenon is attributed to the fact that a smaller inter-limb angle causes internal forces to be predominantly concentrated within the chambers between the two flanges. As the angle increases, the stress distribution across the cross-section becomes more uniform, thereby leading to an enhancement in the bearing capacity.
4.3. Ductility Characteristics of Specimens
The ductility of the specimen is quantitatively assessed in this study using the displacement ductility coefficient μ, which is defined as follows:
where de is the displacement corresponding to Ne; dy represents the yield displacement. The specific definitions of de and dy are provided in the notes to Table 3.
As shown in Table 4, the displacement ductility coefficients of each specimen range between 1.69 and 4.04, indicating that the specimens have strong ductility. A comparison of the displacement ductility coefficients of all specimens is shown in Figure 13.
Table 4.
Displacement ductility coefficients of specimens.
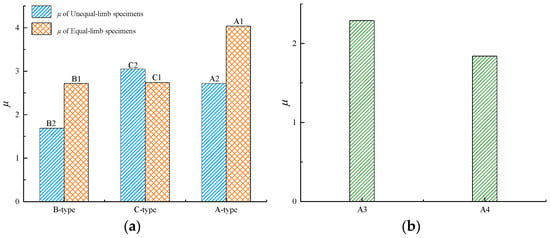
Figure 13.
Displacement ductility coefficient: (a) Specimens with different cross-section form; (b) A3 and A4.
Based on the data in Table 4, the ductility characteristics of the specimens are discussed in the following aspects:
- (1)
- Influence of cross-section form
The coefficient μ of the A-type and C-type specimens is much higher than that of B-type specimens. The A-type and C-type test assembly do not require weld seams at their external corners, which avoids weld cracks caused by severe corner deformation of the specimens during the later loading stage. In B-type specimens, welds at the external corners are prone to cracking under large compressive deformation, which causes an abrupt loss of bearing capacity and reduces the available ductility.
- (2)
- Influence of limb-length ratio
For both A-type and B-type specimens, the coefficient μ of specimens with a limb length ratio of 1 is markedly improved relative to that of specimens with a limb length ratio of 1.5. μ of the specimen A1 increases by 48% compared to A2; μ of the specimen B1 increases by 61% compared to B2. The results indicate that a balanced limb length configuration not only enhances bearing capacity but also provides more stable post-peak deformation. However, the displacement ductility of C-type specimens shows a slight decrease. This is due to the fact that the test was terminated after the axial distortion of the specimen reached around 20 mm, although there was no noticeable downward trend in the C-type specimen at this time. As a result, as for the C-type specimens, de in the coefficient μ is defined as the final displacement under loading rather than the corresponding displacement when the bearing capacity of the specimen is reduced to 85% of the peak load.
- (3)
- Influence of inter-limb angle
The coefficient μ of the specimen reduces to some extent as the angle between the two limbs rises. When compared to specimen A3 (60°), μ of specimen A4 (135°) dropped by 24%. This is due to the fact that when the angle between the two limbs surpasses 90°, the specimen is more prone to overall bending around the weak axis, thus resulting in a decrease in ductility. As a result, when adopting special-shaped columns with relatively large inter limb angles, the detrimental influence of the angle on ductility should be considered to ensure an adequate level of structural safety.
It should be noted that, for safety reasons, loading of specimens A1, C1, C2, and A3 was terminated before the load-carrying capacity decreased to 85% of the peak load. However, this does not affect the above conclusions for the following reasons:
- (1)
- For specimens A1 and C1, the load–displacement curves indicated that, if loading had continued, the ultimate displacement would have exceeded the current de value, leading to a further increase in the displacement ductility coefficients of A1 and C1. This is consistent with the conclusion that the A-type and C-type specimens exhibited higher displacement ductility than the B-type specimens. Similarly, continued loading of specimen A3 would result in a larger de, and thus a higher displacement ductility coefficient than specimen A4, which also agrees with the conclusions drawn above.
- (2)
- For specimens C1 and C2, in the late loading stage, specimen C1 did not show an evident descending trend in capacity, whereas specimen C2 exhibited a pronounced post-peak decrease. If loading had continued, the ultimate displacement of C1 would be markedly larger than that of C2, resulting in a higher displacement ductility coefficient for C1 than for C2. This is also consistent with the earlier conclusion that specimens with a limb length ratio of 1 exhibited higher ductility than those with a limb length ratio of 1.5.
4.4. Characteristics of Strain Distribution
Figure 5 depicts the strain gauge configuration of each specimen. The evolution of the steel tube strain during loading for each specimen is shown in Figure 14, where positive values denote tensile strain and negative values denote compressive strain.
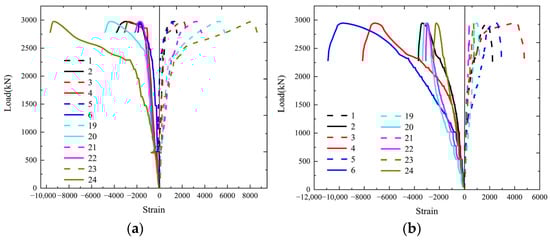
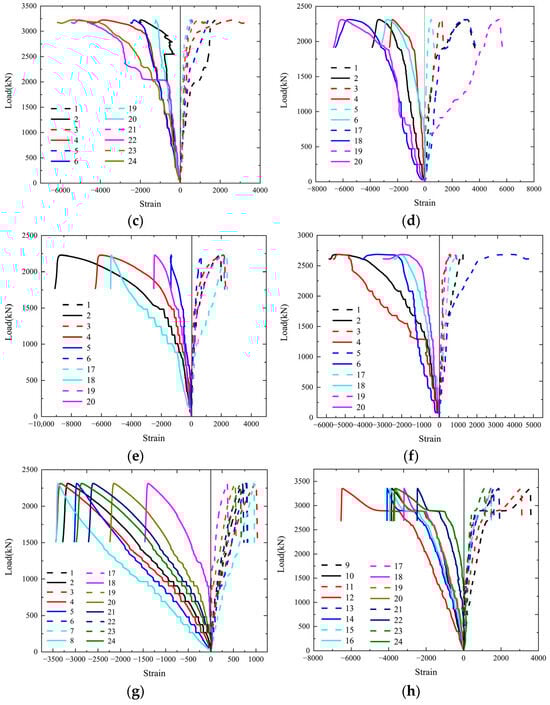
Figure 14.
Load–strain curve of each specimen’s middle section: (a) A1; (b) B1; (c) C1; (d) A2; (e) B2; (f) C2; (g) A3; (h) A4.
For A-type specimens (Figure 14a,d), the maximum longitudinal and transverse strains were found at the external corners, whereas the minimum strains were found at the cavity in the flange. The peak value of the maximum longitudinal and transverse strain rises as the limb length ratio falls. The distribution indicates that the external corners are the most critical regions under axial compression.
For B-type specimens (Figure 14b,e), the maximum longitudinal strain occurred at the corners, while the maximum transverse strain occurred at the middle cavity. The phenomenon is consistent with the observed failure mode, in which corner weld cracking and local outward bulging at the cavities were prevalent. The strain distribution further confirms that the presence of corner welds in B-type sections intensifies stress concentration and reduces the reliability of the cross-section.
For C-type specimens (Figure 14c,f), the maximum longitudinal and transverse strains occurred at the external corners or ends. The longitudinal and transverse stress of the unequal limb specimen decreased for a period and then became stable, whereas that of the equal limb specimen continued to increase after a period of decrease, indicating that the performance of the C1 steel pipe in the specimen was not fully utilized and can still bear. The continuous square tubes in the C-type cross-section provide more uniform confinement to the concrete and delay the onset of local buckling, which is consistent with the high bearing capacity and favorable post-peak performance observed in the load–displacement curves.
The strain development of specimens A3 and A4 is shown in Figure 14g,h. For specimen A3 (60°), both the maximum longitudinal strain and the maximum transverse strain occur at the flange ends, which is consistent with the failure mode observed in the tests. Specimen A4 (135°) experienced overall bending under compression; accordingly, its maximum longitudinal strain is located in the inner-corner flange, whereas the maximum transverse strain is found in the outer-corner flange. The strain distribution corroborates the change in failure mode from predominantly local buckling of the steel tube at small inter-limb angle to overall bending instability at larger angle.
4.5. Overall Discussion
Based on the above results, the following insights can be drawn regarding the axial compression behavior of L-shaped CFST columns with different cross-section forms and geometric parameters (limb length ratio and inter-limb angle):
- (1)
- C-type specimens consistently exhibit the highest ultimate bearing capacity and favorable post-peak behavior, followed by A-type specimens, while B-type specimens show the lowest capacity and ductility. The key reason is that C-type sections are composed of complete square steel tubes, which minimize the influence of weld quality, improve the confinement of core concrete, and delay local buckling at the external corners. In contrast, B-type sections rely on welds at critical corners, making them sensitive to weld defects and prone to sudden capacity loss.
- (2)
- Specimens with a limb length ratio of 1 show higher initial stiffness, larger ultimate load, and better ductility than those with a ratio of 1.5, regardless of cross-section form. A balanced limb length configuration leads to a more compact cross-section and reduces eccentricity and bending about the weak axis, thereby improving both strength and deformation capacity.
- (3)
- As the inter-limb angle increases, the initial stiffness decreases and the failure mode shifts from local buckling of the steel pipe to overall bending. While a larger angle (135°) can enhance the ultimate bearing capacity compared with a very small angle (60°) due to a more uniform stress distribution, it also reduces the ductility since the column becomes more susceptible to global flexural instability.
5. Calculation of Bearing Capacity
The axial compressive capacity of concrete-filled steel tubular (CFST) columns is generally evaluated using three principal theoretical approaches: the superposition method, the equivalent section method, and the unified theory. Building on these frameworks, existing design codes have developed different procedures for determining the load-bearing capacity of CFST members. To examine whether these code-based axial capacity expressions are applicable to the L-shaped CFST columns investigated in this study, the axial compressive strengths of the test specimens were calculated in accordance with GJB 4142-2000 [27], DBJ/T 13-51-2010 [28], ANSI/AISC 360-10 [29], Eurocode 4 [30], and CECS 159:2004 [31]. The code-based predictions are reported in Table 5, and their comparison with the corresponding experimental results is presented in Table 6.
Table 5.
Code-based calculation results.
Table 6.
Comparison between code-based and experimental results (code value / test value).
As shown by the data in Table 5 and Table 6, the axial capacities predicted by AISC, Eurocode 4, and CECS 159:2004 are all lower than the corresponding test results. This is mainly because the formulas in these codes are derived from the superposition principle and do not account for the confining effect of the steel tube on the core concrete, which leads to an underestimation of the load-carrying capacity. In contrast, the codes based on the unified theory (e.g., GJB 4142-2000 and DBJ/T 13-51-2010) incorporate the confinement effect of the steel tube and therefore yield predictions that agree better with the experimental behavior. Accordingly, the axial compressive capacity of the L-shaped CFST columns in this study is evaluated using the unified theory-based approach.
Based on the composite configuration and parameter range considered in this study, Li et al. [16] developed a series of finite element models in ABAQUS (2022), in which the steel strength, concrete strength, limb length ratio, and the inter-limb angle were taken as key variables, and carried out corresponding parametric analyses. All components of the finite element (FE) model were discretized using C3D8R elements. After a detailed sensitivity analysis, the mesh was generated according to the following principles: (1) the number of grid layers in the thickness direction of steel pipe components shall not be less than 2; (2) the steel pipe serves as the master surface, with a mesh size of 30 mm; the concrete serves as the slave surface, with a mesh size of 28 mm. In the analysis, all degrees of freedom at the bottom of the model were restrained, while only the Z-direction degree of freedom at the top was released, where an axial displacement was applied.
The Abaqus dynamic/explicit solver was adopted to efficiently handle large deformations, contact interactions, and potential material failure. For the contact between the infilled concrete and the inner surface of the steel tube, following the approach of Montuori et al. [32], a tangential interaction with a friction coefficient of 0.6 was specified to simulate interfacial sliding. To account for concrete crushing in compression and cracking in tension, the Concrete Damage Plasticity (CDP) model and the associated damage functions were employed. Moreover, referring to Montuori et al. [32], the dilation angle was used in place of the internal friction angle to address the limitations of the non-associated flow rule in capturing the pronounced plastic dilation of frictional materials in the CDP formulation. By extensive comparisons with test results, Li et al. [16] have validated the reliability of the above FE modeling approach.
To achieve a more accurate prediction of the axial compressive capacity of L-shaped CFST columns, the finite element data obtained herein were further processed by taking ξ0 as the horizontal axis and fsc/fc as the vertical axis, and a regression was performed to establish the relationship between fsc/fc and ξ0. As shown in Figure 15, the fitted curve indicates that fsc/fc varies approximately linearly with ξ0.
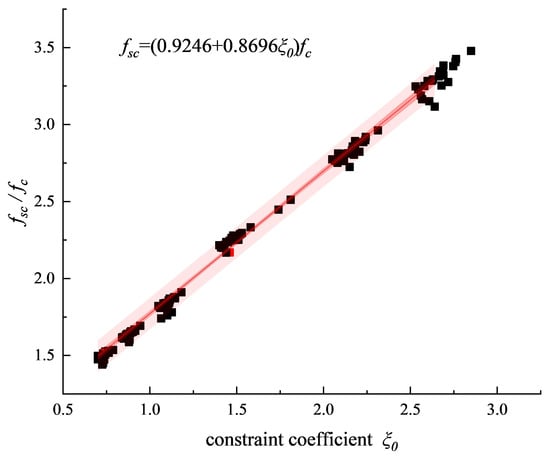
Figure 15.
Fitting curve.
On the basis of the above analysis, the following expressions were proposed for the bearing capacity of L-shaped CFST columns:
where Nu is the axial compressive bearing capacity of the CFST member; fsc is the equivalent axial compressive strength of concrete; Asc is the total cross-sectional area of the component; ξ0 is the confinement factor; fc is the design value of concrete compressive strength; αs is the steel content of the specimen; f is the design value of the steel compressive strength; Ac is the cross-sectional area of concrete; As is the cross-sectional area of steel.
To verify the reliability of the proposed formula, its predictions were compared with the experimental results, as summarized in Table 7. The average value of NF/NE, and the standard deviation is 0.047. The test results are in good accord with the calculated results, indicating a good calculation accuracy of the proposed simplified formula.
Table 7.
Calculated values and test values.
6. Conclusions
This study investigated the impacts of cross-section form, limb length ratio, and inter-limb angle on the axial compression behavior of 8 L-shaped CFST columns. Based on the unified theory, a calculation formula for the axial compressive capacity of the columns was proposed. The main conclusions of this study are as follows:
- Local bulging occurs after compression in the specimens with included angles of 90° and 60° between the two limbs, which is manifested as strength failure. The corner welds of the B-type specimens showed cracking problems. Local bulging and overall bending can be observed in the specimen with an included angle of 135° after compression, indicating both strength and bending failure.
- The cross-section form has a significant influence on both load-carrying capacity and ductility. For the equal limb specimens, the peak load of the C-type specimen increased by 8% and 9% relative to the A-type and B-type specimens, respectively, while the displacement ductility coefficient of the A-type specimen was approximately 48% and 47% higher than that of the B-type and C-type specimens, respectively.
- The equal limb specimens exhibited superior mechanical performance compared with the unequal limb specimens. The peak load of the equal limb specimens increased by more than 20%, and the displacement ductility coefficients of the A-type and B-type specimens increased by 48% and 61%, respectively.
- As the inter-limb angle increased, the peak load increased, whereas the ductility decreased, and the failure mode gradually shifted from local buckling of the steel tube to overall bending.
- The results obtained from the simplified formula agree well with the test results and thus can serve as a useful reference for engineering design.
It should be noted that only eight specimens were tested under concentric axial compression in this study, with limited variations in cross-section form, limb length ratio, and inter-limb angle, and with material strengths confined to a specific range. In deriving the axial capacity formula for L-shaped CFST columns, the fitted relationship between fsc/fc and ξ0 was mainly obtained from finite element results, and the experimental data used to validate the proposed formula were also limited. Therefore, when the cross-section form, geometric parameters, or material strengths of an L-shaped CFST column differ substantially from those considered herein, the applicability of the above conclusions requires further verification.
Future work may extend the investigation to L-shaped CFST columns under other loading conditions. The ranges of cross-section forms, geometric dimensions, and material strengths will also be expanded to better characterize their mechanical behavior. In addition, other special-shaped CFST columns, such as T-shaped and cruciform sections, can be studied to further promote the engineering application of special-shaped CFST columns.
Author Contributions
Conceptualization, Z.T.; methodology, H.L.; software, H.L.; validation, H.L.; formal analysis, H.L.; investigation, D.H. and M.W.; resources, Z.T.; data curation, D.H.; writing—original draft preparation, H.L.; writing—review and editing, Z.T.; visualization, M.W.; supervision, Z.T.; project administration, Z.T.; funding acquisition, Z.T. and H.L. All authors have read and agreed to the published version of the manuscript.
Funding
This research was funded by the Key Research and Development Program of Yunnan Provincial Department of Science and Technology, grant number 202003AC100001, and the Scientific Research Fund Project of Yunnan Provincial Department of Education, grant number 2024J1975, and Yunnan Open University, grant number 2025G20.
Data Availability Statement
The data used to support the findings of this study are available from the corresponding author on reasonable request.
Conflicts of Interest
The authors declare no conflicts of interest.
References
- Chen, H.B.; Wu, L.W.; Jiang, H.; Liu, Y. Seismic performance of prefabricated middle frame composed of special-shaped columns with built-in lattice concrete-filled circular steel pipes. Structures 2021, 34, 1443–1457. [Google Scholar] [CrossRef]
- Yang, Y.; Wu, C.; Liu, Z.; Qin, Y.; Wang, W. Comparative study on square and rectangular UHPFRC-Filled steel tubular (CFST) columns under axial compression. Structures 2021, 34, 2054–2068. [Google Scholar] [CrossRef]
- Montuori, R.; Nastri, E.; Piluso, V.; Todisco, P. Experimental and analytical study on the behaviour of circular concrete filled steel tubes in cyclic bending. Eng. Struct. 2024, 304, 117610. [Google Scholar] [CrossRef]
- Montuori, R.; Nastri, E.; Piluso, V.; Pisapia, A.; Todisco, P. Experimental study and finite element damage modelling of concrete-filled structural elements under pure bending. Structures 2025, 74, 108574. [Google Scholar] [CrossRef]
- Wang, Y.; Guo, L.; Li, H. L-shaped steel-concrete composite columns under axial load: Experiment, simulations and design method. J. Constr. Steel Res. 2021, 185, 106871. [Google Scholar] [CrossRef]
- Liu, J.; Yu, W.; Fang, Y.; Pan, Z. Experimental study on the seismic performance of concrete-filled steel tube columns with a multiple-chamber round-ended cross-section. Front. Mater. 2024, 11, 1363206. [Google Scholar] [CrossRef]
- Liu, J.; Yu, W.; Fang, Y.; Pan, Z.; Cao, G. Finite Element Analysis on the Seismic Performance of Concrete-Filled Steel Tube Columns with a Multiple-Chamber Round-Ended Cross-Section. Buildings 2024, 14, 1154. [Google Scholar] [CrossRef]
- Xie, S.; Isleem, H.F.; Almoghayer, W.J.K.; Ibrahim, A.A. Axial compressive behavior of reinforced concrete-filled circular steel tubular columns: Finite element and machine learning modelling. J. Big Data 2025, 12, 233. [Google Scholar] [CrossRef]
- Isleem, H.F.; Qiong, T.; Chukka, N.D.K.R.; Kumar, R.; Nagaraju, T.V.; Hamed, A.Y. Machine learning and nonlinear finite element analysis of fiber-reinforced polymer-confined concrete-steel double-skin tubular columns under axial compression. Struct. Concr. 2025, 26, 248–292. [Google Scholar] [CrossRef]
- Zheng, Y.; Yang, S.; Lai, P. Hysteretic behavior of multi-cell L-shaped concrete-filled steel tubular columns at different loading angles. Eng. Struct. 2020, 202, 109887. [Google Scholar] [CrossRef]
- Zheng, Y.; Liang, W.; Ma, S.; Zeng, S. Behavior of stiffened and multi-cell L-shaped CFST columns under eccentric compression. Thin-Walled Struct. 2022, 174, 109156. [Google Scholar] [CrossRef]
- Zheng, Y.; Zeng, S. Flexural behaviour of stiffened and multi-cell L-shaped CFSTs considering different loading angles. J. Constr. Steel Res. 2021, 178, 106520. [Google Scholar] [CrossRef]
- Chen, Z.; Xu, J.; Zhou, T.; Su, J. Seismic research on column base joint of L-shaped CFST columns under cyclic loading. Structures 2022, 45, 1212–1224. [Google Scholar] [CrossRef]
- Luo, Y.B.; Zhao, Y.C.; Chen, Y.B.; Lin, X.C.; Yan, J.B. Experimental Studies on Seismic Performance of UHPSFRC-Filled Square Steel Tubular Columns. Buildings 2022, 12, 798. [Google Scholar] [CrossRef]
- Alatshan, F.; Osman, S.A.; Altlomate, A.; Alkair, M.; Hamid, R.; Mashiri, F. Design Model of Rectangular Concrete-Filled Steel Tubular Stub Columns under Axial Compression. Buildings 2023, 13, 128. [Google Scholar] [CrossRef]
- Li, H.X.; Tao, Z.; Han, D.J. Finite Element Analysis of Axial Compression Behavior of L-Shaped Concrete-Filled Steel Tubular Columns with Different Combinations. Buildings 2024, 14, 730. [Google Scholar] [CrossRef]
- Zhou, X.; Wang, Z.; Wei, F. Study on the mechanical property of T-shaped CFSST composite columns subjected axial load. J. Shandong Jianzhu Univ. 2020, 35, 1–9. [Google Scholar]
- Zheng, Y.; Zeng, S. Design of L-shaped and T-shaped concrete-filled steel tubular stub columns under axial compression. Eng. Struct. 2020, 207, 110262. [Google Scholar] [CrossRef]
- Yang, Y.; Wang, G.; Yang, W.; Wei, X.; Chen, Y.F. Experimental research on fire behavior of L-shaped CFST columns under axial compression. J. Constr. Steel Res. 2022, 198, 107505. [Google Scholar] [CrossRef]
- Lei, M.; Li, Y.-L.; Li, Y.-Q.; Zhang, J.; Lin, Z.; Zhou, T.; Luan, W. Experimental study on concrete-filled L-shaped steel tubular columns and beam-columns. J. Build. Eng. 2024, 96, 110626. [Google Scholar] [CrossRef]
- Zheng, Y.; Zeng, S. Experimental study of stiffened L-shaped CFST columns under eccentric compressive loads with different loading angles. J. Build. Struct. 2021, 42, 264–270. [Google Scholar] [CrossRef]
- Liu, W.H.; Wang, X.; Guo, Y.-L.; Tian, Z.-H.; Li, J.-Y.; Bai, W.-H. Experimental and numerical study of L-shaped irregularly concrete-filled steel tube columns under axial compression and eccentric compression. J. Build. Eng. 2024, 84, 108572. [Google Scholar] [CrossRef]
- Shen, Y.; Tu, Y.; Li, T.; Li, Y. Experimental and numerical study of resistance of multi-cell L-shaped concrete-filled steel tubular stub columns under biaxial eccentric compressive loading. J. Build. Eng. 2023, 70, 106399. [Google Scholar] [CrossRef]
- GB50017-2017; Standard for Design of Steel Structures. China Architecture & Building Press: Beijing, China, 2017.
- GB/T 2975-2018; Steel and Steel Products-Location and Preparation of Samples and Test Pieces for Mechanical Testing. Standards Press of China: Beijing, China, 2018.
- GB/T 228.1-2021; Metallic materials-Tensile Testing—Part 1: Method of Test at Room Temperature. Standards Press of China: Beijing, China, 2021.
- GJB 4142-2000; Technical Specifications for Early-Strength Model Composite Structure Used for Navy Port Emergency Repair in Wartime. National Defense Industry Press: Beijing, China, 2001.
- DBJ/T 13-51-2010; Technical Specification for Concrete Filled Steel Tubular Structures. Housing and Urban-Rural Development of Fujian: Fuzhou, China, 2010.
- ANSI/AISC 360-10; Specification for Structural Steel Buildings. American Institute of Steel Construction (AISC): Chicago, IL, USA, 2010.
- EN 1994-1-1:2004; Design of Composite Steel and Concrete Structures. European Committee for Standardization (CEN): Brussels, Belgium, 2009.
- CECS 159: 2004; Technical Specification for Structures with Concrete-Filled Rectangular Steel Tube Members. China Planning Press: Beijing, China, 2004.
- Montuori, R.; Nastri, E.; Piluso, V.; Todisco, P. Finite element analysis of concrete filled steel tubes subjected to cyclic bending. Eng. Struct. 2024, 314, 118364. [Google Scholar] [CrossRef]
Disclaimer/Publisher’s Note: The statements, opinions and data contained in all publications are solely those of the individual author(s) and contributor(s) and not of MDPI and/or the editor(s). MDPI and/or the editor(s) disclaim responsibility for any injury to people or property resulting from any ideas, methods, instructions or products referred to in the content. |
© 2025 by the authors. Licensee MDPI, Basel, Switzerland. This article is an open access article distributed under the terms and conditions of the Creative Commons Attribution (CC BY) license.