Abstract
Historic arcades in shaded street canyons may act as passive microclimate infrastructure. We monitored paired arcade–open points along two arcaded streets in Haikou, China, under clear summer conditions, recording hourly microclimate from 09:00 to 21:00. From these data we derived mean radiant temperature (Tmrt) and the Universal Thermal Climate Index (UTCI), tested main and interaction effects of space (arcade vs. open) and orientation (east–west vs. north–south), examined relations with sky view factor (SVF), and quantified exceedances of health-relevant thresholds using wet-bulb globe temperature (WBGT) and degree-hours. Arcades consistently lowered thermal exposure, with the largest benefits around midday–afternoon; the daily mean UTCI reduction was ~4.4 °C relative to adjacent open points. Orientation modulated benefits: east–west segments showed larger marginal reductions, and orientation differences were markedly compressed beneath arcades. SVF correlated positively with Tmrt and thermal stress but contributed little additional explanatory power after accounting for space and orientation, indicating geometric shielding as a primary mechanism. High-risk WBGT windows (≥32 °C) were strongly reduced under arcades, and day–night degree-hour summaries indicated net improvement. We conclude that historic arcades provide measurable thermal protection while preserving urban form, supporting their dual role as cultural heritage and passive climate-adaptation assets.
1. Introduction
Against the backdrop of global climate change, urban heat risk has emerged as a critical threat to human health and urban sustainability [1,2,3,4]. Tropical and subtropical regions are particularly vulnerable: high temperatures, high humidity, and frequent extreme heat waves intensify pedestrian heat exposure during everyday travel [5,6,7,8]. Extensive evidence shows that microclimatic conditions at the street scale strongly shape human thermal comfort. For pedestrians, the combined effects of air temperature, relative humidity, wind speed, and radiative flux determine heat stress [2,9,10]. Huang et al. coupled an urban canopy model (UCM) with a human–environment adaptive thermal stress module (HEATS) to simulate street-level heat stress more realistically [2]. Zhao et al. quantified the dynamic and non-uniform radiant environment that pedestrians experience in street canyons, underscoring the need to measure radiation explicitly to understand pedestrian comfort [9]. Exploring how street spatial form mediates pedestrian heat exposure is therefore both a pressing scientific problem in climate adaptation and a practical need for building healthy, sustainable cities [1,4,8,11,12]. Recent modelling work further demonstrates that population-scale exposure to extreme heat is shaped by the interaction of mesoscale climate drivers and local street-scale form [1,4,8,11].
Within this context, historic districts and heritage spaces play a dual role. On one hand, they are repositories of local memory and everyday social life, expressing regional building wisdom and cultural identity [13,14]. On the other, many traditional spatial forms embody passive climatic strategies that can inform contemporary urban adaptation [15,16]. Empirical work by Atawneh and Alqadi shows that shaded street environments can improve pedestrian thermal comfort and support climate adaptation [1]. A representative case in Southeast Asia and southern China is the arcaded “qilou” street. Combining commercial and public-life functions, arcades provide continuous shade and rain protection, while local ventilation and shielding can reduce heat exposure [17]. As regional cultural heritage, arcades possess social and cultural value and embed passive climatic know-how [18]. Yet this dual value remains under-quantified and lacks systematic testing.
A growing literature demonstrates that street geometry—such as height-to-width ratio (H/W), openness, and sky view factor (SVF)—and street orientation (east–west, E–W, versus north–south, N–S) modulate microclimate [8,19,20,21,22,23]. Building on Oke’s foundational street-canyon climatology [20], numerous field and modeling studies have clarified how geometric parameters couple to radiative exchange. For example, Ali-Toudert and Mayer [21] showed via numerical simulation that H/W and orientation substantially affect pedestrian thermal comfort: higher H/W can enhance shading and improve microclimate, while E–W canyons in summer more readily receive direct solar exposure than N–S canyons, elevating surface temperatures and discomfort. Li et al. [22] further highlighted SVF as a key determinant of canyon thermal conditions, with lower SVF generally associated with improved comfort. More recently, Wang et al. combined solar trajectories with street view images to quantify how SVF and street orientation jointly regulate the spatio-temporal pattern of solar radiation in street networks [23]. Despite these advances, most studies focus on modern urban fabric, with limited attention to historic districts.
Established heat-exposure metrics in heat-exposure assessment has popularized indices such as the Universal Thermal Climate Index (UTCI) and the wet-bulb globe temperature (WBGT), together with radiative parameters such as mean radiant temperature (MRT), for assessing pedestrian-level comfort and health risk; these indices and parameters are now widely used internationally [9,24,25,26]. Leveraging multi-source data, Guo et al. [27] built a street-scale comfort model using XGBoost with SHAP interpretation and revealed marked spatial heterogeneity. Nasrollahi et al. [28] emphasized the role of urban geometry and shading in improving pedestrian comfort, and Coutts et al. [29] demonstrated the cooling and comfort benefits of street trees. Collectively, these studies validate UTCI, MRT, and WBGT as valuable metrics for pedestrian comfort assessment; however, systematic empirical evidence from historic arcaded streets remains scarce. Accurate estimation of MRT and WBGT, however, depends on resolving complex radiant exchanges and adhering to instrument standards for globe thermometers and microclimate measurements [30,31,32].
In heritage discourse, UNESCO’s Historic Urban Landscape (HUL) framework integrates heritage conservation with sustainable development goals, encouraging attention to environmental, social, and ecological values in conservation practice [33]. This perspective supports inquiry into the adaptation potential of heritage streets. Smith et al. [34] argue that heritage sites archive experiential knowledge for coping with environmental shocks and stresses. While a few cases consider the microclimatic potential of traditional settlements or arcaded buildings, most remain at the level of numerical simulation or qualitative description; systematic, measurement-based comparisons of pedestrian heat exposure—especially those testing orientation differences and the geometry–radiation–comfort mechanism chain—are still limited. Field-based assessments that directly link heritage morphology, radiative environments and heat-stress indices therefore remain rare.
Moreover, many studies overlook the balance between daytime benefits and nighttime penalties, and there is a lack of compact indicators that synthesize “daytime cooling gains” against “nocturnal heat retention.” Few evaluations adopt health-risk thresholds (e.g., WBGT ≥ 28/32 °C) to appraise adaptation performance in heritage streets, even though such thresholds are widely used in occupational and physiological heat-stress research [25].
To address these gaps, this study investigates two typical arcaded streets in Haikou—Zhongshan Road (E–W) and Bo’ai North Road (N–S)—and poses four research questions: (i) relative to the road center in full sun, do arcades significantly reduce pedestrian heat exposure and is this effect temporally stable across the day? (ii) does street orientation modulate the arcade cooling effect, including space–orientation interactions? (iii) does sky view factor (SVF) operate as the geometric–radiative pathway mediating the arcade effect? (iv) when daytime gains and nocturnal penalties are considered jointly, do net benefits emerge and are the frequency and duration of health-relevant WBGT exceedances reduced?
This study advances the field in four ways: (i) it provides in situ evidence from historic districts that quantifies the pedestrian-level cooling benefits of arcades; (ii) by incorporating SVF and comparing alternative models, it characterizes a pathway whereby street geometry, mediated by radiative exchange, shapes pedestrian thermal comfort, and delineates operational geometric thresholds; (iii) it introduces a compact day–night indicator—the Daytime–Nighttime Climate Resilience Index (DCRI)—to summarize net benefits; and (iv) it demonstrates material reductions in WBGT exceedances, clarifying the dual role of arcades as cultural heritage and passive climate-adaptation infrastructure in hot–humid cities.
Briefly, we conduct paired sampling on arcaded and adjacent open segments with hourly in situ observations of air temperature (Ta), relative humidity (RH), wind speed (Va), and globe temperature (Tg) for WBGT, together with hemispherical imagery for SVF from 09:00–21:00 under clear-sky summer conditions. From these data we compute mean radiant temperature (MRT), the Universal Thermal Climate Index (UTCI), and DCRI; test main and interaction effects of space (arcade vs. open) and orientation (E–W vs. N–S) via two-way ANOVA; examine SVF–thermal relations with regression diagnostics; and evaluate exceedances of health-relevant WBGT thresholds (Figure 1).
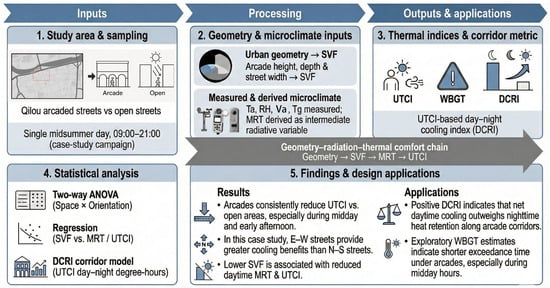
Figure 1.
Study workflow. Study area and sampling of Qilou arcaded streets versus open streets; field measurements of microclimate and geometry (air temperature Ta, relative humidity RH, globe temperature Tg/WBGT, wind speed Va, sky view factor SVF); derivation of thermal indices (mean radiant temperature MRT, Universal Thermal Climate Index UTCI) and the day–night cooling corridor metric (DCRI); statistical analysis (two-way ANOVA and regression); and key findings and design applications. * Single-day case study (09:00–21:00) on a clear midsummer day. ** WBGT meter: portable, non-ISO 7243-compliant; WBGT values interpreted qualitatively.
2. Materials and Methods
2.1. Study Area
This study focuses on two typical historic arcaded streets in Haikou, Hainan Province, China—Zhongshan Road and Bo’ai North Road. Both lie within the historic core and retain continuous ensembles of early-twentieth-century arcade buildings, serving simultaneously as cultural heritage assets and everyday public spaces. Zhongshan Road runs primarily east–west, with comparatively tall frontages and a continuous arcade, whereas Bo’ai North Road runs north–south, has a narrower cross-section, and shallower arcades. These contrasts in form and orientation provide a natural experiment to compare how arcades regulate the pedestrian heat environment under different spatial configurations. On each street we established paired observation points at the road center (Open) and beneath the arcade (Arcade), enabling direct comparisons of heat exposure under shaded versus unshaded conditions within the same meteorological background (Figure 2). This study is designed as a single clear-sky late-summer case study; its findings primarily elucidate how street geometry and arcades shape pedestrian heat exposure at the site scale, rather than providing long-term climatological frequencies or city-wide generalizations (Figure 1). Figure 2 locates the six paired sites (A–F) and illustrates the sampling layout along the two streets.
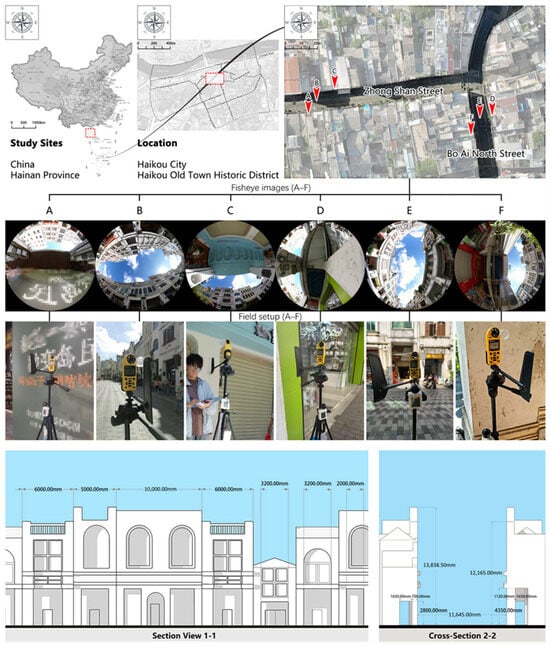
Figure 2.
Study area and sampling in Haikou Old Town. (Top row): national, provincial, and district maps with the sampling frame, and orthophoto showing six paired sites (A–F) along Zhongshan Road (E–W) and Bo’ai North Road (N–S). (Second row): hemispherical photographs at sites A–F used to estimate sky view factor (SVF). (Third row): field setup photographs of instruments and their deployment. (Bottom row): Section View 1–1 showing a typical arcade façade and Cross-Section 2–2 showing the street-canyon and arcade profile.
2.2. Meteorological Data Collection
Field measurements were conducted on 12 September 2025 under representative late-summer clear-sky conditions with stable solar radiation. The observation window spanned 09:00–21:00, covering the main daytime and evening activity hours and the expected peak heat-stress period in Haikou’s late-summer season, in order to capture the diurnal evolution of the pedestrian heat environment (Figure 3). We recorded air temperature (Ta), relative humidity (RH), wind speed (Va), globe temperature (Tg), and the wet-bulb globe temperature (WBGT). Ta, RH, and Va were measured with a Kestrel 5500 (NK5500; NK Home Products LLC, Birmingham, MI, USA) handheld weather meter; Tg and WBGT were measured with an AZ 87783 WBGT globe thermometer (AZ Instrument, Taichung City, Taiwan). Before each reading, instruments were allowed to stabilize for 2–3 min; the globe thermometer was left to equilibrate with ambient conditions to reduce radiative lag [30]. Sensors were mounted on tripods at approximately 1.5 m above ground and kept level, with the operator positioned to avoid body shading or blockage. Data were logged every 5 min; each record comprised three repeated readings whose mean was used to reduce short-term fluctuations (Figure 3).
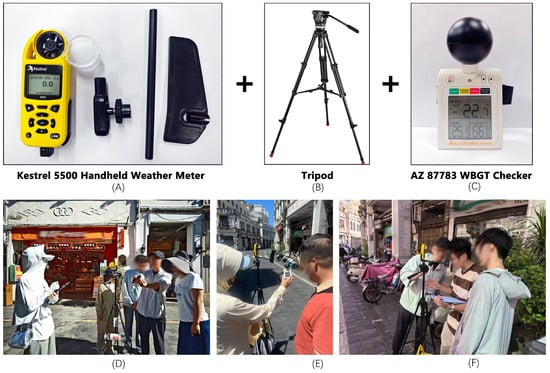
Figure 3.
Field instruments and deployment. (A) Kestrel 5500 handheld weather meter (TA, RH, Va) with mounting accessories; (B) tripod; (C) AZ 87783 WBGT checker (TG/WBGT). (D–F) Examples of in situ measurements under arcades and at open street centers.
The AZ 87783 is a portable WBGT device utilizing a 40 mm black globe and a psychrometric wet-bulb sensor, which deviates from the standard 150 mm globe and natural wet-bulb sensor specified in ISO 7243 [25]. As demonstrated by Cooper et al. [31] and d’Ambrosio Alfano et al. [32], such non-standard portable instruments tend to systematically underestimate MRT and WBGT values, particularly under conditions of low wind speed and high solar radiation. Consequently, the WBGT measurements in this study are interpreted as qualitative indicators for comparing the relative thermal performance of Arcade versus Open spaces, rather than as absolute occupational safety certifications. The accuracy and resolution of Ta, RH, and va measured by the Kestrel 5500 comply with the general requirements for thermal-environment instruments in ISO 7726 [30]. Detailed metrological specifications of the instruments used, compared with the requirements for Class S (Stress) instruments in ISO 7726, are provided in Supplementary Table S1.
2.3. Sky View Factor (SVF): Acquisition and Computation
Street-level hemispherical images were acquired with a Ricoh 360° panoramic camera mounted on a tripod at 1.5 m, carefully levelled and oriented toward true north. Images were standardized via a Python 3.9 workflow (polar projection and rotation correction) to produce comparable fisheye frames. A custom routine then generated binary sky masks by threshold segmentation (gray value > 16 classified as sky), assuming an equidistant fisheye projection. SVF was computed by pixel-wise weighted integration over the hemispherical field of view. In continuous form,
where V is a binary visibility mask and θ the zenith angle. The discrete estimator applied to the fisheye image domain Ω was
To enhance transparency and reproducibility, all steps (masking, weighting, and integration) were implemented in open scripts rather than proprietary software. A debug mode overlays the circular field-of-view boundary and highlights sky pixels to facilitate manual quality control, consistent with recent SVF-based street-canyon analyses [20,23,35].
2.4. Metrics and Statistical Analysis
Based on the meteorological and geometric inputs, we derived mean radiant temperature (MRT) and the Universal Thermal Climate Index (UTCI) at each paired point (Arcade vs. Open). MRT was obtained from globe temperature Tg, air temperature Ta, and wind speed Va using the standard energy-balance relationship for a 50 mm black globe recommended for thermal-environment assessments [30]. UTCI was then computed as an equivalent temperature index from Ta, Va, relative humidity, and MRT using the polynomial approximation proposed by Bröde et al. [24]. WBGT was used to evaluate health-relevant thresholds. All sensors were aligned in time; raw 5 min logs were resampled to 15 min means to suppress noise. The observation window was 09:00–21:00 (12 h).
Two-way ANOVA. To test whether street orientation modulates the arcade effect on heat exposure, we fitted a two-way ANOVA to hourly UTCI (09:00–21:00) with Space (Arcade vs. Open) and Orientation (E–W vs. N–S) as fixed factors and their interaction. For descriptive contrasts, data were stratified into morning (09:00–11:00), noon (11:00–14:00), afternoon (14:00–17:00), and evening (17:00–21:00) and compared on means with 95% CIs.
SVF models. To probe the geometry → radiation → comfort pathway, we estimated ordinary least-squares (OLS) regressions for UTCI and MRT with unstandardized coefficients. Model A included Space + Orientation; Model B additionally included SVF measured at each point. Dummy coding was Space (Open) relative to Arcade and Orientation (N–S) relative to E–W; SVF is dimensionless (0–1). Model performance was compared using R2/adjusted R2, AIC/BIC, and the change in fit (ΔAIC, ΔBIC).
Threshold analysis. WBGT exceedance shares were computed as the percentage of aligned hours (09:00–21:00) above 28 °C (“heat stress”) and 32 °C (“high heat risk”) for Arcade and Open, respectively. Thresholds were selected based on ISO 7243:2017 reference values. Assuming a metabolic rate of approximately 300 W (Class 2, moderate metabolic rate), which corresponds to walking at 2.5 to 5.5 km/h (similar to the activity assumed in UTCI calculations), the reference limit values (ALs) for acclimatized persons are approximately 28 °C. The 32 °C threshold represents a high-risk limit for unacclimatized persons or higher metabolic rates [25]. In this study they are used to compare the relative frequency and duration of hazardous conditions between Arcade and Open rather than to issue prescriptive occupational safety guidelines.
Daytime–Nighttime Climate Resilience Index (DCRI).
To summarize the balance between daytime cooling and evening/nighttime heat-retention in a policy-friendly way, we computed the DCRI as degree-hours normalized by 12 h (units: °C·h/12 h) from measured UTCI. In continuous form,
where UTCIopen and UTCIarcade are UTCI (°C) at the open street centre and beneath the arcade, respectively. “Day” is 09:00–18:00 and “night” is 18:00–21:00 within our 12 h observation window; the denominator (12) normalizes by total hours to enable comparability across street sections (units: °C·h/12 h). Under discrete observations with 15 min steps (Δt = 0.25 h), the estimator is
Interpretation follows directly: DCRI > 0 indicates net benefit (daytime cooling exceeds evening/night penalty), whereas DCRI < 0 indicates net penalty. For communication, we classify normalized DCRI (°C·h/12 h) into four grades: >1.0 (Excellent: substantial net cooling), 0.5–1.0 (Good: balanced diurnal performance), 0–0.5 (Moderate: limited cooling; nighttime ventilation advisable), and <0 (Poor: pronounced evening/night heat retention). Comparing DCRI across orientations and geometric configurations reveals diurnal asymmetry in thermal resilience and provides an operational metric for climate-responsive retrofits in historic arcaded streets. Conceptually, DCRI is analogous to degree-hour exposure metrics used in heat-risk assessments [5], but tailored here to contrast arcade and open-street conditions.
Analyses were performed in standard statistical environments; significance was assessed at α = 0.05 with two-sided tests, and 95% confidence intervals are reported where relevant.
2.5. Data Quality Control and Uncertainty
Prior to deployment, instruments were checked for calibration status, battery level, and sensor health. During measurements, stabilization protocols were followed (including globe-sensor equilibration), and the panoramic camera was levelled and azimuth-corrected to ensure comparability across images. All observations were undertaken by the same team to minimize operator variability. For SVF, potential errors stem from cloud contamination and transient obstructions; therefore, imagery was collected on a clear, low-cloud day, a uniform segmentation threshold was applied, and outliers were removed after visual inspection. For meteorology, variables such as wind speed exhibit high short-term variability; we used repeated readings, averaging, and light post-processing smoothing to reduce noise. These measures collectively limit systematic bias and random error, supporting robustness and reproducibility of the dataset. We also note that uncertainties in radiative flux estimation and globe-thermometer response can propagate into MRT and UTCI [32,36,37]; therefore, our interpretation emphasizes relative contrasts between Arcade and Open rather than the absolute value of any single index.
3. Results
In what follows, we use the Universal Thermal Climate Index (UTCI) as the primary outcome to describe the spatio-temporal patterns of pedestrian heat stress (Section 3.1 and Section 3.2), mean radiant temperature (MRT) as the radiative intermediary in the geometry–radiation link (Section 3.3), and wet-bulb globe temperature (WBGT) together with the Daytime–Nighttime Climate Resilience Index (DCRI) as threshold- and duration-based summaries of health-relevant exposure (Section 3.4 and Section 3.5). UTCI integrates Ta, Va, RH, and MRT into an equivalent-temperature index of outdoor thermal stress, whereas MRT isolates the combined radiative load and WBGT is widely used as an empirical heat-stress indicator in occupational and public-health assessment. Accordingly, the main and interaction effects of Space and Orientation are reported for UTCI, while MRT and WBGT are used to interpret mechanisms and the compression of high-risk exposure windows.
3.1. Overall Cooling Effect of Arcades
Across the full day, the UTCI curve under arcades was consistently lower than in the open, with the clearest separation at midday–afternoon (Figure 4). Figure 4A plots the grand mean across all six Arcade locations and all six Open locations. Daily mean UTCI was 34.8 °C (Arcade) versus 39.2 °C (Open), yielding a mean difference Δ(Arcade–Open) = −4.4 °C (Welch’s t = −7.9, p = 2.00 × 10⁻¹²; Cohen’s d = 1.29, large). The 95% confidence interval for this mean difference did not cross zero, indicating a robust cooling signal at the daily scale. The inset in Figure 4A reports this daily mean difference together with its 95% CI, while the shaded bands show ±1 SEM at each hour.
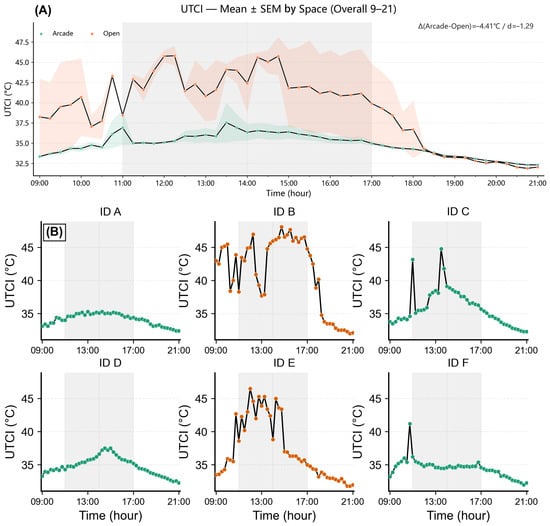
Figure 4.
Overall cooling effect of arcades along Qilou streets. (A) Hourly UTCI (mean ± 1 SEM) for Arcade vs. Open from 09:00 to 21:00; the grey band highlights the main daytime analysis window (11:00–17:00). The in-panel annotation reports the mean Arcade–Open difference ΔUTCI and Cohen’s d over this window. (B) Site-wise time series (IDs A–F) plotted on a common y-axis for cross-site comparison.
Sub-period contrasts indicated pronounced diurnal heterogeneity: Morning (09:00–11:00), Δ = −4.9 °C, p = 7.23 × 10⁻⁴, d = 1.70; Noon (11:00–14:00), Δ = −6.9 °C, p = 1.15 × 10⁻¹², d = 2.85; Afternoon (14:00–17:00), Δ = −6.6 °C, p = 9.44 × 10⁻⁷, d = 2.18; Evening (17:00–21:00), Δ = −0.9 °C, p = 0.124 (ns), d = 0.45. Faceted time series by site (Figure 4) show higher and longer-lasting midday/afternoon peaks at Open points, whereas peaks are markedly dampened and decay faster under arcades. Despite variation in amplitude across locations, the ordering Arcade < Open holds for most hours. Taken together, in these highly shaded street canyons, arcades provide a stable and sizable cooling baseline during the key exposure window (11:00–17:00).
3.2. Orientation Differences and Interaction Effects
To test whether street orientation modulates the arcade effect on heat exposure, we fitted a two-way ANOVA to hourly UTCI values (09:00–21:00), with Space (Arcade vs. Open) and Orientation (E–W vs. N–S) as fixed factors and their interaction (Figure 5; Table 1). Space showed a strong main effect—arcades significantly reduced UTCI relative to open street centres, F(1, 290) = 120.21, p < 0.001, η_p2 = 0.293. Orientation also had a significant main effect, with mean UTCI differing between E–W and N–S segments, F(1, 290) = 15.98, p < 0.001, η_p2 = 0.052. Critically, the Space × Orientation interaction was significant, F(1, 290) = 18.90, p < 0.001 (marginal-means interaction p = 1.91 × 10⁻⁵), η_p2 = 0.061. The interaction plot indicates steeper “cooling slopes” from Open to Arcade on E–W streets and smaller reductions on N–S streets—i.e., while arcades lower UTCI under both orientations, gains are larger and more consistent on E–W segments, whereas orientation differences are pronounced in the Open condition but markedly compressed under Arcade (convergent error bars in Figure 5).
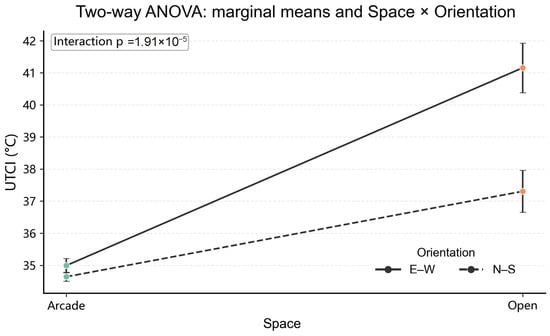
Figure 5.
Two-way ANOVA: marginal means and Space × Orientation interaction. UTCI marginal means are shown for Space (Arcade vs. Open) stratified by Orientation (E–W vs. N–S); error bars denote 95% confidence intervals of the marginal means. The in-panel label reports the p-value for the Space × Orientation interaction from the two-way ANOVA.

Table 1.
Summary of two-way ANOVA for UTCI (09:00–21:00).
This pattern accords with solar-path geometry: E–W canyons receive stronger midday–afternoon direct insolation at the road centre, elevating peaks and cumulative load at Open points, whereas the continuous linear shade of arcades extends the effective shielding period and yields higher marginal cooling returns on E–W streets.
3.3. SVF Marginal Effects and Mechanism
To probe the geometry → radiation → comfort pathway, we first examined bivariate associations between sky view factor (SVF) and thermal metrics, then assessed SVF’s incremental contribution after controlling for Space (Arcade vs. Open) and Orientation (E–W vs. N–S) (Figure 6; Table 2). Diagnostic fits showed positive SVF–UTCI and SVF–MRT relations—more open geometry corresponded to higher exposure—with R2 = 0.256 for UTCI and R2 = 0.298 for MRT (both p ≪ 0.001). It should be noted that while the absolute MRT values derived from small globes may be systematically underestimated [32], the positive correlation trend between openness (SVF) and radiative load remains physically valid for this qualitative impact assessment. In Figure 6, each point represents a single hourly observation and a single pooled OLS regression line is fitted to all Arcade + Open points, rather than separate lines by Space, to avoid overinterpreting the limited SVF variation within each group.
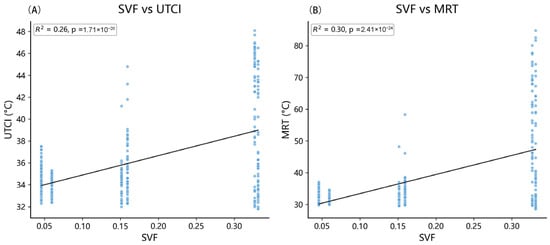
Figure 6.
Bivariate relationships between sky view factor (SVF) and thermal variables. (A) Relationship between SVF and UTCI. (B) Relationship between SVF and mean radiant temperature (MRT). Each dot represents one hourly observation across all sites and spaces; the solid line shows the ordinary least-squares fit to the pooled data, with regression statistics reported on the panels.
Table 2.
Regression models for UTCI and MRT with and without SVF.
In multivariable regressions, however, adding SVF to a baseline with Space and Orientation provided little to no gain in overall fit. For UTCI, Model A yielded R2 = 0.313 (Adj. 0.306, AIC 1032, BIC 1042); Model B (+SVF) gave R2 = 0.314 (Adj. 0.302) with penalties (ΔAIC = +1.9, ΔBIC = +5.1). The SVF coefficient was positive but not significant (β = +2.531, p = 0.48), while Space (Open) shrank (+5.273 → +4.694) and Orientation (N–S) changed slightly (−1.553 → −1.537). For MRT, Model A achieved R2 = 0.351 (Adj. 0.347, AIC 2206, BIC 2217); Model B remained R2 = 0.352 (Adj. 0.345) with penalties (ΔAIC = +1.92, ΔBIC = +5.6). SVF again positive but non-significant (β = +4.096, p = 0.39), with Space (Open) reduced (+15.533 → +14.611) and Orientation (N–S) nearly unchanged (−3.284 → −3.261). These patterns point to partial attribution rather than incremental explanatory power: in highly shaded historic canyons, Space and Orientation already partition much of the effective sky view and shading duration, so SVF’s unique variance is absorbed by this prior grouping; limited SVF range and fisheye noise further attenuate signal; and for UTCI, convective and evaporative processes dilute a purely radiative pathway.
Given the small number of street segments in this case-study, SVF was used as a parsimonious proxy for canyon openness and shading potential. Other geometric descriptors such as height-to-width ratio, arcade depth, and column spacing differ between sites but could not be entered simultaneously into regression models without overfitting. These parameters are therefore discussed qualitatively in Section 4.3 and highlighted in Section 4.6 as priorities for future parametric and design-oriented studies under fixed orientations.
3.4. Net Effect and the Daytime–Nighttime Climate Resilience Index (DCRI)
To communicate the balance between daytime gains and off-peak penalties in a policy-friendly way, we use the Daytime–Nighttime Climate Resilience Index (DCRI; Section 2.4), which aggregates the degree-hours of cooling under Arcade relative to Open during the daytime window and subtracts any penalty outside that window; values are normalized to 12 h (°C·h/12 h). Based on bootstrap resampling of the 15 min UTCI series (Figure 7), all four matched pairs yielded positive normalized DCRI. On Zhongshan Rd (E–W), the two arcade–open pairs (A vs. B and C vs. B) reached medians of 7.16 (95% CI 5.78–8.51) and 5.46 (4.23–6.73) °C·h/12 h, respectively. On Bo’ai N Rd (N–S), the corresponding pairs (D vs. E and F vs. E) showed smaller but still clearly positive medians of 2.54 (1.46–3.73) and 2.89 (1.78–4.03) °C·h/12 h. These values fall in the “Good–Excellent” range of our qualitative DCRI grading (Section 2.4) and indicate that, over the study day, daytime cooling consistently outweighed any evening/nighttime penalty at all sites, with substantially larger net benefits on the E–W street. At the same time, the confidence intervals remain fairly wide, especially for the N–S pairs, underscoring that these estimates are case-study level summaries rather than long-term climatological benchmarks.
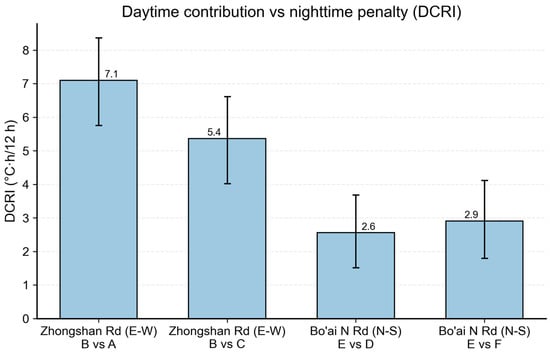
Figure 7.
Daytime–Nighttime Climate Resilience Index (DCRI; degree-hours normalized by 12 h) for the four paired sites: Zhongshan Road (E–W, B vs. A; B vs. C) and Bo’ai North Road (N–S, E vs. D; E vs. F). Bars show mean ± 1 SEM. Positive values indicate that daytime cooling outweighs the evening penalty.
3.5. Threshold Effects (WBGT)
From a health-risk perspective, we compared the share and duration of aligned hours within 09:00–21:00 that exceeded WBGT thresholds of 28 °C and 32 °C (Figure 8). It is important to note that due to the use of a non-standard 40 mm black globe and a psychrometric wet-bulb sensor, the absolute WBGT values reported here are likely underestimated compared to standard ISO 7243 measurements [31,32]. Therefore, the exceedance frequencies presented below should be interpreted as relative comparisons between Arcade and Open spaces rather than as precise absolute health risk assessments.
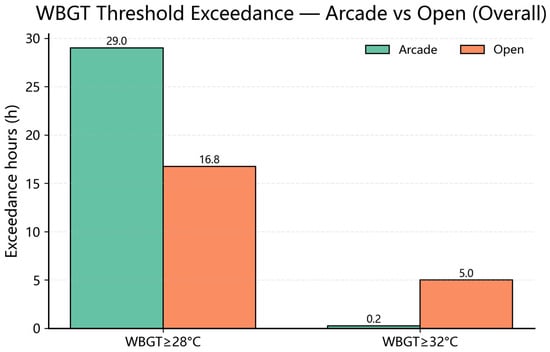
Figure 8.
WBGT threshold exceedance for Arcade vs. Open. Total hours during the study day when WBGT exceeded 28 °C and 32 °C for Arcade and Open locations. Bars show exceedance hours over the 09:00–21:00 period; numeric labels above the bars indicate the total hours above each threshold.
Summed across all sites, WBGT ≥ 28 °C occurred for 29.0 h in Arcade records versus 16.8 h at Open points, reflecting the combined effect of reduced midday peaks but slower evening cooling under arcades. In contrast, at the higher stress threshold WBGT ≥ 32 °C, exceedance was almost entirely confined to the open street centre: Open points accumulated 5.0 h above 32 °C, while arcades exceeded this threshold for only 0.25 h in total. Thus, while moderate WBGT loads remain common in both spaces on such hot days, the occurrence of extreme conditions (≥32 °C) appears strongly suppressed under arcades relative to the open street. These results are consistent with the mean UTCI and DCRI findings: arcades substantially reduce peak and cumulative heat stress during the key exposure window.
4. Discussion
4.1. Dual Value and Study Context: Heritage and Adaptation
Framed within the compound context of “historic street canyons–pedestrian heat exposure,” this case-study from Haikou’s hot–humid coastal climate indicates a stable cooling effect of arcades during the key midday–afternoon exposure window (see Section 3.1). The effect is not merely aesthetic or morphological; it is a measurable, manageable, and translatable function of passive climate adaptation. Moving beyond a one-way view that treats historic streets solely as objects of protection, our evidence supports integrating arcades into health-oriented street governance and walkability planning. This dual role resonates with the Historic Urban Landscape (HUL) approach, which advocates considering environmental performance and social use alongside cultural significance in heritage districts [33,34]. In the highly shaded canyons of Haikou’s old town, arcades reduce both average exposure and the share of high-risk hours (see Section 3.4 and Section 3.5), offering a realistic pathway for adaptive reuse of existing spatial stock. At the same time, the findings should be read as process-oriented evidence from a single tropical coastal city and not as a universal prescription for all urban forms or climates.
4.2. Mechanism Chain: Geometry (SVF) → Radiation (MRT) → Thermal Stress (UTCI)
Field evidence indicates that geometric openness, by altering the visible sky hemisphere and incident composition, first produces a determinate response at the radiative end (MRT), which then propagates to equivalent-temperature heat stress as captured by UTCI (see Section 3.3). The positive SVF–MRT and SVF–UTCI associations observed here (R2 ≈ 0.26–0.30) correspond to moderate effect sizes and are broadly consistent with prior work showing that lower sky view factors in street canyons are associated with reduced mean radiant temperature and improved pedestrian comfort in hot–humid and hot–dry cities [14,15,16,17,20,23,29,38]. In multivariable settings, SVF contributes little incremental fit in this sample and control structure, yet its inclusion reduces the Space (Arcade/Open) coefficient, suggesting partial mechanism attribution: geometric shielding is related to the Arcade–Open difference, although a single scalar SVF cannot capture the entire process. The limited SVF range in highly shaded historic canyons, measurement noise in fisheye-based estimates, and the strong modulation of UTCI by wind speed and humidity [7,8,24,28] all dilute the unique contribution of SVF once Space and Orientation already partition effective exposure. In hot–humid microclimates, this can be read as “determinacy on the radiative side, dilution at the equivalent-temperature index level” due to wind and humidity. Accordingly, geometric optimization (lower effective openness) should be coupled with ventilation corridors and evapotranspiration/material strategies to convert radiative gains into robust comfort improvements. Methodologically, “total SVF” should be extended toward sun-path–resolved measures of shading duration or reducible radiative baseline, modelled jointly with Orientation, arcade depth/continuity, tree canopies, and façade openness and compared against recent proposals to optimize SVF and vegetation for heat mitigation in hot–humid climates [20,22,23,29,39,40].
4.3. Directionality and Interaction: Why E–W Gains Are Larger
Two-way analyses show that orientation modulates the arcade effect and interacts with it (see Section 3.2). At Haikou’s low latitude, the midday–afternoon solar path yields a larger reducible radiative baseline at the road centre of E–W segments; eave lines then provide longer and more stable effective shading, producing larger Open → Arcade temperature drops. On N–S streets, direct sun alternates between flanks, so marginal returns are milder. Governance implications follow: prioritize continuity and effective depth of arcades on E–W heritage streets, maintaining eave lines and shading cadence; on N–S streets, increase effective depth, stabilize column spans, add canopy shade, and optimize façade openness to lengthen shading during key hours and narrow orientation-driven exposure gaps. Notably, arcades also compress orientation differences: under Arcade, E–W and N–S exposures converge (see Section 3.2). This directional asymmetry aligns with simulation and field studies that report stronger orientation effects in canyons where the solar path more frequently aligns with street axes [15,16,19,23].
4.4. Dialogue with Prior Work and Contributions
Along the classic shielding–radiation–comfort chain, prior evidence has relied heavily on simulation or single-segment cases. Heritage districts have been examined less frequently, although studies from historic cores in Cuba, China, and other hot–humid cities similarly underline the importance of canyon geometry and shading in shaping outdoor comfort [17,19,35,38,39,41,42]. This study advances the field in three respects. First, multi-site, full-day measurements in highly shaded historic canyons provide context-specific evidence that identifies a clear cooling baseline for key hours (see Section 3.1). Second, orientation is established as an interaction and interpreted through a geometric process—sun path → reducible radiative baseline → shading duration—making it actionable as coupled orientation–geometry strategies (see Section 3.2 and Section 4.3). Third, we propose and operationalize decision-oriented metrics—DCRI (daytime net benefit) and WBGT thresholds—which align with daily activity rhythms and health-risk management, extending “average improvement” to “compression of extreme windows” and furnishing comparable, auditable, and communicable performance language for conservation and renewal (see Section 3.4 and Section 3.5). By combining UTCI, MRT, and WBGT—indices widely used in occupational and public-health assessments of heat stress [24,30,35,38]—with corridor-based indicators such as DCRI, the analysis speaks to emerging work that frames climate change in terms of population exposure and risk duration rather than air temperature alone [3,4,5,27].
4.5. Robustness and Sensitivity
To avoid dependence on particular specifications, we conducted checks across model design, sample composition, statistical assumptions, and measurement uncertainty (technical details in the Supplementary Material). On models, we compared specifications without/with SVF and used MRT as an alternative outcome to verify the geometry–radiation pathway, with consistent direction (see Section 3.3). For inference, given group imbalance and potential heteroscedasticity, we used Welch tests, robust/cluster-robust standard errors, and nonparametric cross-checks; collinearity and condition numbers showed no structural reversals. For measurement, fisheye over-exposure and cloud contamination were handled via segmentation and manual review, and rolling-window tests examined the stability of the SVF–MRT slope. Uncertainty in radiative inputs and derived UTCI values, as discussed in numerical-weather and biometeorological studies [28,36], is partly addressed by the synchronized microclimate observations and consistency checks but cannot be eliminated completely. Across checks, the main conclusions held: arcades provide stable and sizable midday–afternoon cooling; E–W yields higher marginal returns; and under the present controls SVF acts more as a partition of the Space effect than as an incremental predictor.
4.6. Limitations and External Validity
Several limitations bound the external validity of the findings. This study is based on two street segments within highly shaded historic canyons and a single full-day sequence, which bounds generalizability: in highly open or very tall–wide canyons, slopes and magnitudes may differ and warrant re-measurement. Only one clear late-summer day was sampled, so seasonal, synoptic, and inter-annual variability—cloud cover, wind regimes, and humidity patterns—remain outside the empirical scope. Consequently, the present dataset does not meet climatological sample-size requirements and cannot by itself rule out day-specific anomalies; the results should be interpreted as exploratory case-study evidence rather than long-term statistical frequencies. Because UTCI is strongly modulated by wind and humidity, our synchronized observations and robust errors cannot exhaust all interactions; SVF is a static geometric quantity that cannot directly encode dynamic shading duration. Material spectral properties, traffic and pedestrian sensible heat, eave height, and column rhythm may also co-operate. A primary limitation of this study is the use of non-standard portable meteorological instrumentation. The AZ 87783 device employs a 40 mm black globe and a psychrometric wet-bulb sensor (derived from Ta and RH), differing from the standard 150 mm globe and natural wet-bulb sensor specified in ISO 7243 [25]. Recent controlled experiments by d’Ambrosio Alfano et al. [32] demonstrated that small globes (e.g., 38–50 mm) systematically underestimate the Mean Radiant Temperature (Tr) under high radiative loads. Furthermore, Cooper et al. [31] found that portable WBGT devices relying on psychrometric algorithms tend to significantly underestimate the WBGT index, particularly in low-wind conditions. Consequently, the absolute WBGT and MRT values reported here likely represent a conservative underestimate of the true heat stress. The results should therefore be interpreted as qualitative evidence of the relative cooling benefits of arcades compared to open streets, rather than as precise occupational safety data. Future studies should employ ISO-compliant metrological setups (Class S) [30] to validate these absolute risk reductions. WBGT-based threshold analyses in this study should therefore be interpreted as exploratory, comparative indicators of space-specific exposure, not as formal occupational-safety certification. Extensions should follow a context–parameter–performance trajectory: replicate across street types, latitudes, and climates; examine Orientation × H/W × continuity effects on DCRI and threshold exceedance; complement static SVF with ray-tracing/flux decomposition to obtain causal evidence linking shading duration to MRT response; and parameterize target SVF ranges, minimum arcade depth, continuity, eave height, and openness into guideline indicators coupled with ventilation corridors and canopy planting—forming a transferable geometry–radiation–aerodynamics design set. For governance, the present case-study should be viewed as indicating promising mechanisms and design levers in hot–humid heritage districts, to be tested and calibrated through broader comparative campaigns rather than applied wholesale as a universal rule.
5. Conclusions
Using paired Arcade–Open points on two typical arcaded streets in Haikou, and situating the analysis in highly shaded historic canyons, we quantified the mitigation performance of arcades along a total effect–modulation–mechanism–threshold logic over a full day of hourly observations. Within this empirical frame, arcades provide a stable and sizable cooling baseline at the daily scale, with the strongest gains at midday–afternoon (see Section 3.1). A practical anchor is the daily mean difference ΔUTCI ≈ −4.4 °C. Orientation is an important modulator: E–W segments yield higher marginal returns, while under arcades the E–W vs. N–S gap is markedly compressed (see Section 3.2).
Mechanistically, geometric openness (SVF) relates positively to MRT and UTCI in bivariate diagnostics, consistent with the sky-view → radiative load → equivalent-temperature heat stress pathway. After controlling for Space and Orientation, SVF adds little incremental fit in this sample, yet its inclusion attenuates the Space coefficient, indicating partial mechanism attribution of the Arcade–Open difference to geometric shielding (see Section 3.3; Table 2). This pattern suggests that in dense historic canyons, simple spatial categories (Arcade/Open, E–W/N–S) already encode much of the effective sky view and shading duration, while radiative gains must be coordinated with ventilation and moisture conditions to translate into comfort gains. Governance-oriented indicators further underscore real-world value: DCRI is positive across all pairs, and arcades markedly reduce the occurrence of high-risk windows at extreme thresholds (e.g., WBGT ≥ 32 °C; see Section 3.4 and Section 3.5).
Conceptually, the study links heritage form to adaptation performance through operational geometric parameters, proposes a share-identification framework (Model A vs. Model B) to apportion effects explainable by geometry, and extends “average improvement” to “compression of extreme exposure” using DCRI and threshold exceedance. Relative to prior work that relies mainly on simulations or single-segment cases, our multi-site, full-day measurements in highly shaded canyons offer case-study evidence that validate the Arcade–Open contrast and establish orientation as an interaction tied to sun-path matching and marginal returns (see Section 3.1, Section 3.2 and Section 3.3).
For practice, findings translate directly into guidance. (i) On E–W heritage streets, prioritize arcade continuity and effective depth, maintaining eave-line shading continuity; on N–S streets, increase effective depth, stabilize column rhythm, add tree-canopy shade, and optimize façade openness to lengthen shading in key hours. (ii) Use SVF as a morphology–performance bridge to set target ranges and constraints, while locally calibrating its conversion to UTCI/MRT by street type and season. (iii) During heat alerts, use DCRI and exceedance shares to optimize “cooling corridors” and arcade-priority walking networks, augmented by reversible shading and hydration services, managing exposure in units of risk duration. These recommendations are most directly applicable to hot–humid cities with comparable street morphologies and heritage arcades, where adaptation goals can be aligned with conservation by treating arcades as climate-responsive public infrastructure.
Limitations reflect context: results derive from two segments within highly shaded historic canyons and a single full-day sequence; UTCI is strongly modulated by wind and humidity; material spectra, sensible heat from traffic and crowds, and fine-grain geometry (eave height, bay rhythm, openness) may co-act. Hence the SVF → comfort conversion should be read as context dependent (street type–season–weather). Future work will follow a context–parameter–performance arc: replicate across street types, latitudes, and climates; complement static SVF with ray tracing/flux decomposition and shading-duration metrics; and parameterize target SVF ranges, minimum arcade depth, continuity, eave height, and openness into guideline indicators coupled with ventilation corridors and canopy design to test transferability.
Critically, due to the systematic underestimation errors associated with the non-standard portable instruments used (small globe size and lack of natural wet-bulb sensor), the reported absolute values of WBGT and MRT should be treated with caution. The study primarily validates the relative thermal mitigation potential of arcades compared to open streets qualitatively, and future research must employ ISO-compliant metrological setups to quantify absolute risk reductions.
Overall, the study provides a mechanistic chain and design-oriented indicators for how arcaded heritage streets can contribute to heat-risk management in hot–humid settings, while deliberately stopping short of offering a one-size-fits-all prescription.
Supplementary Materials
The following supporting information can be downloaded at: https://www.mdpi.com/article/10.3390/buildings16010201/s1, Table S1: Metrological specifications of the field instruments compared with ISO 7726:2025 Class S requirements.
Author Contributions
Conceptualization, Y.W. and J.X.; methodology, Y.W.; software, S.L.; validation, J.X., T.L. and S.L.; formal analysis, T.L.; investigation, Y.W., X.H. and H.X.; resources, X.H. and H.X.; data curation, Y.W.; visualization, Y.W., S.L. and Z.W.; writing—original draft preparation, Y.W.; writing—review and editing, J.X., T.L., S.L., H.X. and Z.W.; supervision, J.X. and T.L.; project administration, J.X.; funding acquisition, J.X. All authors have read and agreed to the published version of the manuscript.
Funding
This research was funded by the Hainan Provincial Natural Science Foundation of China, grant number 725RC790 (“Research on Historical Urban Landscape Space Perception and Recreational Experience in Haikou Based on Digital Technology”).
Data Availability Statement
The data that support the findings of this study are available from the authors on reasonable request.
Conflicts of Interest
The authors declare no conflicts of interest.
Abbreviations
The following abbreviations are used in this manuscript:
| ANOVA | analysis of variance. |
| Arcade/Open | paired measurement zones under the arcade and at open street center, respectively. |
| CI | confidence interval (95% unless otherwise stated). |
| DCRI | Daytime–Nighttime Climate Resilience Index (degree-hours, normalized by 12 h; units: °C·h/12 h). UTCI-based day–night cooling index (day–night cooling robustness index) |
| E–W/N–S | east–west/north–south street orientation. |
| MRT | mean radiant temperature (°C). |
| RH | relative humidity (%). |
| SEM | standard error of the mean. |
| SVF | sky view factor (dimensionless). |
| Ta | air temperature (°C). |
| Tg | black-globe temperature (°C). |
| UTCI | Universal Thermal Climate Index (°C). |
| WBGT | wet-bulb globe temperature (°C). |
| Va | wind speed (m·s−1). |
References
- Atawneh, R.; Alqadi, S. Climate change adaptation in cities: Enhancement of pedestrian thermal comfort using afforestation and greening buildings. Urban Clim. 2025, 61, 102421. [Google Scholar] [CrossRef]
- Huang, X.; Song, J.; Wang, C.; Chan, P.W. Realistic representation of city street-level human thermal stress via a new urban climate–human coupling system. Renew. Sustain. Energy Rev. 2022, 169, 112919. [Google Scholar] [CrossRef]
- Tipaldo, J.F.; Balk, D.; Hunter, L.M. A framework for ageing and health vulnerabilities in a changing climate. Nat. Clim. Change 2024, 14, 1125–1135. [Google Scholar] [CrossRef]
- Azargoshasbi, F.; Minet, L. Modeling climate change impacts on urban population exposure to heat stress dynamics in Vancouver and Victoria, Canada. Sustain. Cities Soc. 2025, 135, 106992. [Google Scholar] [CrossRef]
- Jiang, T.; Krayenhoff, E.S.; Voogt, J.A.; Warland, J.; Demuzere, M.; Moede, C. Dynamically downscaled projection of urban outdoor thermal stress and indoor space cooling during future extreme heat. Urban Clim. 2023, 51, 101648. [Google Scholar] [CrossRef]
- Vahmani, P.; Jones, A.D.; Patricola, C.M. Interacting implications of climate change, population dynamics, and urban heat mitigation for future exposure to heat extremes. Environ. Res. Lett. 2019, 14, 084051. [Google Scholar] [CrossRef]
- Wu, H.; Jin, R.; Liu, M.; Nie, Z.; Zhao, H.; Yao, L.; Zhao, L. Investigating the potential of street trees in mitigating pedestrian thermal stress during heatwaves conditions: An empirical study in Guangzhou. Build. Environ. 2024, 265, 111955. [Google Scholar] [CrossRef]
- Pearlmutter, D.; Berliner, P.; Shaviv, E. Integrated modeling of pedestrian energy exchange and thermal comfort in urban street canyons. Build. Environ. 2007, 42, 2396–2409. [Google Scholar] [CrossRef]
- Zhao, H.; Xu, G.; Shi, Y.; Li, J.; Zhang, Y. The characteristics of dynamic and non-uniform thermal radiation experienced by pedestrians in a street canyon. Build. Environ. 2022, 222, 109361. [Google Scholar] [CrossRef]
- He, M.; Liu, H.; Fang, Z.; He, B.; Li, B. High-temperature and thermal radiation affecting human thermal comfort and physiological responses: An experimental study. J. Build. Eng. 2024, 86, 108815. [Google Scholar] [CrossRef]
- Jamei, E.; Rajagopalan, P.; Seyedmahmoudian, M.; Jamei, Y. Review on the impact of urban geometry and pedestrian level greening on outdoor thermal comfort. Renew. Sustain. Energy Rev. 2016, 54, 1002–1017. [Google Scholar] [CrossRef]
- Castel’Branco, R.; Ricardo da Costa, A. From maximum urban porosity to city’s disaggregation: Evidence from the Portuguese case. Cities 2024, 148, 104836. [Google Scholar] [CrossRef]
- González Couret, D.; Collado Baldoquin, N.; de la Paz Pérez, G.A.; Rueda Guzmán, L.A. Urban variables for adaptation to global warming in a hot–humid climate: Cuban cities as a case study. Urban Clim. 2023, 51, 101633. [Google Scholar] [CrossRef]
- Sharma, A.K. Energy efficiency and thermal comfort in heritage buildings. In Encyclopedia of Renewable and Sustainable Materials; Elsevier: Amsterdam, The Netherlands, 2020; pp. 58–62. [Google Scholar]
- Chang, B.; Hasanah, A.; Caesarina, H.M. Cultural ecology of heritage building adaptation in tropical cities. IOP Conf. Ser. Earth Environ. Sci. 2021, 780, 012058. [Google Scholar] [CrossRef]
- Abd Elraouf, R.; Elmokadem, A.; Megahed, N.; Abo Eleinen, O.; Eltarabily, S. The impact of urban geometry on outdoor thermal comfort in a hot–humid climate. Build. Environ. 2022, 225, 109632. [Google Scholar] [CrossRef]
- Chatzidimitriou, A.; Yannas, S. Street canyon design and improvement potential for urban open spaces: The influence of canyon aspect ratio and orientation on microclimate and outdoor comfort. Sustain. Cities Soc. 2017, 33, 85–101. [Google Scholar] [CrossRef]
- Deng, J.-Y.; Wong, N.H. Impact of urban canyon geometries on outdoor thermal comfort in central business districts. Sustain. Cities Soc. 2020, 53, 101966. [Google Scholar] [CrossRef]
- Lai, B.; Fu, J.-M.; Guo, C.-K.; Zhang, D.-Y.; Wu, Z.-G. Street geometry factors influencing outdoor pedestrian thermal comfort in a historic district. Buildings 2025, 15, 613. [Google Scholar] [CrossRef]
- Oke, T.R.; Mills, G.; Christen, A.; Voogt, J.A. Urban Climates; Cambridge University Press: Cambridge, UK, 2017. [Google Scholar]
- Ali-Toudert, F.; Mayer, H. Numerical study on the effects of aspect ratio and orientation of an urban street canyon on outdoor thermal comfort in hot and dry climate. Build. Environ. 2006, 41, 94–108. [Google Scholar] [CrossRef]
- Li, G.; Ren, Z.; Zhan, C. Sky view factor-based correlation of landscape morphology and the thermal environment of street canyons: A case study of Harbin, China. Build. Environ. 2020, 169, 106587. [Google Scholar] [CrossRef]
- Wang, L.; Hou, C.; Zhang, Y.; He, J. Measuring solar radiation and spatio-temporal distribution in different street network direction through solar trajectories and street view images. Int. J. Appl. Earth Obs. Geoinf. 2024, 132, 104058. [Google Scholar] [CrossRef]
- Bröde, P.; Błażejczyk, K.; Fiala, D.; Havenith, G.; Holmér, I.; Jendritzky, G.; Kuklane, K.; Kampmann, B. The Universal Thermal Climate Index UTCI compared to ergonomics standards for assessing the thermal environment. Ind. Health 2013, 51, 16–24. [Google Scholar]
- ISO 7243:2017; Ergonomics of the Thermal Environment—Assessment of heat stress using the Wet Bulb Globe Temperature (WBGT) Index. International Organization for Standardization: Geneva, Switzerland, 2017.
- d’Ambrosio Alfano, F.R.; Malchaire, J.; Palella, B.I.; Riccio, G. WBGT Index Revisited after 60 Years of Use. Ann. Occup. Hyg. 2014, 58, 955–970. [Google Scholar] [CrossRef]
- Guo, F.; Luo, M.; Zhang, C.; Cai, J.; Zhang, X.; Zhang, H.; Zhang, H.; Dong, J. The mechanism of street spatial form on thermal comfort from urban morphology and human-centered perspectives: A study based on multi-source data. Buildings 2024, 14, 3253. [Google Scholar] [CrossRef]
- Nasrollahi, N.; Namazi, Y.; Taleghani, M. The effect of urban shading and canyon geometry on outdoor thermal comfort in hot climates: A case study of Ahvaz, Iran. Sustain. Cities Soc. 2021, 65, 102638. [Google Scholar] [CrossRef]
- Coutts, A.M.; White, E.C.; Tapper, N.J.; Beringer, J.; Livesley, S.J. Temperature and human thermal comfort effects of street trees across three contrasting street canyon environments. Theor. Appl. Climatol. 2015, 124, 55–68. [Google Scholar] [CrossRef]
- ISO 7726:2025; Ergonomics of the Thermal Environment—Instruments for Measuring Physical Quantities. International Organization for Standardization: Geneva, Switzerland, 2025.
- Cooper, E.; Grundstein, A.; Rosen, A.; Miles, J.; Ko, J.; Curry, P. An Evaluation of Portable Wet Bulb Globe Temperature Monitor Accuracy. J. Athl. Train. 2017, 52, 1161–1167. [Google Scholar] [CrossRef]
- d’Ambrosio Alfano, F.R.; Dell’Isola, M.; Ficco, G.; Palella, B.I.; Riccio, G. Small Globes and Pocket Heat Stress Meters for WBGT and PHS Evaluations. A Critical Analysis under Controlled Conditions. Build. Environ. 2022, 226, 109781. [Google Scholar] [CrossRef]
- UNESCO. Recommendation on the Historic Urban Landscape (36 C/Resolution 41); UNESCO: Paris, France, 2011. [Google Scholar]
- Smith, M.E.; Ortman, S.G.; Lobo, J. Heritage sites, climate change, and urban science. Urban Clim. 2023, 47, 101371. [Google Scholar] [CrossRef]
- Narimani, N.; Karimi, A.; Brown, R.D. Effects of street orientation and tree species thermal comfort within urban canyons in a hot, dry climate. Ecol. Inform. 2022, 69, 101671. [Google Scholar] [CrossRef]
- Schreier, S.F.; Suomi, I.; Bröde, P.; Formayer, H.; Rieder, H.E.; Nadeem, I.; Jendritzky, G.; Batchvarova, E.; Weihs, P. The uncertainty of UTCI due to uncertainties in the determination of radiation fluxes derived from numerical weather prediction and regional climate model simulations. Int. J. Biometeorol. 2013, 57, 207–223. [Google Scholar] [CrossRef] [PubMed]
- Xing, D. Numerical investigation into the influence of occlusions on the radiant temperature fields of globe thermometers in asymmetric radiant indoor environments. Appl. Therm. Eng. 2025, 274, 126594. [Google Scholar] [CrossRef]
- Deevi, B.; Chundeli, F.A. Quantitative outdoor thermal comfort assessment of street: A case in a warm and humid climate of India. Urban Clim. 2020, 34, 100718. [Google Scholar] [CrossRef]
- Mokhtar, S.; Reinhart, C. Towards scalable and actionable pedestrian outdoor thermal comfort estimation: A progressive modelling approach. Build. Environ. 2023, 242, 110547. [Google Scholar] [CrossRef]
- Solanki, P.; Amirtham, L.R.; Deb, C. Optimizing sky view factor and vegetation to mitigate urban heat in hot-humid climates. Discov. Cities 2025, 2, 79. [Google Scholar] [CrossRef]
- Rodríguez Algeciras, J.A.; Gómez Consuegra, L.; Matzarakis, A. Spatial–temporal study on the effects of urban street configurations on human thermal comfort in the World Heritage City of Camagüey–Cuba. Build. Environ. 2016, 101, 85–101. [Google Scholar] [CrossRef]
- Wang, Y.; Jin, C.; Xu, D.; Wang, T.; Wang, B. Analysis of multi-dimensional layers in historic districts based on theory of the historic urban landscape: Taking Shenyang Fangcheng as an example. Land 2024, 13, 1736. [Google Scholar] [CrossRef]
Disclaimer/Publisher’s Note: The statements, opinions and data contained in all publications are solely those of the individual author(s) and contributor(s) and not of MDPI and/or the editor(s). MDPI and/or the editor(s) disclaim responsibility for any injury to people or property resulting from any ideas, methods, instructions or products referred to in the content. |
© 2026 by the authors. Licensee MDPI, Basel, Switzerland. This article is an open access article distributed under the terms and conditions of the Creative Commons Attribution (CC BY) license.