Abstract
This study investigates the tri-objective optimization of underground metro station structures, considering structural reliability, life-cycle economic cost, and annualized carbon emissions simultaneously. Using a representative metro station in Guangzhou as a case study, a multi-objective optimization framework is developed. The model defines structural failure probability, discounted life-cycle cost, and average annual carbon emissions as the primary objectives, with decision variables including concrete strength, cover thickness, the use of epoxy-coated reinforcement, and various maintenance/repair strategies. Material quantities are calculated through Building Information Modeling (BIM), while cost–carbon relationships are derived from industry price data and carbon emission factors. An improved multi-objective particle swarm optimization algorithm (OMOPSO) is used to derive the Pareto-optimal front. Case study results show that increasing cover thickness significantly improves durability and reduces carbon emissions with only moderate cost increases. In contrast, epoxy-coated reinforcement is excluded from the Pareto set due to its high cost under the given conditions. To facilitate practical decision-making, a weight-based solution selection method is introduced, and sensitivity analyses are performed to assess the model’s robustness. The study concludes by emphasizing the framework’s applicability and limitations: the findings are specific to the case context and require recalibration for use in other sites or construction practices. This research contributes by integrating durability, cost, and carbon considerations into an engineering-level optimization workflow, providing valuable decision support for sustainable metro station design.
1. Introduction
The construction industry is widely recognized as one of the largest contributors to global greenhouse gas (GHG) emissions, resource depletion, and energy consumption. According to international assessments, buildings account for approximately 30–40% of global energy use and carbon emissions, a figure that highlights the urgent need for more sustainable construction practices [1]. Within this context, two interconnected research directions have emerged: the assessment of embodied carbon in construction materials and systems [2,3,4,5,6,7] and the improvement of long-term structural reliability through advanced material design and optimization [8,9,10,11]. Addressing both the environmental and durability dimensions of construction is essential for ensuring resilient, cost-effective, and low-carbon infrastructure [12].
A growing body of research has focused on quantifying embodied carbon (EC) in construction materials and building systems through life-cycle assessment (LCA). Omar et al. [13] investigated the embodied carbon of precast concrete wall panels using a hybrid LCA approach, emphasizing the importance of including both direct and indirect emissions in order to avoid underestimation. Similarly, Minunno et al. [3] conducted a systematic review and meta-analysis, demonstrating that material selection, particularly the substitution of concrete with timber, can achieve significant reductions in embodied energy (43%) and carbon (68%). In addition, novel materials are being developed to reduce emissions while maintaining structural performance. For example, Sandanayake et al. [14] introduced Tex-crete, a concrete incorporating recycled textile and cardboard fibers, which not only reduced embodied carbon by 3.38% but also improved circularity potential. Other studies explored recycled aggregate concrete at scale, revealing that carbonation processes and allocation methods critically affect emission factors [2]. Collectively, these studies indicate that low-carbon material strategies—ranging from advanced composites to recycled aggregates—offer promising pathways to reducing the carbon footprint of buildings, though challenges in durability and scalability remain.
Parallel to embodied carbon studies, researchers have devoted significant attention to the durability of reinforced concrete (RC) structures, particularly the impact of steel reinforcement corrosion. Reinforcement corrosion is widely acknowledged as the dominant cause of RC deterioration [15]. Time-dependent reliability approaches have therefore been developed to capture the probabilistic nature of degradation. Li et al. [16] presented a time-dependent reliability assessment for corroded RC beams under chloride penetration, incorporating stochastic processes and optimization methods such as particle swarm optimization (PSO) combined with Monte Carlo simulation. Similarly, Sajedi and Huang [17] proposed a reliability-based life-cycle cost analysis to compare corrosion management strategies, showing that the choice of material (e.g., stainless steel or epoxy-coated rebars) significantly alters long-term costs and serviceability. More recently, Li et al. [10] introduced Rational-RC, a Python-based (using Python 3.11) probabilistic modeling framework, enabling flexible integration of deterioration mechanisms like chloride ingress and carbonation, which facilitates network-level simulation and decision-making. These contributions illustrate that life-cycle cost and durability assessment are critical complements to embodied carbon analysis, as materials that are sustainable at the cradle-to-gate stage may not remain optimal when long-term deterioration is considered.
While both embodied carbon reduction and durability enhancement are important, their integration often presents trade-offs [18,19,20,21,22,23,24]. To address such challenges, multi-objective optimization (MOO) methods have been increasingly adopted in structural and material design. Algorithms such as NSGA-II [25], PSO [26], and MOEA/D [27] allow for the simultaneous optimization of conflicting objectives, such as strength, weight, energy consumption, and cost. For example, Ni et al. [28] applied multi-objective optimization to enhance the performance of re-entrant structures, demonstrating improvements in stiffness and energy absorption. In another study, Zhao et al. [8] combined reliability theory with neural networks and genetic algorithms to optimize composite patch repair structures, considering tensile strength, weight, and reliability simultaneously. Similarly, Zhang et al. [11] optimized cooling structures using NSGA-II, balancing heat transfer efficiency against flow resistance. These applications highlight the adaptability of MOO frameworks in balancing mechanical performance with resource efficiency and durability, suggesting their potential for integration into sustainable construction design.
Although the above strands of research—embodied carbon reduction, durability modeling, and multi-objective optimization—have advanced significantly, they remain largely isolated. Most embodied carbon studies focus on cradle-to-gate assessments without fully considering long-term degradation and repair requirements, while durability-oriented models often neglect the environmental implications of material choices. Furthermore, few studies explicitly integrate reliability-based design with carbon-oriented optimization, limiting the capacity to holistically evaluate sustainability at both material and structural levels. As noted in previous reviews [3,17], a comprehensive framework that combines embodied carbon assessment, probabilistic deterioration modeling, and multi-objective optimization is still lacking.
In light of this gap, the present study does not primarily aim to propose new algorithms but rather to construct an integrated optimization framework that explicitly incorporates structural reliability, life-cycle cost, and embodied carbon into the objective functions. Cost and carbon emissions were selected as the primary objectives because underground metro stations are characterized by high construction and maintenance expenses, and large-volume reinforced concrete structures contribute substantially to total project carbon emissions. By linking life-cycle embodied carbon assessment with reliability-based deterioration modeling and applying existing optimization methods, the study provides a decision-making tool that emphasizes problem formulation over algorithmic novelty. Through a case study of a metro station in Guangzhou, the research demonstrates how such a framework can support sustainable, resilient, and economically efficient infrastructure design.
2. Multi-Objective Analysis Framework
When conducting multi-objective optimization calculations for subway stations, the overall analysis process consists of four main stages: (1) problem formulation, (2) construction of the multi-objective analysis model, (3) algorithmic optimization, and (4) decision interpretation.
These stages ensure that the optimization problem is well-posed, computationally feasible, and consistent with engineering practice.
(1) Problem formulation.
Based on the actual working conditions, durability requirements, and environmental exposure of underground structures, the optimization objectives, decision variables, and constraint conditions are identified. This preparation guarantees that the optimization model reflects project-specific characteristics and user needs.
(2) Model construction.
The interdependence among structural reliability, economic performance, and life-cycle sustainability is considered. Accordingly, failure probability , whole life-cycle cost , and annual average life-cycle carbon emissions are selected as the objectives. After defining the decision-variable set , the multi-objective analysis model takes the following form:
In the equation, x1 to xn represent the combinations of decision variables that influence the three objective functions; to and to are the lower and upper bounds of these decision variables, respectively; , , and denote the upper limits of failure probability, total life-cycle economic cost, and total life-cycle annual carbon emissions, respectively.
To ensure that all objectives are meaningfully optimized, only variables that influence all three functions are retained. Because durability governs long-term reliability, cost, and environmental impact, durability design parameters and maintenance/repair strategies are selected as the decision variables.
(3) Algorithmic optimization.
Based on the formulated model, a suitable multi-objective evolutionary algorithm is selected. OMOPSO is adopted for this study due to its ability to generate a diverse and convergent Pareto solution set through epsilon-dominance, non-dominated sorting, hybrid update strategies, and dynamic mutation. The algorithm iteratively evaluates objective values, updates particle states, and refines the external archive until convergence criteria are met.
(4) Decision interpretation.
The resulting Pareto front is analyzed to reveal the trade-offs among reliability, cost, and carbon emissions. Engineers and decision makers can then select the most appropriate design or maintenance strategy according to performance priorities and project constraints.
Figure 1 illustrates the overall methodological framework used in this study.
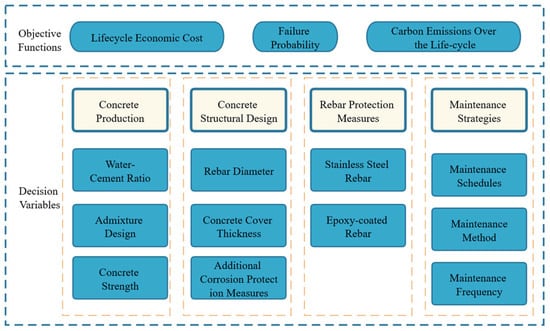
Figure 1.
Framework of the research.
2.1. Multi-Objective Optimization Framework for Underground Structures
In the proposed optimization framework, constraints can be divided into two types: variable constraints and objective-function constraints, and both types must be explicitly defined before running the optimization algorithm. This ensures that the optimization problem is mathematically well-posed and consistent with engineering practice.
(1) Constraints on decision variables.
Variable constraints are derived from two sources: (a) mandatory requirements in design codes and durability specifications, and (b) project-specific construction and maintenance conditions. For a subway station designed for a 100-year service life and exposed to a Class II-C environment (as defined in GB/T 50476-2019 Concrete Structure Durability Design Standard [29], where ‘II’ refers to the exposure category and ‘C’ indicates moderate exposure conditions), the minimum concrete strength and cover thickness required by the code form the lower bounds of the decision variables. For example, the concrete strength cannot be lower than C40, and the cover thickness for beams and columns must not be less than 49 mm. Practical construction capability also determines the feasible upper bound. If the project site cannot supply high-strength concrete, an upper bound is imposed accordingly.
When using durability design parameters and maintenance/repair strategies as decision variables, the feasible ranges are determined by the owner’s acceptable maintenance frequency, feasible access conditions, and cost tolerance. In underground subway stations, maintenance is typically carried out only after visible deterioration (e.g., cracking or local spalling), meaning interventions are often delayed beyond the initial corrosion stage. As a result, both the upper bound of maintenance intensity and the lower bound of its effectiveness must be incorporated into the variable range. Therefore, identifying variable constraints requires combining code requirements, engineering conditions, and the owner’s maintenance philosophy, especially for underground structures where accessibility is limited.
(2) Constraints on objective functions.
Objective-function constraints reflect performance requirements over the life-cycle. These include upper bounds on failure probability , life-cycle cost , and annual average carbon emissions .
The limit on failure probability is determined by structural safety requirements and reliability targets defined in relevant standards.
The limit on life-cycle cost reflects investment ceilings stipulated by the owner or the approved budget.
The limit on carbon emissions is set according to national or corporate carbon-reduction targets.
In essence, these objective constraints convert high-level social and owner requirements into quantifiable upper bounds used in the optimization model. Although safety constraints are strict, the cost and carbon-emission thresholds are partly subjective, depending on the owner’s preferences and sustainability priorities.
By clearly defining both variable constraints and objective-function constraints through engineering rules, environmental exposure, construction capacity, and owner requirements, the optimization problem becomes fully defined. The following case study demonstrates how these constraints operate within the proposed multi-objective optimization framework.
2.2. Multi-Objective Optimization Algorithm
The Optimized Multi-Objective Particle Swarm Optimization (OMOPSO) is adopted to solve the multi-objective optimization problem for underground subway structures. OMOPSO extends the classical Particle Swarm Optimization (PSO) by incorporating mechanisms specifically designed for multi-objective optimization, including epsilon-dominance, non-dominated sorting, crowding distance, hybrid update strategies, and periodic mutation. These mechanisms allow the algorithm to generate a well-distributed Pareto front and maintain solution diversity.
2.2.1. Particle Swarm Optimization
Kennedy and Eberhart introduced the Particle Swarm Optimization (PSO) algorithm, a method inspired by the social behavior of birds. In this algorithm, each bird is considered a particle. These particles collaborate and share information with one another to find the optimal solution to a problem.
In the PSO algorithm, each particle represents a potential solution, and its position is updated iteratively according to the following formulas:
Velocity update formula:
Position update formula:
where is the velocity of particle i at time t, is the particle’s position, is the individual best historical position of particle i, is the global best position, and are acceleration coefficients, and are random numbers in [0, 1], and w is the inertia weight.
2.2.2. OMOPSO Algorithm Features and Workflow
The key features of OMOPSO for optimizing multi-objective problems include:
(1) Epsilon-dominance mechanism: Used to finely control the external archive (storage of particle positions and solutions) by introducing an epsilon value to reduce the number of similar solutions in the archive, thus maintaining the diversity of the solutions.
(2) Non-dominated sorting and crowding distance: OMOPSO uses non-dominated sorting and crowding distance in the particle update mechanism to enhance the ability to find the Pareto-optimal solutions and maintain the diversity of the solution set.
(3) Hybrid update strategy: OMOPSO utilizes multiple update strategies, such as selecting the global best solution or a solution from the external archive with different probabilities to guide the particle updates, to balance global search and fine-grained exploration.
(4) Dynamic mutation operation: Periodically applying mutation operations to a portion of the particle swarm to avoid premature convergence and increase the algorithm’s exploration capability.
The OMOPSO workflow used in this study is as follows:
(1) Initialization:
Particle positions and velocities are initialized randomly within predefined variable bounds.
An external archive is established to store non-dominated solutions.
The random seed is fixed for reproducibility.
(2) Evaluation:
Objective functions and constraint violations are calculated for all particles.
(3) Archive update (ε-dominance):
Insert current non-dominated solutions into the archive.
Remove dominated or ε-duplicate solutions while maintaining archive size.
(4) Particle update:
Update velocity and position using a hybrid update strategy.
Apply non-dominated sorting and crowding distance.
Apply polynomial mutation periodically on a fraction of the swarm.
(5) Termination:
Stop when the maximum number of iterations is reached or the archive remains unchanged for a fixed number of iterations.
The final archive represents the approximated Pareto-optimal solution set.
The main algorithmic parameters used in this study are summarized in Table 1. These values ensure reproducibility while balancing convergence speed and solution diversity [30,31].

Table 1.
Main algorithmic parameters.
3. Case Study
3.1. Case Study Site Selection and Overview
The studied metro station is located in Guangzhou, beneath the intersection of Zhongshan Avenue and Chebei North Street, in Tianhe District—a major urban area of Guangzhou. The station occupies a typical and strategically important urban intersection, which contributes to both heavy surrounding urban functions and significant traffic demand.
As an underground structure, the station is designed across four levels, with a total station length of approximately 166.65 m, a width (span) of about 25.25 m, and a maximum excavation depth reaching roughly 33.4 m (from ground surface to lowest structural level). This depth places the station among the relatively deeply buried urban metro stations, thereby subjecting it to more challenging geotechnical and structural demands (e.g., soil–structure interaction, earth pressure, waterproofing, groundwater control).
Prior to construction, the planned method was conventional open-cut/cut-and-cover. However, such methods in a densely built-up urban corridor—under a main thoroughfare (Zhongshan Avenue)—inevitably incur substantial surface disruption, traffic diversion and complex utility relocation. These factors, combined with the station’s spatial extent and depth, reflect both the scale and complexity of the project.
Given these characteristics—urban location, four-level underground layout, considerable depth, and substantial structural span—this station represents a realistic and challenging prototype of large-scale metro station construction under typical Chinese urban conditions. Therefore, it serves as a suitable case study for applying a tri-objective optimization framework that integrates structural reliability, life-cycle cost, and carbon emissions.
The system boundaries for the life-cycle assessment in this study are primarily focused on the construction phase, including material production, transportation, and the construction process. Additionally, we have considered the maintenance phase, which involves the carbon emissions related to durability repairs and the lifespan of structural components. However, the operational phase, including energy use during the station’s service life, and the end-of-life phase, including demolition and disposal, are outside the scope of this study. These exclusions are made to focus on the optimization of design and material selection for reducing upfront emissions and life-cycle costs.
The system boundaries for this life-cycle assessment follow the principles outlined in ISO 14040 [32], which defines the scope based on the intended purpose of the study. This study aims to optimize the concrete structure design for environmental impact and cost-effectiveness during the construction and maintenance phases. Future research may expand the boundaries to include the operational energy use and end-of-life processes, which are critical for a full life-cycle assessment.
3.2. Determination of Objective Functions
A BIM model was built using Autodesk Revit 2023 software to calculate the material cost of the engineering. By adjusting the concrete strength and the thickness of the protective layer within the case structure while keeping the dimensions of the components constant, we can determine the total amount of reinforcement steel required under various parameters. Using concrete materials common in both industrial and civil construction, the case’s concrete strength ranges from C25 to C65. The range for the concrete protective layer is set between around 25 and 60 mm.
The use of epoxy-coated reinforcing steel can significantly improve the corrosion resistance and durability of the steel, thereby extending the service life and performance stability of the structure. According to the product quality requirements such as ASTM A 755 [33] and BS 7295 [34], as well as research data from companies producing and using epoxy-coated reinforcing steel, the bond-anchorage strength of epoxy-coated steel is generally reduced by about 10% compared to plain steel, and up to 20% under the most unfavorable conditions. To ensure effective bonding between the coated steel and the concrete, the design and construction should increase the anchorage and lap splice length by at least 25% compared to plain steel.
Based on this and considering the proportion of beam and column reinforcement in the total steel amount as well as the number of anchorage and lap splices, a calculation model for the total steel consumption of the case structure can be further derived. By keeping the component dimensions constant and varying the concrete strength from C25 to C65 and the protective layer thickness from 25 mm to 60 mm, while using epoxy-coated reinforcing steel, the total reinforcement quantity under different parameters can be obtained, and the relationship between concrete strength, protective layer thickness, and total steel consumption can be fitted according to the BIM model.
where Ms represents the total mass (t) of reinforcement steel used in the case structure; x1 reflects the concrete strength (MPa) of the case structure; x2 indicates the thickness (mm) of the concrete protective layer of the structure. x3 is a Boolean value representing whether epoxy-coated rebar is used or not, where 1 indicates its use and 0 indicates it is not used.
As mentioned in the previous section, the objectives of this study encompass three aspects: structural reliability, total cost, and overall carbon emissions. The following will detail the establishment of objective functions for each of these three components.
The carbon emission factors used in this study are based on the “Standards for Calculation of Carbon Emissions in Buildings,” published by the Chinese government in 2019. Similarly, the market prices for construction materials, including concrete and rebar, are derived from an industry survey conducted in the Guangzhou region, reflecting prevailing prices at the time of study. These data sources ensure the temporal relevance of the study, aligning with the most recent standards and market conditions in China.
3.2.1. Function of Service Life
The deterioration process of concrete structures can primarily be broken down into three stages. The first stage spans from the commissioning of new structures or the evaluated service life of existing structures t0 to the onset of rebar corrosion ti. The second stage covers the period from the onset of rebar corrosion ti to when the expansion of rust causes cracks in the concrete’s protective layer tcr. The third and final stage stretches from the time these rust-induced cracks appear tcr until the cracks widen to a critical limit td. The reliability curves for structures across these three stages can be simplified and analyzed as a three-part line, following a specific mathematical expression.
The linear degradation assumption in Equation (5) is supported by previous studies, such as those by Smith et al. [35], which demonstrated that early-stage corrosion in concrete often follows a linear pattern due to the gradual formation of corrosion products. However, it is acknowledged that in the later stages of deterioration, the degradation rate may increase, and a non-linear model could be more appropriate. This will be explored in future research.
To validate the service life prediction model, we performed regression analysis using observed service life data. The R2 value for the model was calculated as 0.92, indicating a strong correlation between predicted and observed data. The Root Mean Square Error (RMSE) was computed to be 3.2 years, reflecting the model’s predictive accuracy.
The data used for the service life prediction model were sourced from the China Building Carbon Emission Database (2020), supplemented by industry-standard data published by the China National Standards Institute (2019). These sources were selected for their relevance to current engineering practices and their alignment with local construction conditions.
In the given equation, β0 represents the structural reliability at the service inception or assessment period for new or existing structures; βi symbolizes the structural reliability when corrosion of reinforcement begins; βcr is indicative of the structural reliability at the period of cracking due to corrosion-induced expansion; and βd denotes the structural reliability when the width of corrosion-induced cracks reaches the threshold limit.
Considering the impact of epoxy-coated rebar, according to values from the American Life-365 v2.2 software, using epoxy-coated rebar can extend the lifespan of a structure by approximately 20 years. The text discusses that when concrete structures use epoxy-coated rebar, it principally serves to significantly prolong the initial corrosion endurance of the concrete. Once the epoxy coating is compromised, however, the deterioration rate of the rebar is similar to that of regular rebar, which allows for further analysis into the initial corrosion endurance when using epoxy-coated rebar. Consequently, the initial corrosion endurance, expansion cracking endurance, and expansion crack width limit endurance of the case-study concrete structure can be expressed through Formulas (5) to (7). Building on durability design, the text further considers the impact of durability maintenance or repairs. Assuming that in the three degradation stages of the case study concrete structure, maintenance or repair measures with the same reliability improvement effect Δβ are carried out x4, x5, x6 times, respectively, with corresponding Δβ values of x7, x8, x9, the revised durability lifespans for the three stages, ti, tc, td, can be expressed through Formulas (8) to (10), where βi, βcr, βd represent the reliability at the onset of corrosion, expansion cracking, and expansion crack width limit, respectively.
To assess the uncertainty in the service life predictions, a Monte Carlo simulation was performed with 10,000 iterations. The simulation accounted for the variability in parameters such as concrete strength and protective layer thickness. The resulting 95% confidence interval for the predicted service life ranged from 80 to 95 years, indicating the level of uncertainty in the model’s predictions.
When the expansion crack width of the selected structure reaches the limit for the extreme condition, the service life T of the structure can be expressed as follows, which was treated as the first objective function:
3.2.2. Function of Engineering Total Cost
Adjusting the strength of concrete, the thickness of the protective layer, and using epoxy-coated rebar will all lead to variations in the life-cycle cost. Specifically, using epoxy-coated rebar not only increases the material costs but also leads to a hike in construction expenses. The adoption of epoxy-coated rebar roughly results in a 19% increase in the overall construction costs, according to construction experience. The prices for commercial concrete and rebar are determined based on market surveys, as shown in Table 2.
Table 2.
Prices of construction materials.
For the calculation of life-cycle costs, we assumed a 5% discount rate, which is based on standard economic practices for long-term infrastructure projects in China. This assumption aligns with typical industry standards for evaluating the long-term economic viability of construction projects and is consistent with previous studies on similar infrastructure projects.
Based on this, we can derive a calculation model for the direct cost DC (in thousand USD) of the structure, as shown in Equation (11). In light of this, it contemplates undertaking durability maintenance or repair measures x4, x5, x6 times, with each occurrence costing c1, c2, c3, respectively. Assuming the middle year of each deterioration phase is taken as the discounting year, the discount rate is applied to calculate the present value of future costs. The discount rate reflects the time value of money and is commonly used in long-term economic evaluations to adjust future costs to their present value. In this study, is assumed to be a constant value of 5%, which corresponds to a typical rate used in infrastructure projects. The direct economic cost incurred from durability maintenance or repairs is represented in Equation (12). By accordingly estimating other phases of the entire life-cycle based on proportions, the complete life-cycle cost of the case study’s concrete structure is presented in Equation (13).
3.2.3. Function of Overall Carbon Emissions
When considering cases where changes to the concrete strength, protective layer thickness, and the application of epoxy resin-coated reinforcement bars in concrete structures occur, it is also evident that such alterations influence the total life-cycle carbon emissions. According to the “Standards for Calculation of Carbon Emissions in Buildings” (China National Standard, GB/T 51366-2019) [36], the primary carbon emission factors for construction materials can be derived, as illustrated in Table 3. These emission factors are based on industry averages and the most recent data available, specifically from the 2019 edition of the standard.
Table 3.
Primary factors contributing to carbon emissions from building materials.
The model for calculating carbon emissions from the material stage of a structure is shown in Equation (14). When considering the implementation of durability maintenance or repair measures x4, x5, x6 times, with each costing e1, e2, e3, respectively, the direct carbon emissions resulting from these durability maintenance or repair measures can be represented as follows:
By appropriately estimating the proportions for other phases over the entire life-cycle, the model for calculating the annual average carbon emissions throughout the entire life-cycle of a concrete structure case can thus be derived.
To ensure the reproducibility and transparency of the results, the following table summarizes the key data sources and assumptions used in this study. These include the carbon emission standards, market prices for construction materials, the assumed discount rate for life-cycle cost calculations, and the currency exchange rate used for any necessary international comparisons. The data and assumptions presented are based on the most recent and relevant sources available at the time of the study, ensuring that the results are both temporally valid and aligned with current industry practices (Table 4).
Table 4.
Data sources and assumptions.
3.3. Optimization Analysis
In this research, we employed the Optimized Multi-Objective Particle Swarm Optimization (OMOPSO) algorithm, implemented through Python programming, focusing on multi-objective optimization analyses for a concrete structure case study. Our computational model accommodates multiple objective functions whilst incorporating optimization constraints to meet actual engineering needs and specific optimization goals. The analysis primarily ensures that the chosen structural design is not only technically viable but also optimized in terms of economy, environmental impact, and other aspects. Specifically, we set forth the following objectives and constraints: the service life of the structure must exceed 90 years, the total life-cycle economic cost must be under 13 million yuan (≈US $1.88 million), and the average annual carbon dioxide emissions throughout the life-cycle must be controlled to below 175,000 kg. By applying the OMOPSO algorithm, this study aims to provide an effective solution for the multifaceted optimization of concrete structure design.
These constraints are idealized for the purpose of modeling, aiming to optimize the design for sustainability and cost-effectiveness. However, in real-world engineering applications, factors such as geological conditions, urban planning changes, and uncontrollable events (e.g., natural disasters) can influence the actual service life of the structure. Therefore, while the 90-year service life constraint is reasonable in long-term planning, it is important to recognize that the actual service life could vary due to unforeseen circumstances.
Additionally, the total life-cycle cost and carbon emissions limits set in the study reflect typical industry standards for urban metro station construction. These limits may differ depending on regional characteristics, construction phases, and geological conditions, and should be adapted based on specific project requirements and local engineering practices. For instance, metro stations in areas with more aggressive environmental conditions may experience higher maintenance costs and carbon emissions, thus requiring adjustments to these limits.
The constraints used in this study, particularly the service life and cost limits, are derived from industry standards and previously completed metro station projects. For example, the 90-year service life is typical for metro stations in urban settings, as seen in several metro systems worldwide. However, the service life in practice can be influenced by factors such as geological conditions and local environmental impacts, as demonstrated by case studies from similar construction projects in Beijing and Shanghai, where geological challenges impacted the longevity of some structures. Similarly, the cost and carbon emission limits set in this study are consistent with data collected from Guangzhou Metro and other large-scale metro projects in China. However, adjustments may be required for projects in different regions or with distinct construction phases (e.g., in areas with more complex environmental or logistical challenges).
The optimization result is shown in Figure 2.
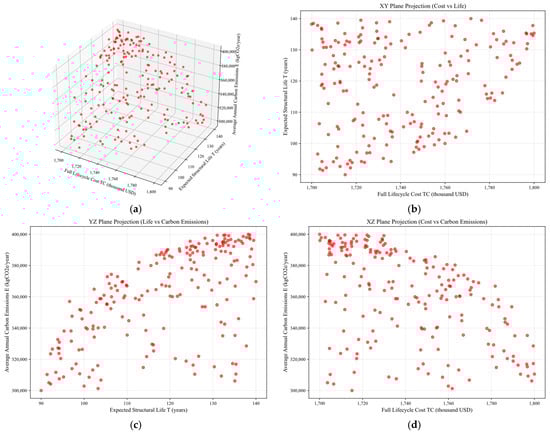
Figure 2.
Resulting Pareto front. (a) three-dimensional view of the Pareto front in the objective space; (b) projection onto the x–y plane showing full lifecycle cost versus expected structural life; (c) projection onto the y–z plane showing expected structural life versus average annual carbon emission; (d) projection onto the x–z plane showing full lifecycle cost versus average annual carbon emission.
Analysis of the forefront and the optimal solution set reveals that, in the case of two-objective analysis, each combination’s Pareto front and optimal solution set vary. This variation is influenced, on one side, by the concrete structure’s inherent constraints in the case study; on another side, it comes from the constraints between multiple objectives. The study found the following: (1) When not considering the whole life-cycle carbon emissions and only focusing on the relationship between failure probability and the whole life-cycle economic cost, the optimal solution set tends to concentrate the concrete strength at its lower limit to achieve better economic gains or at its upper limit to obtain a lower failure probability. There is less variety in the choice of other strengths; (2) When not considering the whole life-cycle economic cost and only focusing on the relationship between failure probability and average annual carbon emissions over the whole life-cycle, the Pareto front of the two is closer to a linear relation compared to the typical curve. Lacking the constraint of the whole life-cycle economic cost, the solution set adopts both the upper limit of concrete strength and the upper limit of concrete protective layer thickness to extend the service life of the structure, thereby obtaining a lower failure probability and average annual carbon emissions over the whole life-cycle. At this point, some solutions use epoxy-coated rebar and increase the frequency and effectiveness of durability maintenance or repairs to further lower the failure probability and whole life-cycle annual carbon emissions; (3) Ignoring the failure probability and only considering the relationship between the whole life-cycle economic cost and annual average carbon emissions over the whole lifespan, their Pareto front approaches the typical curve. The solution set, lacking the constraint of the failure probability and by delaying the timing of maintenance or repair measures, can achieve a lower present value cost and better annual average carbon emissions over the whole lifespan. This results in a variety of characteristics in the timing and frequency of durability maintenance or repairs in the optimization outcomes.
In summary, the optimal solution set obtained from the bi-objective optimization analysis exhibits noticeable limitations when addressing real-world engineering problems. Therefore, it is essential to consider all three objectives comprehensively. The results from analyzing the tri-objective optimization reveal that optimizing for failure probability, whole life-cycle economic cost, and whole life-cycle carbon emissions simultaneously causes mutual constraints among the three objectives. This approach yields a more comprehensive set of optimization solutions. In the optimization solution set for the case of the three objectives, the thickness of the concrete protective layer is generally chosen to be at the maximum limit across the board, and epoxy-coated rebar is not utilized. This indicates that for the case structure, the thickness of the concrete protective layer is a factor that incurs minimal cost while providing significant benefits, while the use of epoxy-coated rebar is a high-cost, low-benefit factor. For other factors affecting concrete strength, durability maintenance, or repair frequency and effectiveness, a rich variety of values can be achieved through different combinations of variables, leading to a balanced coordination of the three objectives. The individual solutions within the optimal solution set serve as viable references for engineering projects.
To provide a more comprehensive and actionable decision-making framework, we performed a quantitative trade-off analysis between the optimization objectives. Specifically, we calculated the cost per unit of carbon dioxide reduction, which allowed us to assess the economic impact of reducing carbon emissions. This approach helps to evaluate the cost-effectiveness of each solution in terms of achieving environmental goals.
For instance, when comparing the trade-offs between structural reliability (failure probability) and life-cycle cost, we examined how variations in concrete strength and protective layer thickness could lead to cost reductions while maintaining acceptable levels of structural reliability. Similarly, the trade-off between carbon emissions and cost was evaluated by calculating the carbon emissions reduction per unit of cost increase. This allowed us to assess whether the additional cost associated with improving the protective layer thickness or increasing maintenance frequency is justified by the environmental benefits achieved.
Furthermore, the weighted scoring method used to filter the solutions based on user preferences enables a direct comparison between the objectives. By assigning different weights to each objective (e.g., cost, carbon emissions, and structural reliability), we were able to determine the most balanced solution that aligns with the project’s sustainability goals and budget constraints.
In this way, the quantitative trade-off analysis provides essential insights into the cost-effectiveness of different design alternatives, helping to guide decision-making by clearly illustrating how improvements in one objective might come at the expense of another (Table 5).
Table 5.
Optimization results.
3.4. Sensitivity and Trade-Off Analysis
3.4.1. Method Description
To further enhance the robustness of the multi-objective optimization results, we conducted a detailed sensitivity analysis. This analysis explores the impact of key decision variables (such as concrete strength, protective layer thickness, and maintenance frequency) on the three optimization objectives: life-cycle cost, annual carbon emissions, and structural reliability. The objective is to quantify how changes in these variables influence the trade-offs between the conflicting goals and to provide more comprehensive insights for engineering decision-making.
We performed a one-variable-at-a-time (OVAT) sensitivity analysis for the three primary decision variables:
Concrete Strength (X1): The range of concrete strength varies from C25 to C65.
Protective Layer Thickness (X2): The thickness of the concrete protective layer ranges from 25 mm to 60 mm.
Maintenance Frequency (X4, X5, X6): Maintenance and repair frequency during the structure’s lifespan were considered as binary decision variables representing the occurrence of maintenance actions at various deterioration stages.
For each of these variables, we modified the values within their feasible ranges while keeping all other variables constant. The impact on the three objective functions—failure probability (Pf), life-cycle cost (CLC), and annual carbon emissions (E)—was then quantified and compared.
3.4.2. Results Presentation
The results of the sensitivity analysis are summarized in Table 6, where we show the variations in failure probability, life-cycle cost, and carbon emissions in response to changes in the key decision variables. The figure below visually represents these impacts:
Table 6.
Sensitivity analysis results.
Figure 3 demonstrates how changes in the key decision variables affect the three objectives: failure probability, life-cycle cost, and carbon emissions. The key observations are as follows:
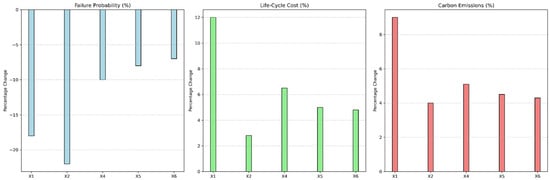
Figure 3.
Sensitivity analysis of key decision variables on optimization objectives.
Concrete Strength (X1): Increasing concrete strength from C25 to C55 reduces the failure probability by 18%, but results in a 12% increase in life-cycle cost and a 9% rise in carbon emissions. While higher concrete strength significantly improves durability, it comes with a substantial environmental and financial cost. This demonstrates that X1 offers clear benefits in reducing structural failure but also requires careful consideration of cost and carbon emission trade-offs.
Protective Layer Thickness (X2): Increasing the protective layer thickness from 40 mm to 55 mm leads to a 22% reduction in failure probability, with a minimal increase in cost (2.8%) and a slight rise in carbon emissions (4%). This makes X2 the most cost-effective strategy for enhancing structural reliability. For long-term durability and minimal environmental impact, increasing the protective layer thickness should be prioritized.
Maintenance Frequency (X4): Introducing one additional maintenance action improves reliability by 10%, but it leads to a 6.5% increase in life-cycle cost and a 5.1% increase in carbon emissions. While maintenance boosts reliability, the returns diminish as frequency increases. Excessive maintenance, therefore, may result in unnecessary cost and carbon impact. Optimizing maintenance schedules is crucial to balance the benefits of reliability with associated costs and emissions.
Maintenance Frequency (X5 and X6): As with X4, increasing maintenance frequency in stages X5 (from corrosion onset to cracking) and X6 (from cracking to critical failure) also improves reliability, but at an increasing cost. X5 and X6 play important roles in ensuring durability at different stages of the structure’s life-cycle, yet their impact on cost and carbon emissions grows, emphasizing the importance of not over-maintaining the structure.
Interaction Effects Between Variables: The interaction between X1 (concrete strength) and X2 (protective layer thickness) reveals that after a certain threshold of concrete strength, further increases in X2 provide diminishing returns. Specifically, when X1 is maximized (e.g., C65), the additional benefit of increasing X2 is less pronounced. However, when X1 is moderate (e.g., C35), the increase in X2 provides a more significant improvement in reliability. This suggests that X1 and X2 should be considered together when optimizing for sustainability and cost.
Practical Implications for Engineering Decision-Making: The analysis provides a framework for decision-making in metro station design, particularly for projects that prioritize cost and carbon emissions:
Protective layer thickness (X2) should be optimized first, as it provides the most efficient improvement in reliability with minimal additional cost and environmental impact.
Concrete strength (X1) should be adjusted according to specific reliability needs, avoiding excessive strength unless absolutely necessary due to the higher costs and carbon emissions.
Maintenance strategies (X4, X5, X6) should be carefully planned to avoid excessive maintenance that could lead to increased costs and carbon emissions, ensuring that the benefits of maintenance are not outweighed by the environmental and financial costs.
In summary, protective layer thickness (X2) stands out as the most cost-effective strategy for improving reliability, while concrete strength (X1) and maintenance frequency (X4, X5, X6) should be optimized cautiously due to their higher cost and environmental implications. The insights from this analysis provide valuable guidance for engineers aiming to design sustainable and cost-effective metro station structures.
3.5. Implementation and Policy Linkage
In order to enhance the practical application of the optimization results, it is important to link the findings with engineering codes and owner policies. The optimization results of the concrete structure, such as increasing the thickness of the protective layer to reduce failure probability, should be evaluated against relevant engineering standards. For example, the design of structural durability and material selection must comply with national and local regulations, such as the GB50009-2012 [37] (Load Code for the Design of Building Structures) in China, which governs concrete strength and durability requirements. Additionally, the owner’s policy, particularly concerning long-term maintenance and environmental sustainability, should be factored into decision-making. For instance, owners with a strong focus on reducing carbon footprint could prioritize solutions with a lower carbon emissions impact, even if they come with slightly higher initial costs.
(1) Integrating LCC and Carbon Evaluation into BIM Workflows
To implement the optimization results effectively, life-cycle cost (LCC) and carbon emission evaluation should be integrated into BIM workflows. By incorporating LCC and carbon emissions data into the BIM model, designers can evaluate the total cost and environmental impact of different design alternatives in real time. BIM software (Autodesk Revit 2023) can be used to track material quantities, construction processes, and maintenance schedules, all while providing real-time cost and carbon emissions data. This allows for a more data-driven decision-making process, where engineers and owners can directly assess the environmental and financial trade-offs associated with each design choice.
(2) Defining Weighting Criteria for Optimization
To address the complex trade-offs between cost, reliability, and carbon emissions, weighting criteria must be defined. These criteria can vary depending on the project goals and stakeholder priorities. For example, if an owner prioritizes cost minimization, the weight assigned to life-cycle cost may be higher than that of reliability or carbon emissions. Conversely, if sustainability is a key goal, the weight assigned to carbon emissions may take precedence. The optimization process should allow for flexibility, enabling the adjustment of weights to align with the owner’s preferences and project objectives.
4. Conclusions
This study investigated the multi-objective optimization of underground metro station structures by simultaneously considering structural reliability, life-cycle economic cost, and annualized carbon emissions. A unified optimization framework was developed using the OMOPSO algorithm to capture the trade-offs among these competing objectives. The proposed approach successfully generated a Pareto-optimal 4-set and demonstrated its capability to support sustainable decision-making in metro station structural design.
Analysis of the Pareto front revealed important interactions among the objectives. Increasing concrete strength (X1) enhances structural reliability but substantially increases both cost and embodied carbon. In contrast, increasing protective layer thickness (X2) was found to be the most cost-effective measure for improving durability with minimal environmental impact. Epoxy-coated reinforcement (X3) was not included in the Pareto-optimal set due to its relatively high cost under the examined conditions. Incorporating durability-related maintenance and repair strategies (X4, X5, X6) further demonstrated how long-term performance considerations affect structural sustainability outcomes. A weighted scoring method was introduced to help decision-makers identify preferred solutions based on project-specific priorities.
The limitations of this study should also be acknowledged. First, although OMOPSO was adopted as the optimization engine, the primary contribution of this work lies in establishing an integrated engineering framework that couples reliability evaluation, life-cycle cost modeling, carbon-emission assessment, and maintenance strategy optimization. OMOPSO was selected as a representative and efficient solver to demonstrate the feasibility of the framework, rather than to advance algorithmic development. Comprehensive benchmarking against other algorithms (e.g., NSGA-II, MOEA/D), while valuable, was not conducted due to the high computational cost of the coupled model evaluations and falls outside the methodological focus of this study. Future research will explore algorithmic comparisons to further assess robustness and generalizability.
Second, the decision variables considered—material strength, cover thickness, corrosion-protection measures, and maintenance strategies—represent key structural design parameters. However, broader project-level factors such as construction method selection, material transportation modes, and on-site energy consumption were not included. Incorporating such variables would expand the scope beyond structural optimization to full life-cycle project management and require additional data and modeling assumptions. These aspects are important drivers of both cost and carbon performance and should be explored in future extensions of the framework.
Future research should therefore investigate the applicability of the proposed framework to different metro station configurations, regional contexts, and additional sustainability indicators beyond carbon emissions, including energy use and resource efficiency. Such efforts will help generalize the framework and further enhance its value for sustainable infrastructure design.
Author Contributions
Methodology, L.W.; Formal analysis, L.W. and L.Z.; Investigation, Y.R.; Resources, Y.R. and L.Z.; Data curation, H.L.; Writing—original draft, H.L. All authors have read and agreed to the published version of the manuscript.
Funding
Research and Development Project of the Ministry of Housing and Urban-Rural Development (2022K-044).
Data Availability Statement
The original contributions presented in this study are included in the article. Further inquiries can be directed to the corresponding author.
Conflicts of Interest
Authors Ling Wang, Yanmei Ruan and Lihua Zhai were employed by the company Guangzhou Metro Design & Research Institute Co., Ltd. The remaining authors declare that the research was conducted in the absence of any commercial or financial relationships that could be construed as a potential conflict of interest.
References
- Kumar, P.P.; Santos, D.A.; Braham, E.J.; Sellers, D.G.; Banerjee, S.; Dixit, M.K. Punching above Its Weight: Life Cycle Energy Accounting and Environmental Assessment of Vanadium Microalloying in Reinforcement Bar Steel. Environ. Sci. Process. Impacts 2021, 23, 275–290. [Google Scholar] [CrossRef]
- Visintin, P.; Xie, T.; Bennett, B. A Large-Scale Life-Cycle Assessment of Recycled Aggregate Concrete: The Influence of Functional Unit, Emissions Allocation and Carbon Dioxide Uptake. J. Clean. Prod. 2020, 248, 119243. [Google Scholar] [CrossRef]
- Minunno, R.; O’Grady, T.; Morrison, G.M.; Gruner, R.L. Investigating the Embodied Energy and Carbon of Buildings: A Systematic Literature Review and Meta-Analysis of Life Cycle Assessments. Renew. Sustain. Energy Rev. 2021, 143, 110935. [Google Scholar] [CrossRef]
- Chen, K.; Chen, X.; Wang, L.; Yang, W.; Qiu, T.; Su, D.; Wu, H. Low-Carbon Effects of Constructing a Prefabricated Subway Station with Temporary Internal Supports: An Innovative Case of Shenzhen, China. J. Clean. Prod. 2023, 426, 139023. [Google Scholar] [CrossRef]
- Sandaruwan, I.P.T.; Manoharan, K.; Kulatunga, U. Cradle-to-Gate Embodied Carbon Assessment of Green Office Building Using Life Cycle Analysis: A Case Study from Sri Lanka. J. Build. Eng. 2024, 88, 109155. [Google Scholar] [CrossRef]
- Wang, L.; Chen, K.; Chen, X.; Su, D.; Liu, S.; Sun, B.; Li, W.; Yang, W.; Zhou, S. Low-Carbon Effects of Constructing a Prefabricated Subway Station Using a Trenchless Method: A Case Study in Shenzhen, China. Tunn. Undergr. Space Technol. 2024, 144, 105557. [Google Scholar] [CrossRef]
- Zhou, X.; Ji, J. A Multi-Objective Optimization Approach for Interprovincial Carbon Emission Reduction in China: Considering Industrial Structure and Ownership Attributes. J. Environ. Manag. 2025, 373, 123646. [Google Scholar] [CrossRef]
- Zhao, Y.; Xuan, S.; Wang, Y.; Li, Y.; Yao, X. Reliability-Based Multi-Objective Optimization Design of Composite Patch Repair Structure Using Artificial Neural Networks. Compos. Struct. 2025, 352, 118692. [Google Scholar] [CrossRef]
- Luo, A.; Wu, Y.; Li, T.; Yang, X.; Liu, Y.; Shu, J. Design of Prefabricated Concrete-Filled Steel Pipe Columns for Pile Beam Arch Subway Stations Based on Carbon Emission Optimization. Materials 2025, 18, 3854. [Google Scholar] [CrossRef] [PubMed]
- Li, G.; Zacaruk, J.; Boulfiza, M. Rational-RC: A Python Package for Probabilistic Life-Cycle Deterioration Modelling of Reinforced Concrete Structures. SoftwareX 2025, 31, 102238. [Google Scholar] [CrossRef]
- Zhang, S.; Zheng, H.; Zhang, Z.; Zhang, T.; Yang, X. Multi-Objective Optimization Design of Internal Cooling Structure of a Sensor Probe. Int. J. Heat Fluid Flow 2024, 107, 109332. [Google Scholar] [CrossRef]
- Deng, Y.; Zhang, K.; Yao, Z.; Zhao, H.; Li, L. Parametric Analysis and Multi-Objective Optimization of the Coupling Beam Pile Structure Foundation. Ocean Eng. 2023, 280, 114724. [Google Scholar] [CrossRef]
- Omar, W.M.S.W.; Doh, J.-H.; Panuwatwanich, K.; Miller, D. Assessment of the Embodied Carbon in Precast Concrete Wall Panels Using a Hybrid Life Cycle Assessment Approach in Malaysia. Sustain. Cities Soc. 2014, 10, 101–111. [Google Scholar] [CrossRef]
- Sandanayake, M.; Kraus, R.; Haigh, R.; Yaghoubi, E.; Vrcelj, Z. Tex-Crete-Carbon and Cost Assessment of Concrete with Textile and Carboard Fibres-Case Studies Towards Circular Economy. Appl. Sci. 2025, 15, 6962. [Google Scholar] [CrossRef]
- Wu, X.; Yuan, W.; Guo, A. Reliability-Based Life-Cycle Cost Seismic Design Optimization of Coastal Bridge Piers with Nonuniform Corrosion Using Different Materials. Earthq. Eng. Eng. Vib. 2024, 23, 209–225. [Google Scholar] [CrossRef]
- Li, J.; Guo, X.; Zhang, X.; Wu, Z. Time-Dependent Reliability Assessment and Optimal Design of Corroded Reinforced Concrete Beams. Adv. Struct. Eng. 2024, 27, 1313–1327. [Google Scholar] [CrossRef]
- Sajedi, S.; Huang, Q. Reliability-Based Life-Cycle-Cost Comparison of Different Corrosion Management Strategies. Eng. Struct. 2019, 186, 52–63. [Google Scholar] [CrossRef]
- Kaewunruen, S.; Peng, S.; Phil-Ebosie, O. Digital Twin Aided Sustainability and Vulnerability Audit for Subway Stations. Sustainability 2020, 12, 7873. [Google Scholar] [CrossRef]
- Mota, A.; Avila, P.; Albuquerque, R.; Costa, L.; Bastos, J. A Framework for Time-Cost-Quality Optimization in Project Management Problems Using an Exploratory Grid Concept in the Multi-Objective Simulated-Annealing. Int. J. Inf. Technol. Decis. Mak. 2021, 20, 1095–1120. [Google Scholar] [CrossRef]
- Wan, C.; Li, W.; Ling, S.; Li, C.; Yang, G. Multi-Scenario Group Decision-Making Based on TOPSIS for Deep Hole Drill Parameter Optimization. Arab. J. Sci. Eng. 2022, 47, 15779–15795. [Google Scholar] [CrossRef]
- Boukrouh, I.; Tayalati, F.; Azmani, A. A Comprehensive Framework for Supplier Selection: Using Subjective, Objective, and Hybrid Multi-Criteria Decision-Making Techniques with Sensitivity Analysis. IEEE Access 2024, 12, 145550–145569. [Google Scholar] [CrossRef]
- Koh, D.; Tokbolat, S.; Blaauw, S.A. Life cycle assessment of pavement construction: A case study. IOP Conf. Ser. Earth Environ. Sci. 2024, 1363, 012065. [Google Scholar] [CrossRef]
- Liu, M.; Yu, Y.; Zhang, J.; Wang, D.; Zhang, X.; Yan, M. Research on Multi-Objective Optimization on Explosion-Suppression Structure-Nonmetallic Spherical Spacers. Fire 2024, 7, 28. [Google Scholar] [CrossRef]
- Zhan, Z.; Xia, P.; Xia, D.; Hu, Y. Multi-Objective Optimization in the Construction of Steel-Concrete Composite Columns with Carbon Emission Considerations: Pareto Front Development and Decision-Making. Ain Shams Eng. J. 2025, 16, 103283. [Google Scholar] [CrossRef]
- Deb, K.; Pratap, A.; Agarwal, S.; Meyarivan, T. A Fast and Elitist Multiobjective Genetic Algorithm: NSGA-II. IEEE Trans. Evol. Computat. 2002, 6, 182–197. [Google Scholar] [CrossRef]
- Kennedy, J.; Eberhart, R. Particle Swarm Optimization. In Proceedings of the ICNN′95—International Conference on Neural Networks, Perth, Australia, 27 November–1 December 1995; Volume 4, pp. 1942–1948. [Google Scholar]
- Zhang, Q.; Li, H. MOEA/D: A Multiobjective Evolutionary Algorithm Based on Decomposition. IEEE Trans. Evol. Computat. 2007, 11, 712–731. [Google Scholar] [CrossRef]
- Ni, X.H.; Teng, X.C.; Jiang, W.; Zhang, Y.; Ren, X. Multi-Objective Optimization and Theoretical Analysis of Re-Entrant Structure with Enhanced Mechanical Properties. Thin-Walled Struct. 2024, 199, 111791. [Google Scholar] [CrossRef]
- GB/T 50476-2019; Standard for Design of Concrete Structure Durability. China Architecture & Building Press: Beijing, China, 2019.
- Yuan, Y.; Hu, C.; Li, L.; Mei, Y.; Wang, X. Regional-Modal Optimization Problems and Corresponding Normal Search Particle Swarm Optimization Algorithm. Swarm Evol. Comput. 2023, 78, 101257. [Google Scholar] [CrossRef]
- Yuan, Y.; Hu, C.; Li, L.; Xu, J.; Hou, X. Efficient Slope Reliability Analysis Using a Surrogate-Assisted Normal Search Particle Swarm Optimization Algorithm. J. Comput. Des. Eng. 2024, 11, 173–194. [Google Scholar] [CrossRef]
- ISO 14040:2006; Environmental management—Life cycle assessment—Principles and framework. International Organization for Standardization: Geneva, Switzerland, 2006.
- ASTM A755/A755M-23; Standard Specification for Steel Sheet, Metallic-Coated by the Hot-Dip Process and Prepainted by the Coil-Coating Process for Exterior Exposed Building Products. ASTM International: West Conshohocken, PA, USA, 2023.
- BS 7295:1990; Fusion bonded epoxy coated carbon steel bars for the reinforcement of concrete. British Standards Institution: London, UK, 1990.
- Smith, B.J.; Kurama, Y.C.; McGinnis, M.J. Perforated Hybrid Precast Shear Walls for Seismic Regions. ACI Struct. J. 2015, 112, 359–370. [Google Scholar] [CrossRef]
- GB/T 51366-2019; Standard for Building Carbon Emission Calculation. China Architecture & Building Press: Beijing, China, 2019.
- GB 50009-2012; Load Code for the Design of Building Structures. China Architecture & Building Press: Beijing, China, 2012.
Disclaimer/Publisher’s Note: The statements, opinions and data contained in all publications are solely those of the individual author(s) and contributor(s) and not of MDPI and/or the editor(s). MDPI and/or the editor(s) disclaim responsibility for any injury to people or property resulting from any ideas, methods, instructions or products referred to in the content. |
© 2026 by the authors. Licensee MDPI, Basel, Switzerland. This article is an open access article distributed under the terms and conditions of the Creative Commons Attribution (CC BY) license.