Abstract
In urban design, public open spaces (POS) are essential for enhancing health and well-being across the lifetime. High-quality public open spaces facilitate the maintenance of optimal physical and mental health in older individuals by encouraging activities like physical exercise and social engagement. Preserving the physical and mental well-being of elderly individuals is a fundamental concern for aging policy. Nevertheless, urbanization presents considerable problems with the provision of public open spaces for activities aimed at the elderly. South Korea has more significant issues than other nations globally. This study, based on data from 477 valid questionnaires collected in and around Tapgol Park in Jung-gu, Seoul, employed a decision tree approach to identify key factors and paths that influence overall satisfaction. The goal was to identify decision paths that improve satisfaction while ensuring interpretability, thereby providing a scientific basis for urban space design and renovation. The results show that: (1) The decision tree of this study presents a hierarchical logic of quietness first, then accessibility and cleanliness, and finally price and vitality, which is consistent with the high frequency of use of Tapgol Park by the elderly and the diverse facilities in the surrounding area. (2) The key to improving the management and satisfaction of Tapgol Park in Seoul is the quietness of the site. (3) When the park is not quiet, users are most sensitive to bottom-line factors, such as commercial supply, evacuation safety, transportation accessibility, price perception, barrier-free, and anti-slips. (4) When the park is quiet, basic comfort factors such as smooth walking, all-day opening, sunlight, and no odor constitute the minimum condition set for entering the comfort zone. (5) Water experience, waterfront accessibility, proximity to cultural resources, and moderate business and community-oriented leisure facilities are key plus points. Methodologically, this study is among the first to apply a decision tree approach to low-income elderly using a small public open space in a historic city center, clarifying the nonlinear and hierarchical relationships among environmental factors within these low-income elderly groups. This provides empirical support and reference for the aging-friendly urban space in world heritage cities and other historical and cultural cities.
1. Introduction
1.1. Research Background
Public open spaces are a crucial component of healthy aging [1]. In urban planning, public open spaces are a crucial tool for improving health and well-being throughout the lifespan [2,3]. High-quality public open spaces can help older adults maintain excellent physical and mental health by promoting activities such as physical exercise and social interaction. Maintaining the physical and mental health of older adults is a top priority for aging policies. However, urbanization poses substantial obstacles to the planning of public open spaces for elderly activities [4]. South Korea faces even greater challenges than other countries worldwide. In Korea, over 40% of adults aged 65 years and older live in relative poverty, representing the highest old-age poverty rate among OECD countries [5]. According to the 2025 Senior Citizens Statistics published by Statistics Korea, the number of people aged 65 and over will exceed 20% of the total population, making South Korea a super-aged country [6]. According to data from the Seoul Metropolitan Government, the number of people aged 65 and over in Seoul will be particularly high, accounting for 19% of the population in 2025, totaling 1,860,632 [7]. Seoul’s population is on the brink of entering a super-aged era. A super-aged society is accompanied by the problem of elderly poverty. In 2022, South Korea’s relative poverty rate for the elderly was 39.7%, making it the highest poverty rate globally [8]. By 2025, the number of elderly people aged 65 and over living in poverty in South Korea will rise from 3.5 million to 4.6 million, with nearly one in every two people living in poverty being an elderly person [9]. The difficulty for elderly people living in poverty [10] to access high-quality public open spaces exacerbates their mental health issues [11]. Loneliness is particularly prominent among older South Koreans [12]. Moreover, the mental health of older adults depends to a large extent on the support provided by public open spaces, and this dependence is particularly pronounced among older men [13].
According to the Seoul Welfare Foundation’s Age-Friendly Seoul City 2.0 report (2025), Jongno-gu is one of Seoul’s main activity areas for adults aged 60 and older [14]. As a central park for impoverished elderly men, Tapgol Park (탑골공원), located near Insa-dong in Jongno-sam-ga, Nakwon Musical Instrument Arcade, and Jongmyo Shrine in central Seoul, is a representative gathering place for seniors [15,16]. It is also recognized by the Seoul Metropolitan Government as a priority governance area for age-friendly public open spaces [17]. Tapgol Park is built around the historical site of Wongaksa Temple. It is also close to Seoul’s representative coffee culture district and the World Heritage Site Jongmyo Shrine and has rich historical and cultural resources. Rich in historical and cultural resources, Tapgol Park holds significant importance for seniors in Korea. Heritage-led redevelopment in 2000 (the “Tapgol Park Sacred Domain”) [18] was criticized for excluding older users [19]. Amid persistent alcohol-related disorder (public urination, fights) [19], Jongno-gu designated Tapgol Park and nearby alleys alcohol-free in April 2026 [20], reigniting debate on social equity in low-income elderly people’s use of public open spaces [21]. Tapgol Park and its surrounding facilities offer a variety of options for seniors including many low-cost barbershops, affordable restaurants, and free meal services [22]. However, they face the risk of encroachment on their space. Due to factors such as heritage preservation and commercial development, the amount of open space previously reserved for seniors and the number of facilities and spaces accessible to them are shrinking. Despite this, Tapgol Park continues to attract many elderly men, particularly those from low-income families. Nearly a thousand people visit Tapgol Park daily, predominantly low-income elderly people, and the park’s cultural environment fosters an atmosphere that is accessible to men [23]. At the Wongaksa Temple (원각사) free meal service site in Tapgol Park, low-income elderly people queue from 6:00 a.m.; the daily peak reaches approximately 290 diners [24]. As one of Seoul’s most representative gathering places for low-income elderly people [25], Tapgol Park is selected as this study site.
According to the research team’s observations, low-income elderly people primarily spend their time outdoors in the streets, buildings, and parks bounded by Jongno, Supyo-ro, Samil-daero, Donhwamun-ro. Overall, the open spaces centered around Tapgol Park in the city center (including the park and surrounding roads) and its surrounding facilities constitute a prime public open space for these elderly men to spend time outdoors. However, with rapid urbanization, the planning and construction of open spaces in the city center face significant challenges, particularly a lack of research and practical support for optimizing spaces specifically for low-income elderly people. This research gap urgently needs to be addressed, as optimizing open spaces for this group not only promotes emotional well-being [26] and enhances subjective well-being [27], but also holds significant implications for promoting social equity and achieving healthy aging. Furthermore, studies have shown that public open spaces that are safe, well maintained, and offer a high level of landscape comfort [28], as well as high-quality [26] public open spaces characterized by good sky visibility [29], high walkability and free access [30], have positive effects on the emotional well-being and subjective well-being of low-income elderly people [27]. These spaces are also of critical importance for promoting social equity [31] and achieving healthy aging. A recent literature review further emphasized that the accessibility, availability, and spatial quality of public open spaces such as green areas exert a clear protective effect on the mental health of low-income populations [32]. At the same time, higher subjective satisfaction with public open spaces can elicit more positive emotions among older adults and enhance their visual comfort [28]. Deficiencies in the facilities, functional diversity, and accessibility of public open spaces in old urban districts significantly reduce older adults’ subjective satisfaction [33], whereas positive perceptions of the accessibility, safety, and comfort of these spaces help promote the mental and social health of low-income elderly people [34]. In high-density city centers, better walking accessibility, overall environmental quality [10], and safety- and lighting-related features [35] in public open spaces are associated with higher satisfaction among older adults and more active use. Therefore, this study provides theoretical references and policy implications for the future planning and design of a wider range of age-friendly open spaces and healthy aging from the perspective of low-income elderly people by providing evidence from South Korea.
1.2. Literature Review
As mobility declines with aging, outdoor open spaces become crucial for seniors to connect with nature and participate in daily activities [28]. Given the importance of outdoor activities and access to nature for seniors’ emotional well-being, the design of these open spaces should meet their needs. Previous research has shown that the emotional impact of outdoor open spaces on low-income seniors varies. For example, low-income seniors experience positive emotions in open spaces near green spaces and historic buildings, but the impact of public transportation is not as uniformly positive as traditionally assumed [36]. They also prefer outdoor open spaces that are safe, less prone to falls, have useful wayfinding systems, are aesthetically pleasing, and are easily accessible [37]. A United States study found that low-income Chinese American seniors prefer safe, accessible public open spaces that offer cultural activities [38]. Although recent studies have shown that high-quality public open spaces for outdoor activities are more likely to elicit positive emotions among older adults [26], that higher levels of landscape and overall comfort in such spaces are associated with better emotional well-being [28], and that good sky visibility can alleviate psychological anxiety and improve the psychological health of older adults [39], research on the open space preferences of low-income elderly people is urgently needed.
Gender differences also exist in preferences for public open spaces for outdoor activities. Women generally prefer indoor environments, while men primarily use city streets [40]. Furthermore, women place greater importance on the safety of public open spaces for outdoor activities than men do [41,42]. The openness of views and the cleanliness of public spaces influence women’s safety perceptions [43]. Ref. [44] also found that many elderly Korean women advocate for fences, gates, and continuous surveillance in parks, as well as for improving safety with diverse materials and facilities. Meanwhile, elderly Korean men are more concerned about fall risks, expressing concern about uneven sidewalks and sloped trails and suggesting the addition of handrails. Older women, who also differ in the distance they use public open spaces, tend to prefer informal public open spaces near their homes (such as street corners) for brief social interactions compared to men [45]. This suggests the need for tailored interventions to address these demographic differences [42]. However, research on public open space satisfaction among low-income elderly people for outdoor activities remains insufficient. Given the high prevalence of mental health issues among elderly in South Korea, research on open space satisfaction among these elderly is crucial for the comprehensive advancement of the WHO’s “Decade of Healthy Aging” initiative [46].
With the widespread application of machine learning technologies, researchers are increasingly adopting these advanced methods to analyze the factors influencing senior citizen satisfaction. Although recent studies examining the factors influencing environmental satisfaction among older adults have employed machine-learning approaches such as random forests [47] and non-linear models including ordered Logit [48], the use of decision tree classification models in the analysis of senior citizen satisfaction remains relatively new. Research on the impact of the environment on senior citizens’ emotions has primarily utilized methods such as deep learning, space syntax [49], and street view images [50]. Studies on the impact of open space on outdoor activities have primarily used gradient-based decision trees (GBDTs) [51], or random forests [52]. In a study of open space satisfaction among adult residents in a historic heritage site, ref. [53] used a decision tree classification model to reveal key factors influencing open space satisfaction, including Largo square layout, commercial colors and materials, the location of historic buildings, and the legibility of commercial signage. However, no study has yet used this method to conduct an in-depth study on open space satisfaction among low-income elderly people. The decision tree model can be presented in a tree structure with clear logic, is easy to understand and explain, and can clearly identify the key factors and optimal paths that affect the satisfaction of the elderly [53], which is more conducive to the formulation of clear and sustainable open space planning and design strategies.
1.3. Problem Statement and Objectives
The primary objective of this study was to conduct an in-depth analysis of the environmental satisfaction of low-income elderly people visiting Tapgol Park in central Seoul. Tapgol Park in central Seoul holds unique reference value due to its long-standing appeal to elderly residents and its diverse surrounding environment. This study employed a questionnaire survey and decision tree methodology to analyze and understand the complex factors influencing low-income elderly people’s satisfaction with the content dimensions of the environmental characteristics of Tapgol Park in central Seoul. At the methodological level, translating survey data into context-specific decision rules through the decision tree model mitigates core limitations of conventional linear, variable-by-variable approaches and enables the systematic identification of interaction and configuration effects among multiple environmental factors [53]. This will offer important advice to policymakers and urban planners, helping them develop more effective strategies and policies to improve the life satisfaction of low-income elderly people in their home-based care and ensure the sustainable development of open spaces in central Seoul.
2. Study Area and Methodology
2.1. Study Area: Tapgol Park and Its Surrounding Areas
Jongno 3-ga Tapgol Park and its surrounding streets in Seoul are the main geographical scope of this study (Figure 1). The primary area of activity for seniors at Tapgol Park is concentrated within the area bounded by Jongno-gu, Supyo-ro, Samil-dae-ro, and Donhwamun-ro 11-ga. The area around Tapgol Park and Supyo-ro is particularly popular for socializing with seniors. Tapgol Park, located in Seoul’s Jongno-gu district, is near Jongno 3-ga Station on Seoul Subway Lines 1, 3, and 5. It covers an area of 19,599 square meters and is adjacent to Insadong, Jongmyo Park, and Gyeongbokgung Palace.
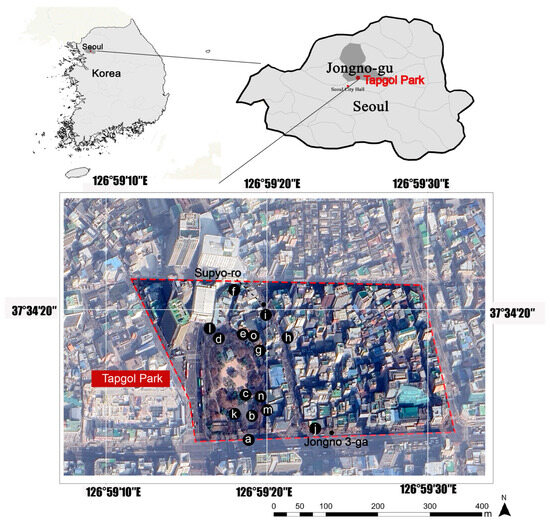
Figure 1.
Study Area: Tapgol Park and Its Surrounding Areas.
According to the Seoul Welfare Foundation’s Age-Friendly Seoul City 2.0 report (2025), Jongno-gu is a key activity area for adults aged 60+, and Tapgol Park is designated by the Seoul Metropolitan Government as a priority age-friendly public open space. The park’s protected area is 15,051 m2 (≈0.015 km2) [54], only about 0.0025% of Seoul [55] and 0.06% of Jongno-gu [56]. Although Jongno-gu has about 140,000 residents, its concentration of government, commercial, and cultural functions attracts a daytime population of roughly 2 million. As a typical downtown open space, Tapgol Park exhibits distinct place-making characteristics (Figure 2). The park provides essential leisure and social activities and fosters a significant agglomeration effect due to the diverse surrounding amenities. In particular, the abundance of traditional food stalls, street food vendors, affordable amenities (such as barber shops and shoe repair shops), free canteens, chess studios, cultural centers, and various commercial facilities surrounding Tapgol Park makes it particularly attractive to older people. Within Tapgol Park’s public open spaces, areas in front of snack shops and small businesses, intersections, benches, stone borders along flower beds, plazas, pavilions, and spaces under eaves serve as key venues for seniors to interact and linger, forming a typical gathering place for older people. Convenient transportation accessibility, surrounding commercial and cultural amenities, diverse recreational facilities, and familiar social networks all contribute to Tapgol Park’s place-making qualities. Furthermore, the surrounding streets and neighborhood facilities further enhance this appeal, making it a unique hub for seniors’ daily activities within the urban fabric.
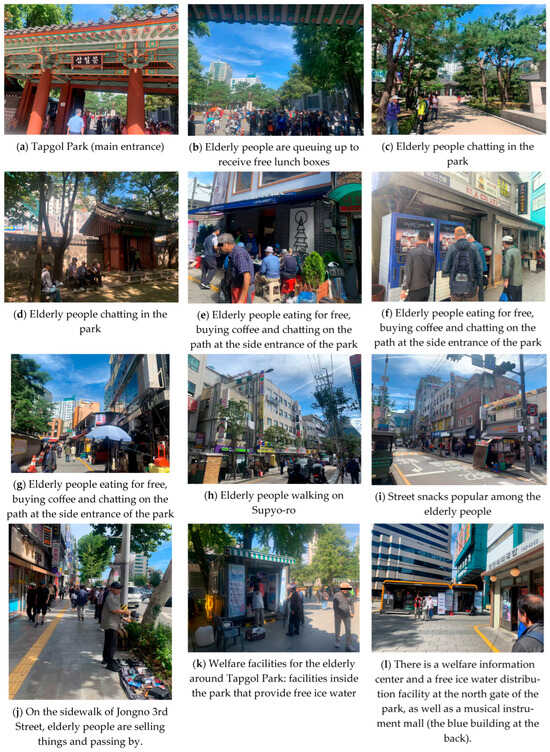
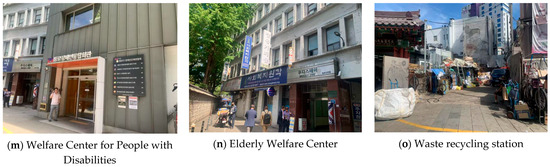
Figure 2.
The research team investigated the situation around Tapgol Park. (a) Tapgol Park (main entrance); (b) Elderly people are queuing up to receive free lunch boxes; (c,d) Elderly people chatting in the park; (e–g) Elderly people eating for free, buying coffee and chatting on the path at the side entrance of the park; (h) Elderly people walking on Supyo-ro; (i) Street snacks popular among the elderly people; (j) On the sidewalk of Jongno 3rd Street, elderly people are selling things and passing by; (k) Welfare facilities for the elderly around Tapgol Park: facilities inside the park that provide free ice water; (l) There is a welfare information center and a free ice water distribution facility at the north gate of the park, as well as a musical instrument mall (the blue building at the back). (m) Welfare Center for People with Disabilities; (n) Elderly Welfare Center; (o) Waste recycling station. The Korean text in the photos mainly refers to shop signs, road signs, and directions.
2.2. Five Dimensions of Seoul’s Central Environment
This study developed measurement items for five dimensions of public open spaces (accessibility, convenience, diversity, safety, and comfort) by adapting two Korean-language questionnaires on age-friendly community public spaces and elderly-friendly walking environments [37,57]. First, we extracted from the original instruments all items that were conceptually related to outdoor public open spaces and everyday walking environments (e.g., path conditions, greenery, lighting, street furniture, nearby facilities, and social spaces), while items referring to indoor housing conditions, employment, or medical systems were excluded. Second, conceptually overlapping items were consolidated and reorganized into the five dimensions above, and several context-specific items were added to reflect the spatial and functional characteristics of Tapgol Park and its surrounding streets (such as access to transit, nearby commercial and leisure facilities, historic monuments, and street vendors). This process yielded a final pool of 41 items (Q1-1~Q1-6 for accessibility, Q2-1~Q2-7 for convenience, Q3-1~Q3-7 for interesting/variety, Q4-1~Q4-7 for safety, and Q5-1~Q5-9 for comfort), plus one item measuring overall satisfaction (OS), as summarized in Appendix A. The questionnaire was administered in Korean using a five-point Likert scale (1 = strongly disagree, 5 = strongly agree); the English wording reported in this article is a translation of the original items for the purpose of international dissemination.
The questionnaire used a five-point Likert scale to measure seniors’ satisfaction with the characteristics of Tagu Park’s public open spaces. A 30-day field observation process also identified the primary areas of seniors’ outdoor activities. In the field observations, we referred to Gehl’s classification of behavioral types in public spaces (necessary activities, social activities, and optional activities) and his methods of recording [58]. We observed, during the same time periods on different days, the locations, numbers, types, and durations of activities of older around Tapgol Park. Seniors’ overall satisfaction served as the dependent variable (a continuous variable), while 41 attributes across the five dimensions of public open spaces served as independent variables.
To clarify the on-site observation procedure, this study describes three consecutive full-day observations conducted in Tapgol Park. Repeated observations were carried out at each fixed observation point during the same time periods on different days. A manual hand-held tally counter was used to record attendance. Each entry corresponded to a clearly defined time segment, primarily based on 10-min scan intervals (e.g., 10:10–10:20; 11:15–11:25) to capture ongoing activities. “Location” was operationalized as a fixed observation point (observation zone). “Quantity” was operationalized as the number of older people engaged in observable activities within the visible boundary of the observation zone during each time segment (recorded as 0 when none were present), with sex composition recorded simultaneously. “Type” was categorized following Gehl’s three behavioral types, including necessary activities (e.g., queuing to receive meals or lunch boxes), social activities (e.g., conversation, playing chess, shared eating), and optional activities (e.g., walking, watching, taking photos, seated resting). “Duration” was operationalized using the start and end times of each time segment (duration = end time − start time). In total, approximately 70 observation time segments were obtained from Tapgol Park, covering key periods in the morning, afternoon, and early evening. These observation data were used to identify primary activity areas and high-frequency activity repertoires of elderly people and to provide contextual evidence for interpreting the public open space attributes assessed in the subsequent questionnaire, thereby enhancing the traceability and validity of the study.
In 2018, UN-Habitat defined outdoor public open spaces as spaces that provide social interaction, such as parks, streets, green spaces, squares, and sidewalks, as well as recreational areas like playgrounds and markets, and marginal spaces between buildings or along roads [59]. Streets, parks, and squares are the primary venues for outdoor activities [58]. The outdoor activities of the elderly mainly include leisure activities, daily activities, and social activities, specifically walking activities, sports activities, participating in gatherings and interest groups, and going out shopping [60,61,62].
Walkability, convenient travel routes, and accessibility to commercial facilities, transit stations, parks, and recreational areas significantly influence older adults’ outdoor physical activity [26,63]. Furthermore, familiar and accessible locations facilitate intergenerational physical activity among older adults [63]. Furthermore, proximity to transit stations and high-quality public open spaces makes it easier for older adults to participate in community activities, fostering social interaction, particularly among older men [42].
On the other hand, the leisure, daily activities, and social interactions of older adults outdoors are primarily influenced by amenities within public open spaces, such as roads, hospitals, bus stops, grocery stores, and subways [64]. Adequate exercise space, nearby parks, fitness centers, and sports equipment in the community effectively support older adults’ outdoor activities [63]. Furthermore, research from South Korea has shown that amenities and social spaces along walking paths can positively promote walking among older adults [65].
Available recreational facilities around public open spaces can create more attractions for older adults and promote social interaction. For example, clubs and social activity centers provide structured opportunities for older adults to meet and interact with peers, thereby strengthening their social networks [66]. Furthermore, the safety of pedestrian environments and pedestrian spaces, as well as the safety of cycling paths (sidewalks, bike lanes, and pedestrian zones), directly impact the participation of older adults in outdoor physical activities [26,65]. At night, lighting levels and uniformity are crucial factors influencing outdoor activities among older adults [35]. Furthermore, comfort factors significantly influence the experience of older adults in outdoor activities. Convenient and safe transportation facilities, along with good weather conditions, can enhance the participation of older adults in intergenerational physical activities [63]. Furthermore, micro-environmental factors in outdoor open spaces, such as path flatness, shade, seating arrangements, and surface materials, significantly influence older adults’ walking and other physical activities [67,68]. Furthermore, the perception of green areas positively impacts the comfort of older adults experiencing outdoor activities at night [35].
Because low-income communities often offer fewer public open spaces suitable for outdoor activities and have less accessible walkability than higher-income communities [69,70], outdoor public open spaces are often crucial for low-income urban residents [57]. Furthermore, significant differences in preferences between older men and women exist when it comes to using outdoor public open spaces: women prioritize safety more than men, while men prioritize the amenities of outdoor public open spaces more. This phenomenon suggests the need for tailored interventions to address these demographic differences [42].
2.3. Data Collection and Questionnaire Distribution
The research team surveyed elderly people aged 65 and older who visited Tapgol Park on Jongno 3-ga, Seoul, from 15–20 June 2025, and from 5–26 August 2025. The researchers selected five dimensions of age-friendly urban public open spaces: accessibility, convenience, safety, and comfort. Data were collected on-site using a paper questionnaire. We created a questionnaire using digital tools provided by wjx.cn to facilitate digital recording and organization. The questionnaire questions are provided in Appendix A. The Institutional Review Board (IRB) of Hangzhou City University reviewed and approved research involving human subjects. Before completing the questionnaire, the participants’ legal guardians or next of kin provided written informed consent for this study (Approval Number 2025-0308). The content structure and questions of the questionnaire are in Appendix A.
The researchers distributed a total of 500 questionnaires, eliminating incomplete or incorrectly completed ones. However, a total of 477 valid questionnaires were collected, representing 95.4% of the total. In terms of age distribution, the survey results showed that 115 women, or 24.1%, represented most participants, while 362 men, or 75.9%, comprised the majority (Table 1). The 65–70 age group had the largest number of participants, with 180 participants, or 37.73%. Conversely, the 80-plus age group had the smallest number of participants, with only 139, or 29.1%. The 71–80 age group had 158 participants, or 33.1%. Regarding occupational distribution, the largest number of elderly individuals selected other occupations, totaling 200, or 41.9%. The smallest number of participants were company employees, with 62, or 13%, representing the majority. Managers comprised 67, or 14%, and business owners comprised 78, or 16.4%. There were 70 people working in the service industry, accounting for 14.7% of the total. Regarding educational background, the majority had a high school education or less, totaling 172 people, or 36.1%. High school graduates accounted for 135 people, or 28.3%. Vocational college graduates accounted for 84 people, or 17.6%. General university graduates accounted for 86 people, or 18%. Seniors with an average monthly income of less than 1 million South Korean Won (KRW) were the largest group, totaling 191, or 40% of the total. The next largest group was those with an average monthly income between 1 and 2 million won (KRW), totaling 84, or 17.6%. The group with an average monthly income between 2.01 and 3 million won (KRW) accounted for 64, or 13.4% of the total. And those with an average monthly income between 3.01 and 4 million won (KRW), totaling 69, or 14.5%. There are 69 elderly people with an average monthly income of over 4 million won, representing 14.5% of the total population. According to the Ministry of Health and Welfare’s 2025 standards, the median monthly income for a single person is approximately 2,392,013 South Korean Won. Those earning less than 50% of the median (₩ 1,196,006) are considered low-income and eligible for education subsidies. Those earning less than 40% of the median (₩ 956,805) are eligible for medical subsidies, and those earning less than 30% of the median (₩ 717,604) are eligible for living allowances.

Table 1.
Basic information of the respondents.
2.4. Research Process and Decision Tree Method
This study uses a decision tree method to identify key factors and paths that affect overall satisfaction based on questionnaire data from Tapgol Park and its surrounding areas in Jung-gu, Seoul. The goal is to provide a decision path that can improve satisfaction while ensuring interpretability. Tapgol Park has long attracted elderly people to gather, and the surrounding facilities are diverse and representative, making it suitable for conducting path identification research from environmental factors to satisfaction. The questionnaire scale of this study includes five dimensions: accessibility, convenience, interest/variety, safety, and comfort, with a total of 36 items as the characteristic value variables of the model. Overall satisfaction is used as the target value variable of the model. The research process of this study is constructed with reference to the common research steps in existing literature [53], from data preprocessing, data set division, model construction and parameter optimization, model training and evaluation, to visualization and rule extraction, and is adjusted according to the purpose of this study to ensure the scientificity and appropriateness of the method (Figure 3).
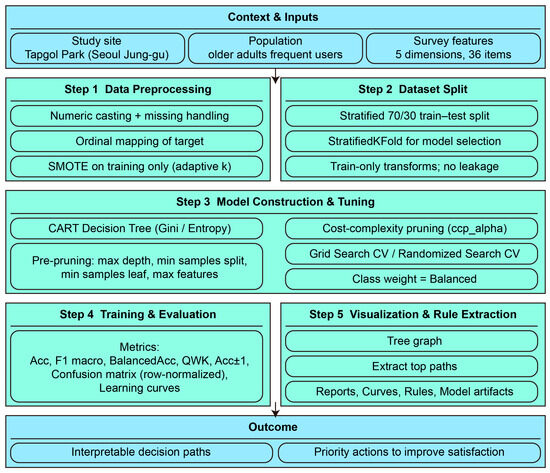
Figure 3.
The research process in this study.
(1) Data Preprocessing. To ensure data quality and model comparability, raw questionnaire data were standardized. Independent variables were numericalized [71], with missing or infinite values imputed using out-of-domain constants to maintain training stability. The target variable (overall satisfaction) was mapped to ordered integers. Feature selection was conducted using both mutual information and tree-based embedded importance to filter high-contribution features. To address class imbalance, the Synthetic Minority Oversampling Technique (SMOTE) was applied to the training set, with the number of neighbors adaptively set based on the minority class sample size.
(2) Dataset Partitioning. A stratified random sampling method (70:30 ratio) was used to split data into training and test sets, strictly preserving the distribution of satisfaction levels. Stratified k-fold cross-validation with shuffling was employed within the training set for hyperparameter tuning [72]. To prevent data leakage, all preprocessing steps, including feature selection and SMOTE, were strictly isolated within the training folds.
(3) Model Construction and Optimization. The study employed the CART decision tree framework [73]. Overfitting was mitigated through pre-pruning (constraints on max depth, min split/leaf samples) and post-pruning using Cost Complexity Pruning (CCP). Hyperparameters were optimized via GridSearchCV or RandomizedSearchCV [74], maximizing the Macro-average F1 score with class weights balanced. The optimal tree structure was determined by selecting the CCP alpha that yielded the best generalization score on the cross-validation curve [75].
(4) Training and Evaluation. Performance was assessed using multiple indicators: Overall Accuracy (Acc), F1 score, and Balanced Accuracy. Given the ordinal nature of satisfaction, Quadratic Weighted Kappa (QWK) and Accuracy within one error (Ac@±1) were included. Additionally, an ordinal judgment rule based on the cumulative median of posterior probabilities was implemented to reduce classification errors. Model diagnostics included row-normalized confusion matrices to visualize error structures and learning curves to assess bias and variance.
(5) Visualization and Rule Extraction. The final converged tree model was visualized to display discriminant paths. Decision rules were extracted and simplified into interval expressions, ranked by a joint score of credibility and coverage. All artifacts, including variable mappings, rule sets, and model files, were archived to ensure reproducibility.
The above process thoroughly evaluates the questionnaire scale and sample characteristics, systematically addresses category imbalance, model complexity, and overfitting risks, and utilizes various evidence such as ordered judgment, learning curves, and rule screening to clearly demonstrate the significant role of segmented characteristic value items in assessing target value satisfaction.
3. Results
3.1. Questionnaire Reliability and Validity Analysis Results
3.1.1. Questionnaire Reliability Analysis
This survey aimed to identify the environmental satisfaction of low-income older men living in Tapgol Park in central Seoul. The survey consisted of 37 items divided into five dimensions: accessibility, convenience, interest or variety, safety, and comfort. After collecting the questionnaire data, the researchers conducted a reliability analysis.
According to the reliability analysis in Table 2, the internal consistency coefficients (Cronbach’s alpha coefficients) for the five dimensions were 0.953, 0.903, 0.915, 0.949, and 0.967, respectively. The Cronbach’s alpha coefficient for the entire scale was 0.955. Cronbach’s alpha coefficients for the five dimensions and the entire scale were all greater than 0.8, indicating satisfactory internal consistency and reliability for the five dimensions and the entire scale [76,77].
Table 2.
Cronbach’s α coefficient.
3.1.2. Construct Validity of the Questionnaire
The researchers conducted an exploratory factor analysis on the questionnaire using SPSS software (version 29.0.2.0). Principal component analysis (PCA) was used for factor extraction, with varimax rotation performed. As shown in Table 3, the results of the KMO and Bartlett’s test of sphericity (STS) showed a KMO value of 0.944, greater than 0.6, and a significance of less than 0.001 for the Bartlett test of sphericity, indicating that the questionnaire was suitable for factor analysis and factor extraction. Table 4 shows the total variance explained by the exploratory factor analysis. The results showed that the factor analysis extracted five factors, with a cumulative explained variance of 74.197%, exceeding 60%, indicating that the extracted factors explained 74.197% of the original 36 items. The first principal component explained 39.767% of the variance, less than 40% and less than half of the total explained variance of 74.197%, indicating that the questionnaire did not contain common method bias.
Table 3.
KMO and Bartlett’s test of sphericity.
Table 4.
Total variance explained (extraction method: principal component analysis).
Table 4 shows the total variance explained by the exploratory factor analysis. The results indicate that the factor analysis extracted five factors with a cumulative explained variance of 74.197%, exceeding 60%, indicating that the extracted factors account for 74.197% of the original 36 items. The first principal component explained 39.767% of the variance, less than 40%, indicating that the questionnaire was free of common method bias.
Table 5 shows the rotated component matrix obtained through exploration factor analysis. The factors for the nine measurement items in the fifth dimension (comfort) of Tapgol Park’s public open space are all concentrated on the first principal component. The factor loadings for the seven dimensions of the safety measurement item are all concentrated on the second principal component. The factor loadings for the seven dimensions of the Interest or Variety measurement item are all concentrated on the third principal component. The factor loadings for the six dimensions of the accessibility measurement item are all concentrated on the fourth principal component. The factor loadings for the seven dimensions of the convenience measurement item are all concentrated on the fifth principal component. The structure of the rotated component matrix is consistent with the questionnaire design, indicating that each dimension has excellent structural validity.
Table 5.
Rotated component matrix for exploratory factor analysis (extraction method: principal component analysis; rotation method: Nishizawa normalization maximum variance method).
3.1.3. Convergent and Discriminant Validity of the Questionnaire
In addition, the researchers conducted a confirmatory factor analysis on the questionnaire using AMOS software (version 29) to determine its convergent and discriminant validity. Convergent validity refers to the internal convergence of the five items within each dimension; discriminant validity refers to the degree of discrimination between different dimensions. Figure 4 and Table 6 details the confirmatory factor analysis model.
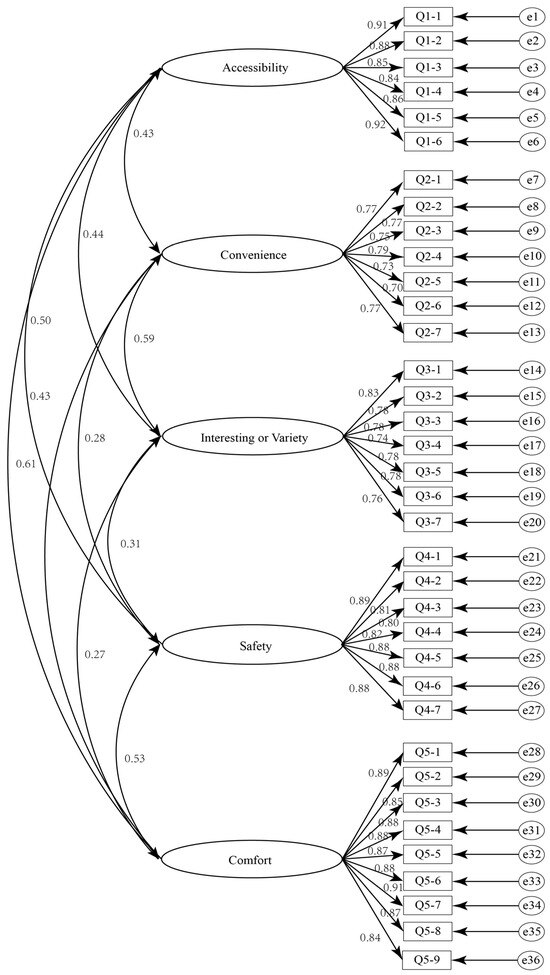
Figure 4.
Confirmatory factor analysis model.
Table 6.
Confirmatory factor analysis fit index.
3.1.4. Convergent Validity of the Questionnaire
Convergent validity refers to the internal convergence of the five items within each dimension. As shown in Table 7, the standardized loadings of the measurement items corresponding to the five dimensions ranged from 0.699 to 0.919. With the exception of the “Complete Sports Facilities” measurement item, which had a standardized loading of 0.699 (very close to 0.7), all other measurement items were greater than 0.7. The composite reliability (CR) values for the five dimensions of accessibility, safety, convenience, comfort, and diversity were 0.953, 0.903, 0.915, 0.949, and 0.967, respectively. All values were greater than 0.7. The average variance extracted (AVE) values for the five dimensions were 0.772, 0.572, 0.607, 0.726, and 0.766, respectively, all exceeding 0.5. Overall, the standardized loadings, composite reliability, and average variance extracted all met the standards, indicating that the questionnaire possesses excellent convergent validity.
Table 7.
Results of convergent validity analysis.
3.1.5. Discriminant Validity
As shown in Table 8, the values on the diagonal are the square roots of the AVE values of each dimension, indicating the strength of correlation between the dimensions, and the other values are the correlation coefficients between the dimensions. The results in Table 9 show that the diagonal values (currently bold) are larger than the other values, indicating that the questionnaire has strong discriminant validity.
Table 8.
Results of discriminant validity analysis (the bold words on the diagonal line are the squares of the AVE values; the other values are the correlation coefficients between the dimensions).
3.2. Descriptive Analysis of the Characteristics of Open Spaces for Outdoor Activities in Downtown Seoul Based on Five Dimensions
The questionnaire used a five-point Likert scale to measure respondents’ agreement with various aspects of the open space for outdoor activities in Tapgol Park in downtown Seoul. Results indicated that the average scores for the six measurement items in the accessibility dimension were 2.92, 3.12, 2.96, 3.1, 3.18, and 3.21, respectively (Table 9). The average scores for “barrier-free”, “transportation convenience”, and “open all day” exceeded 3 points, while the average scores for “smooth and easy to navigate” and “water-friendly environment” exceeded 2.9. This indicates that respondents generally agreed that most of the aspects mentioned in these six items reflect the importance of open space for outdoor activities in the city center. Respondents also had high approval ratings for safety and comfort, with scores exceeding 3 points. None of the five dimensions exceeded 4 points, indicating that the overall environment is important to low-income seniors. The average scores for convenience and diversity were all below the 3-point threshold, with average scores for convenience of 2.92, 2.9, 2.93, 2.91, 2.87, 2.84, and 2.98, respectively. The average scores for diversity were 2.71, 2.65, 2.82, 2.68, 2.65, 2.59, and 2.78, respectively. This data suggests that low-income seniors do not agree that the above dimensions influence their satisfaction with open spaces for outdoor activities in downtown Seoul. Therefore, when studying open spaces for outdoor activities in downtown Seoul, we considered abandoning the dimensions of convenience and diversity and focusing on the dimensions of accessibility, safety, and comfort.
Table 9.
Descriptive analysis of open space characteristics.
3.3. Analyzing Differences in Open Space Characteristics
Given that different respondent attributes may influence their perceptions of open space, it is necessary to further analyze the differences in open space characteristic scores for downtown outdoor activities based on respondent attributes. The researchers considered respondent attributes such as age group, occupation, marital status, education level, and housing status.
3.3.1. Analysis of Differences Between Age Groups
Table 10, based on one-way ANOVA, shows no significant differences (p > 0.05) in scores across the five dimensions of open space for outdoor activities among low-income elderly people individuals based on age.
Table 10.
Analysis of differences in age groups.
3.3.2. Gender Difference Analysis
Table 11 shows that based on the one-way analysis of variance, there is no significant difference (p > 0.05) in the scores of low-income elderly men and women on the five dimensions of open space for outdoor activities in the city center, including accessibility, convenience, interest or variety, safety, and comfort.
Table 11.
Gender difference analysis.
3.3.3. Analysis of Intergroup Differences in Marital Status
Table 12 shows that there is no significant difference (p > 0.05) in the marital status (married, single, or other) of low-income elderly people on the five dimensions of open space for outdoor activities in the city center, including accessibility, convenience, interest or variety, safety, and comfort.
Table 12.
Analysis of Intergroup Differences in Marital Status.
3.3.4. Analysis of Differences Between Housing Ownership Groups
Table 13 shows that there is no significant difference (p > 0.05) in the housing ownership status (owned, rented, or other) of low-income elderly people in the open space for outdoor activities in the city center, including accessibility, convenience, safety and comfort. However, there are significant differences in the dimensions of interest or variety (p = 0.025 < 0.05).
Table 13.
Analysis of Intergroup Differences in Housing Ownership Status.
3.3.5. Analysis of Differences in Educational Attainment
Table 14 shows that there is no significant difference (p > 0.05) in the educational attainment (high school graduate or below, high school graduate, vocational college, or university graduate) of low-income elderly people in the open space for outdoor activities in the city center, including accessibility, safety and comfort. However, there are significant differences in the two dimensions of convenience (p = 0.029 < 0.05) and interest or variety (p = 0.017 < 0.05).
Table 14.
Analysis of Differences in Educational Attainment.
3.3.6. Analysis of Occupational Differences
Table 15 shows that through one-way analysis of variance, there are differences in the evaluation of the five dimensions of open space for outdoor activities among low-income elderly people, company employees, managers, service industry workers, business owners, and other occupational groups, and the differences between the scores of each dimension are not significant (p > 0.05).
Table 15.
Analysis of differences in occupation before retirement.
3.3.7. Analysis of Monthly Income Difference
Table 16 shows that there is no significant difference (p > 0.05) in the monthly income (under 1 million KRW, 1 million–2 million KRW, 3 million–4 million KRW, 4 million–5 million KRW, 5 million or more) of low-income elderly people in the open space for outdoor activities in the city center, including accessibility, convenience, interest or variety and comfort. However, there are significant differences in the dimensions of safety (p = 0.006 < 0.05).
Table 16.
Analysis of Monthly Income Difference. (Income is in Korean Won).
The analysis of characteristics such as gender, age group, marital status, suggests that these factors do not influence the availability of open space for outdoor activities in the city center, and there is no direct or inevitable connection between them.
3.4. Model Training Result
This study divided questionnaire features into six comparable feature sets based on information hierarchy and usage scenarios to further interpret model training results and explore the role of various inputs in predicting overall satisfaction (OS, ordinal). As shown in Table 17 (For a complete list of specific variables included in each set, please refer to Table A2 in the Appendix C), Group A consists solely of the respondent’s user profile variables, which tests the independent explanatory power of demographic information on overall satisfaction (OS) and establishes its value as a lower bound baseline, indicating how well the model can perform without contextual information. Group B uses aggregated scores across five dimensions as input to assess the main effects of macro-perception dimensions on OS, facilitating hierarchical comparison with detailed items. Group C builds on Group B by adding user profiles to estimate the marginal contribution of user profiles to discriminative performance after the inclusion of macro-level dimensions, while also examining whether there is an increase in variance and overfitting risk caused by high-cardinality weak signals. Group D uses all 36 detailed items to directly measure the explanatory power of micro-experience cues on OS and provide a practical entry point for subsequent rule extraction. Group E superimposes user profiles on top of Group D to examine whether the profiles still provide valuable insights or are largely redundant when the subdivisions already cover key information. Group F integrates subdivisions, the five dimensions, and the profiles as a comparison of the upper limit of complexity, helping to determine whether simple, information-dense inputs are superior to stacking all variables.
Table 17.
Feature sets and analytical intent for decision tree modeling.
The main source of information driving the prediction of overall satisfaction comes from the comparison results of the feature sets of the six groups (Table 18), specifically the segmented items: (1) From the best test values, Group D reached 0.855 in Acc, F1 macro, and BalancedAcc, which is the best decision tree model. Its QWK is 0.936, and Acc@±1 is 0.962, indicating that not only is the overall accuracy the highest, but the errors are mostly small misalignments of adjacent levels. (2) In comparison, Group B’s Acc is 0.722, which is 0.133 lower than Group D, and its QWK is 0.895, which is also 0.041 lower, indicating that merging the segmented experiences into five major categories will significantly lose separable information. However, Group B’s Acc@±1 has reached 0.957, indicating that its errors are mainly concentrated in adjacent levels, and the macro dimension still has a stable directional signal. (3) Group A has the lowest scores in all indicators, with Acc and BalancedAcc being only 0.406, F1 macro being 0.404, QWK being only 0.411, and Acc@±1 being 0.705. This group can be considered the lower bound baseline of demographic information, meaning that it is difficult to characterize the level of environmental satisfaction based solely on population structure.
Table 18.
Summary of test scores for different groups.
It is worth mentioning that adding user profile variables did not bring significant gains but weakened the generalization performance of the model. (1) After superimposing user profiles on the macro category to form group C, Acc dropped from 0.722 to 0.620, F1 macro dropped simultaneously to 0.621, QWK dropped from 0.895 to 0.826, and Acc@±1 dropped from 0.957 to 0.915. This shows that adding demographic variables when the macro dimension is already used as input does not bring effective gains but instead introduces noise and splitting bias, weakening the generalization performance. (2) When the baseline is group D of the subdivided items, superimposing the profiles to obtain group E, the strictly judged Acc and F1 macro dropped slightly to 0.850, and the balanced Acc was 0.851, but QWK increased slightly from 0.936 to 0.939, and Acc@±1 increased from 0.962 to 0.974. Comparison of this set of features shows that, given that the segmented items already cover the primary information, user profile variables have a neutral or negative impact on strict hits, and overall, their marginal impact is minimal. Quantitative results suggest that user profile data alone is insufficient to explain satisfaction and that demographic structure alone is weakly predictive.
The fully integrated Group F further demonstrates that simply stacking all variables does not guarantee better generalization. Compared to the best-performing Group D, Group F’s Acc dropped to 0.774, its F1 macro dropped to 0.771, its BalancedAcc remained at 0.774, and its QWK dropped to 0.926. However, its Acc@±1 rose to 0.974, on par with Group E, demonstrating more conservative predictions and fewer long-range misalignments within a tolerance of one level of error. This phenomenon typically arises from the increased complexity and inclusion of weak signals after feature stacking, which reduces the model’s ability to accurately predict hits while maintaining a high level on the ordered distance metric, showing a tendency to converge toward intermediate levels. Another noteworthy detail is that the BalancedAcc and Acc values across all groups are essentially consistent, indicating that recall across all levels of the test set is relatively balanced after stratification, without any unilateral bias caused by class imbalance. This situation also makes the macro-level conclusions more robust.
As shown in Figure 5, the confusion matrix of the six groups was tested: the rows are the actual grades, and the columns are the predicted grades. The higher the main diagonal, the better the hit. It can be observed that: (1) Group D has the fullest diagonal and very little long-range misalignment, which is the best in the field; (2) Group B has strong directionality, with high hits at the endpoint grades but still confusion in the middle grades; (3) Group F shrinks towards the median, with strict hits decreasing while the ordered metrics remain high; (4) Group A has a generally low diagonal and spreads to grades 3–4, indicating insufficient information and center drift.
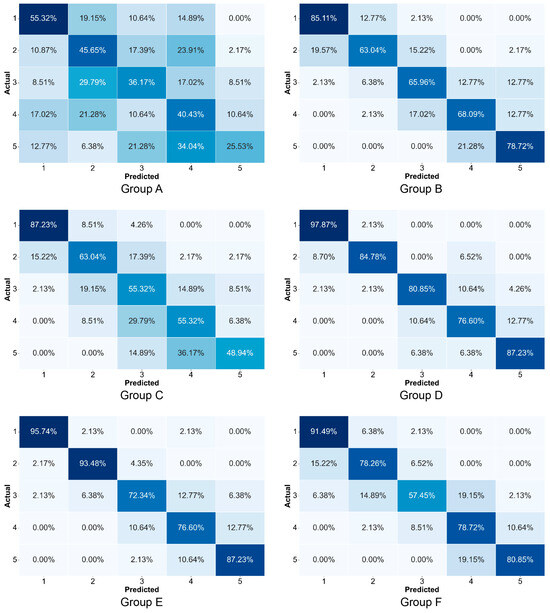
Figure 5.
Confusion matrix test of different groups. (Image source: drawn by the author).
The confusion matrix test shows that: (1) Group A is difficult to distinguish satisfaction levels based on demographic information alone; (2) Group B can effectively distinguish high and low satisfaction levels, with errors mainly due to adjacent files; (3) Group C degrades overall after adding portraits to Group B, reflecting the risk of increased noise and variance; (4) Group D has the most sufficient information on subdivided items, with strict indicators and ordered indicators leading simultaneously, making it the most suitable model; (5) Group E and Group D are similar in form, with a slight decrease in strict hits but a slight increase in QWK and Acc@±1, which is a mild smoothing of boundary samples; (6) Group F stacks all variables, resulting in increased complexity and more centering judgments, and a lower strict hit than Group D. In summary, the results support the use of Group D as the main model, with Group B and Group F as the level and complexity comparison, and Group E and Group C as negative comparisons.
As shown in Figure 6, the learning curve uses the F1 macro as the vertical axis and the training sample size as the horizontal axis to show how the fitting and generalization of the six groups of models change with the sample size: (1) Group A has a low overall ceiling, and both the training and cross-validation curves rise slowly at a low level, showing high bias. Increasing the sample pairs will only improve performance. (2) The cross-validation curve of Group B rises steadily to about 0.71 as the sample size increases, and the gap between training and validation narrows, indicating that the macro dimension provides a clear signal but still has moderate variance. (3) On this basis, Group C, which adds user portraits, has a low training curve and a lower validation curve than Group B. The gap widens, showing an increase in variance and slight degradation caused by noise. (4) The training curve of Group D quickly reaches about 0.9, and the cross-validation curve rises monotonically and stabilizes at a high level of about 0.84, with the smallest gap, indicating that the subdivided items have the best separability and the strongest generalization. (5) In Group E and Group D the morphology is similar, and the validation curve is slightly lower but remains stable, reflecting the mild smoothing of the image for border samples rather than substantial gains. (6) The validation curve of group F is between groups B and D, stabilizing at about 0.80, indicating that feature stacking increases complexity but does not bring corresponding generalization benefits. In general, as the number of samples exceeds about 300, all groups except Group A enter the region of diminishing returns. The optimal solution is to focus on Group D and combine it with moderate regularization and pruning (cost-complexity pruning). For groups C and F, it is necessary to focus on preventing and controlling the variance and overfitting risks caused by high-dimensional weak signals.
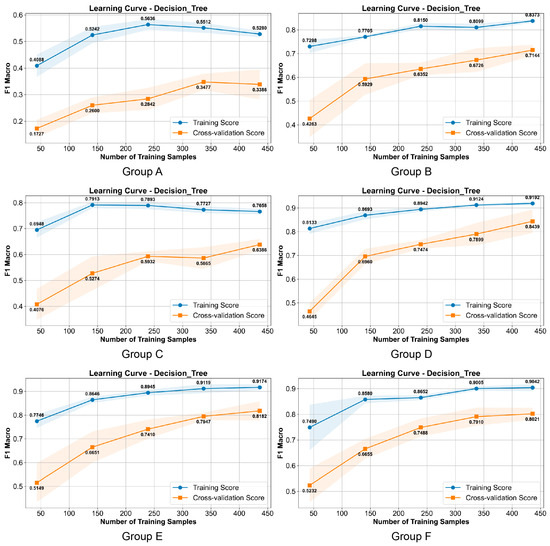
Figure 6.
Learning curves of different groups. (Image source: drawn by the author).
The learning curve with the accuracy within one (Acc@±1) as the vertical axis shows that each group quickly reaches a high level and converges after the number of samples increases, indicating that most of the errors in the model are adjacent-level misalignments (Figure 7). (1) Group A performed the worst, with the validation curve hovering in the range of about 0.60–0.70 for a long time and a significant gap with the training curve, reflecting that demographic information is difficult to support the stable improvement of orderly judgment. (2) Group B’s validation curve has crossed 0.90 and stabilized at about 0.93–0.95 when there are about 150–200 samples. (3) Group C is slightly lower than Group B, indicating that the superposition of portraits does not bring obvious benefits of tolerating one level of caliber. (4) Groups D and E are the most robust, with training and validation almost matching, converging to 0.96–0.97, and E slightly rising relative to Group D, confirming that the portrait mainly plays a role in smoothing boundary samples when the subdivision items are sufficient. (5) Group F can also reach 0.96–0.97, but the training curve is closer to the ceiling, and the validation curve rises more slowly, suggesting that feature stacking increases complexity but does not bring about a generalization advantage over Group D. Overall, after the sample size exceeds about 300, each group enters the region of diminishing returns. The high convergence of Acc@±1 is consistent with the aforementioned confusion matrix, emphasizing that the focus should be on subdividing items and controlling complexity through moderate regularization and pruning (cost-complexity pruning), rather than simply expanding the feature set.
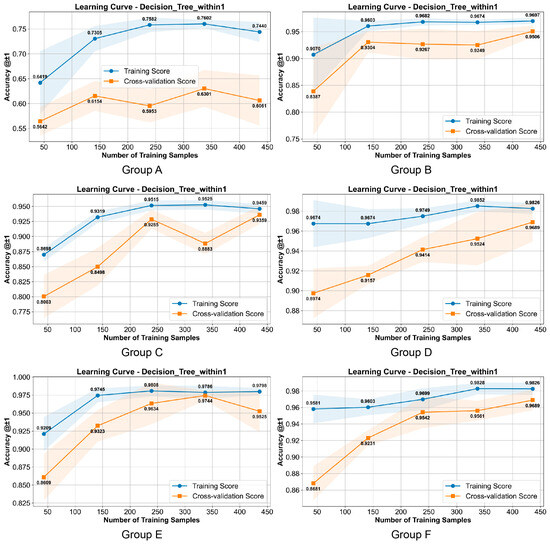
Figure 7.
Acc@±1 of different groups. (Image source: drawn by the author).
The learning curve with quadratic weighted kappa (QWK) as the vertical axis shows (Figure 8): (1) Group D converges steadily to the highest range at the cross-validation end, close to 0.95, with the smallest gap between training and validation, indicating that under the metric that penalizes more distant misalignments, fine-grained features are most effective in reducing cross-grade errors. (2) Group E, which superimposes user portraits on this basis, is slightly lower than Group D but is also smooth and stable, with a validation end of approximately 0.92–0.93, indicating that the boundary samples are gently corrected but the overall benefit is limited. (3) The validation curve of Group B quickly increases from approximately 0.86 and converges to around 0.88–0.90. The result shows that the macro dimension can significantly reduce long-range misalignment, but the boundaries are still not sharp enough. (4) After superimposing the user portraits, Group C and Group F finally stay at around 0.85, and the gap between training and verification is larger, suggesting that the addition of weak signals and complexity has led to an increase in variance rather than an improvement in consistency. (5) Only the verification end of User Portrait Group A is always at a low level, far lower than that of other groups, making it difficult to provide effective orderly consistency.
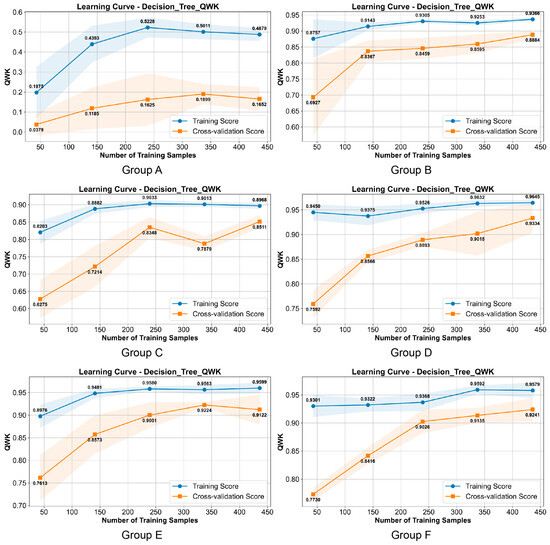
Figure 8.
QWK of different groups. (Image source: drawn by the author).
The six curves with the cost-complexity pruning path (ccp_alpha) as the horizontal axis and the cross-validation score as the vertical axis show (Figure 9): (1) The optimal ccp_alpha all fall within a small range close to zero, showing that the scores first rise slightly or remain flat after mild pruning, then decline monotonically as the regularization strength increases and quickly enter the underfitting range. The confidence bands are significantly widened in the large alpha region, indicating that the model variance and uncertainty have increased significantly. (2) Groups D and E have the highest and most stable platform near small alpha, and the flat top area near the optimal point is narrow, indicating that fine-grained features have already provided adequate structure and what is needed is a mild and precise regularization. (3) Group B has a moderate performance level and a mild downward slope, which is consistent with the characteristic of the blunt boundary of macro features. (4) Groups C and F enter the attenuation zone earlier, indicating that weak signals and increased complexity will amplify pruning sensitivity. (5) Group A has a lower overall score but also benefits from mild pruning. In general, heavy pruning is not recommended for all groups. The optimal strategy is to make fine adjustments within a small range of alpha to maintain a balance between structural simplicity and discriminative power.
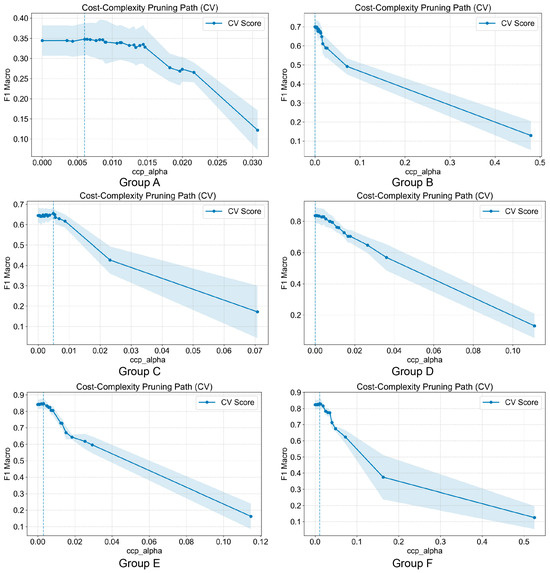
Figure 9.
Cost-complexity pruning path for different groups. (Image source: drawn by the author).
In summary, based on metrics such as Acc, F1 macro, BalancedAcc, QWK, and Acc@±1, as well as evidence from confusion matrices, learning curves, and ccp_alpha curves, Group D achieved the best results in both strict hit and ordered consistency (Acc ≈ 0.855, QWK ≈ 0.936, and Acc@±1 ≈ 0.962). The training-validation gap was minimal, and the optimal pruning occurred within a small range, indicating a clear discrimination boundary and stable generalization. To emphasize the principal findings, this study performed additional analysis on Group D, showcasing the pruned tree diagrams and decision paths. The decision tree diagrams for the remaining feature combinations have been moved to Appendix B for reference, and the paths and diagrams are not expanded.
4. Discussion
4.1. Decision Tree Analysis
To directly address the spatial management goals of elderly frequenters at Tapgol Park, this section will focus on the actual splitting order of the decision tree for Group D, as well as the sample proportions and category distributions at each node. Figure 10 shows the core information of the first three layers of the decision tree results. The detailed results are shown in Figure A1 in Appendix B. The first splitting variable of the tree is quietness (no noise), with a threshold of 2.4. This attribute splits the sample into two almost even branches: the upper branch, representing 49.8% of the sample with low quietness, has a node distribution dominated by category 1 (overall satisfaction score of 1). The lower branch, representing 50.2% of the sample with relative quietness, has a node distribution dominated by category 4–5 (overall satisfaction score of 4–5). This step directly widens the gap in the baseline satisfaction conditions: quietness determines whether the sample will be subsequently managed to mitigate low satisfaction or to optimize towards high satisfaction.
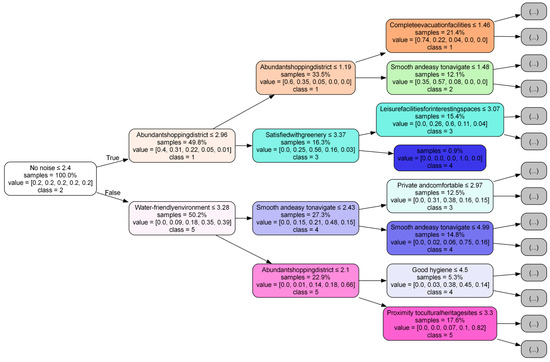
Figure 10.
The core information of the first three layers of the decision tree results. (Image source: drawn by the author).
The second layer of the lower branch of the decision tree is dominated by water-friendly environments (threshold of 3.28). It is then further subdivided into conditions such as smooth and easy to navigate, abundant shopping district, satisfied with sunlight, open all day, no odor, and satisfactory hygiene, forming two stable channels mainly at levels 4 and 5.
The second layer of the upper branch of the decision tree is dominated by shopping resource richness (threshold of 2.96) and satisfaction with greenery and quickly falls to baseline items such as complete evacuation facilities, convenient transportation, reasonable prices, and barrier-free access, forming a downward channel dominated by levels 1–2 and a small level 3 transition zone.
The low level of satisfaction is characterized by multiple bottom-line indicators failing to meet standards at the same time, and the extreme deficiency of any one of them will significantly lower the score. (1) In the upper branch of the decision tree, the nodes corresponding to extremely low shopping resource richness (threshold of 1.19) are mainly level 1 (33.5% of the samples, about 60% of the samples). (2) Under the same path, when the evacuation facilities are lower than 1.46, the proportion of level 1 rises to about 74% (21.4% of the samples). (3) When the convenient transportation is lower than 1.98, it is almost all level 1 (about 93% of the samples, 15.0% of the samples). (4) When the reasonable price is lower than 1.90, it is a pure level 1 node (12.8% of the samples). (5) When the barrier-free is lower than 1.60, it is also a pure level 1 node. (6) If some of the bottom lines are improved but still not comfortable, the model will give a level 2. For example, when the walking smoothness is lower than 1.48 or the anti-slip property is poor (non-slip road surface, threshold of 3.33), the proportion of level 2 rises to 57% and 79%. This chain shows that when noise is difficult to control and consumption and travel are inconvenient, an extremely low score for any single item is enough to bring the overall satisfaction level to the lowest level. Governance should prioritize rigid bottom lines such as price and accessibility, barrier-free and evacuation safety.
The transition zone to the middle tier is primarily defined by environmental perceptions, such as greenery, lighting, privacy, and comfort, reflecting a baseline level of usability but falling short of comfort. Typical milestones include nighttime lighting around 3.89, which is predominantly rated 3 (approximately 75% of samples, representing 10.3% of the sample); odor-free ratings below 2.5, which are almost exclusively rated 3 (5.3% of the sample); greenery satisfaction around 3.37, which is 56% (16.3% of the sample); and privacy and comfort around 2.97, which is 38% (12.5% of the sample). This statistic suggests that in noisy or crowded environments, even if prices and transportation options improve, if direct experiences such as olfaction and lighting remain subpar, the overall rating will struggle to reach the high-end level.
The two main pathways to high satisfaction are clear and complementary. One is the Level 4 pathway, emphasizing accessibility and basic comfort. Within the context of quietness, as long as walking comfort reaches a moderate-to-high level (thresholds of approximately 2.43 and 4.99, with Level 4 percentages of approximately 48% and 75%, respectively), sunlight is good (threshold of 4.38, corresponding to 85% of Level 4), and accessibility is convenient and 24/7 (threshold of 2.21, corresponding to 96% of Level 4), coupled with an absence of odor and high hygiene scores, it will steadily fall into the Level 4 range. The other is the Level 5 pathway, emphasizing vitality and affordability. Given its quietness, Level 5 nodes with a high abundance of shopping resources are predominantly Level 5 (66% of the sample, representing 22.9% of the sample). This percentage rises further to 82% (17.6% of the sample) near cultural heritage sites, while pure Level 5 nodes emerge when affordability is high (threshold of 4.06, representing 8.6% of the sample). A deeper divide could lead to the formation of pure Level 5 nodes again, with further refinements in shopping resources. The two channels together indicate that to elevate a space that already has a quiet background from comfortable to optimal, on the one hand, it is necessary to ensure that it is accessible and clean and odorless; on the other hand, the willingness to stay and consume should be enhanced through price-friendly and commercial cultural provision.
Based on the above structure, three representative and operational paths can be given to directly guide the governance sequence:
(1) Path 1, stop-loss type: When quietness does not meet the standard and transportation is inconvenient, prices are high, or accessibility and evacuation are insufficient, the model will almost certainly fall to level 1. The priority should be affordability and accessibility, then accessibility and anti-slip evacuation. The goal is to raise the level 1 sample to level 2–3 as soon as possible.
(2) Path 2, steady-state improvement type: Under the premise of relative quiet, through systematic improvement of smooth walking, all-day openness, and sanitation and odorlessness, it can stably enter level 4 channel. This path is suitable for rapid and effective facility maintenance and management.
(3) Path 3, transition type: After quietness and basic comfort have been met, the combination of reasonable prices and proximity to shopping resources and culture can be added to push the leaf node to level 5, which is suitable for price guidance and business optimization.
Overall, this study’s decision tree clearly demonstrates a hierarchical progression: quietness first, accessibility and cleanliness second, and finally price and vitality. This aligns with the high frequency of elderly use of Tapgol Park and the diverse surrounding facilities. Based on this, we recommend prioritizing the baseline within a limited budget, then ensuring stability at Level 4 through pedestrian-friendliness and cleanliness and finally raising the level to Level 5 through a combination of price and business formats, thereby expanding the coverage of high satisfaction.
4.2. Decision Path Analysis
Unlike whole-tree analysis, which focuses on earlier-split features and information-level organization, decision path analysis directly addresses the controllable conditions that result in a certain satisfaction level, thereby transforming statistical findings into a governance checklist. Paths with high p-values (p represents confidence level; all paths below are selected as 1.00) ensure high hit execution certainty, while high support values (support represents coverage; the top five decision paths with the highest coverage are selected below) ensure that the benefits of an action are not too limited. Together, these two factors constitute the trade-off between precision and coverage in policy design.
As shown in Table 19, three levels of usage scenarios are clearly defined: (1) The stop-loss zone with low satisfaction corresponds to high noise and mismatched baseline elements. (2) In a relatively quiet environment, the stable comfort zone formed by pedestrian-friendly and all-day openness corresponds to level 4. (3) In a quiet environment with a high satisfaction zone formed by the linkage of waterfront, commercial, and cultural resources, corresponding to level 5. The thresholds are all based on the 1–5 scale of the questionnaire, with lower values indicating more dissatisfaction and higher values indicating more satisfaction.
Table 19.
Top 5 decision paths.
Path 1, which leads to Level 1 overall satisfaction, represents a typical baseline gap: high noise (no noise ≤ 2.397) combined with insufficient commercial facilities, inadequate evacuation facilities, inconvenient transportation, and perceived unreasonable prices. When all five factors are simultaneously low, the sample inevitably falls into the lowest category, with the highest proportion (Support = 12.821%). This indicates that for the elderly, safe evacuation, accessibility, and affordability are rigid requirements. Any extremely low value will drag down the overall rating. Prioritizing price guidance and optimizing public transportation connections, while also addressing evacuation and pedestrian safety, is crucial. Path 4, corresponding to Level 2, is a secondary form of Path 1. While there are some shops, walking is difficult, the road surface is not slip-resistant, and there is odor, making it difficult to reach medium satisfaction. The key focus here is road improvements, cleaning and odor removal. Detailed improvements to accessibility and continuous walking can help elevate Level 2 to Level 3.
Path 5 defines the median zone for overall satisfaction level 3: While noise levels remain high, there’s a good supply of shops and adequate nighttime lighting, but insufficient greenery and leisure facilities, and the presence of odors ultimately leads to medium satisfaction. This graph reveals the tension between bustle and comfort: vitality can offset some of these negative factors, but a lack of greenery and accessible spaces, coupled with negative olfactory stimulation, suppresses overall satisfaction. Countermeasures include adding greenery, providing reliable seating areas, and reducing noise and odors, ultimately shifting this demographic toward level 4.
Path 3 provides a stable path to Level 4 overall satisfaction: In a relatively quiet environment, even if water accessibility is average, as long as walking is smooth to medium-to-high levels, sunlight exposure is not too low, and the space is open all day, it can steadily fall into Level 4. The key here is the walking experience and open access. This means that for elderly frequent users, a continuous, smooth, and all-day pedestrian system is key to raising the space to a comfortable level. To further improve from Level 4, prioritize strengthening the microenvironmental balance between water accessibility and sunlight and shade.
Path 2 defines a five-level high-satisfaction cluster: These samples consistently fall into the highest category (support rate 8.608%) due to the presence of tranquility, a favorable waterfront environment, a moderately diverse commercial landscape, proximity to cultural heritage, and attractive leisure spaces. The result is a complex upward trajectory, emphasizing the desire to stay and emotional identification driven by vitality and culture, built on a foundation of tranquility. Strategic measures should be implemented through the meticulous development of waterfront accessibility and stay nodes, the selection of affordable small shops and community-oriented businesses, and pedestrian corridors connecting cultural attractions to strengthen this channel.
Combining these five paths creates a tiered governance sequence. The first tier is the Stop-Loss Package, addressing the conditions of Paths 1 and 4 by prioritizing noise, evacuation, slip resistance, odor, and pedestrian continuity. Public transit and pedestrian connections also enhance accessibility and affordability. The second tier is the Back-Up Package, addressing the key variables of Paths 3 and 5 by systematically improving nighttime lighting, rest areas, and greenery, ensuring 24/7 accessibility and easy access. The third tier is the Transition Package, aligning with Path 2. This package creates a complex, immersive experience through waterfront nodes, cultural connections, and affordable, small-scale commercial facilities. This sequential approach will prioritize the exit of Levels 1 and 2, converge Level 3 toward Level 4, and transform Level 4 into Level 5 at key points, thereby maximizing overall satisfaction within a limited budget.
5. Conclusions
This study uses Tapgol Park in Jung-gu, Seoul, as a representative setting. This public space, frequently used by seniors, quantitatively identifies and refines pathways around residents’ overall environmental satisfaction. The core question is to identify the environmental factors and their sequence of combinations that best enhance overall satisfaction and based on this, propose governance priorities within a limited budget. The research methodology employs an interpretable decision tree model, combining data preprocessing, stratified sampling and cross-validation, synthetic minority oversampling (SMOTE), hyperparameter search, and cost-complexity pruning (ccp_alpha). Evaluation is performed using multiple metrics, including Acc, F1 macro, BalancedAcc, QWK, and Acc@±1. A tree diagram and rule-based pathways are outputs for an evidence-based presentation.
The main conclusions of this study are as follows:
(1) The key to improving the management and satisfaction of Tapgol Park in Jung-gu, Seoul, is the quietness of the site.
(2) When the park is not quiet, users are most sensitive to the bottom-line factors, such as commercial supply, evacuation safety, transportation accessibility, price perception, barrier-free, and anti-slips. Any deficiency in any of them will reduce the overall satisfaction of the park to the lowest level.
(3) When the park meets the quiet standard, basic comfort factors such as smooth walking, all-day openness, sunlight, and no odor constitute the minimum condition set for entering the comfort zone. To further leap from comfort to optimal, water experience, waterfront accessibility, proximity to cultural resources, and moderate business and community-oriented leisure facilities are key bonus points.
(4) Through the high-confidence and high-coverage decision paths, we can identify that: (a) the low-satisfaction stop-loss combination emphasizes noise reduction, evacuation and accessibility, and transportation accessibility and price-friendliness; (b) the medium-satisfaction steady-state combination emphasizes maintenance details such as continuous walking, all-day openness, lighting, and deodorization; (c) the high-satisfaction transition combination emphasizes the superposition of water-friendly nodes, cultural connectivity, and small-scale commercial facilities on a quiet and comfortable base.
The data collection for this study focused on the summer period from June to August, which has certain seasonal limitations. Summer weather is suitable for outdoor activities, and the frequency, duration, and functional needs (such as cooling off and leisure) of older adults using outdoor spaces differ significantly from those in spring, autumn, and winter. This investigation may overestimate the actual intensity of outdoor space use and demand priorities, and it is difficult to capture the spatial use characteristics related to seasonal activities (such as winter fitness and spring outings). In addition, this study also has the risk of self-report bias and temporal instability because the sample is derived from a single scenario, and the questionnaire is cross-sectional. In the future, we should conduct replication studies in multiple scenarios and multiple time periods, introduce control experiments or pilot interventions to verify the causal validity of the path, introduce multi-source integration of spatial and pedestrian flow data, and incorporate fairness and accessibility of vulnerable groups into the evaluation framework so that the research results can better serve the refined governance of elderly-friendly cities.
Author Contributions
Conceptualization, C.W., Y.C. and L.Z.; methodology, C.W., Y.C. and L.Z.; software, Y.C., J.L. and L.Z.; validation, Y.C., J.L. and L.Z.; formal analysis, C.W., Y.C. and L.Z.; investigation, C.W., F.Z., S.Y. and Y.W.; resources, C.W.; data curation, C.W.; writing—original draft preparation, C.W., Y.C. and L.Z.; writing—review and editing, C.W., Y.C., F.Z., L.Z., J.L., S.Y. and Y.W.; visualization, C.W., Y.C. and L.Z.; supervision, Y.C.; project administration, Y.C.; funding acquisition, Y.C. All authors have read and agreed to the published version of the manuscript.
Funding
This research was funded by the (1) Faculty Research Grants funded by Macau University of Science and Technology (FRG-MUST grant number: FRG-25-041-FA; FRG-25-067-FA); (2) Guangdong Provincial Department of Education’s key scientific research platforms and projects for general universities in 2023: Guangdong, Hong Kong, and Macau Cultural Heritage Protection and Innovation Design Team (grant number: 2023WCXTD042); (3) Guangdong Provincial Philosophy and Social Sciences Planning 2025 Lingnan Cultural Project (grant number: GD25LN30). The funders had no role in study conceptualization, data curation, formal analysis, methodology, software, decision to publish, or preparation of the manuscript. There was no additional external funding received for this study.
Institutional Review Board Statement
Chunhong Wu, Fenrong Zhang, Shuai Yang and Yinqi Wang participated in the research and questionnaire distribution. The Institutional Review Board (IRB) of Hangzhou City University reviewed and approved the studies involving human subjects. The approval number is 2025-0308. It was conducted in full compliance with the principles of the Helsinki Declaration. As the study did not involve human clinical trials, animal experiments, or any unethical practices, and all participants were aged 18 years or older, no ethical concerns arose during the research process. The participant’s legal guardian or next of kin has agreed to the written informed consent for this study prompted on the home page before filling out the questionnaire.
Informed Consent Statement
In this study, informed consent was obtained by clearly explaining the purpose, procedures, potential risks, and benefits of participation to all respondents. Participants were assured that their involvement was voluntary, and they could withdraw at any time without consequences. Confidentiality of the data was emphasized, and respondents were required to provide explicit agreement to participate before the study commenced.
Data Availability Statement
The original questionnaire involves personal privacy, and it is not convenient to disclose directly. The original questionnaire used and analyzed during the current study are available from Chunhong Wu (wuch0142@cau.ac.kr) upon reasonable request.
Acknowledgments
We would like to express our sincere gratitude to the students who helped distribute the questionnaires and the staff who assisted during the field survey.
Conflicts of Interest
The authors declare that they have no known competing financial interests or personal relationships that could have appeared to influence the work reported in this paper.
Appendix A. Questionnaire on the Elderly’s Satisfaction with the Tapgol Park Environment
Please note that the information provided below is translated from the original questionnaire, which was written in Korean.
Part I: Informed Consent
This survey will serve as a baseline for understanding satisfaction with the park environment. This survey is targeted at seniors. We would appreciate it if you could take approximately 15 min to honestly and proactively share your thoughts on the park and surrounding facilities. If you agree to participate in the study, please complete the following questionnaire. Please note that you may withdraw at any time. All information related to this survey will be kept anonymous and will not be used for any purpose other than academic research.
(1) Agree with the survey [Single Choice]
□ Agree
□ Disagree (Terminate survey)
(2) Have you visited Tapgol Park? [Single Choice]
□ Yes
□ No (Terminate survey)
Thank you for your participation!
Table A1.
Questionnaire on the elderly’s satisfaction with the Tapgol Park environment. (All questions are required and must be filled in).
Part II: Demographic characteristics
(1) What is your gender? [Single Choice]
□ Male
□ Female
(2) What is your marital status? [Single Choice]
□ Single
□ Married
□ Other
(3) What is the current home you live in? [Single Choice]
□ Owned (including your own, children’s, or other family members’ names)
□ Rented
□ Other
(4) What is your highest level of education? [Single Choice]
□ High school graduate or below (or equivalent)
□ High school graduate (or equivalent)
□ Vocational college (or equivalent)
□ University graduate (or equivalent)
(5) What was your occupation before retirement? [Single Choice]
□ Company employees
□ Managers
□ Service industry workers
□ Business owners
□ Other
(6) What is your age? [Single Choice]
□ 65–70
□ 71–80
□ 80 or older
(7) What is your average monthly income? [Single Choice]
□ Under 1 million KRW
□ 1 million–2 million KRW
□ 3 million–4 million KRW
□ 4 million–5 million KRW
□ 5 million or more
Appendix B. Decision Tree Paths Analysis Before Pruning
Figure A1 shows the optimal decision tree in this study.

Figure A1.
The optimal decision tree in this study. (Image source: drawn by the author).

Figure A2, Figure A3, Figure A4, Figure A5, Figure A6 and Figure A7 below shows the decision tree path analysis diagram before pruning.

Figure A2.
Group A Decision Tree. (Image source: drawn by the author).


Figure A3.
Group B Decision Tree. (Image source: drawn by the author).


Figure A4.
Group C Decision Tree. (Image source: drawn by the author).


Figure A5.
Group D Decision Tree. (Image source: drawn by the author).


Figure A6.
Group E Decision Tree. (Image source: drawn by the author).


Figure A7.
Group F Decision Tree. (Image source: drawn by the author).

Appendix C. Detailed Composition of Variable Sets Used in the Analysis
Table A2.
Detailed Composition of Variable Sets used in the Analysis.
References
- Yung, E.H.K.; Conejos, S.; Chan, E.H.W. Social needs of the elderly and active aging in public open spaces in urban renewal. Cities 2016, 52, 114–122. [Google Scholar] [CrossRef]
- Douglas, O.; Lennon, M.; Scott, M. Green space benefits for health and well-being: A life-course approach for urban planning, design and management. Cities 2017, 66, 53–62. [Google Scholar] [CrossRef]
- Ajayi, A.O.; Amole, O.O. Open spaces and wellbeing: The impact of outdoor environments in promoting health. Cities Health 2022, 6, 1106–1121. [Google Scholar] [CrossRef]
- Caronte-Veisz, A. Healthy Aging in Metropolitan Landscapes: Projects and Strategies to Promote the Quality of Life for Seniors. 2022. Available online: https://digital.casalini.it/9788822913005 (accessed on 25 September 2025).
- Korea Has the Highest Old-Age Poverty Rate in the OECD. Available online: https://www.oecd.org/en/publications/oecd-economic-surveys-korea-2020_2dde9480-en.html (accessed on 4 December 2025).
- South Korea Now Officially ‘Super-Aged’ Society. Available online: https://www.koreaherald.com/article/10022641 (accessed on 25 September 2025).
- Seoul Metropolitan Government: Statistics on the Status of Senior Citizens in Seoul. Available online: https://data.seoul.go.kr/dataList/10730/S/2/datasetView.do (accessed on 25 September 2025). (In Korean).
- Statistics Korea: Elderly Poverty Rate. Available online: https://www.index.go.kr/unify/idx-info.do?idxCd=5057 (accessed on 25 September 2025). (In Korean).
- Kang, J.; Park, J.; Cho, J. Inclusive Aging in Korea: Eradicating Senior Poverty. Int. J. Environ. Res. Public Health 2022, 19, 2121. [Google Scholar] [CrossRef]
- Wang, S.; Yung, E.H.K.; Sun, Y. Effects of open space accessibility and quality on older adults’ visit: Planning towards equal right to the city. Cities 2022, 125, 103611. [Google Scholar] [CrossRef]
- Park, G.R.; Seo, B.K. Housing cost burden and material hardship among older adults: How do they influence psychological health? Int. J. Geriatr. Psychiatry 2022, 37, 1–9. [Google Scholar] [CrossRef]
- Kim, Y.B.; Lee, S.H. Gender Differences in Correlates of Loneliness among Community-Dwelling Older Koreans. Int. J. Environ. Res. Public Health 2022, 19, 7334. [Google Scholar] [CrossRef] [PubMed]
- Hwang, H.A.; Jeong, H.; Yim, H.W. Health-related quality of life of Korean older adults according to age, sex, and living arrangements: A cross-sectional study. Front. Public Health 2023, 11, 1281457. [Google Scholar] [CrossRef] [PubMed]
- Seoul Welfare Foundation’s Age-Friendly Seoul City 2.0 Report. 2025. Available online: https://welfare.seoul.kr/web/contents/archive1-1.do?&schM=view&page=1&viewCount=9&id=26095&schBdcode=&schGroupCode (accessed on 4 December 2025).
- Jung, Y.J.; Chae, S.D. Analysis of usage behavior and preference in senior-friendly parks for the aging society. J. People Plants Environ. 2019, 22, 665–676. [Google Scholar] [CrossRef]
- Han, S.M. Heritage conservation as urban regeneration policy in globalizing cities: Social exclusion and gentrification at the vicinity of the Jongmyo World Heritage site in Seoul, Korea. In Proceedings of the ICOMOS Scientific Symposium, Dublin, Ireland, 30 October 2010; p. 56. Available online: https://publ.icomos.org/publicomos/jlbSai?html=Bur&base=technica&ref=43605&file=2254.pdf&path=ICOMOS_Scientific_Symposium_DUBLIN_2010.pdf (accessed on 27 December 2025).
- Seoul Creates Elderly Friendly Street Around Tapgol Park. Available online: https://english.seoul.go.kr/seoul-creates-elderly-friendly-street-around-tapgol-park (accessed on 4 December 2025).
- Tapgol Park ‘Sacred Domain’ Plan Proposal. Available online: https://archives.seoul.go.kr/item/1075943 (accessed on 12 December 2025).
- Han, S.-M. A Study on the Place Identity of Tapgol Park—Focused on the Phenomena after Sacralization Project. J. Korean Inst. Landsc. Archit. 2016, 44, 25–36. [Google Scholar] [CrossRef]
- Tapgol Park Becomes an Alcohol-Free Zone. Available online: https://app.jongno.go.kr/main/news/BBSMSTR_000000000271/257412 (accessed on 12 December 2025).
- Debates on Social Equity in Low-Income Older Adults’ Use of Public Open Spaces. Available online: https://www.news1.kr/society/incident-accident/6003258 (accessed on 12 December 2025).
- Choung, E.-h. Space for the Elderly from the Perspective of Social Exclusion—Focusing on Tapgol Park and Rakhui Street in Jongno-gu. J. Photo Geogr. 2021, 31, 21–37. [Google Scholar] [CrossRef]
- Kim, J.A.; Choi, S.M. An interpretative phenomenological analysis study on the experiences of the elderly living through the Corona Pandemic Crisis-Focused on the elderly male using Tapgol Park. Korean J. Couns. Case Stud. Pract. 2021, 6, 19–45. (In Korean) [Google Scholar] [CrossRef]
- Tapgol Park Sees Many Elderly People Collect Free Food Every Day. Available online: https://v.daum.net/v/20231204144342359 (accessed on 12 December 2025).
- Many Low-Income Seniors Gather at Tapgol Park Daily. Available online: https://www.donga.com/news/Opinion/article/all/20250831/132291151/2 (accessed on 12 December 2025).
- Bonaccorsi, G.; Manzi, F.; Del Riccio, M.; Setola, N.; Naldi, E.; Milani, C.; Giorgetti, D.; Dellisanti, C.; Lorini, C. Impact of the Built Environment and the Neighborhood in Promoting the Physical Activity and the Healthy Aging in Older People: An Umbrella Review. Int. J. Environ. Res. Public Health 2020, 17, 6127. [Google Scholar] [CrossRef] [PubMed]
- Mouratidis, K. Urban planning and quality of life: A review of pathways linking the built environment to subjective well-being. Cities 2021, 115, 103229. [Google Scholar] [CrossRef]
- Fu, G.; Gai, Y.; Xiang, L.; Lin, L. Quantifying Older Adults’ Spatial Perceptions of Outdoor Activity Areas for Embedded Retirement Facilities. Buildings 2025, 15, 271. [Google Scholar] [CrossRef]
- Liu, F.; Zhou, H.; Xie, J.; Tang, Y.; Liu, S. Impact of Public Space in Primary and Secondary Schools Based on Natural Visibility Ratio. Buildings 2025, 15, 1472. [Google Scholar] [CrossRef]
- Dennis, M.; Cook, P.A.; James, P.; Wheater, C.P.; Lindley, S.J. Relationships between health outcomes in older populations and urban green infrastructure size, quality and proximity. BMC Public Health 2020, 20, 626. [Google Scholar] [CrossRef]
- Enssle, F.; Kabisch, N. Urban green spaces for the social interaction, health and well-being of older people—An integrated view of urban ecosystem services and socio-environmental justice. Environ. Sci. Policy 2020, 109, 36–44. [Google Scholar] [CrossRef]
- Xian, Z.; Nakaya, T.; Liu, K.; Zhao, B.; Zhang, J.; Zhang, J.; Lin, Y. The effects of neighbourhood green spaces on mental health of disadvantaged groups: A systematic review. Humanit. Soc. Sci. Commun. 2024, 11, 488. [Google Scholar] [CrossRef]
- Xiao, J.X.; Liao, J.; Zhao, B.; Long, Y.; Xu, X.; Liang, X.; Xia, T. The influence of community park characteristics on satisfaction in Guangzhou: Moderating and mediating effects analysis. Heliyon 2024, 10, e31043. [Google Scholar] [CrossRef]
- Lak, A.; Khodakarim, S.; Myint, P.K.; Baradaran, H.R. The influencing factors of elder-friendly public open spaces promoting older adults’ health in deprived urban neighborhoods: Partial Least Square Structural Equation Modeling approach. Front. Public Health 2023, 11, 1143289. [Google Scholar] [CrossRef]
- Wen, F.; Peng, L.; Zhang, B.; Zhang, Y.; Zhang, Y. Satisfaction with Nighttime Outdoor Activity Environment Among Elderly Residents in Old Gated Communities. Buildings 2025, 15, 277. [Google Scholar] [CrossRef]
- Jacobs, N.; Deforche, B.; Van Puyvelde, A.; Van Dyck, D.; Mertens, L.; Veitch, J.; Van Cauwenberg, J. Exploring emotions in relation to neighborhood environmental characteristics among older adults with low socioeconomic position: A qualitative study using walk-along interviews. Cities 2024, 149, 104950. [Google Scholar] [CrossRef]
- Luo, J.; Ghim, G. A Study on the Elderly Friendly Design of Community Public Space for Aging in Place—Centered on around elderly people living in the central area of Shanghai. J. Korea Intitute Spat. Des. 2023, 18, 385–398. (In Korean) [Google Scholar] [CrossRef]
- Zhang, C.; Loukaitou-Sideris, A. Chinese American older adults in urban and suburban public spaces: A comparative examination of two Los Angeles settings. J. Urban Des. 2025, 30, 203–222. [Google Scholar] [CrossRef]
- Yang, J.; Shang, Y.; Cao, F.; Ying, H.; Luo, Y. Identify the direct and indirect impacts of the community built environment on the health of older adults. Front. Public Health 2025, 13, 1478337. [Google Scholar] [CrossRef] [PubMed]
- Almahmood, M.A.M.; Scharnhorst, E.; Carstensen, T.A.; Jørgensen, G.; Schulze, O. Mapping the gendered city: Investigating the socio-cultural influence on the practice of walking and the meaning of walkscapes among young Saudi adults in Riyadh. J. Urban Des. 2017, 22, 229–248. [Google Scholar] [CrossRef]
- Starkweather, S. Gender, perceptions of safety and strategic responses among Ohio University students. Gend. Place Cult. 2007, 14, 355–370. [Google Scholar] [CrossRef]
- Li, J.; Tian, L.; Ouyang, W. Exploring the relationship between neighborhood-built environment and elderly health: A research based on heterogeneity of age and gender groups in Beijing. Front. Public Health 2022, 10, 882361. [Google Scholar] [CrossRef]
- Navarrete-Hernandez, P.; Vetro, A.; Concha, P. Building safer public spaces: Exploring gender difference in the perception of safety in public space through urban design interventions. Landsc. Urban Plan. 2021, 214, 104180. [Google Scholar] [CrossRef]
- Loukaitou-Sideris, A.; Levy-Storms, L.; Chen, L.; Brozen, M. Parks for an aging population: Needs and preferences of low-income seniors in Los Angeles. J. Am. Plan. Assoc. 2016, 82, 236–251. [Google Scholar] [CrossRef]
- Zhang, Y.; Chen, G.; He, Y.; Jiang, X.; Xue, C. Social Interaction in Public Spaces and Well-Being among Elderly Women: Towards Age-Friendly Urban Environments. Int. J. Environ. Res. Public Health 2022, 19, 746. [Google Scholar] [CrossRef]
- WHO. UN Decade of Healthy Ageing 2021–2030. 2021. Available online: https://unece.org/sites/default/files/2023-11/9_WHO_UN%20Decade%20of%20Healthy%20Ageing.pdf (accessed on 7 December 2025).
- Shen, X.; Yin, F.; Jiao, C. Predictive Models of Life Satisfaction in Older People: A Machine Learning Approach. Int. J. Environ. Res. Public Health 2023, 20, 2445. [Google Scholar] [CrossRef]
- Wang, L.; Sun, X.; Yan, J.; Xie, M.; Qin, H. Quantitative Assessment of Age-Friendly Design in Mountainous Urban Community Parks Based on Nonlinear Models: An Empirical Study in Chongqing, China. Land 2025, 14, 893. [Google Scholar] [CrossRef]
- Wang, L.; Han, X.; He, J.; Jung, T. Measuring residents’ perceptions of city streets to inform better street planning through deep learning and space syntax. ISPRS J. Photogramm. Remote Sens. 2022, 190, 215–230. [Google Scholar] [CrossRef]
- Wang, R.; Lu, Y.; Zhang, J.; Liu, P.; Yao, Y.; Liu, Y. The relationship between visual enclosure for neighbourhood street walkability and elders’ mental health in China: Using Street view images. J. Transp. Health 2019, 13, 90–102. [Google Scholar] [CrossRef]
- Zhao, H.; Feng, G.; Zhao, W.; Wang, Y.; Chen, F. Analyzing Urban Parks for Older Adults’ Accessibility in Summer Using Gradient Boosting Decision Trees: A Case Study from Tianjin, China. Land 2025, 14, 185. [Google Scholar] [CrossRef]
- Cheng, L.; De Vos, J.; Zhao, P.; Yang, M.; Witlox, F. Examining non-linear built environment effects on elderly’s walking: A random forest approach. Transp. Res. Part D Transp. Environ. 2020, 88, 102552. [Google Scholar] [CrossRef]
- Yang, S.; Chen, Y.; Huang, Y.; Zheng, L.; Huang, Y. Investigating the Satisfaction of Residents in the Historic Center of Macau and the Characteristics of the Townscape: A Decision Tree Approach to Machine Learning. Buildings 2024, 14, 2925. [Google Scholar] [CrossRef]
- The Protected Area of Tapgol Park. Available online: https://digital.khs.go.kr/heri/heriDetail.do?ctptNo=1331103540000&ctptUid=13898859677103300964 (accessed on 7 December 2025).
- The Land Area of Seoul. Available online: https://en.wikipedia.org/wiki/Seoul (accessed on 7 December 2025).
- The Land Area of Jongno-gu. Available online: https://www.jongno.go.kr/English.do?menuId=6101&menuNo=6101 (accessed on 7 December 2025).
- Yoon, Y. An Interpretation of the Context Regarding Older People’s Use of Outdoor Spaces: Focused on the Neighborhood Environment of Low-Income, Elderly Concentrated Residential Area. Ph.D. Thesis, Seoul National University Graduate School, Seoul, Republic of Korea, 2024. Available online: https://s-space.snu.ac.kr/handle/10371/215887 (accessed on 7 December 2025). (In Korean).
- Gehl, J. “Three Types of Outdoor Activities,” ”Life Between Buildings,” and “Outdoor Activities and the Quality of Outdoor Space”. In Life Between Buildings: Using Public Space, 6th ed.; The City Reader; Routledge: London, UK, 2011; pp. 593–602. [Google Scholar]
- UN-Habitat. SDG Indicator 11.7.1 Training Module: Public Space. United Nations Human Settlement Programme (UN-Habitat), Nairobi. 2018. Available online: https://data.unhabitat.org/documents/638d11fbfc464ca9a3289202076c128d (accessed on 27 December 2025).
- Gagliardi, C.; Spazzafumo, L.; Marcellini, F.; Mollenkopf, H.; Ruoppila, I.; Tacken, M.; Szemann, Z. The outdoor mobility and leisure activities of older people in five European countries. Ageing Soc. 2007, 27, 683–700. [Google Scholar] [CrossRef]
- Sugiyama, T.; Thompson, C.W. Outdoor environments, activity and the well-being of older people: Conceptualising environmental support. Environ. Plan. A 2007, 39, 1943–1960. [Google Scholar] [CrossRef]
- Ryu, J.; Heo, J. Relationships between leisure activity types and well-being in older adults. Leis. Stud. 2018, 37, 331–342. [Google Scholar] [CrossRef]
- Zhou, F.; Zhang, H.; Wang, H.Y.; Liu, L.F.; Zhang, X.G. Barriers and facilitators to older adult participation in intergenerational physical activity program: A systematic review. Aging Clin. Exp. Res. 2024, 36, 39. [Google Scholar] [CrossRef] [PubMed]
- Guo, N.; Xia, F.; Yu, S. Enhancing Elderly Well-Being: Exploring Interactions between Neighborhood-Built Environment and Outdoor Activities in Old Urban Area. Buildings 2024, 14, 2845. [Google Scholar] [CrossRef]
- Park, H.S.; Jung, Y.J.; Lee, K.H. Effects of neighborhood environment on elderly’s walking route and outdoor activities. J. Urban Des. Inst. Korea Urban Des. 2017, 18, 17–35. [Google Scholar] [CrossRef]
- Sugiyama, M.; Chau, H.W.; Abe, T.; Kato, Y.; Jamei, E.; Veeroja, P.; Mori, K.; Sugiyama, T. Third places for older adults’ social engagement: A scoping review and research agenda. Gerontologist 2023, 63, 1149–1161. [Google Scholar] [CrossRef] [PubMed]
- Schmidt, T.; Kerr, J.; Schipperijn, J. Associations between Neighborhood Open Space Features and Walking and Social Interaction in Older Adults—A Mixed Methods Study. Geriatrics 2019, 4, 41. [Google Scholar] [CrossRef]
- Paudel, C.; Timperio, A.; Loh, V.; Deforche, B.; Salmon, J.; Veitch, J. Understanding the relative importance of micro-level design characteristics of walking paths in parks to promote walking among older adults. Urban For. Urban Green. 2023, 89, 128129. [Google Scholar] [CrossRef]
- Sallis, J.F.; Cerin, E.; Conway, T.L.; Adams, M.A.; Frank, L.D.; Pratt, M.; Salvo, D.; Schipperijn, J.; Smith, G.; Cain, K.L.; et al. Physical activity in relation to urban environments in 14 cities worldwide: A cross-sectional study. Lancet 2016, 387, 2207–2217. [Google Scholar] [CrossRef]
- Macintyre, S.; Macdonald, L.; Ellaway, A. Do poorer people have poorer access to local resources and facilities? The distribution of local resources by area deprivation in Glasgow, Scotland. Soc. Sci. Med. 2008, 67, 900–914. [Google Scholar] [CrossRef]
- Kim, Y.S. Comparison of the decision tree, artificial neural network, and linear regression methods based on the number and types of independent variables and sample size. Expert Syst. Appl. 2008, 34, 1227–1234. [Google Scholar] [CrossRef]
- Widodo, S.; Brawijaya, H.; Samudi, S. Stratified K-fold cross validation optimization on machine learning for prediction. Sink. J. Dan Penelit. Tek. Inform. 2022, 6, 2407–2414. [Google Scholar] [CrossRef]
- Steinberg, D. CART: Classification and regression trees. In The Top Ten Algorithms in Data Mining; Chapman and Hall/CRC: Boca Raton, FL, USA, 2009; pp. 193–216. [Google Scholar]
- Kumar, B.; Tamkute, P.; Saurabh, K.; Mishra, A.; Kumar, S.; Talesara, A. A Machine Learning Framework for Breast Cancer Detection and Classification. In Robotics, Control and Computer Vision; Muthusamy, H., Botzheim, J., Nayak, R., Eds.; Lecture Notes in Electrical Engineering; Springer: Singapore, 2023; Volume 1009. [Google Scholar] [CrossRef]
- He, Y.; Xiao, L. Structured pruning for deep convolutional neural networks: A survey. IEEE Trans. Pattern Anal. Mach. Intell. 2023, 46, 2900–2919. [Google Scholar] [CrossRef] [PubMed]
- Bademci, V. Cronbach’s alpha is not a measure of unidimensionality or homogeneity. J. Comput. Educ. Res. 2014, 2, 19–27. [Google Scholar]
- Lubiano, M.A.; Montenegro, M.; Pérez-Fernández, S.; Gil, M.Á. Trends in Mathematical, Information and Data Sciences; Studies in Systems, Decision and Control; Balakrishnan, N., Gil, M.Á., Martín, N., Morales, D., Pardo, M.d.C., Eds.; Springer: Cham, Switzerland, 2022; Volume 445, pp. 377–388. [Google Scholar] [CrossRef]


Disclaimer/Publisher’s Note: The statements, opinions and data contained in all publications are solely those of the individual author(s) and contributor(s) and not of MDPI and/or the editor(s). MDPI and/or the editor(s) disclaim responsibility for any injury to people or property resulting from any ideas, methods, instructions or products referred to in the content. |
© 2025 by the authors. Licensee MDPI, Basel, Switzerland. This article is an open access article distributed under the terms and conditions of the Creative Commons Attribution (CC BY) license.